1
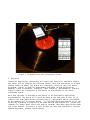
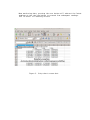
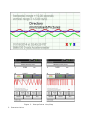
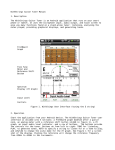
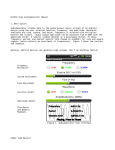
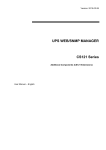
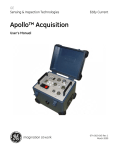
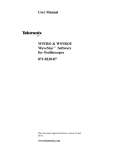
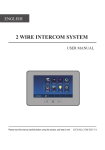
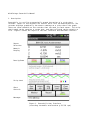
WithStrings SensorUtils Manual
1. Description
SensorUtils is a utility program built around the notion of a strip-chart
recorder. Inputs to the recorder are sensors built into the Android device. The
recorder displays graphically the sensor readings on a strip-chart like graph.
There are three channels on the recorder that can used for each sensor. The stripchart graph can be saved as a screen shot, and data collected can be saved to a
file. Figure 1 shows the layout of the user interface and available controls.
Sensor
Selection
Numeric
Display
Pens Up/Down
Strip-chart
Chart
Controls
Messages
Figure 1. SensorUtils User Interface
(recording turntable acceleration @ 33.333 rpm)
Figure 2. Turntable test with orientation Arrows
2. Operation
Launch the application. SensorUtils will query your device for available sensors.
One sensor will be shown on the selection button. Each time the button is clicked
another sensor is shown. The button will eventually return to the first sensor
displayed. Typical of physical measurements available include acceleration,
magnetic field, orientation, proximity, light intensity, and barometric pressure.
Figure 2 shows the orientation of the device in relationship to its sensor
coordinate system.
Note that the data is returned by the device to the SensorUtils application
asynchronously. The device will return the data at the rate that it sees fit in
order to let other applications perform properly. SensorUtils may be interrupted
by an incoming call or an user action -- if the SensorUtils application is off the
screen any recording in progress in be saved and the application will release any
requests for sensor data. Users also need to consider that other applications make
use of the sensors. The effect of this is that the rate that SensorUtils receives
updates decreases, perhaps significantly.
Please read the Android developer document “Sensors Overview” for more
information.
a.
Display Areas
(1)
Numeric Readout
This readout shows (zeroed) numeric sensor data. There are four rows in
the readout. The first three rows have columns axis, data, and unit for
each of the axes. The forth row shows the time between the current and
previous reading (delta time, dt).
(2)
Strip-chart
Data is displayed graphically in a two dimensional graph. Newest data
is written on the right side of the display and pushed to the left as
new data arrives.
Three virtual pens write on the graph in different colors. The
pen-lift button can deactivate writing on the chart for its assigned
channel. The width, magnification, interpolation, clear, and zero
buttons affect how data is displayed on the chart.
A screen-shot can be captured by pressing on the chart area when the
monitor button is deactivated. The screen-shot is saved to a jpeg file
in the /mnt/sdcard/Pictures directory. The format for the file name is
YYYY-MM-DD_HH_MM_SS.jpg. File size is less than 100KB. (Figure 4)
If the device is attached through a USB connection to a host computer,
the SD card will not be available for writing. Screen capture requires
that the SD card is writable.
b.
Buttons
(1)
Sensor Selection
Increments through available sensors that have been made available to
the Android operating system. This is manufacturer and model specific.
(2)
Pens
Pen up/down allows recording for the channel either to the stripchart or file. The pen can be lifted during recording. Sensors that
have only one output will only have one pen available.
(3)
Rate/Mask
Maximum available data rate allowable by the Android device, or masked
rate. Masked rate allows only one sample per period specified. Other
running applications may affect the data rate.
(4)
Width
Seconds of virtual paper on the chart. Data will fall off the chart
when the number of seconds specified by the width is reached. The width
does not affect data recored to a file.
(5)
Mag
The y axis on the graph is nominally set to the range queried from the
selected sensor, modified to a nice number (a multiple of 1,2 or 5).
The range can be magnified up to 100.
(6)
Interpolation Line/Step
The strip-chart will normally draw a straight line between points -although there is no data between points. Using step mode will keep
displaying the same value for a point until new data is captured. See
figure 5 for an example.
(7)
Clear
Clear chart. The cleared chart will not be seen unless monitoring is
active. Clearing the chart has no effect on data recording to a file.
(8)
Monitor
Pauses capturing of data to the chart and file. A new file is created
every time the system is paused and recording restarted.
(9)
Record
Data is recorded to a file on the SD card in the following directory:
/mnt/sdcard/Android/data/com.withstrings.sensorutils/files. Recording
stops when, monitoring is deactivated, a different sensor is selected,
or a phone event pushes SensorUtils to the background. A new file is
created when recording is restarted.
The data file has comma separated values (CSV). The file is named YYYYMM-DD_HH_MM_SS.csv (Figure 3). Data recording requires a writable SD
card. Data is removed when SensorUtils is uninstalled.
Up to four columns are recorded: dt (time between readings) ,X,Y, and Z
depending on the sensor and pen controls. The zero value is subtracted
from X, Y, and Z data.
Pens may be
not changed
case of the
values will
column.
(10)
Zero
lifted or lowered while recording, but column headings are
and values will fill columns starting at the left. In the
X pen lifted (recording X, Y, and Z initially), the Y
be under the X column and Z values will be under the Y
When monitoring data, pressing the zero button will subtract the latest
readings at the time the button is pressed from subsequent readings.
This is useful for removing offsets.
Figure 3. Strip-chart screen-shot
Figure 4. Screen-shot of screen-shot
Figure 5. Interpolation Line/Step
3. Characteristics
Operating System: Android: Minimum API 9, Gingerbread
Permissions: WRITE_EXTERNAL_STORAGE
Acquisition Rate: Dependent on device. SensorManager.SENSOR_DELAY_USER
Resolution: Sensor Dependent
Settings:
Sensor: Selects sensors available on device
Rate: Max Acquisition Rate, Mask (0.1 to 10 seconds – one shot per interval
Interpolation: Line or Step
File Format: CSV (the data is not interpolated)
Chart Horizontal Range: 1 to 600 seconds:
Chart Vertical Magnification: Sensor Range (X1) to X100
Zero: removes offset at time pressed (in Monitor mode)
Clear: clears chart in monitor mode.
Record: Writes data to a file (monitor mode). Columns are based on Pen
selection.
X Pen, Y Pen, Z Pen: provides pen up or pen down like functions.
Identity: sin(u)sin(v) = 1/2[sin(u-v) + sin(u+v)]
Graphics Design: N. Dynamite
© 2014 Todd Merport