1
A Web Based GIS Database System
by
Jing Wang
Master of Science, Chinese Academy of Sciences
A Project
Submitted to the Graduate Faculty
of the
University of North Dakota
in partial fulfillment of the requirements
for the degree of
Master of Science
Grand Forks, North Dakota
August 2005
i
ii
iii
TABLE OF CONTENTS
PERMISSION…………………………………………………………………………….iii
LIST OF FIGURES………………………………………………………………………. v
ACKNOWLEDGMENTS………………………………………………………………..vii
ABSTRACT……………………………………………………………………………..viii
CHAPTER
I
INTRODUCTION………………………………………………………………...1
II
REQUIREMENTS AND SPECIFICATIONS……………………………………6
III
HIGH LEVEL AND LOW LEVEL DESIGN…………………………………...13
IV
IMPLEMENTATION……………………………………………………………26
V
SOFTWARE VERIFICATION AND VALIDATION………………………….33
VI
CONCLUSIONS………………………………………………………………...43
REFERENCES………………………………………………………………………….. 44
APPENDIX A…………………………………………………………………………… 45
APPENDIX B…………………………………………………………………………… 52
iv
LIST OF FIGURES
1. Map Panel…………………………………………………………………………….. 8
2. Layer Panel…………………………………………………………………………… 9
3. Image List Panel……………………………………………………………………… 10
4. Reference Map Panel………………………………………………………………… 10
5. Control Panel…………………………………………………………………………. 11
6. Navigation Buttons…………………………………………………………………… 12
7. System Architecture…………………………………………………………………... 14
8. State Transition Diagram…………………………………………………………….. 15
9. DFD of User Registration…………………………………………………………….. 17
10. DFD of User Login………………………………………………………………….. 18
11. DFD of Band Combination Selection……………………………………………….. 19
12. DFD of Color scheme selection……………………………………………………... 19
13. DFD of Image selection……………………………………………………...……… 20
14. DFD of Layers selection…………………………………………………………….. 21
15. DFD of Product selection…………………………………………………………….21
16. DFD of View AOI…………………………………………………………………... 22
17. DFD of Create AOI…………………………………………………………………. 23
18. DFD of User Logout………………………………………………………………… 23
19. Digital-NGP Version 3.0.0 Homepage……………………………………………… 36
20. Digital-NGP Version 3.0.1 Homepage……………………………………………… 38
v
21. Digital-NGP Version 3.0.2………………………………………………………….. 40
22. Digital-NGP Version 3.0.3………………………………………………………….. 42
vi
ACKNOWLEDGMENTS
I would like to express sincere thanks to the many people who have contributed to the
completion of this study. Most of all I would like to thank Dr. Tom Wiggen for his
support and guidance through the duration of this work. Dr. Wiggen provided a
motivating, enthusiastic, and critical atmosphere during the many discussions we had. It
was a great pleasure to me to work with him and conduct this project under his
supervision. Many thanks to my supervisor, Dr. Xiaodong Zhang in UMAC, for the
encouragement, advice and assistance on this project. Special thanks go to my family, for
their constant love, understanding and many sacrifices, without which would have made
this work impossible.
vii
ABSTRACT
In this report, we describe the design and implementation of Digital-NGP Website, a
Web based GIS database system for UMAC clients to download Geospatial Data. This
system is a three-tier Web database application. Tier 1 is User Interface. Tier 2 is the
Functional Module. This level actually processes data. It consists of Apache web server,
Mapserver4.0, PHP programs and C++ programs. Tier 3 is the Database Management
System (DBMS).
viii
CHAPTER I
INTRODUCTION
Satellites and airborne cameras provided the ability to capture a massive amount of
digital imagery that is of value for agriculture. The Upper Midwest Aerospace
Consortium (UMAC), supports a repository for some of this imagery and is developing a
delivery system to make this data available to UMAC clients in the upper midwest. This
software engineering project analyzes the needs of users and designs and implements an
enhanced version of UMAC’s initial prototype delivery system.
1.1 BACKGROUND
The goal of the Upper Midwest Aerospace Consortium (UMAC) is to provide
information about the environment that enables people to make decisions improving their
•
Economic Competitiveness
•
Quality of Life
•
Educational Preparedness
The primary source of the information is data acquired by satellites and aircraft.
Beneficiaries of the information include:
•
Farmers practicing Precision Agriculture
•
Ranchers seeking Optimum Grazing Capacities
•
Foresters engaged in Sustainable Forestry
1
•
Educators teaching Responsible Stewardship
•
Students, K through lifelong learners, of Earth System Science
Here are some terms and explanations from UMAC homepage, http://www.umac.org:
1. Partnership: Every UMAC activity is in response to a need expressed by
individuals or organizations of stakeholders. The Consortium is distributed
geographically to bring information close to its end users. UMAC includes
partners in government, private industry, and non-governmental organizations as
well.
2. Precision Agriculture: using information technologies to bring data from multiple
sources to bear on crop and livestock production decisions.
3. Noxious Weed Eradication from Rangelands: The weed leafy spurge, scourge of
the West, can be detected by sensors that see light in many separate colors. The
exact pattern in the light signals is different for leafy spurge than it is for grass
and other welcome vegetation. Pinpointing its existence from satellites and
aircraft is the first step toward eradicating the weed.
4. Disease Scouting for Sugar Beet Producers: In the valley straddling the Red River
between North Dakota and Minnesota exists a billion-dollar sugar beet industry.
Diseases that cripple beet production can be spotted by airborne sensors detecting
radiation the eye cannot see before the disease (e.g., the fungus, rhizoctonia) is
visible to a farmer.
5. Fertilizer Applications for Wheat Farmers: In years of adequate rainfall, a wheat
crop is limited when nutrients in the soil are exhausted. Soil nutrients can be
supplemented by applying nitrogen fertilizer. In years when not enough rain falls,
2
lack of moisture limits the crop; additional fertilizer will not turn a bad crop into a
good one, but the chemicals applied unnecessarily will run off into streams or be
released to the atmosphere. By monitoring a wheat crop'
s growth from a satellite,
a farmer can determine whether to add fertilizer during the growing season.
6. Sustainable Forestry: balancing timber extraction and replacement rates for longterm economic and environmental health.
7. Fire Danger Index: Like a fever in a sick person, trees and plants trying to draw
water from dry soil have elevated temperatures. Using satellites to read vegetative
temperature and to estimate how much of it is being stressed, scientists can
highlight tinder-dry areas (red at right) and land managers can take fire-preventive
actions.
1.2 PROBLEM STATEMENT
DNGP (Digital Northern Great Plains) project is sponsored by UMAC. The goal of
this project is to build an integrated web-based Geographic Information System. This
system provides the access to Landsat imagery and Landsat-derived products (NDVI,
Green NDVI, Sugar Beet Yield) from the current season and the entire UMAC Landsat
archive (over 400 scenes) covering Montana, Wyoming, Minnesota, North Dakota and
South Dakota. DNGP can also be used to explore other geospatial data including
highways, rivers, lakes, shaded relief, and census data.
The DNGP project is sponsored by the UMAC. The purpose of this project is to
provide an easy tool for clients of UMAC to download Geospatial Data. Our clients
include farmers, ranchers and researchers. UMAC has built the DNGP Website, which is
3
an interactive maps system. Through DNGP Website, you can browse and download
remote sensing images covering Montana, Wyoming, Minnesota, North Dakota and South
Dakota. DNGP Website can also be used to explore other geospatical data including
highways, rivers, lakes, shaded relief, and census data.
The current Website is a three-tier Web database application. Tier 1 is User
Interface. It runs on a desktop PC or workstation(client) and uses a standard graphical user
interface (Web browser). In our application, our web pages act as tier1, which is requested
by the user through his Web browser and is sent there from our Web server for display.
Then user can use the controls on the web pages to send further queries to Web server,
Web server will respond to these queries and send result web pages to user’s Web
browser. Tier 2 is the Functional Module. This level actually processes data. It consists of
several separate modules running on an application server. This tier may be multi-tiered
itself. In the existing DNGP, this tier consists of Apache web server, Mapserver4.0, PHP
programs and C++ programs. Tier 3 is the Database Management System (DBMS). A
DBMS on a host computer stores the data required by the middle tier. In DNGP, this tier
is an Oracle 9i database management system in which we store our image data.
The existing DNGP website, which was built in an ad-hoc manner, has some
functional and performance drawbacks. To improve this website, we will produce a new
software design for DNGP'
s Tier 1 and Tier2. We expect to integrate JavaScript into Tier
1 of our project and we will re-implement the current PHP programs in Tier2, reusing
existing code when possible. In addition, we will seek feedback from our clients about the
existing DNGP implementation and use this feedback to determine any additional
requirements or features that need to be added to DNGP.
4
After the implementation is completed, we will test our new system internally for
correctness and then we will do satisfaction testing with our clients. Any negative
feedback from clients will be to guide a second iteration of the software development life
cycle.
1.3 STRUCTURE OF THIS REPORT
The next chapter describes the requirements and specifications of this project.
Chapter 3 contains High-level and Low-level Design. Chapter 4 is focused on
implementation of this project. Chapter 5 is Verification and Validation. Chapter 6
contains Conclusions. Appendix A includes the user manual and all the code is stored in
the CD-Rom attached as Appendix B.
5
CHAPTER II
REQUIREMENTS AND SPECIFICATIONS
Requirements are the users’ need for the system. A requirements specification is an
agreement between the end user and system developer, we can view it as a definition of
what the implementation must achieve. Xiaodong Zhang, assistant professor in UMAC,
provided requirements of DNGP project.
2.1 REQUIREMENTS
Users for the DNGP website are categorized as anonymous user and registered user.
Anonymous user could select image layers, select remote sensing image for raster layer,
view a product, choose band combination, adjust brightness, choose a color scheme and
download a product.
There are three kinds of registered users to our system:
1. Normal User is the registered user who has normal user permission. Normal user
should be able to execute all the functions that anonymous user could execute. In
addition, he or she can create their Area of Interest (AOI), view an AOI, manage
AOIs and manage his or her own account information. Area of Interest is an Area
of a map that user is interested in. By storing AOIs in our system, the user could
go directly to particular part of the map without searching and zooming.
6
2. Image Administrator is the registered user who has image administrator
permission. Image Administrator should be able to manage his or her own
account, manage all the images in our database.
3. Account Administrator is the registered user who has account administrator
permission. Account Administrator should be able to manage all the accounts and
all the images in our system.
2.2 SPECIFICATIONS
DNGP website features a modularized interface design resembling the Windows
environment that most of people are used to. There are user navigation buttons and five
independent panels for map, reference map, image list, layers and controls, each of them
can be independently moved resized and minimized.
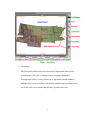
1. Map Panel
The Map panel consists of the map window to view the images, maps and
corresponding legend. The right side of the panel consists of interface icons,
which help, in navigating the map, retrieving the map and getting information
about specific features. The bottom side of the panel displays the scale at which
the map is displayed using scale bar and also displays the corresponding cursor
position on the map in Latitude and Longitude.
7
Figure 1. Map Panel
2. Layer Panel
The layer panel features many layers that convey information about various
spatial features. The layers are displayed in seven groups: Boundaries,
Transportation, Water, Geology, Raster layer, Agriculture and Environment.
Multiple layers can be overlaid on one another to make a map according to your
needs and can be viewed in the Map window, or printed and saved.
8
Figure 2. Layer Panel
3. Image List Panel
The Image List panel contains a list of Raster images in GeoTIFF format.
Different images cover different areas on the map. The image list varies according
to the map extent. At any instance, the list shows images that are covering the
area that is viewed in the map window. Each image is shown with a name, which
describes the Acquisition Date, Sensor type and Coverage information. If an
image covers the current map window completely then is shown as Full otherwise
it shown as Partial. The image list can refine by selecting a particular sensor type
in the Select box on the top of the panel to view images only from that sensor
covering the displayed area in the map window.
9
Figure 3. Image List Panel
4. Reference Map Panel
The Reference Map panel gives a reference of the location that is being viewed in
the Map window with respect to the entire UMAC coverage by highlighting with
a red colored pointer. You can change the current location displayed in the Map
window by clicking on any other location on the reference map.
Figure 4. Reference Map Panel
10
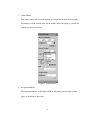
5. Control Panel
This feature allows the user to manipulate and download the chosen raster image.
The buttons over the control panel will be enabled only if an image is selected and
displayed in the map window.
Figure 5. Control Panel
6. Navigation Buttons
The navigation buttons on the Digital-NGP header image provide links to other
pages as described by their titles.
11
Figure 6. Navigation Buttons
12
CHAPTER III
HIGH LEVEL AND LOW LEVEL DESIGN
After requirements analysis, I did the high level and low level design.
3.1 HIGH LEVEL DESIGN
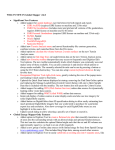
System Architecture gives us the overview of the Web database application. The
server technology used for this project is PHP [5] with JavaScript [3]. The server side
script is written in PHP. The client side script is written in JavaScript.
3.1.1 SYSTEM ARCHITECTURE
The current Website is a three-tier Web database application.
Tier 1 is User Interface. It runs on a desktop PC or workstation (client) and uses a
standard graphical user interface (Web browser). In our application, our web pages act as
tier1, which is requested by the user through his Web browser and is sent there from our
Web server for display. Then user can use the controls on the web pages to send further
queries to Web server, Web server will respond to these queries and send result web pages
to user’s Web browser. In the existing DNGP, this tier consists of html and JavaScript.
Tier 2 is the Functional Module. This level actually processes data. It consists of
several separate modules running on an application server. This tier is multi-tiered itself.
In DNGP, this tier consists of Apache web server, Mapserver4.0, PHP programs and C++
programs. The Apache web server is the first level of this tier, it receives queries from tier
13
1, interprets and runs PHP programs. The PHP programs are the second level in tier 2, it
accesses database, runs C++ programs and calls mapserver. The output of PHP programs
is html and JavaScript, which is the tier1 interface. The C++ programs and Mapserver4.0
are the third level in tier 2.
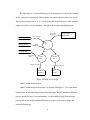
Tier 3 is the Database Management System (DBMS). A DBMS on a host computer
stores the data required by the middle tier. In DNGP, this tier is an Oracle 9i database
management system in which we store and maintain our geospatial data. Please refer to
Figure 7. System Architecture.
End User
Queries
Results
Client Computer
WWW GUI
HTML
Tier 1
results
Queries
Host Computer
Tier 2
Web Server
PHP
C++, Map server 4.0
results
Queries
Tier 3
Database Computer
DBMS
Geospatial data
Figure 7. System Architecture
14
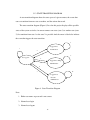
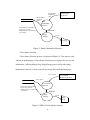
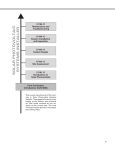
3.1.2 STATE TRANSITION DIAGRAM
A state transition diagram shows the state space of a given context, the events that
cause a transition from one state to another, and the actions that result.
The state transition diagram (Figure 8) I use for this project displays all the possible
states of the system as circles. An arrow connects one state (state 1) to another state (state
2) if a transition from state 1 to the state 2 is possible. And the arrow is labeled to indicate
the event that triggers the state transition.
8
Logged in as
1
Normal User
2
3
Not logged in
9
4
Logged in as Image
Administrator
5
6
7
10
Logged in as
Account
Administrator
Figure 8. State Transition Diagram
Note:
1. Either user name or password is not correct.
2. Normal user login
3. Normal user logout
15
4. Image Administrator login
5. Image Administrator logout
6. Account Administrator login
7. Account Administrator logout
8. Normal user process images
9. Image Administrator upload images
10. Account Administrator manage accounts
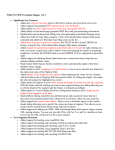
3.2 LOW LEVEL DESIGN
Data Flow Diagrams show the flow of data from external entities into the system,
shows how the data moves from one process to another, as well as its logical storage.
Figure 3-3 to Figure 3-10 present DFDs using the Gane and Sarson notation for this
project. There are only four symbols:
Squares representing external entities, which are sources or destinations of data.
Rounded rectangles representing processes, which take data as input, do something to it,
and output it. Arrows representing the data flows, which can either be electronic data or
physical items. Open-ended rectangles representing data stores, including electronic
stores such as databases or XML files and physical stores such as or filing cabinets or
stacks of paper. Here I only list the processes that have been reengineered.
16
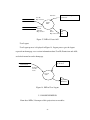
3.2.1 DATA FLOW DIAGRAM
User Registration:
Figure 9. shows User Registration process, remote user sends registration request
from homepage, input user name, password, email address and other personal
information, User Registration process validates these information and insert the valid
user information into database and display registration success message to user, if the
username is already in the database, shows error message.
User
Information
User Information
User
Information
Registration request
By the User
User
Registration
Duplicate
user
New user
Error
message
Registration
success
Figure 9. DFD of User Registration
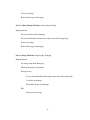
User Login:
User Login process is displayed in Figure 10. User Information is the user table in
the database, which stores user’s last name, first name, username, password, email
address etc. AOI information is AOI table in the database that stores users’ AOIs, which
could be null when there is no AOI for the user. User session is a set of variables stores
current session values.
17
The login request is sent from homepage, User Login process searches the database
for the username and password, if the username not found or password does not match,
display error message to user, if yes, it will get user ID, user Permission, AOIs (could be
empty if no AOI is stored in database), and update the menu bar on the homepage.
User name
Password
User permission
User Information
User
Login
AOIs
AOI Information
User Session
success
User ID
Permission
AOIs
Login request
By the User
Valid
user
fail
Invalid
user
Permission granted
Permission denied
Login
fail
message
Updated
Menu bar
Figure 10. DFD of User Login
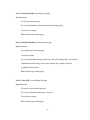
Band Combination Selection:
Band Combination Selection process is displayed in Figure 11. User sends Band
Combination information change request from homepage. Band Combination Selection
process updates the user session information, set Refresh Image flag, Display Image
process will get the image information from user session, create an new image and
refresh the homepage.
18
Bands number,
Brightness
factor
Bands number,
Brightness
factor
User Session
Bands request
By the User
Band
Combination
Selection
Image Name, bands number,
layers, map extension
Brightness factor, product type,
colorscheme
Refresh
Image
Display
.png file
Homepage
Figure 11. Band Combination Selection
Color scheme selection:
Color scheme Selection process is displayed in Figure 12. User chooses color
scheme on the homepage. Color scheme Selection process updates the user session
information, set Refresh Image flag, Display Image process will get the image
information from user session, create an new image and refresh the homepage.
Color scheme
User Session
Color scheme
Request by the User
Color scheme
Image Name, bands number,
layers, map extension
Brightness factor, product type,
colorscheme
Color scheme
Selection
Refresh
Image
Display
.png file
Image
View
Figure 12. DFD of Color scheme selection
19
Image Selection:
Image Selection process is displayed in Figure 13. User selects an image on the
homepage. Image Selection process updates the user session information, set Refresh
Image flag, Display Image process will get the image information from user session,
create an new image and refresh the homepage.
Image Name
User Session
Image Selection
Request by the User
Image Name
Image
Selection
Refresh image
Image Name, bands number,
layers, map extension
Brightness factor, product type,
colorscheme
Image
Display
.png file
Image
View
Figure 13. Image selection
Layers Selection:
Layers Selection process is displayed in Figure 14. User selects layers on the
homepage. Layers Selection process updates the user session information, set Refresh
Image flag, Display Image process will get the image information from user session,
create an new image and refresh the homepage.
20
Layers Selection
Request by the User
layers
User Session
layers
Layers
Selection
Image Name, bands number,
layers, map extension
Brightness factor, product type,
colorscheme
Refresh image
Image
Display
.png file
Image
View
Figure 14. DFD of Layers selection
Product Selection:
Product Selection process is displayed in Figure 15. User selects a product type on
the homepage. Product Selection process updates the user session information, create the
product, set Refresh Image flag, Display Image process will get the image information
from user session, create an new image and refresh the homepage.
Product
type
User Session
Image Name, bands number,
layers, map extension
Brightness factor, product type,
colorscheme
Product type
Product Selection
Request by the User
Product
Selection
Refresh image
Image
Display
.png file
Figure 15. DFD of Product selection
21
Image
View
View AOI:
View AOI process is displayed in Figure 16. User selects an AOI on the
homepage. View AOI process updates the user session information, set Refresh Image
flag, Display Image process will get the image information from user session, create an
new image and refresh the homepage.
AOI name,
Map extension
User Session
AOI Request
by the User
Map extension
Display
AOI
Image Name, bands number,
layers, map extension
Brightness factor, product type,
colorscheme
Refresh image
Image
Display
.png file
Image
View
Figure 16. View AOI
Create AOI:
Create AOI process is displayed in Figure 17. User sends the AOI creation request
from homepage to Create AOI process, the Create AOI process gets User ID and current
map extension from user session, stores User ID, AOI name and map extension into the
database, then refresh the AOI list on the homepage.
22
AOI name
AOI Creation Request
by the User
User ID,
Map extension
User Session
Create
AOI
AOI Information
User ID,
AOI name,
Map extension
AOI
Names,
Map extensions
AOI
List
Figure 17. DFD of Create AOI
User Logout:
User Logout process is displayed in Figure 18. Logout process gets the logout
request from homepage, reset session information about User ID, Permission and AOIs,
and refresh menu bar on the homepage.
Logout Request
by the User
User Session
Permission,
User ID,
AOI s
Logout
User
Updated
Menu bar
Figure 18. DFD of User Logout
3.2.2 MODULE DESIGN
From these DFDs, I decomposed this project into ten modules:
23
Module Login
Uses ViewAOI
Import username and password from homepage
Export session information for User_ID, Permission, User_AOI, flag of setting menu bar,
flag of setting AOI list or flag of setting error message
Module Registration
Import First name, Last name, address, city, state, zip, phone, email, username, password,
secret question, and secret answer
Export Registration status
Module Band Combination Selection
Uses Image Display
Import bands number, brightness and factor
Module Color Scheme Selection
Uses Image Display
Import color scheme
Module Image Selection
Uses Image Display
Import image name
Module Layers Selection
Uses Image Display
Import Layers
Module Product Selection
Uses Image Display
24
Import product type
Module View AOI
Import map extension from homepage
Export Session information for map extension
Module Create AOI
Import User_ID, map extension, AOI name
Export Session information for User_ID, map extension and AOI name
Module Logout
Export flags to reset session information about AOI list
25
CHAPTER IV
IMPLEMENTATION
After completing the high level and low level design, the functional modules are
implemented in PHP, JavaScript and C++. The complete source code is in appendix A. In
this chapter, we present the pseudocode for these modules and some code examples.
4.1 MODULES IMPLEMENTATION
The processing steps for each data flow diagram can be formally described using
pseudocode. In this section, we use the format
Module <module-name>: <file1>, <file2>, …
Implementation
<pseudocode>
To present our pseudocode, where <module-name> is the logical name of the
module, <file1>, <file2> etc. are filenames of source code implementing this module and
<pseudocode> is our English-like description of the processing that occurs.
Module Login: login.php, index.php, hide.php
Implementation
Get username and password from the homepage
Search Username, Permission, user AOIs with the username and password in the
database
26
If Username exists
Set Username
Set user permission
Set user AOIs
Display corresponding menu bar to user
Else
Set login failure flag
Display error message
Module User Registration: index.php, register.php, hide.php
Implementation
Get user information from registration form
Search if user exists in database
If the username exists
Display error message
Else
Input user information into database
Display registration success message
Module Band Combination Selection: bandcombo.php, hide.php
Implementation
Get bands information from homepage
Set session information about bands combination and refresh image flag
27
Create new image
Refresh the image on homepage
Module Color Scheme Selection: scheme.php, hide.php
Implementation
Get color scheme from homepage
Set session information about color scheme and refresh image flag
Create new image
Refresh the image on homepage
Module Image Selection: imagelist.php, hide.php
Implementation
Get image name from homepage
Check if the image is in database
If image exists
Set session information about image name and refresh image flag
Create the new image
Refresh the image on homepage
Else
Display error message
28
Module Layers Selection: legend.php, hide.php
Implementation
Get layers from homepage
Set session information about layers and refresh image flag
Create the new image
Refresh the image on homepage
Module Product Selection: product.php, hide.php
Implementation
Get product type from homepage
Create the product
Set session information about product type and refresh image flag, refresh band
combination selection flag, refresh color scheme flag, refresh download
production selection flag
Refresh the image on homepage
Module View AOI: viewAOI.php, hide.php
Implementation
Get map extension from homepage
Set session information about map extension
Create the new image
Refresh the image on homepage
29
Module Create AOI: createAOI.php, hide.php
Implementation
Get User_ID, AOI name, and current map extension from homepage
Search if the AOI name exists in the database
Translate map extension to certain format
Input AOI name and map extension to database
Set session information about AOI list
Refresh AOI list on homepage
Module Logout: logout.php
Implementation
Unset session information about User_ID, Permission, AOI list
Refresh menu bar on homepage
Refresh AOI list on homepage
4.2 EXAMPLE SOURCE CODE
The example source code below is from one program of login module: login.php.
The Login procedure is activated when the submit button is clicked on the NGP home
page form. The parameters passed from this home page are the user’s name and
password, which are captured and stored in local string variables.
The following paragraph shows the part of code to get username, password from
homepage.
$username = $_POST['username'];
30
$pwd = $_POST['passwd'];
//Encrypt password
$cryptpwd = md5($pwd);
An MD5 signature for the password is computed. Then a query is constructed and
submitted that search the administrative database and authenticate the user. The following
code is for database connection and query to get user ID, permission and user’s first name
and User AOIs.
//connect to oracle database
$db_conn = ocilogon(DBADMIN,DBADMINPASSWD,DBNAME);
//Search database for matching username and password
$query = "SELECT USER_ID,PERMISSION,LASTNAME,FIRSTNAME FROM UMACUSER
WHERE USERNAME = '$username' AND PASSWORD = '$cryptpwd'";
$results = queryDB($db_conn,$query);
//store User_ID, permission and user’s first name into session
//variables
if (count($results['USER_ID']) > 0){
$_SESSION['Suser_id'] = $results['USER_ID'][0];
$_SESSION['Spermission'] = $results['PERMISSION'][0];
$_SESSION['Srealname'] = $results['FIRSTNAME'][0].'
'.$results['LASTNAME'][0];
}
//connect to database to get aoi information
$db_conn = ocilogon(DBUSER,DBUSERPASSWD,DBNAME);
$query = "SELECT AOI_NAME, EXTENT FROM
USER_ID = '".$_SESSION["Suser_id"]."'";
$results = queryDB($db_conn,$query);
$rownum = count($results['AOI_NAME']);
31
".DBADMIN.".USERAOI
WHERE
if ( $rownum > 0){
for($i=0;$i<$rownum;$i++){
$aoi[$results['AOI_NAME'][$i]] = $results['EXTENT'][$i];
}
//store AOI list into session variable
$_SESSION['Saoi'] = serialize($aoi);
}
If the query results in at least one match from the administrative database, session
information is stored and area of interest (AOI) information is fetched from the user
information database.
32
CHAPTER V
SOFTWARE VERIFICATION AND VALIDATION
Software Verification refers to the set of activities that ensure that software
correctly implements a specific function. Validation refers to a different set of activities
that ensure that the software that has been built is traceable to customer requirements.
Verification and validation encompasses a wide way of Software quality assurance
(SQA) activities that include formal technical reviews, quality and configuration audits,
performance monitoring, algorithm analysis, development testing, usability testing,
qualification testing and etc.
Testing plays an extremely important role in V&V. Testing does provide the last
bastion from which quality can be assessed and more pragmatically, errors can be
uncovered. But testing should not be viewed as a safety net. As they say, “You can’t test
in quality. If it’s not there before you begin testing, it won’t be there when you are
finished testing.” Quality is incorporated into software throughout the process of software
engineering.
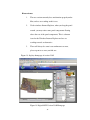
In this project we combined software testing with software reengineering. We
published version 3.0.0 of this project after we redesigned our Digital-NGP website on
Oct 12, 2004 and posted the release notes as following:
Digital-NGP version 3.0.0 released
[12-Oct-2004] We have completely re-designed our Digital-NGP
website and here announce the release of Digital-NGP version 3.0.0.
33
The new version is significantly faster than any previous versions plus
has many additions of new features. We strongly encourage you to test
this new version of Digital-NGP and highly appreciate if you can send
your suggestions and comments to the development team.
What's new:
1.
Fast: The Digital-NGP version 3 discards the use of Java
Applet which is slow and has been used in all the previous
versions for zoom in and out, pan, and query. Now we use
lightweight Javascript to furnish these functions. As a result,
an image will show up much quicker than it used to be.
2.
Appearance: The new version also features a modulized
interface design resembling the Windows environment that
most of our users are used to. There are five independent
panels for map, reference map, image list, layers, and
controls; each of them can be independently moved, resized
and minimized. Also there is a status bar showing progress
for "impatient" users including ourselves.
3.
Interoperability: From the Digital-NGP version 3 website,
you can seamlessly access high-resolution aerial photogram
(DOQ) and digitized paper map (DRG), both of which are
actually hosted at TerraServer USA. However, instead of
searching around, you can display a DOQ photograph in
34
your familiar Digital-NGP environment plus numerous
vector layers at your hand to be overlaid.
What's been improved:
1.
Redesigned Map window (panel). Your mouse movement
over the Map panel is continuously tracked and its location
(latitude and longitude) is updated just below the map.
Quickly print what you see and download what you see.
You can find these two quick access buttons on the right
side of Map panel.
2.
Expanded layers now contain all kind of information on
census, land cover, water, trace metal, and etc. And best of
all, we keep adding.
3.
More remote sensing sensors. We are now archiving data
from SRTM (Shuttle Radar Topography Mission), and
ASTER (Advanced Spaceborne Thermal Emission and
Reflection Radiometer) on Terra, in addition to the
traditional MSS, TM and ETM+ from LandSat series.
4.
Improved control panel. You can change band combination
for multispectral images and color scheme for single band
images, alter brightness, choose various remote sensing
products, and download images and products in GeoTIFF
format.
35
Known issues:
1.
The new version currently does not function properly under
Mac, and we are working on this issue.
2.
Under windows Internet Explorer, when you drag the panel
around, you may notice some panel components floating
above the rest of the panel components. This is a known
issue for the Windows Internet Explorer and we are
working towards an alternative.
3.
There will always be some issues unknown to us now,
please report to us once you find one.
Figure 19. displays homepage of version 3.0.0
Figure 19. Digital-NGP Version 3.0.0 Homepage
36
Users, including farmers, ranchers, foresters, educators, students and UMAC
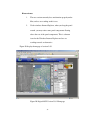
faculties tested this version and provided us feedbacks. Based on the user feedbacks, we
added few new functions and fixed some minor bugs. On Oct 21, 2004, version 3.0.1 was
published. The following is the release notes.
Digital-NGP version 3.0.1 released
[21-Oct-2004] We announce the release of Digital-NGP version 3.0.1.
This release is build upon the version 3.0.0 and involves one major
change and some minor changes. Again, to help us make the DigitalNGP serving you better, please send your suggestions and comments to
the development team.
What's new:
1.
The major change: Instead of auto loading the most recent
satellite image as a certain scale is reached, what will be
auto-displayed is the high resolution (up to 1 meter/pixel)
digital photograph (DOQ) that is hosted at TerraServer
USA.
2.
Instead of using two scale bars (one for miles and one for
kilometers), there is only one scale bar showing miles, and
the other one showing scales in terms of meters per pixel.
3.
The default mode for showing an image is the true color
band combination.
4.
Some minor bugs are fixed.
5.
The code has been cleaned and is tighter than before.
37
Known issues:
1.
The new version currently does not function properly under
Mac, and we are working on this issue.
2.
Under windows Internet Explorer, when you drag the panel
around, you may notice some panel components floating
above the rest of the panel components. This is a known
issue for the Windows Internet Explorer and we are
working towards an alternative.
Figure 20 displays homepage of version 3.0.1.
Figure 20. Digital-NGP Version 3.0.1 Homepage
38
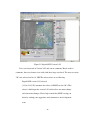
Then we collected feedbacks again from users. We added a new feature and fixed
the known issue 2 of version 3.0.1. Digital-NGP version 3.0.2 was published on Dec 10,
2004. The following is the release notes of version 3.0.2.
Digital-NGP version 3.0.2 released
[10-Dec-2004] We announce the release of Digital-NGP version 3.0.2.
This release is build upon the version 3.0.1 and involves several minor
changes. Again, to help us make the Digital-NGP serving you better,
please send your suggestions and comments to the development team.
What's new:
1.
When you mouse over through the image list, the boundary
of a partial covered image is displayed on the map.
2.
The layout of the main page is changed.
The homepage of version 3.0.2 is shown in Figure 21.
39
Figure 21. Digital-NGP Version 3.0.2
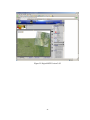
Users were interested in Version 3.0.2 and sent us comments. Based on these
comments, three new features were added and three bugs were fixed. The newest version
3.0.3 was released on Jan 18, 2005.The release notes are as following:
Digital-NGP version 3.0.3 released
[18-Jan-2005] We announce the release of DNGP version 3.0.3. This
release is build upon the version 3.0.1 and involves one major change
and some minor changes. Please help us make the DNGP serving you
better by sending your suggestions and comments to our development
team.
40
What's new:
1.
The layout of the interface has been modified to fit into
most of the monitor resolutions.
2.
A context area is added just above the map window. The
information in the context area is dynamically updated
according to actions a user takes. The information includes
the action taken, what you are currently viewing, and what
can be done next, and etc.
3.
Improved the tool tips.
Bugs that have been fixed:
1.
The check mark for the selected image becomes unchecked
once the image is zoomed in.
2.
Query returns only county and state information even when
additional layers selected.
3.
The progress bar was not properly renewed, preventing the
time step from being re-initialized after the progress bar
was stopped, especially under Mozilla type of browsers.
Figure 22. shows the homepage of Digital-NGP Version 3.0.3
41
Figure 22. Digital-NGP Version 3.0.3
42
CHAPTER VI
CONCLUSION
Previous versions of Digital-NGP (Version 2.0 and older) were developed in an adhoc manner. It met the original requirements, but the maintenance of the old versions was
very hard. The main reasons are: the old versions didn’t follow software engineering
process; the system design was not scaleable. By applying the software engineering to the
project, the website was redesigned, implemented and tested. New versions (version 3.0.0
and newer) have better user interface and are faster and maintenance is easier.
43
REFERENCES
[1] Ghezzi, Carlo, Jazayeri, Mehdi, Mandrioli, Dino, Fundamentals of Software
Engineering, second edition, Prentice Hall, 2002.
[2] Roger S. Pressman, Software Engineering, sixth edition, McGraw.Hill Higher
Education, 2005
[3] Danny Goodman, Javascript Bible, 3rd edition, 1998
[4] Remez Elmasri, Shamkant B. Navathe, Fundamentals of Database Systems, Third
Edition, 2000
[5] David Sklar, Learning PHP 5, 2004
44
APPENDIX A: Software Manual
Digital-NGP or DNGP is an online GIS database system for archiving and delivering remote
sensing images and geo-spatial information. You can retrieve high-resolution satellite imagery
and interactive maps easily from our system but you may not be familiar with all the features for
manipulating the images, exploring the maps, their themes and the data contained in the map
layers. This document describes the features involved in our system and how you can use them
to effectively retrieve the data and information from our system.
The Digital-NGP website features a modularized interface design resembling the Windows
environment that most of you are used to. There are user navigation buttons and five
independent panels for map, reference map, image list, layers, and controls; each of them can be
independently moved, resized and minimized.
1. Map Panel
The Map panel (Figure 1.) consists of the map window to view the images, maps and
corresponding legend. The right side of the panel consists of interface icons which help in
navigating the map, retrieving the map and getting information about specific features. The icons
are black in color by default; when clicked the icon becomes active and will be highlighted in
maroon color. The bottom side of the panel displays the scale at which the map is displayed
using scale bar and also displays the corresponding cursor position on the map in Latitude and
Longitude. The Map Panel can be moved in the web browser according to your convenience.
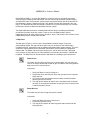
Zoom In Icon
This button lets you view part of the map in greater detail. You can either just
click on the map at the desired location or you can hold the mouse key down to
drag a box over an area of interest.
Instructions:
Select the Zoom In Icon by clicking on it
Position the cursor over the part of the map you want to see in greater
detail and click
3. Or Click on a point and drag the mouse to draw a rubber band box
defining your area of interest
4. The map will be redrawn to show 2 times more detail when clicked on
the map. Or the map will be redrawn to show your area of interest when
a rubber band box is drawn
1.
2.
Zoom Out Icon
This button lets you view a larger area with less detail.
Instructions:
Select the Zoom Out Icon by clicking on it
Click on the spot of the map
3. The map will be redrawn to shown a greater extent centered on the
mouse position
1.
2.
45
Full Extent Icon
This button lets you view the entire region covered by UMAC (North Dakota,
South Dakota, Montana, Wyoming, Idaho and Minnesota).
Instructions:
Click the Full Extent button
2. The map will be redrawn showing the entire UMAC area. The difference
between this button and Home button is the Full Extent button will just
change the map coverage to view the entire UMAC area without
making any other changes whereas Home button will reset all the
settings to default and restart the website
1.
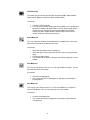
Query Map Icon
This icon shows the attributes associated with the enabled layers in the Layer
panel when clicked on any location on the map.
Instructions:
1.
2.
3.
4.
Select the Query Map Icon by clicking on it
Select the layers in the Layer panel on which you want to perform the
query
Click on any point of map
The attributes of the layers at the point click will be displayed in a new
window
Print Map Icon
This icon lets you print the map as it is in the map window on a paper. You can
print what you see in the window.
Instructions:
1. Click the Print Map button
2.
The system default Print dialog pops up and helps you through the
printing process
Save Map Icon
This icon lets you save the map as it is in the map window as an image file
(only in PNG format). You can save what you see in the window.
Instructions:
1. Click the Save Map button
2.
The system default Save dialog pops up and helps you through the
saving process
46
Pan Icon
This icon allows you to pan (shift) the map to the desired direction.
Instructions:
Select the Pan Icon by clicking on it
Click on any corner or side of the map you wish to pan
The map will pan to the desired direction
3.
4. The Pan icon and the small direction icons (in yellow/orange color)
around the map perform the same function of panning the map in a
desired direction. The only difference is that with Pan icon you will have
to select the icon first by clicking on it and then you have to click on
some corner of the map to pan in that direction whereas with the
direction icons, clicking on any of those direction icons will pan the map
towards that direction
1.
2.
2. Layer Panel
The layer panel (Figure 2) features many layers which convey information about various spatial
features. Multiple layers can be overlaid on one another to make a map according to your needs
and can be viewed in the Map window, or printed and saved. The layers are categorized into
different groups which can be minimized or maximized by clicking on the group names. The
layers DOQ, DRG and Shaded Relief are Scale-dependent; they can be viewed only at a
particular zoom level. The Shaded Relief layer cannot be viewed at greater zoomed level. The
DOQ and DRG layers are obtained from the Microsoft TerraServer using Web Map Service which
require you to view them at moderate zoom levels. The Layer Panel can be resized, minimized or
moved in the web browser according to your convenience.
Instructions:
1.
2.
3.
4.
Enable the layers which
you want to display by clicking in the checkboxes next to them
To disable the layers, uncheck the boxes next to those layers
Click the Select Layers button on the top of the Layer panel
The selected layers will be displayed in the map window
3. Image List Panel
The layer panel contains a list of Raster images in GeoTIFF format. Different images cover
different areas on the map. The image list varies according to the map extent. At any instance,
the list shows images that are covering the area that is viewed in the map window. Each image is
shown with a name which describes the Acquisition Date, Sensor type and Coverage information.
If an image covers the current map window completely then is shown as Full otherwise it shown
as Partial. The image list can refined by selecting a particular sensor type in the Select box on the
top of the panel to view images only from that sensor covering the displayed area in the map
window. Default Sensor type shows all the images from all the sensors. The Image List Panel
(Figure 3) can be resized, minimized or moved in the web browser according to your
convenience.
47
Instructions:
1. Select the image you would like to view
2. Click on the Select Image button at the top of the Panel
3. The image shows up in the map window
4. Reference Map Panel
The Reference Map panel (Figure 4) gives a reference of the location that is being viewed in the
Map window with respect to the entire UMAC coverage by highlighting with a red colored pointer.
You can change the current location displayed in the Map window by clicking on any other
location on the reference map. The Reference Map Panel can be minimized or moved in the web
browser according to your convenience.
5. Control Panel
This feature allows the user to manipulate and download the chosen raster image. The buttons
over the control panel will be enabled only if an image is selected and displayed in the map
window. The Control Panel (Figure 5) can be resized, minimized or moved in the web browser
according to your convenience.
Band Combination
These buttons are enabled when an image is selected and displayed in the map window. If the
image contains more than 3 bands, then the Red, Blue and Green bands (4,2 and 1 bands) are
selected by default. You can change the band combinations depending on the number of bands
the image contains to suit your needs. The corresponding bands of the image will be displayed in
the map window.
Brightness
This button is enabled when an image is selected and displayed in the map window. The
brightness of the image can be increased or decreased from 0.1 to 100 times the original value.
Default is 1.
View a Product
This box is enabled when an image is selected and displayed in the map window. You can select
from a range of products obtained from the image including Natural color, False color, NDVI,
GREEN NDVI, Sugar beet yield. Upon selecting the required product, the image in the map
window changes accordingly with the corresponding legend integrated in the map. Then you can
either download the current view of the image in the map window or print or save the map.
Color Scheme
This button is enabled upon selection of the specific products like NDVI, GREEN NDVI and Sugar
Beet Yield. You can select the grey or color scheme. The image in the map window changes
accordingly with legend integrated in the map.
Download
48
This button is enabled when an image is selected in the map window. You can download either
all the bands or the current view of the raster image in the map window (with selected band
combinations; default is RGB) in GeoTIFF format.
View AOI
This box is enabled if you are logged into the website. If you have already created AOIs either
from the map using the Create an AOI button in the Control Panel or from the Navigation buttons
on the DNGP AOI menu, they will be displayed as a list. Upon selecting an AOI name from the
list, the map window displays the map covering that AOI.
Create AOI
This box is enabled if you are logged into the website. You can save your AOI for later use by
selecting the location in the map window and giving it a name in the box provided.
Note:
After selecting an image, if you refresh the webpage using the Browser Refresh button then the
control panel buttons would be disabled. To enable them you will have to reselect the image in
the image panel.
6. Navigation Buttons
The navigation buttons (Figure 6) on the Digital-NGP header image provide links to other pages
as described by their titles.
The Login button takes the you to login screen, where you can enter username and
password to logon to your account. Upon success the login button changes to Logout
button.
Instructions:
1.
2.
3.
4.
5.
6.
If you don't have an account with Digital-NGP then you need to create an account by clicking
the Register Button
If you already have an account with us, Click the Login Button
A new window pops up and lets you enter the username and password
Upon successful logon, you can use the DNGP AOI navigation button to manage your AOI
and DNGP ACCOUNT navigation button to manage your ACCOUNT information
The DNGP LOGIN button changes to DNGP LOGOUT. You can successfully end your
session by clicking the LOGOUT button or by closing the web browser or by refreshing the
page
If you forgot your password, then you can follow the FORGOT PASSWORD? link on the login
interface where you will need to answer your Hint Question created at the time of
Registration. If you answer correctly, then we will let you create a new password for your
account. If you have any problem with the Login, please contact us through the DNGP
QUESTION navigation button and we would be very happy to help you promptly.
NOTE: Once you are logged in to our system and if use the web browser's
Refresh button or the DNGP Home button then you will be required to Login
again.
The Register button takes you to Registration screen.
Instructions:
49
1.
2.
3.
Click the Register Button
A new window pops up where you can Enter the registration details and click Register
The rows marked * are required and have to be provided before the process is complete.
The Question button takes you to Comments/Question window where you can send
your suggestions, requests, comments, bugs or doubts about Digital-NGP to us.
Instructions:
1.
2.
Click the DNGP QUESTION Button
A new window pops up where you can Enter your comments or questions about our Website
The Help button brings you to this Help screen.
Instructions:
1.
2.
Click the Help Button
A new window pops up with this Help page
The Home button restarts the website.
Instructions:
1.
2.
Click the Home Button
The Digital-NGP website restarts with the default settings.
Only after logging into the Digital-NGP, this button appears. This button allows you to
create an Area of Interest (AOI) by entering the bounding coordinates and Delete AOIs.
Instructions:
1.
2.
3.
Place the mouse cursor on the DNGP AOI Button
A drop down menu appears with the Create AOI and Delete AOI entries
Make the selection and click on it to go to desired function
Create AOI
1.
2.
3.
4.
5.
Click on Create AOI link.
Enter the name of AOI. Enter the values in DMS format and should be either in clockwise/anti-clockwise format.
To enter longitude values you can either enter the values with the hemisphere, for eg., 106 25
34.56 W with a space between degree, minute, seconds and direction. For Latitude the value
is 44 29 68.09 N.
Alternatively, the values can also be entered with a negative sign in front of it without the
hemisphere. For eg., -106 25 34.56 with a space between the degree, minute and seconds
but NO space between the '-' sign and the degree value
AOI will be created which can be accessed from the View AOI menu in the Control Panel
50
Create AOI
1.
2.
3.
Click on Create AOI with Map link.
Zoom in to the desired Area of Interest.
Enter the AOI Name and click Create AOI Button.
Delete AOI
1.
2.
3.
Click on Delete AOI link.
Select the AOI Names you want to delete and click Delete AOI.
AOI values deleted are removed permanently from the database and are irrecoverable.
Only after logging into the Digital-NGP, this button appears. This button allows you to
manage your account.
Instructions:
1.
2.
3.
Place the mouse cursor on the DNGP ACCOUNT Button
A drop down menu appears with the Edit my account, change my password and change my
secret question entries
Make the selection and click on it to go to desired function
Edit my account
1.
2.
Click on Edit my account link.
A new window pops up showing your current account information. You can change the
information in the window
Change my password
1.
2.
Click on change my password link.
A new window pops up to let you create a new password but it requires you to enter your
current password
Change my secret question
1.
2.
Click on change my secret question link.
A new window pops up to let you change your secret question and answer which would be
required if you forget your password
51
APPENDIX B: Source Code
The source code is not printed. It is stored in the accompany Compact Disk labeled as
Digital-NGP Version 3.0.3.
52