1
rta_3200_training.book Page i Monday, March 2, 1998 11:00 AM
Table of Contents
Chapter 1
Introduction to LD Real Time Analyzers (RTAs) ................ 1-1
Analyzer Setup .................................................................................1-2
Main Menu .......................................................................................1-4
Selecting a display parameter.......................................................1-4
Display weighting ........................................................................1-5
Annotation of a Measurement ......................................................1-9
Selection of Detectors ................................................................1-10
Special Measurements................................................................1-12
Triggering...................................................................................1-12
Storage and Recall of instrument setups ....................................1-15
File Operations ...........................................................................1-18
Autostore by time .......................................................................1-27
Recalling an Autostore ...............................................................1-29
Waterfall display of Autostored Records ...................................1-31
Block Averaging of Autostored Spectra ....................................1-33
Chapter 2
System Menu ...................................................................... 2-1
Operation Modes ..............................................................................2-1
Selection of Units and Calibration ...............................................2-2
Calibration based on a Reference Signal......................................2-4
Calibration based on a Transducer Sensitivity Value ..................2-5
Selection of Filter Type - Octave, Fractional Octave, and FFT...2-5
I/O Communications ..................................................................2-10
I/O port control...........................................................................2-11
Key A and Key B control2-11
Beeper Control ...........................................................................2-12
Operation of the Noise and Signal Generator (Opt 10 & Opt 11)..2-13
Option 10 Noise Generator ........................................................2-13
i
rta_3200_training.book Page ii Monday, March 2, 1998 11:00 AM
3200 TRAINING MANUAL
Option 11 Signal Generator........................................................2-14
SINE [I]2-15
PINK [J]2-19
White [K]2-21
PULSE [L]2-22
Selecting Analog Input Filters........................................................2-22
Setting the Clock ........................................................................2-24
Activating the External Color Monitor: (LD Model 2500 Color Video Adaptor required)...................................................................2-24
Resets..........................................................................................2-26
Chapter 3
Shift Menu............................................................................ 3-1
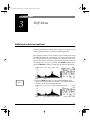
Defining a reference spectrum..........................................................3-1
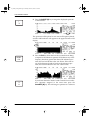
Changing from a logarithmic scale to a linear scale.....................3-3
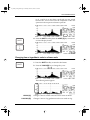
Changing the Vertical and Horizontal Zoom ...............................3-4
Chapter 4
Basic Acoustics .................................................................. 4-1
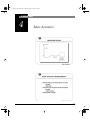
Using the Model 3200 as a Sound Level Meter in Standard Analysis
Mode...............................................................................................4-14
Setting up the 3200 .....................................................................4-14
Sound Pressure Level measurement ...........................................4-18
Chapter 5
Macros ................................................................................ 5-1
Defining macros ...............................................................................5-1
Executing Macros .........................................................................5-3
Storing Macros .............................................................................5-4
Chapter 6
Printing................................................................................. 6-1
Chapter 7
Vibration Measurements ................................................... 7-1
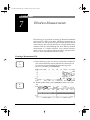
Creating a Measurement File........................................................7-1
Setting up the FFT ........................................................................7-2
Background on FFT Windows .....................................................7-4
Selecting an FFT Window............................................................7-5
ii
rta_3200_training.book Page iii Monday, March 2, 1998 11:00 AM
3200 TRAINING MANUAL
Selecting the High and Low Pass Filters......................................7-6
Selecting Units .............................................................................7-7
Calibration....................................................................................7-8
Averaging ...................................................................................7-13
Zoom Processing ........................................................................7-15
Integration and Double Integration ............................................7-16
Chapter 8
Room Acoustics ................................................................. 8-1
Sound Decay Measurements (RT60's) .............................................8-2
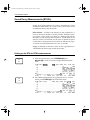
Setting up the RTA for RT60 measurements ...............................8-2
Creating a Measurement File .......................................................8-3
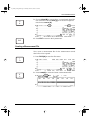
Setting up the Microphones and Noise Source ............................8-5
Establishing the Averaging Parameters for the RT60 Measurement
8-7
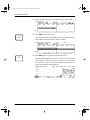
Setting the Signal Generator Delay............................................8-11
Making the RT60 Measurement.................................................8-12
Viewing the RT60 (Reverberation Time) Values. .....................8-16
Sound Transmission Loss Measurements ..................................8-21
Setting Up the RTA for Sound Transmission Loss Measurements ..
8-22
Making Airborne Sound Transmission Loss Measurements .....8-27
Impact Sound Isolation...............................................................8-34
Noise Ratings .................................................................................8-35
Noise Criterion (NC [A]) ...........................................................8-35
Noise Rating Curves (NR [B]) ...................................................8-36
Room Criterion (RC [C]) ...........................................................8-36
Chapter 9
Statistics and Ln Calculations ........................................... 9-1
Hiding a trace ...............................................................................9-4
Storing the Ln Trace.....................................................................9-4
Storing the Statistics Table...........................................................9-5
Recalling Ln traces.......................................................................9-5
iii
rta_3200_training.book Page iv Monday, March 2, 1998 11:00 AM
3200 TRAINING MANUAL
Recalling a Statistics Table...........................................................9-5
Merging Statistics Tables .............................................................9-6
Chapter 10 Modal Analysis ................................................................. 10-1
What is Modal Analysis?................................................................10-1
Dynamic Analysis.......................................................................10-2
Modal Models.............................................................................10-2
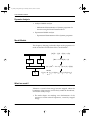
What is a mode? .........................................................................10-2
The Frequency Response Function (FRF)......................................10-3
Modal Parameters from FRF’s ...................................................10-3
Why Use Modal Analysis? .............................................................10-4
Making Modal Measurements ........................................................10-5
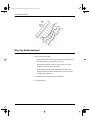
Excitation Techniques ................................................................10-5
Impact Hammer ..........................................................................10-5
Time Domain and Frequency Domain Signals...............................10-6
Impact Hammers - Frequency Range .........................................10-7
Impact Hammer Tips ..................................................................10-7
Impact Hammers-Double Hits....................................................10-8
Impact Hammers - Off Axis Hits ...............................................10-8
Impact Hammers - Averaging ....................................................10-9
Exponential Windowing .............................................................10-9
Leakage (Why We Use Windows) ...............................................10-11
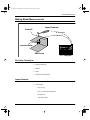
Shaker Excitation..........................................................................10-11
Shaker Test Schematic..............................................................10-12
Shaker Excitation Functions.....................................................10-12
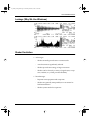
Attaching Accelerometers ........................................................10-13
Test Setup - Establishing a Measurement Grid ........................10-13
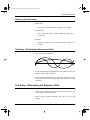
Test Setup - Determining the Reference Point .............................10-13
Test Setup - The Driving Point Survey ....................................10-14
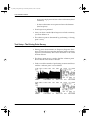
Fixturing (Boundary Conditions) .................................................10-15
Setting Up the Analyzer ...............................................................10-15
iv
rta_3200_training.book Page v Monday, March 2, 1998 11:00 AM
3200 TRAINING MANUAL
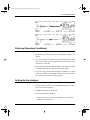
Setting up the Model 3200 for Modal Testing .............................10-16
Setting up the Model 3200 .......................................................10-16
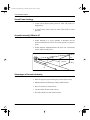
Chapter 11 Acoustic Intensity............................................................. 11-1
Why use Acoustic Intensity?11-1
Sound Pressure versus Sound Power .........................................11-1
Sound Power Analogy................................................................11-2
Acoustic Intensity? What is it?...................................................11-2
Advantages of Acoustic Intensity ..............................................11-2
Acoustic Intensity measurement hardware ....................................11-3
Acoustic Intensity - nuts & bolts....................................................11-4
Time Domain..............................................................................11-4
Frequency Domain .....................................................................11-5
Measuring Sound Power ................................................................11-5
Sound Pressure Method..............................................................11-6
Sound Power Setup using the Sound Pressure Method..............11-6
Sound Power Calculation for Hemi-Anechoic...........................11-7
Sound Pressure Method (pros and cons) ....................................11-7
Why Use Acoustic Intensity?.........................................................11-8
The Acoustic Intensity Probe .....................................................11-8
Intensity Probe Spacer Selection................................................11-9
Spacer Errors (High Frequency) ................................................11-9
Intensity Probe Directivity Pattern...........................................11-10
Measurement Considerations ...................................................11-10
Measurement Techniques.............................................................11-11
Fixed Point or Scanning ...........................................................11-11
Setting up the Model 3200 for Acoustic Intensity Measurements ........
11-12
Selecting an Exponential detector ............................................11-14
Microphone calibration ............................................................11-15
Programming remote control keys ...........................................11-17
v
rta_3200_training.book Page vi Monday, March 2, 1998 11:00 AM
3200 TRAINING MANUAL
Creating a measurement data file .............................................11-19
Normalization of input channels...............................................11-21
Naming a job, part, and area.....................................................11-22
Selecting a Linear Detector ......................................................11-23
Performing a measurement.......................................................11-25
Chapter 12 Autostore byTACH, vsRPM Display and Order Tracking12-1
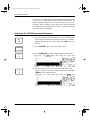
byTACH Autostore Measurements ................................................12-1
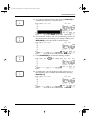
Setting up the 3200 Measurement Parameters ...........................12-2
Setting the byTACH Autostore parameters....................................12-7
Creating a Measurement File....................................................12-12
Performing the byTACH Autostore Measurement...................12-13
Viewing the byTACH Autostored Data ...................................12-15
vsRPM Graphics.......................................................................12-16
Post Process Order Tracking ....................................................12-19
Real-time vsRPM Graphics ..........................................................12-20
Real-time vsRPM Order Tracking............................................12-24
vi
rta_3200_training.book Page 1 Monday, March 2, 1998 11:00 AM
CHAPTER
1
Introduction to LD Real Time
Analyzers (RTAs)
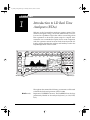
Welcome to the Larson•Davis Analyzer training manual. This
manual is designed to help you become familiar with your analyzer and it’s capabilities. Topics that will be covered range from
basic operations to advanced system setups for complex measurements. It is not intended to replace, but to use in conjunction
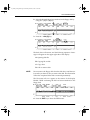
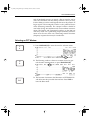
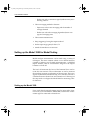
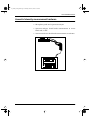
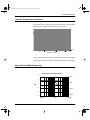
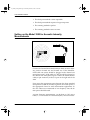
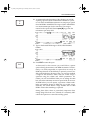
with, the operators manual received with the analyzer.The following graphic identifies the softkeys and hardkeys used in the
keyboard operation of the LD 3200.
?
PRINT
Q
A
R
B
S
C
T
D
U
E
V
F
W
G
X
H
(
7
)
8
*
9
=
5
>
6
STO
RCL
EXIT
LARSON•DAVIS
<
4
OFF
ON
.
CHANNEL SELECT
:
1
;
2
/
3
”
0
’
SPACE
+
—
CLR
SCREEN
SYSTEM
SRQ
SHIFT
MODEL 3200
LOCAL
AUTO
RANGE
RESET
SHIFT
R/S
Hardkeys
Y
I
Z
J
!
K
@
L
#
M
%
N
[
O
]
P
&
$
PREV
NEXT
Softkeys
Throughout this manual the following conventions will be used
to denote the keyboard operation of the LD 3200.
BOLD words
Represent a HARDKEY function. The HARDKEYS are the keys
permanently labeled on the analyzer keyboard, (i.e. ON, EXIT,
R/S).
1-1
rta_3200_training.book Page 2 Monday, March 2, 1998 11:00 AM
3200 TRAINING MANUAL
BOLD [A] words
Represent a SOFTKEY function, where Bold represents the text
that appears either on the top or the bottom of the LCD display,
and can change depending upon which menu you have selected
and [A] identifies the key associated with the function.
Analyzer Setup
1. Attach the microphone/preamp, or whatever transducer you
may have, to the analyzer through an input card. If more
than one input card is installed, Channel one is the card furthest from the power supply module.
OFF
ON
SCREEN
SYSTEM
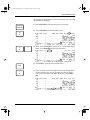
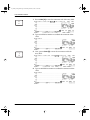
2. Turn the analyzer on by pressing the ON key located on the
upper left of the keyboard. (Make certain the Main switch is
in the ON position in the back of the analyzer.)
3. Press the SYSTEM hardkey.
4. Press the INPUT [K] key.
5.
Press either the Direct [A] key, for direct input, or PREAMP
[B] key, for input from the preamp.
6. Verify that the 200v bias has been turned on. The bias switch
is located on the input module in the back side of the analyzer.
1-2
rta_3200_training.book Page 3 Monday, March 2, 1998 11:00 AM
3200 TRAINING MANUAL
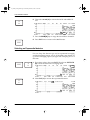
7. Press the EXIT hardkey twice to return to the Main menu.
EXIT
RESET
R/S
AUTO
RANGE
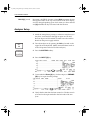
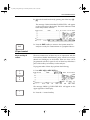
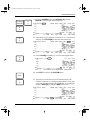
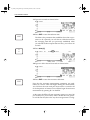
8. Press the R/S key to RUN or STOP the unit. You can verify
the status of the unit by looking on the right side of the display.
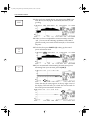
9. Select a range to optimize the spectra in the display without
overloading the analyzer. To do this, first press the RANGE
key. Then press the down arrow key until the overload
“OVL” is seen on the screen. Next press the up arrow key
until the “OVL” disappears.
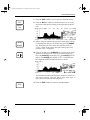
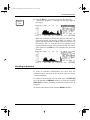
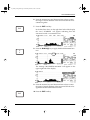
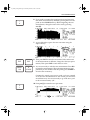
10. Press the double arrow CURSOR key to select which cursor
options you desire to use. Press one of the following softkeys: the dotted [P] will display a d=, the solid [O] will display s=, the both [N] will display a “∆=”, which indicates
the amplitude difference between the two cursors.
The filter band number and frequency are shown for the current cursor position. Press the left or right arrow keys to
move the cursor to the desired frequency.
11. Press the EXIT hardkey to return to the Main Menu.
EXIT
1-3
rta_3200_training.book Page 4 Monday, March 2, 1998 11:00 AM
3200 TRAINING MANUAL
Main Menu
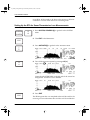
Selecting a display parameter
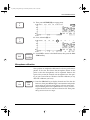
1. Press one of the following keys to select the desired display
parameters:
Normal [A]
Displays the averaged spectrum according to the parameters selected in the Detector [H] menu.
Leq [B]
Displays a spectrum that represents the steady level which, integrated over a period of time, would produce the same energy as
the actual signal. The period of time is the actual run time of the
analyzer.
Min [C]
Displays the minimum level measured for each filter band since
the last reset.
Max [D]
Displays the maximum level measured for each filter band since
the last reset.
SEL [E]
Sound Exposure Level is similar to the Leq except the signal is the
equivalent energy if it occurred over a 1 second time period.
Max.Spec. [L]
This display type should not be confused with Max [D] (see
above). Max.Spec displays the spectrum corresponding to the
highest broadband level that occurred during a measurement.
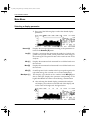
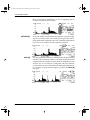
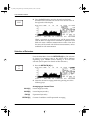
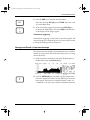
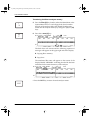
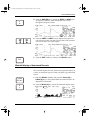
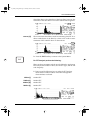
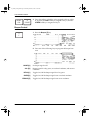
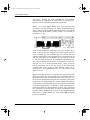
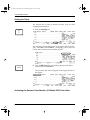
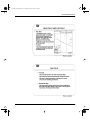
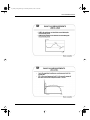
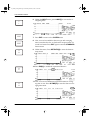
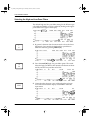
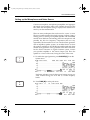
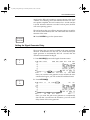
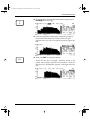
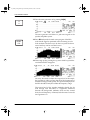
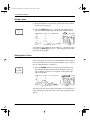
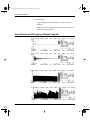
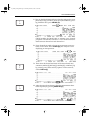
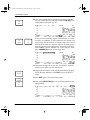
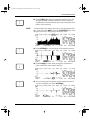
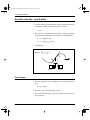
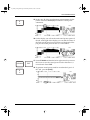
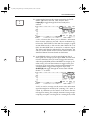
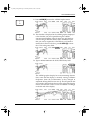
2. After selecting the desired display parameter the analyzer
will display your selection on the left side of the display, and
on the center of the right side. See figure below.
1-4
rta_3200_training.book Page 5 Monday, March 2, 1998 11:00 AM
3200 TRAINING MANUAL
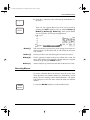
Display weighting
Your analyzer has the capability of digitally weighting the displayed data. This feature is independent to the input signal analog weighting that is selected from the Input menu.
1. Press the Display [F] key to access the digital display menu.
V
F
2. Press one of the following keys to select the desired display:
1/1 [A]
This key permits you to view a displayed spectrum, that was taken in 1/3 octave, in 1⁄1 octave. This will sum the 1⁄3 bands into
groups of three to produce the spectrum having 1⁄1 octave bandwidths.
1/3 [B]
This key will return you to a 1/3 octave bandwidth from a 1/1
octave bandwidth.
NOTE:
If the measurement was taken in a 1/1 octave bandwidth you
may not view it in 1/3 octave bandwidth. The 1/1 [A] or 1/3 [B]
will not appear in the menu.
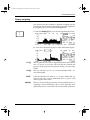
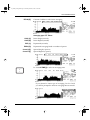
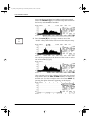
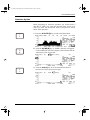
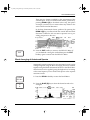
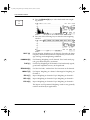
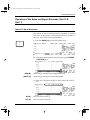
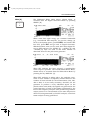
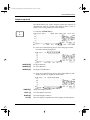
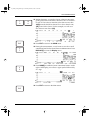
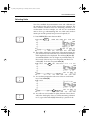
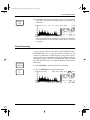
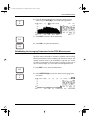
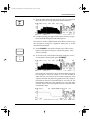
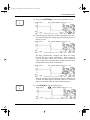
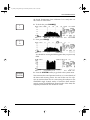
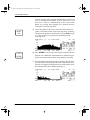
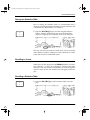
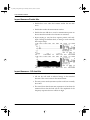
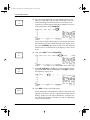
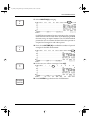
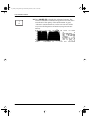
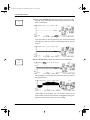
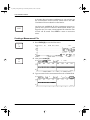
SUM [E]
This key controls the digital readout of the broadband levels, Aweighting or Linear Summation, shown on the right side of the
spectrum by the two vertical bars. The actual numeric readout for
1-5
rta_3200_training.book Page 6 Monday, March 2, 1998 11:00 AM
3200 TRAINING MANUAL
these vertical bars is identified by A=; for A-weighting, and Σ=;
for linear summation shown below.
1-6
SETUSER [F]
If you are making a measurement that requires a special weighting curve you may create your own by pressing this key and entering the desired weighting values. For a detailed explanation of
User curves, see Chapter 10 of the operations manual.
Multi [H]
This key permits the analyzer to simultaneously display multiple
channels. The maximum number of channels displayed will be
determined by the number of input channels configured in your
analyzer (i.e. if you analyzer is configured with four channels,
you may select up to four channels to be displayed simultaneously). To return to single channel display, you press the Multi [H]
key again.
rta_3200_training.book Page 7 Monday, March 2, 1998 11:00 AM
3200 TRAINING MANUAL
V.SUM [J]
This key give you the vector sum which displays the square root
of the sum of the squares between channel 1 and channel 2 spectrum.
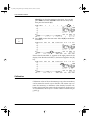
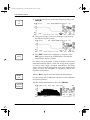
3. Press the Dig.Wgt [I] key to access the weighting menu:
4. Press one of the following keys to select the desired display
weighting:
NO WGT [I]
This key returns the display to a flat response - No Weighting
A [J]
Adds an A-Weighting curve to the displayed spectrum.
C [K]
Adds a C-weighting curve to the displayed spectrum.
USER [L]
Adds a User defined weighting curve to the displayed spectrum.
-A [M]
Adds a weighting curve that is the inverse of the A-weighting
curve to the displayed spectrum (negative).
-C [N]
Adds a weighting curve that is the inverse of the C-weighting
curve to the displayed spectrum (negative).
-USER [O]
Adds a weighting curve that is the inverse of the User defined
curve to the displayed spectrum (negative).
1-7
rta_3200_training.book Page 8 Monday, March 2, 1998 11:00 AM
3200 TRAINING MANUAL
5. Select Zw.Free [A] or Zw.Diff [B] to apply Zwicker loudness
function to the displayed spectrum.
Zw.Free [A]
Applies Zwicker free field loudness function to the displayed
spectrum.
Zw.Diff [B]
Applies Zwicker Diffuse loudness function to the displayed
spectrum.
When in the standard analysis mode with 1/3 octave filtering,
the Loudness corresponding to ISO Recommendation R523
Method B (sometimes referred to as Zwicker loudness after the
researcher who developed the method) is calculated and displayed on the lower right of the screen. There are two forms of
this loudness which correspond to measurements made in diffuse acoustic fields where energy is from all directions such as
inside a reflective space, and measurements made in the freefield where the sound is radiated without reflection from a single acoustic source.
6. Select Zw.FREE [A] to display Zwicker Free-field loudness
function to the spectrum.
7. Press the EXIT hardkey twice to return to the Main Menu.
EXIT
1-8
rta_3200_training.book Page 9 Monday, March 2, 1998 11:00 AM
3200 TRAINING MANUAL
Annotation of a Measurement
With the LD analyzer you can attach a note to each spectrum
stored. This feature can be found in both the RTA mode, and the
SLM mode of the analyzer.
V
F
W
G
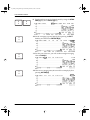
1. Press the DISPLAY [F] key from the Main menu.
2. Press the note [G] key.
Alpha characters A through P will appear across the top and
bottom of the display. To select the rest of the alpha characters press the SHIFT hardkey and Q through Z will appear. A
flashing cursor will also appear in the middle of the display,
this is where you can enter the desired note.
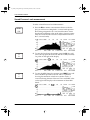
3. Begin entering note, TEST-1, in the text field. If you make a
mistake entering the text you can highlight the character by
moving the cursor with the PREV or NEXT keys, then press
the double arrow CURSOR hardkey to delete the wrong
character.
If a note has been previously entered and you desire to modify or delete it and start new, press the SHIFT, CLEAR hardkeys and the entire text field will be erased ready for a new
entry.
1-9
rta_3200_training.book Page 10 Monday, March 2, 1998 11:00 AM
3200 TRAINING MANUAL
4. Press the EXIT hardkey once the desired note has been
entered into the text field. You will now see the new note on
the right side of the display.
EXIT
When a spectrum is stored this note will be stored along
with the data. It is important to remember to update the note
field each time a different measurement is taken. Note that
this note will be stored with all future measurements, unless
modified for each measurement.
Selection of Detectors
From the Main Menu locate the DETECTR [H] key. The selection
of choices of averaging types in this menu will be different
depending upon whether Octave filtering or FFT has been
selected. (See Chapter 2 for details on filter selection.)
1. Press the DETECTR [H] key.
X
H
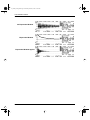
2. Select the desired averaging method by pressing one of the
following keys:
Averaging type: Octave Filters
LIN.S [A]
Linear Single (seconds)
LIN.R [B]
Linear Repeat (seconds)
EXP [C}
BT/EXP [D]
1-10
Exponential (seconds)
Constant Confidence with Exponential Averaging
rta_3200_training.book Page 11 Monday, March 2, 1998 11:00 AM
3200 TRAINING MANUAL
BT/LIN [E]
Constant Confidence with Linear Averaging
Averaging type: FFT Filters
LIN.S [A]
Linear Single (seconds)
LIN.R [B]
Linear Repeat (seconds)
EXP [C]
EXP.N [D]
Y
I
Exponential (seconds)
Exponential averaging based on number of spectra.
Count.S [E]
Spectral Single (# spectra)
Count.R [F]
Spectral Repeat (# spectra)
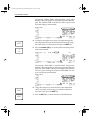
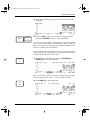
3. Press AV.TIME [I] to select an averaging time.
If you selected a Linear type of averaging, Lin.S or Lin.R,
you will be prompted to enter an averaging time in seconds.
1-11
rta_3200_training.book Page 12 Monday, March 2, 1998 11:00 AM
3200 TRAINING MANUAL
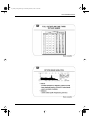
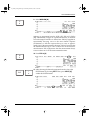
If you selected an Exponential of averaging a display with 16
different values of averaging times will be presented.
4. Press the EXIT hardkey to return to the Main Menu.
EXIT
Special Measurements
ROOMS [I]
Room Acoustics
vsRPM [J]
Versus RPM measurements
STAT [K]
Statistics and Ln calculations
Each of these measurements and keys will be discussed in detail
later in the manual.
Triggering
The analyzer has the capability to begin averaging automatically
when a specific trigger criteria has been satisfied. The analyzer
can trigger in both the Frequency-domain, and the Time-domain
(FFT mode only.)
Frequency-domain triggering
#
M
1-12
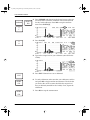
1. Press the F.TRIG [M] key.
rta_3200_training.book Page 13 Monday, March 2, 1998 11:00 AM
3200 TRAINING MANUAL
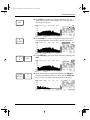
The word “TRIG” will appear on the left side of the display.
This indicates that the trigger function is activated. This type
of triggering can be used with either Octave filtering or FFT.
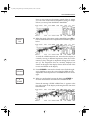
2. Setup the desired trigger criteria, trigger frequency, and the
trigger level.
a. Press one of the following keys to setup the trigger criteria.
>= [I]
Triggering will occur whenever the level in a specified frequency
band equals or exceeds the programmed value.
<= [L]
Triggering will occur whenever the level in a specified band is
less than or equal to the programmed value.
+Slope [J]
Triggering will occur whenever the signal in a specified band has
both the appropriate trigger level and has a positive slope.
-Slope [K]
Triggering will occur whenever the signal in a specified band has
both the appropriate trigger level and has a negative slope.
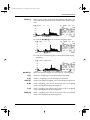
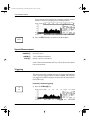
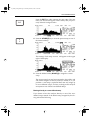
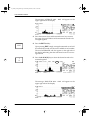
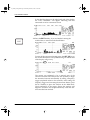
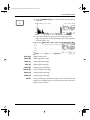
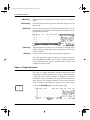
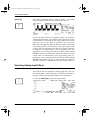
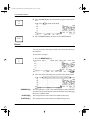
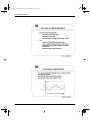
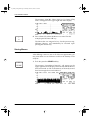
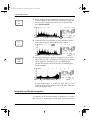
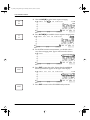
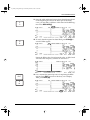
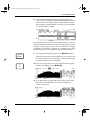
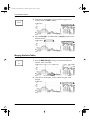
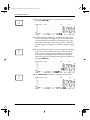
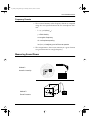
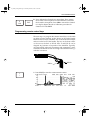
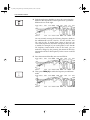
b. Turn the knob to select the desired trigger frequency. By turning the knob you can page forward and backward through the
available frequency range as indicated by the changing value on
the display. See figure below.
1-13
rta_3200_training.book Page 14 Monday, March 2, 1998 11:00 AM
3200 TRAINING MANUAL
One step beyond the highest available frequency band you will
find “Spectrum ∑”, which means that the measurement will trigger based on the level or slope of the overall level.
c. Press the level [P] key to input the desired trigger level. Upon
pressing this key the following message will appear on the
upper right of the display.
EXIT
RESET
R/S
Enter the desired level using the numeric keypad and press the
EXIT hardkey.
3. Press the R/S key to ARM the analyzer.
When triggered, the display will change from “armed” to
“run” and timer will start running. The measurement will
commence once the triggering criteria have been satisfied.
%
N
1-14
4. Press the RE-ARM [N] key if you wish to have the analyzer
reset itself following a triggered autostored sequence. This
will re-arm the trigger ready to autostore following a subsequent event. You can toggle this feature on and off by pressing this key repeatedly.
rta_3200_training.book Page 15 Monday, March 2, 1998 11:00 AM
3200 TRAINING MANUAL
5. Press the EXIT key to return to the Main Menu.
EXIT
[
O
Note that pressing OFF [O] in the F.TRIG menu also exits
you to the Main menu.
6. To de-activate the trigger function press the OFF [O] key
located in the F.TRIG menu. The word TRIG on the left side
of the display will no longer appear.
Time-domain triggering
Time-domain triggering is often used for transient capture and
structural testing (i.e. Modal analysis). This topic will be covered
in the Modal Testing section in Chapter 10.
Storage and Recall of instrument setups
The analyzer has the capability of permitting the user to define a
number of setups other than the default setup that was configured at the factory.
1. Setup the analyzer as desired. Then from the Main Menu or
System Menu locate the SETUP [N] key.
%
N
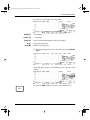
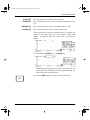
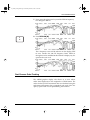
2. Press the SETUP [N] key. The softkeys [I]-[P] along the bottom of the display are where you may define up to seven different setups. These keys are originally labeled “undef” for
“undefined”. You may create a specific instrument setup and
1-15
rta_3200_training.book Page 16 Monday, March 2, 1998 11:00 AM
3200 TRAINING MANUAL
store it under one of these keys labeled with an associated
name. The DEFAULT [I] key is a default setup delivered from
the factory and can not be modified.
R
B
3. Press the name [B] key to assign a name to one of the
“undef” sofkeys that will be used to store the analyzer setup.
You will be prompted on the bottom of the screen to select
one of the softkeys [J]-[P].
After pressing one of the softkeys [J]-[P] enter the desired
setup name. Press the Shift, CLEAR hardkeys to delete any
entered text. For this example enter the name NOISE by
pressing the alpha characters appearing on the display.
1-16
rta_3200_training.book Page 17 Monday, March 2, 1998 11:00 AM
3200 TRAINING MANUAL
EXIT
U
E
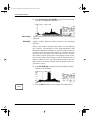
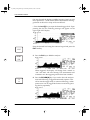
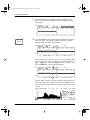
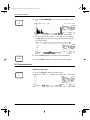
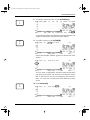
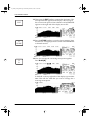
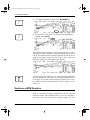
Press the EXIT key after entering the new name. The new
name you entered will appear on the softkey that you previously selected. See figure below.
4. Press the STORE [E] key to store the present setup to one of
the named softkeys.
The message “Push setup to store” will appear on the upper
right of the display.
5. Press the labeled softkey NOISE [J] to assign the current
setup.
The current setup has now been assigned to the softkey and
will remain assigned to this key until you modify it, or you
perform a “reset setup” (explained later).You may assign up
to seven different setups, and may reconfigure the analyzer
at anytime to one of these user-defined Setups.
Booting directly to a user-defined setup
If you desire to boot the analyzer directly to one of the userdefined setups instead of the default setup assigned by the factory perform the following:
1-17
rta_3200_training.book Page 18 Monday, March 2, 1998 11:00 AM
3200 TRAINING MANUAL
1. Press the Setup [N] key.
%
N
V
F
2. Press the >BOOT [F] key.
3. Press one of the previously defined softkeys [J]-[P] which
represents the setup to be activated upon boot up of the analyzer.
You may reset all of the user-defined setups to assign a new
group of setups. To do this perform the following:
1. Press the R.SETUP [D] key. This will clear all of the defined
softkeys [J]-[P] and bring them back to an undefined state.
T
D
2. Re-assign any desired analyzer setups to the softkeys [J]-[P].
3. Press the EXIT key to return from the Setup menu.
File Operations
Data measured are stored to non-volatile RAM into files that
have been created by the user. With the optional disk drive,
DVX003, these files can be subsequently transferred from internal memory to a floppy drive, and also from a floppy disk back
into the internal memory.
1-18
rta_3200_training.book Page 19 Monday, March 2, 1998 11:00 AM
3200 TRAINING MANUAL
Creating a new file
[
O
1. Press the FILES [O] key to access the Files menu of the analyzer.This key can be found from either the Main Menu or the
System Menu.
The display will be separated into two sections: the section
on the left shows the created memory files, the section on the
right displays the files that are stored on a floppy disk if the
optional floppy drive is attached. If no floppy is attached, the
analyzer will display a message indicating that no floppy
drive was found.
Q
A
2. Press the create [A] key.
1-19
rta_3200_training.book Page 20 Monday, March 2, 1998 11:00 AM
3200 TRAINING MANUAL
3. Enter the desired new file name (for this example use the
name “PLANT”) by pressing the alpha keys appearing on
the display.
EXIT
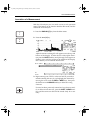
4. Press the EXIT key when finished entering file name. The file
name “PLANT” will appear on the left side of the display
with the associated date, time, and size.
After creating a few files you may select which of these files
you wish to use to store your data into. To do this use the ↑
[C] or ↓ [K] arrow keys to highlight the file “PLANT” and
press the EXIT key to leave the FILES Menu.
The file name “PLANT” that you selected will appear on the
lower left side of the display. This indicates that this is the
active file and all subsequent data storage will be placed into
this file.
1-20
rta_3200_training.book Page 21 Monday, March 2, 1998 11:00 AM
3200 TRAINING MANUAL
Renaming a file
[
O
1. Press the FILES [O] key found in either the Main Menu or
the System Menu.
2. Select the file “PLANT”, or a desired file to be renamed, by
using the ↑ [C] or ↓ [K] key.
Z
J
3. Press the rename [J] key.
The following message, “Enter new name:”, will appear on
the right side of the display.
4. Enter the new file name “ROOM” by using the alpha characters on the display.
1-21
rta_3200_training.book Page 22 Monday, March 2, 1998 11:00 AM
3200 TRAINING MANUAL
EXIT
5. Press the EXIT key. The new file “ROOM” has replaced the
old file name “PLANT”.
Deleting a file
[
O
1. Press the FILES [O] key found in either the Main Menu or
the System Menu.
2. Select the file name “ROOM”, or a desired file to be deleted,
with the ↑ [C] or ↓ [K] arrow keys.
Y
I
3. Press the delete [I] key.
The following message, “Delete highlighted file?”, will
appear on the right side of the display.
1-22
rta_3200_training.book Page 23 Monday, March 2, 1998 11:00 AM
3200 TRAINING MANUAL
4. Press either the YES [A] or NO [C] to answer the message.
Pressing YES will delete the file, pressing NO will return you
to the files menu without affecting the file.
5. Press the EXIT key to leave the FILES menu
EXIT
Recalling a previously stored record:
[
O
1. Press the FILES [O] key found in either the Main Menu or
the System Menu.
2. Select the FILE where the desired stored data record to be
recalled can be found by using the ↑ [C] or ↓ [K] arrow keys.
R
B
3. Press the RECORDS [B] key.
A listing of the stored data records will appear on the right
side of the display. The record listing will show the TYPE of
record stored (i.e. Normal, Intensity, byTime, SLM, etc.), and
a note, if any, that was attached when the data was stored.
4. Press the ↑ [E] or ↓ [M] key to scroll through the stored
records until the desired record to recall is located.
1-23
rta_3200_training.book Page 24 Monday, March 2, 1998 11:00 AM
3200 TRAINING MANUAL
5. Press the KEEP [H] key.
X
H
The message, “KEEP record and exit?”, will appear on the right
side of the display.
6. Press either the YES [A] or NO [C] key to answer the message. Pressing YES will recall the stored data record and analyzer configuration to the display, leaving the FILES menu.
Pressing NO will return you to the FILES menu.
EXIT
7. If you answered NO to the above step and no longer desire
to manipulate the files, press the EXIT key to return from the
FILES menu.
Transferring stored files to a floppy disk
[
O
V
F
1-24
1. Press the Files [O] key found in either the Main Menu or the
System Menu.
Place a 3.5 inch floppy disk into the disk drive located in the
back of the analyzer.
rta_3200_training.book Page 25 Monday, March 2, 1998 11:00 AM
3200 TRAINING MANUAL
2. Select the desired file to be transferred to the floppy disk by
using the ↑ [C] or ↓ [K] key.
3. Press the →disk [D] key.
The disk drive will activate, and the following sequence of messages will appear on the upper right side of the display:
A. Opening disk file.
B. Copying file to disk.
C. Copy done.
D. O.K. to remove disk.
NOTE:
Do not remove the floppy disk from the disk drive until the analyzer tells you that it is okay to remove the disk. The file transfer
will not be completed if the disk is removed prematurely.
The file name will now appear in the section of the display
labeled “DISK” indicating the file has been transferred to the
floppy disk.
4. Press the EXIT key to leave the FILES menu.
1-25
rta_3200_training.book Page 26 Monday, March 2, 1998 11:00 AM
3200 TRAINING MANUAL
Transferring disk files to analyzer memory
[
O
@
L
5. Press the Files [O] key found in either the Main Menu or the
System Menu.Place a 3.5 inch floppy disk drive located in
the back of the analyzer.Select the desired file to be transferred into the analyzer memory by using the ↑ [E] or ↓ [M]
keys.
6. Press the ←mem [L] key.
The disk drive will activate and the following sequence of
messages will appear on the upper right side of the display:
A. Copying file to memory.
B. Copy done.
The transferred file name will appear on the section of the
display labeled “MEMORY” indicating that the file has been
transferred to the internal memory of the analyzer.
5. Press the EXIT key to return from the analyzer menu.
EXIT
1-26
rta_3200_training.book Page 27 Monday, March 2, 1998 11:00 AM
3200 TRAINING MANUAL
Autostore by time
Before beginning an autostore operation you should select a
data file in which you want the autostore data record to be
stored. To select the desired file refer to the previous section
titled “FILE operation”.
]
P
R
B
S
C
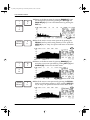
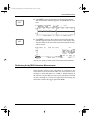
1. Press the AUTOSTR [P] key, found in the Main Menu.
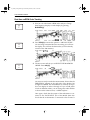
2. Press the byTIME [B] key. A “bTIME” indicator will appear
on the middle left side of the display. This indicates that the
Autostore by time is activated.
3. Press the delta [C] key to set the desired time interval
between successive spectrum storages.
1-27
rta_3200_training.book Page 28 Monday, March 2, 1998 11:00 AM
3200 TRAINING MANUAL
The message “DELTA TIME = XXXXXX.XXXX” along with a
flashing cursor will appear on the upper right side of the display. The “DELTA TIME” indicates how often a spectra will
be stored during a measurement.
EXIT
T
D
4. Use the left and right arrows keys to navigate through the
time displayed and enter the desired time interval by using
the numeric keys on the analyzer and press the EXIT key.
5. Press the endstor [D] key to set the desired run time period
of the measurement.
The message “END TIME = XXXXXX.XXXX” along with a
flashing cursor will appear on the upper right side of the display. The “END TIME” indicates how long the measurement
will run. Upon reaching the selected “END TIME” the analyzer will stop the measurement.
EXIT
6. Using the numeric keys of the analyzer, enter the desired
value, in seconds, for how long you want the analyzer to
store data. Then press the EXIT key.
7. Press the EXIT key to return from the AUTOSTOR menu.
EXIT
1-28
rta_3200_training.book Page 29 Monday, March 2, 1998 11:00 AM
3200 TRAINING MANUAL
RESET
R/S
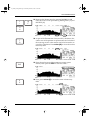
8. Press the R/S key to begin the Autostore. The message,
“Autostore in progress....”, will appear on the upper right of
the display.
When the analyzer has reached the endstore time, that was
previously entered, the message “STORE - By Time X” will
appear indicating the data has been stored to the memory of
the analyzer. The “X” indicates the record number of this
type that has been stored in the pre-selected file. Any subsequent presses of the R/S key will re-initialize the Autostore
function.
Recalling an Autostore
To recall an Autostore measurement you must have the
Autostore feature activated on the analyzer. (See the section,
“Autostore byTime”)
To recall an Autostored file you may either press the FILES [O]
key or by pressing the RECALL hardkey. To recall a file with the
FILES [O] key, refer to “Recalling a previously stored record” in
Chapter 1.
To recall a stored Autostore file with the RECALL hardkey:
1-29
rta_3200_training.book Page 30 Monday, March 2, 1998 11:00 AM
3200 TRAINING MANUAL
CLEAR
RECALL
%
N
1. Press the RECALL hardkey to recall the Autostore measurement. The recalled record number is identified on the upper
right side of the display.
2. Press the A.Prev [N] or A.Next [O] to scroll through the
autostored records until the desired record is displayed.
[
O
3. Turn the knob to move through the autostored measurement. Each spectrum displayed, by turning the knob, is a
time slice that correlates to the autostore delta rate set at the
time of the measurement. The last spectrum displayed will
be the last autostore performed when the “End Time” was
reached.
T
D
1-30
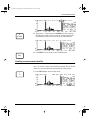
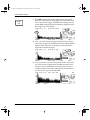
4. Press the vsTIME [D] key to view the stored spectrum vs.
time.
rta_3200_training.book Page 31 Monday, March 2, 1998 11:00 AM
3200 TRAINING MANUAL
#
M
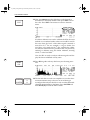
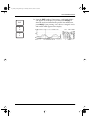
5. Press the DATA [M] key to assign the PREV and NEXT keys
as frequency selectors, which will permit you to scroll
through the frequency bands.
6. Press the PREV and NEXT keys to display the response of
each frequency band over time. The run time of the autostore
is shown on the x-axis of the display.
7. Press the EXIT hardkey to return to the RECALL menu.
EXIT
Waterfall display of Autostored Records
The waterfall display function permits the sequential display of
a series of individual spectra within a byTime type autostored
record.
CLEAR
RECALL
Q
A
1. Press the RECALL hardkey and press the A.Prev [N] or
A.Next [O] keys to select the desired autostored record to be
displayed as a Waterfall.
2. Press the W.Fall [A] key to enter the Waterfall display menu.
1-31
rta_3200_training.book Page 32 Monday, March 2, 1998 11:00 AM
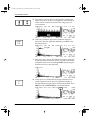
3200 TRAINING MANUAL
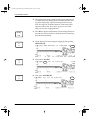
3. Press the following keys, if you desire to indicate the Start
and End spectra to be displayed, and the Delta (incremental
record number) between displayed spectra.
START [E]
Selects the first spectra in sequence that will be
displayed.
END [F]
Selects the last spectra in sequence that will be
displayed.
DELTA [G]
Selects the incremental record number between
displayed spectra.
Upon pressing anyone of these keys the following message will
appear:
“W.FALL sXXXX,eXXXX,dXXXX”, and instead of pressing each
individual key listed above you may edit all the display parameters at the same time by entering the numbers with the numeric
keypad and the horizontal arrow keys.
EXIT
T
D
1-32
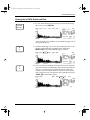
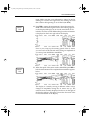
4. Press the EXIT hardkey, the display sequence will begin
immediately. You may repeat the display sequence by pressing the DRAW-1 [D] key.
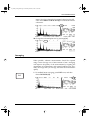
rta_3200_training.book Page 33 Monday, March 2, 1998 11:00 AM
3200 TRAINING MANUAL
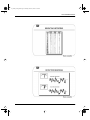
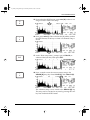
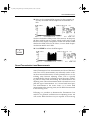
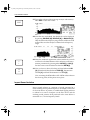
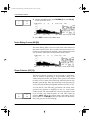
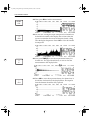
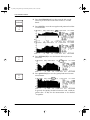
There are two formats available for the presentation of the
waterfall plots. In the two dimensional format, produced by
pressing DRAW-1 [D] as described in this step, the spectra
are simply overlaid, one at a time without any offsets in the
vertical and horizontal directions.
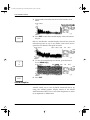
In the three dimensional format, produced by pressing the
DRAW-2 [D] key, an offset in both the vertical and horizontal
directions is added to each successive spectrum curve, providing perspective to the view.
EXIT
5. Press the EXIT hardkey to return to the RECALL Menu. If
you are finished viewing the recalled data press the EXIT
hardkey again to return from the RECALL Menu.
Block Averaging of Autostored Spectra
Sequentially stored autostored or non-autostored records can be
averaged together using the Block Averaging Function, summed
together using the Block Summation function or the Block Maximum function can be applied giving the highest level occurring
at the same frequency across all the Nth spectro in the separate
autostore records.
CLEAR
RECALL
R
B
1. Press the RECALL hardkey to enter the Recall Menu.
2. Press the B.AVE [B] key to select the desired records to be
averaged.
1-33
rta_3200_training.book Page 34 Monday, March 2, 1998 11:00 AM
3200 TRAINING MANUAL
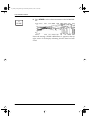
The message “AVERAGE: 0001 - 0002" will appear on the
upper right side of the display.
3. Press the numeric keys and horizontal arrow keys to enter
the range of record numbers of the autostored records to be
averaged together.
4. Press the EXIT hardkey
EXIT
T
D
Upon pressing EXIT a single averaged autostored record will
be created and stored into the next available record number.
The word AVERAGED will also appear on the right side of
the display indicating that this autostored record is an averaged record.
5. Press the B.SUM [D] key to select the desired records to be
summed together.
The message “RMS SUM: 0001 - 0002” will appear on the
upper right side of the display.
1-34
rta_3200_training.book Page 35 Monday, March 2, 1998 11:00 AM
3200 TRAINING MANUAL
6. Press the numeric keys and horizontal arrow keys to enter
the range of record numbers of the autostored records to be
summed together.
7. Press the EXIT hard key.
EXIT
S
C
In the third line down on the right hand side of the display
the word “SUMMED” will appear indicating that this
autostored record is a summed record.
8. Press the B.MAX [C] key to apply the Block Maximum function.
The message “MAXIMUM 0001-0002” will appear on the
upper right side of the display.
9. Press the numeric keys and horizontal arrow keys to enter
the range of record numbers of the autostored records to be
applied in the Block Maximum function.
10. Press the EXIT hardkey.
EXIT
1-35
rta_3200_training.book Page 36 Monday, March 2, 1998 11:00 AM
3200 TRAINING MANUAL
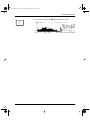
In the third line down on the right hand side of the display
the word “MAXIMA” will appear indicating that this
autostored record is a maximum record.
EXIT
11. Press the EXIT hardkey, if you are finished viewing the
recalled data, to return from the Recall Menu.
To turn off the Autostore function press the OFF [A] key in
the AUTOSTOR menu. The byTIME message on the left side
of the display will go away.
The routine just explained is for a manual start of the
Autostore function. The analyzer has the capability to begin
the Autostore function automatically by setting a frequency
trigger (explained earlier in this manual). After setting the
frequency trigger and activating the Autostore feature, press
the R/S hardkey to place the analyzer in the ARM mode.
Upon satisfaction of the trigger criteria the analyzer will
begin the Autostore and stop automatically when the endstore time has been reached.
1-36
rta_3200_training.book Page 37 Monday, March 2, 1998 11:00 AM
3200 TRAINING MANUAL
1-37
rta_3200_training.book Page 38 Monday, March 2, 1998 11:00 AM
3200 TRAINING MANUAL
1-38
rta_3200_training.book Page 1 Monday, March 2, 1998 11:00 AM
CHAPTER
2
System Menu
To access the System menu from the Main menu, press the SYSTEM hardkey located on the left side of the analyzer. In this
menu you can select the desired mode of operation, perform a
calibration, select the desired filter band-width, I/O communications, or change the input filters.
Operation Modes
There are three basic modes of operation of the analyzer. To
select the desired mode press one of the following keys:
#Chanls [A]
This key permits you to select the number of input channels to be
used for measurements. You may select up to the number of input channels with which your analyzer is configured with.
STANDARD [C]
This key places the analyzer in a standard operation mode where
spectral data are measured for each of the different input channels, but no cross channel parameters are measured.
2-1
rta_3200_training.book Page 2 Monday, March 2, 1998 11:00 AM
3200 TRAINING MANUAL
CROSS [D]
This key places the analyzer in a cross channel mode for performing Autospectrum, Cross spectrum, Transfer functions, and Coherence measurements. This implies a cross channel
measurement between channel 1 and channel 2.
INTENSITY [E]
(optional) This key places the analyzer in the intensity mode for
performing; intensity, sound power, and quality measurements.
This mode of operation is discussed in detail later in this manual.
Selection of Units and Calibration
In the Units menu you can select either dBµv, SPL, or define
your own units of calibration. To select a units type or define a
new unit of calibration:
V
F
R
B
1. Press the UNITS [F] key from the System menu.
2. Press the name [B] key to assign a Units name to an undefined Units key.
The message “Push setup to name” will appear prompting
you to press on the undefined softkeys [K]-[P] that are
labeled “undef”.
2-2
rta_3200_training.book Page 3 Monday, March 2, 1998 11:00 AM
3200 TRAINING MANUAL
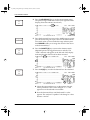
3. Press one of the undefined softkeys to be named. The message “Enter units name” with a flashing cursor will appear
on the display. (Push SHIFT CLEAR to clear old name.)
4. Enter the new desired Unit name “M/SEC” by using the
alpha characters appearing on the display. Typical names for
Units are: g, m/sec, ft./sec, or psi.
EXIT
5. Press the EXIT hardkey. The new name “M/SEC” will
appear on the softkey previously selected.
6. Press the newly named unit key (M/SEC). The new name
will appear on the upper right side of the display.
7. Press the EXIT hardkey to return to the System Menu.
EXIT
2-3
rta_3200_training.book Page 4 Monday, March 2, 1998 11:00 AM
3200 TRAINING MANUAL
Calibration based on a Reference Signal
Before calibrating the analyzer, verify that the exponential detector has been selected. To calibrate the system based on a reference signal:
V
F
1. Press the UNITS [F] key from the System menu.
2. Select either the SPL [J] key or one of the user-defined keys
[K]-[P] to which the calibration level will be assigned.
3. Apply a known excitation level, say from a microphone calibrator, to the transducer (in this case a microphone).
RESET
R/S
4. Press the R/S hardkey to run the analyzer.
5. Move the cursor to the frequency of excitation by using the
left or right arrow keys. Press the level [H] key.
The message 'Enter Level XXX' will appear on the right side
of the display prompting you to enter the known excitation
level, via the numeric keypad. For a Larson•Davis Model
CAL250 calibrator the level will be 114.0dB.
2-4
rta_3200_training.book Page 5 Monday, March 2, 1998 11:00 AM
3200 TRAINING MANUAL
6. Press the EXIT hardkey to return to the System Menu
EXIT
Verify the calibration by placing the unit in the RUN mode
and turn the calibrator on. The level displayed should agree
to the level entered when calibrated.
The analyzer has now been calibrated to a reference level,
and the reference level assigned to a Unit name. You may
assign up to 6 different Unit names with 6 associated calibration reference levels.
&
STORE
These names and reference levels may be stored as a file to
the memory of the analyzer by pressing the STORE hardkey
for future recall.
Calibration based on a Transducer Sensitivity Value
This topic will be covered in detail in the Vibration Analysis section of this manual.
Selection of Filter Type - Octave, Fractional Octave, and FFT
To select a filter type, press the Filter [G] key from the System
Menu.
For Octave and Fractional Octave analysis perform the following:
1. Press one of the following keys:
2-5
rta_3200_training.book Page 6 Monday, March 2, 1998 11:00 AM
3200 TRAINING MANUAL
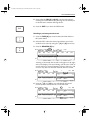
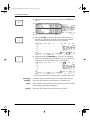
1/1oct [A]
For octave band analysis. Note designation in right hand corner.
1/3oct [B]
For one third octave band analysis.
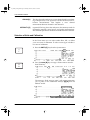
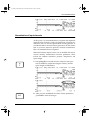
2. 1/12oct [C]For one twelfth octave band analysis. Press either
the long [F], short [G], reverse [H] key to select the type of
digital filter algorithm used.
2-6
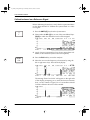
long [F]
Satisfies the ANSI S1.11-1986 requirements for Type 0-AA classification with optimal passband flatness and stopband rejection.
This is used more for measuring steady state noise, because of the
better resolution due to the steep filter skirts.
short [G]
Satisfies the ANSI S1.11 -1986 requirements for Type 1-D classification. This is used for measurements which require a particularly fast filter time response such as gunshots. The slope of the
rta_3200_training.book Page 7 Monday, March 2, 1998 11:00 AM
3200 TRAINING MANUAL
short filter skirts is less than that of the long filter, however, the
resolution of the short filter is not as fine as that of the long filter.
reverse [H]
The reverse time short filter is used for measuring short RT. It reduces residual time of the filter by a factor of 10. It allows measurements of RT at 200 Hz down to about 20 ms.
3. Press the EXIT hardkey to return to the System Menu.
EXIT
For FFT Analysis perform the following:
There are three parameters which must be defined to perform an
FFT analysis; the number of lines, the window type, and the full
scale frequency.
1. Press one of the following keys to select the FFT analysis
mode and the number of lines. Note H4AA designation
when 400 lines is selected.
100line [I]
100 line FFT
200line [J]
200 line FFT
400line [K]
400 line FFT
800line [L]
800 line FFT
2-7
rta_3200_training.book Page 8 Monday, March 2, 1998 11:00 AM
3200 TRAINING MANUAL
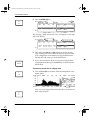
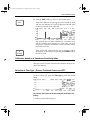
2. Press the Window [N] key to select the desired time weighting window.
%
N
3. Press one of the following keys to select the time weighting
window.
RECT. [A]
For Rectangular Weighting on all channels. Provides the finest
frequency resolution but is often accompanied by excessive leakage of energy to the neighboring sidebands.
HANNING [B]
For Hanning Weighting on all channels. Used with steady signals, gives better frequency resolution.
FLAT [C]
For Flat Top Weighting on all channels. Used with steady signals,
gives better amplitude accuracy in the passband.
ZEROPAD [D]
For Zero Pad with/ without Bow Tie Correction on all channels
IMPACT [E]
For Impact Weighting on channel 1 Rectangular Weighting on
Channel 2.
EXP-2 [F]
Impact Weighting on channel 1 Exp-2 Weighting on channel 2
EXP-4 [G]
Impact Weighting on channel 1 Exp-4 Weighting on channel 2.
EXP-6 [H]
Impact Weighting on channel 1 Exp-6 Weighting on channel 2.
The Impact and Exponential Weighting windows are generally
used for modal analysis applications.
2-8
rta_3200_training.book Page 9 Monday, March 2, 1998 11:00 AM
3200 TRAINING MANUAL
4. Press the BASE-Bd [O] key to select the Full Scale Frequency
Baseband.
[
O
5. Press one of the following keys to select the upper band
edge. Your selection will be identified on the lower right side
of the frequency axis.
Orders[A]
Highest order in Hz.
20kHz [B]
20kHz upper band edge.
10kHz [C]
10kHz upper band edge.
5kHz [D]
5kHz upper band edge.
2.5kHz [E]
1.25kHz [F]
2.5kHz upper band edge.
1.25 kHz upper band edge.
625Hz [G]
625 Hz upper band edge.
250Hz [H]
250 Hz upper band edge.
NOTE:
When performing a baseband analysis, if the selected full-scale
frequency is >10kHz using two channels the analysis will not be
performed in real-time.
2-9
rta_3200_training.book Page 10 Monday, March 2, 1998 11:00 AM
3200 TRAINING MANUAL
#
M
6. Press the FFTZOOM [M] key to select the desired Zoom factor.
7. Select the desired Zoom Factor, 1 through 512, by pressing a
key [A] - [K]. Your selection will appear below the frequency
axis of the display.
8. Press the EXIT hardkey to return to the FILTER Menu.
EXIT
9. Press the EXIT hardkey to return to the SYSTEM Menu.
I/O Communications
Selecting a baud rate
Y
I
2-10
1. Press the I/O [I] key from the System menu.
rta_3200_training.book Page 11 Monday, March 2, 1998 11:00 AM
3200 TRAINING MANUAL
2. Select the desired baud rate by pressing one of the keys [J][P].
The message “RS232 XXXX BAUD SELECTED” will appear
on the upper right of the display. The XXXX indicates which
baud rate you have selected.
EXIT
3. Press the EXIT hardkey to return to the System menu.The
analyzer is ready for communication to a peripheral device.
I/O port control
Key A and Key B
control
The most common use of these keys is in conjunction with the
Larson•Davis Model 2260 Intensity probe, which has two keys
(thumb and forefinger) on the handle. These two keys can be
programmed such that a press of each of these keys simulates a
press of the softkeys or hardkeys on the analyzer.
To program either of these keys perform the following:
T
D
1. Press KEY A [D] or KEY B [E] key.
U
E
The message “PRESS [-], THEN THE KEY” will appear on the
upper right side of the display.
+
-
2. Press the “-” minus hardkey
2-11
rta_3200_training.book Page 12 Monday, March 2, 1998 11:00 AM
3200 TRAINING MANUAL
RESET
R/S
&
STORE
3. Press the softkey or hardkey to be assigned to Key A or Key
B. Typically the R/S hardkey is assigned to Key A, and the
STORE hardkey is assigned to Key B.
Beeper Control
1. Press the Beeper [F] key.
V
F
2. Press one of the following keys to program the beeper function:
NONE [A]
ALL [B]
Beeper signal for a key press, an overload condition, and an error
condition.
KEYS [C]
Toggles On/Off the beeper signal for a key press.
OVER [D]
Toggles On/Off the beeper signal on an overload condition.
ERROR [E]
2-12
No beeper signal at all.
Toggles On/Off the beeper signal on an error condition.
rta_3200_training.book Page 13 Monday, March 2, 1998 11:00 AM
3200 TRAINING MANUAL
Operation of the Noise and Signal Generator (Opt 10 &
Opt 11)
Option 10 Noise Generator
The Option 10 Noise Generator has the capability to produce
Pink noise, or White noise, and control the mode of operation of
the noise. It is accessed in the System Menu.
1. Press the NOISE [J] key from the System menu.
Z
J
2. Select the desired spectral content by pressing the PINK[M]
or WHITE [N] keys:
PINK [M]
WHITE [N]
Equal energy content per percentage bandwidth.
Equal energy content per constant bandwidth.
3. Press one of the following keys to select the mode of operation:
ON [A]
Turns the noise source on.
OFF [B]
Turns the noise source off.
2-13
rta_3200_training.book Page 14 Monday, March 2, 1998 11:00 AM
3200 TRAINING MANUAL
ON/RUN [C]
Will activate the noise generator when the analyzer is in the RUN
mode.
OFF/RUN [D]
Will de-activate the noise generator when the analyzer is in the
RUN mode.
BURST [E]
Selects the burst mode. The repetition of the burst key is set by
pressing the Delay [O] key and using the horizontal keys to adjust the rate in seconds.
DELAY [O]
The Delay function permits you to set a delay for when the noise
will be turned on. Typically used in conjunction with the ON/
RUN [C] function.
LEVEL[P]
Level is used to set the output level of the noise generator.
The noise generator output is located on the top of the instrument identified by the label “source output” located on the back
of the instrument. This output is typically used to drive a loud
speaker for room acoustics.
Option 11 Signal Generator
The OPT 11 Signal Generator provides swept sine (with
tracking filter and feedback level control), dual frequency
swept sine and a pulse generator in addition to the pink
and white noise provided by the OPT 10 Noise Generator.
Also, there is an autolevel feature for use with the pink
noise to assist in equalizing the noise level in a test room.
Z
J
2-14
1. Press the SIG.GEN [J] key from the System menu.
rta_3200_training.book Page 15 Monday, March 2, 1998 11:00 AM
3200 TRAINING MANUAL
2. Select the desired spectral content by pressing one of the following keys:
SINE [I]
PINK [J]
Swept sine generator.
Equal energy content per percentage bandwidth.
WHITE [K]
Equal energy content per constant bandwidth.
PULSE [L]
Pulse noise generator.
3. Select the SINE [I] key.
SINE [I]
Q
A
EXIT
A. Press Fstart [A]. You will be prompted to set the lower
frequency limit via numeric keypad where the sweep will
begin.
B. Press the EXIT hardkey.
2-15
rta_3200_training.book Page 16 Monday, March 2, 1998 11:00 AM
3200 TRAINING MANUAL
R
B
C. Press Fend [B] key. You will be prompted to set the upper
(end) frequency limit, via the numeric keypad, where the
sweep will end.
D. Press the EXIT hardkey.
EXIT
@
L
The rate of the sweep can be either logarithmic or linear in the frequency domain. Whenever one of the
parameters of the sine generator is changed,
E. Press the softkey [L] to select between Log and Lin.
Log Mode
When the Log mode is selected the sweep rate (decade/second)
is controlled by pressing R.se [C] and R.es [D].
2-16
rta_3200_training.book Page 17 Monday, March 2, 1998 11:00 AM
3200 TRAINING MANUAL
Lin Mode
When the Lin mode is selected the sweep rate is still controlled
by pressing the softkeys [C] and [D], but in this mode the sweep
rate is in time (seconds) instead of a rate.
As mentioned above, press T.se [C] and T.es [D] to enter the
desired start to end and end to start sweep times.
F. Press L.se [E] and L.es [F] to adjust the output level, start
to end and end to start.
G. Press @START [I] or @END[J] to assign the sweep to
begin at the pre-selected start frequency or end frequency.
!
K
H. Press SWEEP [K] to initialize or pause the sweep.
2-17
rta_3200_training.book Page 18 Monday, March 2, 1998 11:00 AM
3200 TRAINING MANUAL
Dual Tone
The signal generator has the capability to activate a second tone
that will sweep simultaneously with the original tone. To look at
the signal generator output on the screen, you will have to put a
cable between the Sig Out on the back of the 2900B to one of the
2900B inputs.
%
N
W
G
I. Press the 2-tone [N] key to activate the dual tone.
J. Press the L1 [G] key to adjust the level of the first tone.
The Sum Of The Relative Amplitudes Of The Two Tones
Are Set Equal To One, So The Relative Amplitude Of The
Second Tone Will Be Given By The Relationship L2 = (1 L1). Setting L1 To 0.5 Will Result In Both Tones Having
Equal Amplitudes. Once Setup, Both Tones Can Be Swept
In The Same Manner As A Single Tone.
X
H
2-18
K. Press the ∆F [H] to select the separation, in cycles,
between the two tone.
rta_3200_training.book Page 19 Monday, March 2, 1998 11:00 AM
3200 TRAINING MANUAL
L. Press 1-tone [N] to return to the single tone mode.
%
N
Autolevel Control (Auto-L [O])
[
O
This feature is used with the dual channel Model 2900B
to perform calibration of accelerometers and microphones. For accelerometer testing, the output of the sine
generator is used to drive a shaker, upon which are
mounted both a reference accelerometer and a test accelerometer. The signal from the reference accelerometer is
connected to the Channel 1 input and the signal from the
accelerometer under test is connected to the Channel 2
input. The instrument is set to the STAND 2 Mode with
FFT filtering active and the Max level selected for display.
M. Press Exit to return to the signal generator screen.
PINK [J]
The Wideband Pink Noise Menu, shown below, is accessed
from the Signal Generator Menu by pressing PINK [J] .
Z
J
Pink noise has equal energy per percentage bandwidth
(e.g., octave or 1/3 octave). As with the sine generator, the
level is set using the softkey LEVEL [E] and entering a
value between 0 and .9999 using the numeric keypad.
2-19
rta_3200_training.book Page 20 Monday, March 2, 1998 11:00 AM
3200 TRAINING MANUAL
The keys <-ATTEN [G] and ->ATTEN [H] will produce
attenuation or reduction in attenuation in 20 dB increments, also as described for the sine generator.
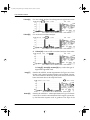
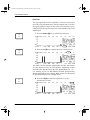
When 1/3 octave digital filters have been selected, the
generator can also produce 1/3 octave bandlimited pink
noise. From the Broadband Pink Noise Menu, the Bandlimited Pink Noise Menu, shown below, is accessed by
pressing 1/3 [A] .
As with the wideband pink noise, the key LEVEL [E] is
used to set the relative output level of the signal, and the
keys <-ATTEN [G] and ->ATTEN [H] are used to add and
remove attenuation at all frequencies in increments of 20
dB. The keys ALL [I] and NONE [J] are used to turn On
or Off the noise in all 1/3 octave bands simultaneously.
The On/Off status of the noise in individual bands can
also be set on a band-by-band basis, using the keys
ON [C] and OFF [D] to set the status of the band indicated by the active cursor. In this manner, noise can be
generated for any combination of 1/3 octave bands, contiguous or not.
When using the analyzer to measure the spectrum of the
noise generated, the user should bear in mind the effect of
filter selectivity (due to filter skirts not being perfectly vertical) on the measured spectrum. For example, with noise
generated in a single band, the measurement will produce
a spectrum indicating noise in the two adjacent sidebands
at levels approximately 17 dB lower. This phenomenon is
associated with the measurement process only, and does
not represent the much more accurate bandlimited noise
actually being produced.To return to the Wideband Pink
Noise Menu, press WIDE [A], then press Exit to signal
generator window.
2-20
rta_3200_training.book Page 21 Monday, March 2, 1998 11:00 AM
3200 TRAINING MANUAL
White [K]
!
K
The Wideband White Noise Menu, shown below, is
accessed from the Signal Generator Menu by pressing
WHITE [K] .
White noise has equal energy per constant bandwidth
(e.g., narrowband FFT analysis). To view the change, go
back to the System menu, press FILTER, and choose 800
line FFT, press EXIT and go back to Signal Generator.
Wideband white noise can be used with either digital filters or FFT analysis. The LEVEL [E], <-ATTEN [G] and
->ATTEN [H] keys are used in the same manner as
described above for the pink noise generator.
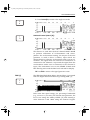
When FFT analysis has been selected, a pseudo-white
noise output is possible. The Pseudo-White Noise Menu,
shown below, is accessed from the White Noise Menu by
pressing the key PSEUDO [A].
When FFT analysis is taking place, the analysis represents a finite number of frequency bands based on the
number of lines selected for the measurement (100, 200,
400 or 800). It is not really necessary, therefore, for the
generator to produce a truly wideband signal. In the
pseudo-white noise mode, the signals are generated at the
center frequency of each of the bands represented by the
lines of the frequency analysis. This permits the generator
output power to be concentrated on the same frequencies
which are being measured by the FFT analysis, even when
zoom analysis is being performed.
2-21
rta_3200_training.book Page 22 Monday, March 2, 1998 11:00 AM
3200 TRAINING MANUAL
PULSE [L]
The Pulse Generator Menu, shown below, is accessed
from the Signal Generator by pressing PULSE [L].
@
L
A series of either positive or negative pulses can be generated from this menu. The status of the generator is indicated briefly by a message on the upper right of the screen
whenever one of the keys is pressed. The key POS/
NEG [B] will toggle the polarity between positive and negative going pulses, as indicated on the upper right of the
screen. The time increment for which the pulse is Positive
or Negative, in milliseconds, is set by pressing T.on [C] ,
entering a value using the numeric keypad and pressing
ENTER . The time increment for which the pulse is to have
a zero value, in milliseconds, is set by pressing T.off [C] ,
entering a value using the numeric keypad and pressing
ENTER . The LEVEL [E] key is used to set the output in
the same manner as explained in the preceding sections.
Selecting Analog Input Filters
The analyzer has the capability of adding High Pass and Low
Pass analog filters to the Spectrum to cutoff any unwanted frequencies without limiting the bandwidth of the instrument.
!
K
2-22
1. Press the INPUT [K] key from the System menu.
rta_3200_training.book Page 23 Monday, March 2, 1998 11:00 AM
3200 TRAINING MANUAL
2. Select one of the following analog filters:
A-WGT [I]
A-Weighting.
C-WGT [J]
C-weighting.
Linear [K]
Linear with selectble highpass and lowpass filters.
∫dt [L]
∫∫dtdt [M]
Single time integration.
Double time integration.
3. To select the high pass and low pass filters press the Hi⁄Lo Hz
[G] key.
The analog filters selected are identified on the right side of the
display.
4. Press the EXIT hardkey to return to the SYSTEM menu.
EXIT
2-23
rta_3200_training.book Page 24 Monday, March 2, 1998 11:00 AM
3200 TRAINING MANUAL
Setting the Clock
The analyzer has a built in internal real time clock for time
stamping measurements.
@
L
1. Press the clock [L] key.
The following prompt will appear on the upper right of the display “DD/MM/YY HH:MM:SS” prompting you to enter the
current time and date via the numeric keypad.
EXIT
2. Press the EXIT hardkey after entering the time and date to
return to the SYSTEM Menu.
The new time and date will appear on the upper left side of
the display.
Activating the External Color Monitor: (LD Model 2500 Color Video
2-24
rta_3200_training.book Page 25 Monday, March 2, 1998 11:00 AM
3200 TRAINING MANUAL
Adaptor required)
The Model 2500 Color Video Adaptor permits the analyzer to
communicate with an external color monitor (EGA, VGA, or
Super VGA) via the printer port of the analyzer.
1. Press the COLOR [M] key.
#
M
2. Press one of the following keys to select the proper resolution of the monitor being used.
640X350 [B]
For EGA Monitors
640X480 [C]
For VGA Monitors
800X600 [D]
For Super VGA Monitors
3. Press one of the following keys to select the number of data
display windows to appear on the monitor.
SINGLE [I]
Single data display window
DUAL [J]
Two data display windows
QUAD [K]
Four data display windows
LCD [L]
This will display a reproduction of the display on the analyzer.
2-25
rta_3200_training.book Page 26 Monday, March 2, 1998 11:00 AM
3200 TRAINING MANUAL
4. Press the OFF [A] key when finished using the external monitor.
Q
A
5. Press the EXIT hardkey to return to the SYSTEM Menu.
EXIT
Resets
You can reset data and setups stored in the internal memory of
the analyzer.
To reset data or setups:
1. Press the RESETS [P] key.
]
P
2. Press one of the following keys to perform the desired reset:
R.MEMRY [A]
2-26
This will perform a reset of the internal RAM of the instrument
and clear out all stored data and all user-defined setups bringing
the unit to a default state.
R.UNITS [B]
This will perform a reset of the user-defined Units only.
R.SETUP [C]
This will perform a reset of the user-defined Setups only.
rta_3200_training.book Page 27 Monday, March 2, 1998 11:00 AM
3200 TRAINING MANUAL
R.RT60 [D]
This will perform a reset of the RT60 data only.
R.USER [E]
This will perform a reset of the user-defined Weighting curves
only.
R.MACRO [F]
R.STATS [G]
This will perform a reset of the user-defined Macros only.
This will perform a reset of the Statistics tables only.
After pressing one of the above mentioned keys, a message will
appear on the upper right side of the display “*ARE YOU
SURE?*” to make sure that you really want to perform the
RESET.
3. Press either the YES[A] key or the NO[C] key.
The RESET will be performed if you press the YES key. If you
press the NO key, the RESET will not be performed and you
will be returned to the Reset menu.
4. Press the EXIT hardkey to return to the System Menu.
EXIT
2-27
rta_3200_training.book Page 28 Monday, March 2, 1998 11:00 AM
3200 TRAINING MANUAL
2-28
rta_3200_training.book Page 1 Monday, March 2, 1998 11:00 AM
CHAPTER
3
Shift Menu
Defining a reference spectrum
In some applications it is desirable to compare two spectra, or to
display spectra relative to some user-defined spectrum.
The spectrum which is to be defined as the reference spectrum
must first be displayed on the analyzer. In most cases this would
be a spectrum that has been stored to the memory of the analyzer. If the desired reference spectrum has not been stored to
the memory do so now by pressing the STORE hardkey, then
press the RECALL hardkey to bring the spectrum to the display.
SHIFT
1. Press the SHIFT hardkey to activate the Shift Menu (This
menu will only be active for 6 seconds, it will then return to
the menu prior to pressing the Shift key.
3-1
rta_3200_training.book Page 2 Monday, March 2, 1998 11:00 AM
3200 TRAINING MANUAL
[
O
2. Press the SetREF [O] key to assign the displayed spectrum
as the reference.
The spectrum will be placed to zero across all frequency bands,
and the vsRef indicator will appear on the upper left side of the
display.
RESET
R/S
%
N
3-2
3. Press the R/S key. Note that how the current data are being
compared to the reference spectrum. If the data in any of the
frequency bands are greater than that of the reference spectrum, the level will be above the “00” db line. If the data in
any of the frequency bands is less than the reference spectrum, the level will be below the “00” reference line.
If you desire that both Channel 1 and Channel 2 have a reference spectrum assigned at the same time press the
SameREF [N] key. This will assign a spectrum as a reference
rta_3200_training.book Page 3 Monday, March 2, 1998 11:00 AM
3200 TRAINING MANUAL
to ch. 1 and ch.2. As new data is analyzed you may switch
between ch.1 and ch.2 and view the comparison of the new
spectrum to the respective reference spectrum.
4. Press the SHIFT hardkey, then the vsREF [P] key to return to
a normal display format.
SHIFT
]
P
Changing from a logarithmic scale to a linear scale
1. Press the SHIFT hardkey to enter the shift menu.
SHIFT
2. Press the Y-AXIS [B] key to change the y-axis.
The following menu appears:
LIN/LIN [A]
LOG/LOG [B]
Changes Y-axis to a linear scale and cursor reads out linear.
Changes Y-axis to a log gradations and cursor reads out log.
3-3
rta_3200_training.book Page 4 Monday, March 2, 1998 11:00 AM
3200 TRAINING MANUAL
LIN/LOG [C]
SQU/LOG [D]
Changes Y-axis to a linear scale and cursor reads out log.
Changes Y-axis to squared linear gradations and cursor reads out
log; useful for display of power spectral density.
Changing the Vertical and Horizontal Zoom
To change the scaling and offset of the display select one of the
following keys:
V.SCALE [C]
User selectable zoom factor from 1 to 8.
V.OFSET [D]
User selectable offset. Use the horizontal arrow keys to shift the
window in multiples of 10 dB.
H.SCALE [E]
User selectable zoom factor from 1 to 8.
H.OFSET [F]
User selectable offset. Use the horizontal arrow keys to shift the
window.
To check the analyzer battery:
3-4
rta_3200_training.book Page 1 Monday, March 2, 1998 11:00 AM
CHAPTER
4
Basic Acoustics
4-1
rta_3200_training.book Page 2 Monday, March 2, 1998 11:00 AM
3200 TRAINING MANUAL
4-2
rta_3200_training.book Page 3 Monday, March 2, 1998 11:00 AM
3200 TRAINING MANUAL
4-3
rta_3200_training.book Page 4 Monday, March 2, 1998 11:00 AM
3200 TRAINING MANUAL
4-4
rta_3200_training.book Page 5 Monday, March 2, 1998 11:00 AM
3200 TRAINING MANUAL
4-5
rta_3200_training.book Page 6 Monday, March 2, 1998 11:00 AM
3200 TRAINING MANUAL
4-6
rta_3200_training.book Page 7 Monday, March 2, 1998 11:00 AM
3200 TRAINING MANUAL
4-7
rta_3200_training.book Page 8 Monday, March 2, 1998 11:00 AM
3200 TRAINING MANUAL
4-8
rta_3200_training.book Page 9 Monday, March 2, 1998 11:00 AM
3200 TRAINING MANUAL
4-9
rta_3200_training.book Page 10 Monday, March 2, 1998 11:00 AM
3200 TRAINING MANUAL
4-10
rta_3200_training.book Page 11 Monday, March 2, 1998 11:00 AM
3200 TRAINING MANUAL
4-11
rta_3200_training.book Page 12 Monday, March 2, 1998 11:00 AM
3200 TRAINING MANUAL
4-12
rta_3200_training.book Page 13 Monday, March 2, 1998 11:00 AM
3200 TRAINING MANUAL
4-13
rta_3200_training.book Page 14 Monday, March 2, 1998 11:00 AM
3200 TRAINING MANUAL
Using the Model 3200 as a Sound Level Meter in Standard
Analysis Mode
One may wish to use the 3200 RTA to measure Sound Pressure
Levels in the analysis mode. Although this method does not
meet ANSI S1.4-1983 or IEC 651 or IEC 804 standards for Sound
Level Meter instrumentation, the results will be sufficiently
accurate.
Setting up the 3200
For this example, we will use the1Channelanalysis mode of the
Model 3200. It should be understood that using the
2Channelanalysis mode of the 3200 will provide two channel
measurements of Sound Pressure Levels. Before we begin setting the parameters in the RTA, connect the microphone preamplifier/microphone to channel one of your 3200.
4-14
rta_3200_training.book Page 15 Monday, March 2, 1998 11:00 AM
3200 TRAINING MANUAL
SCREEN
SYSTEM
S
C
1. From the SYSTEM menu, press #Chanls [A] and then
#Chanls to select single channel analysis.
Q
A
W
G
R
B
2. If the filters in your analyzer are not set for 1/3 octave band
analysis, press FILTER[G] to enter the filter menu area.
3. Press 1/3oct[B] to enable to 1/3 octave band digital filters.
4. Press EXIT to return to the SYSTEM menu.
EXIT
!
K
5. Typically, for Sound Pressure Level measurements, one
would use either A or C analog weighting filters when gathering data. For this example, let’s enable the A-weighting filter. Press INPUT[K] to enter the INPUT menu area.
4-15
rta_3200_training.book Page 16 Monday, March 2, 1998 11:00 AM
3200 TRAINING MANUAL
Y
I
EXIT
EXIT
X
H
S
C
X
H
4-16
6. Within the INPUT menu, press A-WGT[I] to activate the AWeighting filter.
7. Press EXIT to return to the SYSTEM menu.
8. Next, we need to establish a detector type and averaging
time to simulate the slow or fast detector response time of a
sound level meter. Press EXIT again to enter the STANDARD
feature menu.
9. Within this menu, Press DETECTR[H] to enter the detector
setup menu.
10. Press EXP[C] to enable the exponential detector.
11. Next, we need to establish the exponential detector averaging time or rate. Press AV.TIME[H] to enter the detector averaging time menu.
rta_3200_training.book Page 17 Monday, March 2, 1998 11:00 AM
3200 TRAINING MANUAL
T
D
EXIT
W
G
12. Within this menu, you need to choose a detector time (integrating time) that would either simulate a slow or fast detector rate. If one wishes to simulate a fast detector rate, then
1⁄8[D] seconds should be selected. For a slow detector rate,
1[G] second is the choice. For this example, we will use a
slow detector rate. Press 1[G].
13. Press EXIT to return to the MAIN menu.
V
F
14. During the measurement, we will want to view the overall
summation band for the Sound Pressure Measurement. Press
DISPLAY[F] to enter the Display menu.
U
E
15. Press SUM[E] to enable the linear summation feature. At the
right of the display you will see a sigma symbol followed by
an = sign.
16. Press EXIT to return to the Main menu.
EXIT
4-17
rta_3200_training.book Page 18 Monday, March 2, 1998 11:00 AM
3200 TRAINING MANUAL
Sound Pressure Level measurement
To make a Sound Pressure Level Measurement:
RESET
R/S
R
B
S
C
4-18
1. Press the R/S to initiate a measurement. Notice on the display you will see an A-Weighted 1/3 octave band spectrum
that is being integrated over a one second duration. Notice
also that the summation value at the right is showing numerically the overall Sound Pressure Level (summation of all of
the 1/3 octave bands).
2. To view the Leq during the runtime, press Leq[B]. You will
notice the Leq spectrum on the left and the overall (summed)
Leq value on the right of the display.
3. To view the MIN during the runtime, press MIN[C]. You will
notice the MIN spectrum on the left. This is a spectrum
showing the minimum value that occurred in each 1/3
octave bin during the time of the test. The overall MIN value
on the right of the display is the summation of these MIN
bands.
rta_3200_training.book Page 19 Monday, March 2, 1998 11:00 AM
3200 TRAINING MANUAL
T
D
U
E
4. To view the MAX during the runtime, press MAX[D]. You
will notice the MAX spectrum on the left. This is a spectrum
showing the maximum value that occurred in each 1/3
octave bin during the time of the test. The overall MAX value
on the right of the display is the summation of all of the
MAX bands.
5. Last, to view the SEL during the runtime, press SEL[E]. You
will notice the SEL spectrum (normalized to 1 second) on the
left and the overall (summed) SEL value on the right of the
display.
4-19
rta_3200_training.book Page 20 Monday, March 2, 1998 11:00 AM
3200 TRAINING MANUAL
4-20
rta_3200_training.book Page 1 Monday, March 2, 1998 11:00 AM
CHAPTER
5
Macros
The operation of the analyzer can be simplified by the use of the
user-defined key macros. Each macro permits the user to define
up to fifty sequential key presses, and when executed will simulate the manual key press operation of the analyzer.
Defining macros
It is recommended to begin from the Main Menu of the analyzer.
Press the EXIT hardkey until you have returned to the Main
Menu.
, SPACE
MACRO
Q
A
1. Press the MACRO hardkey to enter the Macro Define mode.
The message “MACRO: Select [0]-[9] or [-] Create, [STO]
Store” will appear on the upper right side of the display.
2. Press the “A” minus key to create the macro.
5-1
rta_3200_training.book Page 2 Monday, March 2, 1998 11:00 AM
3200 TRAINING MANUAL
The message “Define MACRO I-P?” will appear on the
upper right side of the Display.
3. Press a letter “I-P” to assign where the macro will be stored.
For this example press the letter “K”.
Alpha characters A-P will appear across the top and bottom
of the display. To select the rest of the alpha characters, press
the Shift hardkey and Q-Z will appear. A flashing cursor will
also appear in the upper right hand corner of the display
after the message “Enter macro name:”.
4. Begin entering the name of the macro. If you make a mistake
entering the text you can move the cursor with the left and
right arrow keys, then press the SPACE hardkey to erase the
last character.
5. Begin defining the macro, by pressing the following keys:
5-2
-
DETECTR [H]
-
LIN.S [A]
-
AV.TIME[H]
-
Enter “5 seconds” for the detector time.
-
EXIT hardkey (twice)
-
System hardkey
-
Filter [G]
-
400line [K]
-
EXIT hardkey
-
SPACE hardkey
-
R/S hardkey
rta_3200_training.book Page 3 Monday, March 2, 1998 11:00 AM
3200 TRAINING MANUAL
6. Press the”-” minus key. This will terminate the definition of
the macro.
+
-
There are four special Macro keys that can be found by
pressing the SHIFT hardkey. They are labeled McStop [I],
McWait [J], McRept [K], McStart [L]. These special Macro
keys are typically used for special applications.
SHIFT
McStop [I]
Will cause the macro processor to pause during its execution until the analyzer is in the STOP state, at which time the execution
will continue.
McWait [J]
Used to provide a wait state during the execution of a macro.
McRept [K]
Used to generate a repeat of the macro. When this is used, the
macro will continue to be repeated until the analyzer is stopped
manually by pressing the SPACE hardkey.
McStart [L]
Sets the analyzer up with a time and date for the macro to start.
Executing Macros
To execute a defined Macro the analyzer must be in the menu
where the Macro was initially defined, (i.e. Main Menu, System
Menu). The error message “Macro Menu Mismatch” will appear
if the analyzer is not in the menu where the menu was initially
defined.
1. Press the MACRO hardkey to enter the Macro field.
, SPACE
MACRO
5-3
rta_3200_training.book Page 4 Monday, March 2, 1998 11:00 AM
3200 TRAINING MANUAL
The message “MACRO: Select [0]-[9] or [-] Create, [STO]
Store” will appear on the upper right side of the display.
!
K
2. Press a letter (I-P) where the Macro was stored. For this
example press the letter “K” key.
The Macro that was assigned to key 1 in the previous step,
(Defining Macros), will immediately be executed upon
pressing the numeric key.
Storing Macros
After defining a marco to one or all of the ten registers 0-9, you
may store them as a set of Macros as a file to the memory of the
analyzer.
&
STORE
5-4
1. To do this press the STORE hardkey.
The message “Store-Macros Data XX” will appear on the
upper right side of the display. This indicates that the Macros
have been stored as a file to the memory of the analyzer and
have been assigned a record number xx.
rta_3200_training.book Page 1 Monday, March 2, 1998 11:00 AM
CHAPTER
6
Printing
The analyzer can print any displayed data directly to an Epson
compatible, Canon BubbleJet, or Hewlett-Packard LaserJet
printer equipped with graphics capability and a Centronics parallel interface.
Before printing you will want to make certain that the desired
spectrum has been recalled from memory, or is currently displayed on the analyzer.
1. Connect the printer to the printer port on the right side of the
analyzer.
?
PRINT
W
G
2. Press the PRINT hardkey.
3. Press the TYPE [G] key to select the type of printer being
used. The analyzer has a list of printer drivers ranging from
Epson compatibles to HP Laserjet printers.
6-1
rta_3200_training.book Page 2 Monday, March 2, 1998 11:00 AM
3200 TRAINING MANUAL
4. Highlight the desired printer driver and press the EXIT hardkey.
EXIT
[
O
5. Press the init [O] to initialize the printer. If the printer was
hooked up to the analyzer when it booted up the initialization is performed as part of the boot up procedure.
V
F
6. (optional) Press the LOGO [B] key to create a user-defined
logo that will be printed as a heading on top of each printout
from the analyzer. The default logo is Larson•Davis.
7. Press one of the following keys to print a desired data record:
screen [A]
table [B]
all [C]
List [H]
6-2
Prints the display presently on the LCD screen of the analyzer.
Prints the data presently on the display in a tabular form.
Prints both the data presently on the LCD screen and a data table
representing the data being displayed.
Prints the data table to the screen instead of a printer.
rta_3200_training.book Page 3 Monday, March 2, 1998 11:00 AM
3200 TRAINING MANUAL
video [E]
Prints a black and white printout of the display shown on the optional Model DVX001 Color Video Adaptor.
8. Press the EXIT hardkey to return from the Print Menu.
EXIT
6-3
rta_3200_training.book Page 4 Monday, March 2, 1998 11:00 AM
3200 TRAINING MANUAL
6-4
rta_3200_training.book Page 1 Monday, March 2, 1998 11:00 AM
CHAPTER
7
Vibration Measurements
The following is a procedure for setting up the Model 3200 Real
Time Analyzer’s (RTA’s) for basic vibration measurements. In
this exercise, we will use the FFT (narrowband) analysis feature
of the analyzer. We will setup the RTA for a single channel measurement with the understanding that dual channel vibration
measurement is a simple extension. Cross channel measurements, such as cross spectra, transfer functions, coherence functions, etc. will not be addressed in this section.
Creating a Measurement File
[
O
Q
A
1. Before starting any test, it is always a good idea to establish a
new measurement file. Data records that are measured will
be stored in this measurement file. After turning on the
power to your RTA, press FILES [O].
2. Within the files menu, press create [A] to make a new data
file.
7-1
rta_3200_training.book Page 2 Monday, March 2, 1998 11:00 AM
3200 TRAINING MANUAL
3. You are now being prompted to define a name (8 characters
or less) for the data file. For this example, type in VIB1. To do
this, press the softkey above or below the display. To access
alpha keys beyond P, press the SHIFT hardkey once, then
the desired letter.
EXIT
4. Numeric entries are entered using the numeric hardkeys on
the keyboard. After you have typed in VIB1, press EXIT.
Notice at the lower left corner of the display, the VIB1 filename appears. This indicates that measurement records
stored in the future will be placed in the VIB1 measurement
file.
Setting up the FFT
R
B
7-2
1. The next step is to configure the RTA to acquire single channel, FFT data. First, press SYSTEM. Select #Chanls [A] to
enable the single channel capabilities of the Model 3200.
rta_3200_training.book Page 3 Monday, March 2, 1998 11:00 AM
3200 TRAINING MANUAL
W
G
2. To configure the RTA for FFT (narrowband) analysis, first
press FILTER [G].
3. Within the filter menu, notice that the keys on the top of the
measurement display correspond to the full octave and 1/3
octave analysis features. The keys on the bottom of the display relate to the FFT capabilities of the RTA. Keys
100line [I] thru 800line [L] are used to select the resolution of
the FFT (100 line, 200 line, 400 line, or 800 line). Select
800line [L] to choose 800 line resolution.
[
O
4. The next item to establish is the frequency range or analysis
baseband. This is the maximum frequency of interest for the
test item. Press BASE-Bd [O] to access the baseband options.
7-3
rta_3200_training.book Page 4 Monday, March 2, 1998 11:00 AM
3200 TRAINING MANUAL
T
D
5. Within the baseband menu, you will be prompted in the
upper right hand corner of the screen to “select UPPER
BAND EDGE” frequency. Press 2.5kHz [D].
The frequency scale on the horizontal axis will immediately
change to reflect this selection.
Background on FFT Windows
Windows are used to prevent spectral leakage. Without getting
into a long discussion about FFT theory, leakage is a phenomena
that can occur as a result of the certain assumptions of the Fast
Fourier Transform algorithm. As you may or may not know, FFT
analyzers capture time blocks of data, assumes they are periodic,
and then applies the FFT algorithm to transform the data blocks
into the frequency domain.
If the time signals that are processed are not periodic, as in the
case of a sine wave that has not completed an integral number of
cycles, the energy from the “non-captured” portion of the signal
leaks into adjacent spectral line in the frequency domain. The
result is a distorted frequency spectrum. Leakage also occurs
when measuring transients that are not entirely captured in the
time block, and when characterizing random signals.
The Larson•Davis Model 2900B offers a variety of window
choices. Each has its relative strengths and weaknesses. In general, the Hanning window is preferred when one is measuring
periodic (cyclical) signals, or random signals. The drawback to
the Hanning window is that it can attenuate the signal ampli-
7-4
rta_3200_training.book Page 5 Monday, March 2, 1998 11:00 AM
3200 TRAINING MANUAL
tude. If amplitude accuracy is critical, a flat top window can be
used. The drawback with the flattop window is that you may
lose the ability to resolve small signals that are in the presence of
larger signals. The rectangular window is the preferred choice
when measuring transients. The zeropad window should be
used when doing autcorrelation and crosscorrelation measurements. The Impact and Exponential windows in the 3200 are
used only when one is performing impact (hammer) measurements as in the case when one is measuring transfer functions
(frequency response functions) for a modal test.
Selecting an FFT Window
%
N
R
B
EXIT
1. Press WINDOW [N] to enter the window selection menu.
2. The Hanning window is the most common choice for general vibration measurements, so press HANNING [B].
3. The last item of interest in the filter menu is FFTZOOM. We
will delve into this powerful function later. Press EXIT to
leave the filter menu.
7-5
rta_3200_training.book Page 6 Monday, March 2, 1998 11:00 AM
3200 TRAINING MANUAL
Selecting the High and Low Pass Filters
The default high and low pass filter setting for the RTA are typically 20Hz and 20kHz as can be verified by looking in the appropriate field on the right of the display.
!
K
1. In general, vibration data of interest tends to be in the lower
frequencies. Let’s modify the high and low pass filters to
reflect this desire by pressing INPUT [K].
#
M
2. Press the 1-10k [M] high/low pass filter option. This establishes the high pass filter at 1Hz (actual roll off starts at about
0.8 Hz) and the low pass filter at 10 kHz.
EXIT
7-6
3. Notice that this selection is now reflected on the right portion of the measurement display. Press EXIT to leave the
input menu.
rta_3200_training.book Page 7 Monday, March 2, 1998 11:00 AM
3200 TRAINING MANUAL
Selecting Units
Now let's establish the measurement units and calibration for
the transducer that will be used to measure the vibration. The
most common transducer used for measuring vibration is an
accelerometer. For this example, we will set our acceleration
units to be in g's understanding that we could easily make it
meters per second squared, feet per second squared, etc.
V
F
1. Press UNITS [F] to enter the units field.
2. The softkey selections at the bottom of the measurement display relate to the unit name that we would like the measurement amplitudes to be displayed. The softkeys [K] thru [P]
are undefined fields. You can assign any unit label that you
like to each of the six keys. Let's assign the unit label G to
softkey [K]. To do this, first push name [B].
!
K
V
F
3. You are then prompted to select one of the six undef name
keys. Press undef [K].
4. You will now see a number of alpha character choices above
and below the display. Since we will be measuring vibration
in G's, type in the letter G [G] followed by 5 presses of the
7-7
rta_3200_training.book Page 8 Monday, March 2, 1998 11:00 AM
3200 TRAINING MANUAL
SPACE key to clear the remaining characters. You can also
press SHIFT and then CLEAR to clear the unit entry field,
then press the letter G [G].
!
K
5. Press EXIT to enter this unit name. Select G [K] to enable the
unit label G.
Notice that the unit label, G, appears in the right portion of the
display. Note that the unit label, G, has been assigned to the [K]
key.
Calibration
Calibration values of the accelerometer (or any other transducer)
can be entered in several ways in the RTA. The easiest way is to
enter the sensitivity or calibration value directly from the calibration paperwork that came with the transducer. In the case of
an accelerometer, this may be a certain number of millivolts per
g (mV/g).
7-8
rta_3200_training.book Page 9 Monday, March 2, 1998 11:00 AM
3200 TRAINING MANUAL
V
F
1. If the number was 10 mV/g, you would enter this by first
pressing mV cal [F].
2. At the “Enter mV/unit” prompt, type in 1.000 E+01 using
the numeric keys on the RTA keypad (use the Shift key then
“+” key to enter a +).
EXIT
3. Then press EXIT to enter the value. Assuming that the sensitivity value from the transducer paperwork was still valid,
we would now be calibrated and ready to make vibration
measurements.
Another way to calibrate the RTA is to utilize a shaker calibrating device that puts out a known vibration level at a specific frequency. These are manufactured by a number of transducer
manufacturers.
To calibrate the 2900B2800B with an exciter, attach the transducer firmly to the exciter head. The transducer output will go
directly into the analyzer or via a power supply (depending on
the type of transducer and connectors available).
RESET
R/S
4. The calibrator that is being used for this example outputs a
signal of 1.0 grms at 81.25 Hz. Turn on the calibrator. Press
R⁄S to run the RTA. The 81.25 Hz calibration signal will
appear in the measurement display.
cal signal
7-9
rta_3200_training.book Page 10 Monday, March 2, 1998 11:00 AM
3200 TRAINING MANUAL
5. Press the up or down arrow on the keypad to optimize the
range. One way to do this is to range down one increment at
a time until an overload is reached. Then range up one or
two increments.
RESET
R/S
6. Notice the prominent signal at the calibration frequency
(81.25 Hz). After the signal has stabilized, press R/S to stop
the measurement.
cal signal
7. Move the active cursor to the calibrator frequency (81.25 Hz)
by pressing the horizontal arrow keys. You can accelerate the
movement of the cursor by holding SHIFT and pressing the
desired arrow key at the same time.
U
E
7-10
8. At this point, we should take advantage of the RTA’s horizontal expansion feature. This will expand the display so
that the calibration signal can be viewed in more detail. Press
SHIFT and then H.SCALE[E] to activate this feature.
rta_3200_training.book Page 11 Monday, March 2, 1998 11:00 AM
3200 TRAINING MANUAL
9. Within the H.SCALE menu, you have a number of choices
for the scale multiplier. Choose 4[C] to select the 4 times multiplier.
S
C
The display is now expanded by a factor of 4. Since we plan
to enter the calibrator level (1.0 grms) in linear units, we need
to change the vertical scale to linear (from the default logarithmic scale).
SHIFT
R
B
10. Press SHIFT and immediately select Y-AXIS [B].
This feature toggles between linear and log vertical scaling.
Notice that the vertical scale is now in linear units.
Linear scale
V
F
11. Press SYSTEM and then UNITS [F] to return to the units
menu. Press level [H]
7-11
rta_3200_training.book Page 12 Monday, March 2, 1998 11:00 AM
3200 TRAINING MANUAL
12. Enter the output level (in linear units) of your calibrator. The
level is entered in engineering notation. For this example,
enter 1.0 grms as 1.000 E00. This will actually be entered as
100000. Then press EXIT.
EXIT
13. To check the calibration, make sure the calibrator is still on,
then press R/S to run the RTA.
RESET
R/S
SHIFT
R
B
14. The level at the cursor position should read about 1.0 grms.
This represents the reference level. In other words, on a logarithmic scale, this would be 0 dB. Return to logarithmic (dB)
scale by pressing SHIFT and then Y-AXIS [B].
Once you have returned the display to a logarithmic vertical
scale, notice that the calibration level is indeed 0 dB.
RESET
R/S
7-12
15. Press R/S to stop the measurement. Now disconnect the
transducer from the calibrator, and then attach it to the test
structure from which you wish to acquire vibration measure-
rta_3200_training.book Page 13 Monday, March 2, 1998 11:00 AM
3200 TRAINING MANUAL
ments. Next, let’s change the horizontal scaling back to full
scale. Press SHIFT and H.SCALE [E] to enter the horizontal
scale menu.
16. Change the scale multiplier to 1 by pressing 1[A].
Averaging
When possible, vibration measurements should be acquired
using a linear average over a finite amount of time. Averaging
will improve the quality of the measurement by negating the
contribution of nonlinearities, and external random noise. Normally, the longer that you average, the better the measurement
quality.
EXIT
1. To establish linear averaging, press EXIT twice, and then
choose DETECTR [H].
7-13
rta_3200_training.book Page 14 Monday, March 2, 1998 11:00 AM
3200 TRAINING MANUAL
2. Press LIN.S [A] to enable linear single averaging.
Q
A
X
H
EXIT
3. Next choose AV.TIME [H] to select the measurement averaging time.
4. For this example, select a 20 second averaging time (detector
time) by typing 000020.0000 using the alpha keys on the RTA
keyboard. Then press EXIT to enter the number.
Notice that the right side of the display reflects the averaging
options that we've selected. Now we're ready to take “real”
vibration measurements.
7-14
rta_3200_training.book Page 15 Monday, March 2, 1998 11:00 AM
3200 TRAINING MANUAL
RESET
R/S
5. Press R/S to begin the measurement process. Use the up and
down arrows to optimize the range setting as we did during
calibration.
After 20 seconds, the measurement is complete. At this point,
you could choose to save the data, print it, clear it, or take it
over again.
Zoom Processing
SCREEN
SYSTEM
W
G
A very powerful feature of the RTA is the FFTZOOM feature.
FFTZOOM allows one to apply the full FFT resolution (in the
current case: 800 lines) to a small frequency range. This is particularly useful if one is interested in acquiring detailed frequency
information within a relatively small band (say 1200 Hz to 1800
Hz). With FFTZOOM, you can apply all 800 lines of resolution to
this section.
1. Press SYSTEM to return to the main System menu.
2. Choose FILTER [G] to enter the filter menu.
7-15
rta_3200_training.book Page 16 Monday, March 2, 1998 11:00 AM
3200 TRAINING MANUAL
#
M
S
C
RESET
R/S
3. Before selecting the zoom multiplier, first move the cursor to
a center frequency about which you would like to apply the
zoom. For the example, move the cursor to 1650 Hz. Then
press FFTZOOM [M].
4. Notice that you have a number of zoom multiplier options
from which to choose. Select 4 [C] for this example.
5. Note that the frequency span has changed. It is now 1337.5
Hz to 1962.5 Hz. All of our 800 lines of frequency resolution
will be applied to this 625 Hz span. Press R/S to begin
another measurement. After 20 seconds, the measurement
will be complete.
new frequency range
In this measurement, it should be clear that we have
achieved much greater detail of the of the data within this
reduced frequency range.
Integration and Double Integration
A common goal in the measurement of vibration is to extrapolate velocity or displacement values from accelerometer data.
7-16
rta_3200_training.book Page 17 Monday, March 2, 1998 11:00 AM
3200 TRAINING MANUAL
This can be done in the RTA by using the integration and double
integration functions. Let’s first change our zoom factor back to
1 so that we can view the entire 0 Hz to 2.5 kHz baseband.
Q
A
SCREEN
SYSTEM
Q
A
1. Press 1 [A] from within the FFTZOOM window.
2. Press SYSTEM to exit back to the main system menu.
Choose UNITS[F] to enter into the units menu.
3. The integration and differentiation functions are in the
SLOPE window. Press SLOPE [A] to enter this area.
Within this menu, you have four choices: differentiation,
double differentiation, integration, and double integration.
The differentiation functions: d2/dt2 and d/dt are used in
the instance where one uses a displacement or velocity transducer, and they wish to display acceleration. In this case, the
user should be cautious to analyze data only within the frequency response constraints of the transducer. Velocity and
displacement transducers typically have limited frequency
response characteristics.
7-17
rta_3200_training.book Page 18 Monday, March 2, 1998 11:00 AM
3200 TRAINING MANUAL
4. For this experiment, let’s perform a single integration on our
accelerometer. The result will be a velocity spectrum. Press
integrl [D]. to activate the single integration feature.
T
D
NOTE:
R
B
@
L
7-18
This selection will be reflected in the upper right side of the
LCD.
5. We now need to modify the calibration value and label to
read in velocity units. We are currently calibrated to display
the data in g’s. Since the integral of a g is meaningless, let’s
create a velocity unit labeled ft/s. Press name [B] to enable
the label unit feature.
6. Press the undef [L] to edit the label.
7. Press SHIFT then CLEAR to clear the label. Type FT/S. Then
press EXIT to enter the new label.
rta_3200_training.book Page 19 Monday, March 2, 1998 11:00 AM
3200 TRAINING MANUAL
8. Notice the newly created label FT/S at the bottom of the display.
@
L
9. Press FT/S [L]to activate the label.
10. FT/S has now replaced “G” in the unit field of the display.
Next, the calibration value (sensitivity) needs to be changed.
When we calibrated originally, we did so in g’s. Recall that we
first calibrated the RTA by typing in the calibration value from
the accelerometer calibration paperwork directly into the “mv
cal” field. In the example we discussed, 10 mv/g was the value
entered. In this case, we need to convert this sensitivity value to
mv per ft/sec2:
(10 mv/g) x (1g/32.2 ft/s2) = 0.31 mv/ft/s2.
V
F
11. Note that the integral of ft/sec2 will be ft/s. Press mv cal [F]
to change the calibration value.
7-19
rta_3200_training.book Page 20 Monday, March 2, 1998 11:00 AM
3200 TRAINING MANUAL
12. Next, type 000310 using the alpha keys on the keypad to
enter the new sensitivity number. Then press EXIT to enter
the value. Press EXIT 2 more times to return to the main
menu.
EXIT
If a shaker calibrator was used to calibrate the RTA, the same
method as was outlined earlier in this note would be used. In
this case, when the “level” of the shaker signal is entered, it
must be in ft/s2. For our example, a 1.0 grms shaker was
used. Since 1.0 g equals 32.2 ft/s2, this would be the calibrator reference level. Follow the procedure that was previously
outlined to calibrate using the shaker calibrator, entering
32.2 ft/s2 in the level field.
Now, the RTA is ready to analyze vibration signals and display the data in calibrated velocity units.
13. Press R/S to gather velocity data from your vibrating structure.
RESET
R/S
SCREEN
SYSTEM
7-20
%
N
14. The last task that we need to accomplish is to save the vibration measurement setup so that we can avoid having to
reconfigure the analyzer should we wish to make additional
vibration measurements in the future. Press SYSTEM and
then SETUP [N] to enter the SETUP menu.
rta_3200_training.book Page 21 Monday, March 2, 1998 11:00 AM
3200 TRAINING MANUAL
R
B
!
K
EXIT
!
K
15. From within the SETUP menu, press name [B] so that we can
assign a name or label to this setup.
16. Next, press undef [J]. This will select the [K] softkey (within
the SETUP menu) as the key to which our vibration setup is
stored.
17. At the “Enter setup name:” prompt, type in VIB1CH (or
whatever label you like). Then press EXIT.
18. Next, we need to store the current (active) setup to the
VIB1CH [K] setup key. Press STORE [E], then VIB1CH [K].
The vibration setup is now stored to the VIB1CH [K] key.
This setup can be activated at any time by pressing this softkey from within the SETUP menu.
7-21
rta_3200_training.book Page 22 Monday, March 2, 1998 11:00 AM
3200 TRAINING MANUAL
7-22
rta_3200_training.book Page 1 Monday, March 2, 1998 11:00 AM
CHAPTER
8
Room Acoustics
Among the many built-in capabilities of the Larson•Davis Real
Time Analyzers, a very important and useful tool is the Room
Acoustics feature. Acousticians that are involved in determining
decay times of rooms, theatres, etc., or in analyzing the absorptive qualities of walls, doors, barriers or partitions will find the
Room Acoustics capabilities of the RTA’s to be very complete.
These types of measurements require only a single channel analyzer such as the Model 2800B. Using a dual channel analyzer
like the 2900B or 3200 can save time but is not necessary.
8-1
rta_3200_training.book Page 2 Monday, March 2, 1998 11:00 AM
3200 TRAINING MANUAL
Sound Decay Measurements (RT60's)
Sound decay measurements are used to determine the sound
absorbtion characteristics of a room. This is also known as the
reverberation time or the decay time.
RT60 defined - an RT60 is the amount of time required for a
room to absorb 60 decibels of sound pressure. Example: Someone excites a room with a gun blast or a balloon pop and the
maximum sound pressure level reached is 115 dB. RT60 is the
amount of time it would take for the room to absorb the noise
such that the sound pressure level reaches 55 dB (115-60). Typical values of reverberation times are 0.1 to 3.5 seconds.
Highly reverberant or reflective rooms, such as a gymnasium or
a tiled bathroom have longer sound decay times.
Setting up the RTA for RT60 measurements
R
B
W
G
8-2
1. From the System menu, press STANDARD[C] and
#Chanls [A] in order to activate a single channel measurement.
2. Since RT60 measurements are typically done in 1/3 octave
bands, press FILTER [G] to enter the filter menu.
rta_3200_training.book Page 3 Monday, March 2, 1998 11:00 AM
3200 TRAINING MANUAL
R
B
3. Choose 1/3oct [B] to activate the 1/3 octave band digital filters of the RTA. Choose short [g] or for the short response
time choose reverse [H].
4. Press EXIT to return to the System menu.
EXIT
Creating a Measurement File
Now, create a measurement file for the measurement records
that will soon be acquired.
[
O
Q
A
1. Press FILES[O] to enter the files menu.
2. Press create[A] to create and name a measurement file.
8-3
rta_3200_training.book Page 4 Monday, March 2, 1998 11:00 AM
3200 TRAINING MANUAL
3. Using the alpha keys, type in a filename such as ROOMS.
4. Press EXIT to enter this name.
EXIT
Notice that the filename ROOMS is shown in the file display
along with the date and time of the file creation.
5. Press EXIT again to get back to the System menu.
EXIT
8-4
The filename ROOMS now appears in the lower left corner
of the display indicating that it is the active measurement
file. From this point on, all measurement records that are
stored will reside in the ROOMS file.
rta_3200_training.book Page 5 Monday, March 2, 1998 11:00 AM
3200 TRAINING MANUAL
Setting up the Microphones and Noise Source
Connect a microphone, microphone preamplifier, and appropriate length of microphone cable to the channel one input of the
RTA. Place the microphone (using a tripod) at the desired location for your first measurement.
There are many techniques that can be used to “excite” a room.
The more common methods include popping a balloon, firing a
starting pistol, or driving an amplifier/speaker with broadband
random noise. Balloons and starting pistols are inexpensive and
portable, but lack low frequency components (also not very
repeatable). The best method is to use a random noise generator
and an amplifier/speaker system. An excellent device to drive
the speaker/amplifier is the LD SRC20 portable pink and white
random noise generator or the generator in the RTA. If the RTA
has the Noise Generator or Signal Generator option, connect
your speaker/amplifier to the Source Output jack. Place the
speaker in a corner of the room, facing the center of the room.
Z
J
1. To enable the signal generator, press SIG.GEN [J], from the
System menu.
Pink noise is better to use for this type of testing since it provides constant energy for all of the 1/3 octave frequency
bands.
#
M
2. Press PINK [M] to select pink noise.
8-5
rta_3200_training.book Page 6 Monday, March 2, 1998 11:00 AM
3200 TRAINING MANUAL
3. Turn the noise generator on by pressing ON[A].
Q
A
The noise generator will deliver a pink noise signal to the
speaker/amplifier system.
RESET
R/S
4. Press R/S. Adjust the channel one input gain of the RTA,
such that the signal is optimized without creating an overload condition. The best way to do this is to press the down
arrow hard key until and overload occurs.
5. Range up (by pressing the up arrow hard key) until the overload indicator disappears.
You may also need to adjust the output level of the amplifier/speaker in order to insure that all of the frequencies of
interest are being excited equally. The spectrum displayed on
the RTA should be fairly flat within this frequency range.
The output level of the speaker/amplifier should also be
loud enough such that there is a significant difference
between the background (ambient) level and the excited
level (for each frequency of interest).
8-6
rta_3200_training.book Page 7 Monday, March 2, 1998 11:00 AM
3200 TRAINING MANUAL
R
B
6. Once the desired output level and input gain have been
achieved, press OFF [B] to turn off the noise generator.
7. Press EXIT to return to the System menu.
EXIT
RESET
R/S
8. Press R/S to stop the measurement.
Establishing the Averaging Parameters for the RT60 Measurement
The RTA utilizes the built-in Autostore capability when making
RT60 measurements. Before enabling the autostore feature, the
desired detector needs to be established. Typically one would
use either exponential or linear repeat averaging for this type of
test. For this example, you will use the linear repeat detector.
1. Press EXIT once to enter the Main menu.
EXIT
X
H
2. Select DETECTR [H] to enter the detector (averaging) selection menu.
8-7
rta_3200_training.book Page 8 Monday, March 2, 1998 11:00 AM
3200 TRAINING MANUAL
3. Choose LIN.R [B] to select linear repeat averaging.
R
B
X
H
4. Press AV.TIME[H] to establish a linear repeat averaging time.
5. For the RT60 autostore measurement, you should select a
very short averaging time. Type in 0.05 seconds as shown.
EXIT
6. Press EXIT to enter this value. Notice that the established
detector parameters appear on the right of the display.
7. Press EXIT to return to the STANDRD analysis menu.
EXIT
8-8
rta_3200_training.book Page 9 Monday, March 2, 1998 11:00 AM
3200 TRAINING MANUAL
8. To enter the Autostore menu, choose AUTOSTR [P].
]
P
As mentioned earlier, reverberation time measurements are
acquired with the RTA using the Autostore feature.
R
B
9. To enable Autostore, press byTIME[B].
Notice that the label “bTIME” appears on the left side of the
display.
You now need to establish the Autostore endstore (duration)
and the Autostore delta. The endstore is the amount of time
that is allocated for the total reverberation time measurement. 3 to 4 seconds is usually more than sufficient for most
rooms.
T
D
10. Press endstore[D].
8-9
rta_3200_training.book Page 10 Monday, March 2, 1998 11:00 AM
3200 TRAINING MANUAL
11. Type in 2.0 seconds as shown below.
12. Press EXIT to enter this endstore time.
EXIT
S
C
The delta is the parameter that establishes how often a spectrum is to be captured. you will choose a delta that matches
the averaging time that you previously established when
you selected the linear repeat detector. Thus, you will use .05
seconds.
13. Press delta [C].
14. Type in a delta value of.05 seconds as shown below
15. Press EXIT to enter this Autostore delta time.
EXIT
Now that the Autostore measurement parameters are established, let’s review what will happen during the measurement.
You will drive the room with pink noise until it is excited at all
of the frequencies of interest. You will then begin the Autostore
measurement by pressing R/S on the RTA.
At this point the RTA will start capturing spectra at a rate of 20
per second (every .05 seconds). After 1 second the noise generator will be shut off (due to the way the noise generator is config-
8-10
rta_3200_training.book Page 11 Monday, March 2, 1998 11:00 AM
3200 TRAINING MANUAL
ured), but the RTA will continue to capture spectra as the room
“absorbs” the reflecting sound that remains from the now inactive speaker/amplifier. This will continue for 1 second until the
2 second Autostore endstore is reached. At that point, the RTA
will cease capturing spectra.
The end result is that you will have 40 spectra (20 per second for
the 2 second measurement) that will characterize the reverberation time of the room.
SCREEN
SYSTEM
16. Press SYSTEM to go to the System menu.
Setting the Signal Generator Delay
The next thing that you need to establish is the noise generator
duration. As mentioned, for this test you would like the pink
signal generator to automatically shut off 1 second after the
Autostore measurement has begun.
Z
J
1. Press SIG.GEN[J] to enter the Signal Generator menu.
Since you want the noise generator to turn off after the measurement has begun, you will use the Off with Run feature.
T
D
2. Press OFF/RUN[D].
Since you want the pink noise generator to automatically
shut off after 1 second into the Autostore, you will use the
delay feature of the noise generator.
8-11
rta_3200_training.book Page 12 Monday, March 2, 1998 11:00 AM
3200 TRAINING MANUAL
3. Press DELAY [O].
[
O
4. Use the left and right arrow hard keys to establish the 1.0
second delay.
5. Press EXIT to return to the SYSTEM menu.
EXIT
Making the RT60 Measurement
You are now ready to make the RT60 measurement. Verify that
the speaker and microphone are placed in the desired positions.
RESET
R/S
CLEAR
RECALL
8-12
1. Then press R/S to begin the RT60 measurement.
2. After the measurement is complete, press the RECALL hardkey. The first spectrum (at 0.05 seconds into the measurement) that was captured during the autostore process will be
displayed.
rta_3200_training.book Page 13 Monday, March 2, 1998 11:00 AM
3200 TRAINING MANUAL
3. Press the right arrow hard key until you get to 1 sec. Beyond
this point you will see the spectrum start to attenuate.
4. Continue pressing the right (or left) arrow hard key to page
back and forth through the individual spectra.
You will now use the vsTIME feature of the RTA to see how specific frequencies changed in amplitude during the 2 second
Autostore measurement.
CURSOR
T
D
5. Press CURSOR to activate the dotted cursor. Then use the
right (or left) arrow hard key to a desired frequency value
such as 1.25 kHz.
6. To view how the 1.25 kHz band changed during the 2.0 second Autostore measurement, press vsTIME[E].
Notice that the horizontal scale of the measurement display
has changed to time with values of 0.5 to 2.0 seconds on
either end. You can see how much acoustic energy the room
experienced when the pink noise generator was on, and how
the reflective sound was absorbed after it was shut off. The
time between when the noise generator was on to the ambient noise level of the room (no pink noise) is a measure of the
reverberation time.
8-13
rta_3200_training.book Page 14 Monday, March 2, 1998 11:00 AM
3200 TRAINING MANUAL
#
M
7. To see the sound decays of the other frequency bands, press
DATA [M].
8. Then press the right or left arrow hardkeys to step through
the different frequency bands.
EXIT
9. Press EXIT to return to the amplitude vs. frequency. Press
EXIT again to return to the SYSTEM menu. Note that the
measurement display is cleared.
It is almost always desirable to make a number of Autostore
RT60 measurements within a room and average them together
to come up with a single “averaged” measurement. This helps
reduce errors caused by background noise, room modes (dead
spots), etc. Move the microphone to a different positions and
repeat the measurement.
RESET
R/S
CLEAR
RECALL
8-14
10. Press R/S to acquire the second Autostore measurement.
For this exercise, take 5 additional Autostore records at different
microphone positions.
11. After the 6th measurement is done, press RECALL.
rta_3200_training.book Page 15 Monday, March 2, 1998 11:00 AM
3200 TRAINING MANUAL
R
B
12. To average the 6 Autostored measurements together, press
B.AVG[B] (Block Average).
13. At the top right side of the display, answer the prompt for
the Autostore records that you wish to have averaged
together. Since you want to average all 6 records, type in 001006.
14. Then press EXIT to enter the selection.
EXIT
Notice that the new “averaged” Autostore record is displayed and is stored as By Time record number 7. Note also
that the word “AVERAGED” appears on the right of the display.
8-15
rta_3200_training.book Page 16 Monday, March 2, 1998 11:00 AM
3200 TRAINING MANUAL
Viewing the RT60 (Reverberation Time) Values.
CURSOR
T
D
1. Press CURSOR to activate the horizontal cursor. Then move
the left or right arrow hard key to the 1.6 kHz frequency
band.
2. To display the 1.6 kHz band decay curve, press vsTIME[E].
In order to view the actual values of the RT60 for the decay
curve, both the solid and dotted cursors are used.
%
N
3. First, press SOLID[N] to activate the solid line cursor.
4. Next, press the right (or left) arrow hardkey until the solid
cursor is somewhere along the leading edge of the linear
portion of the decay curve.
8-16
rta_3200_training.book Page 17 Monday, March 2, 1998 11:00 AM
3200 TRAINING MANUAL
5. Then, press DOTTED[O] to activate the dotted line cursor.
[
O
6. Press the right (or left) arrow hardkey until the dotted cursor
is somewhere along the trailing edge of the linear portion of
the decay curve.
The RTA automatically computes the RT60 for values
between the two cursors performing a linear regression
curve fit. The RT60 value for the 1.6 Hz 1/3 octave band. is
0.195 seconds. This is the time that it would take the room to
absorb 60 dB of noise at the 1.6 kHz band.
There is a storage area in the RTA for archiving RT60 data. It
is called the RT60 register. The RT60 table is a convenient
place to store RT60 values for each of the frequencies.
R
B
7. Press RT60 [B] to view the RT60 register.
8-17
rta_3200_training.book Page 18 Monday, March 2, 1998 11:00 AM
3200 TRAINING MANUAL
In order to store data in the RT60 register, you must first clear
out any old RT60 data that may already reside there.
T
D
Q
A
8. Press RESET[D] to clear the RT60 register.
9. Press YES[A] to verify that you wish to erase the RT60 database.
Notice that the RT60 registered is cleared and all RT60 values
(for all of the frequencies) are set to zero. You are now ready
to curve fit the data and fill the RT60 register.
EXIT
8-18
10. Press EXIT to get back to the decay curve of the 500 Hz band
frequency.
rta_3200_training.book Page 19 Monday, March 2, 1998 11:00 AM
3200 TRAINING MANUAL
S
C
R
B
11. Since the solid and dotted cursors have already been placed
on the beginning and end of the linear part of the decay
curve, you are ready to fill the 1.6 kHz. band of the RT60 register. Press REPLACE[C].
12. To verify that the register has been filled, press RT60[B] to
view the RT60 register.
Notice the RT60 value of 0.195 seconds at the 1.6 kHz. band.
All of the other frequency’s RT60’s are still set to 0.
EXIT
13. Let’s continue the manual process of completing the RT60
register. Press EXIT to return to the decay curve display.
Then, press DATA [M].
#
M
8-19
rta_3200_training.book Page 20 Monday, March 2, 1998 11:00 AM
3200 TRAINING MANUAL
14. Press the right arrow hardkey or increment to the next 1/3
octave band (2 kHz.)
15. If necessary move the solid and dotted cursors such that they
are both on the linear part of the decay curve. Remember to
activate the cursor first by pressing either SOLID[N] or DOTTED[O].
S
C
R
B
8-20
16. Notice that the RT60 for the 2.0 kHz. band is 0.218 seconds.
Press REPLACE[C] to put this value into the RT60 register.
17. Continue this process moving the cursors to the linear areas
of the decay curves and pressing REPLACE[C] for each of
the frequencies until you get to the 5 kHz band. Once you
have finished, press RT60[B].
rta_3200_training.book Page 21 Monday, March 2, 1998 11:00 AM
3200 TRAINING MANUAL
18. Below is the completed RT60 register. For this example you
are only concerned with the frequencies from 400 Hz. to 5
kHz.
You have finished the RT60 portion of this exercise. At this point,
the data could be sent to a printer which would yield a graph
like that on the display. The printout would also include a table
that lists the RT60 values for all of the 1/3 octave band frequencies between 400 Hz and 5 kHz.
&
STORE
19. Press STORE to archive the RT60 register.
Sound Transmission Loss Measurements
Sound Transmission Loss measurements (and Sound Transmission Class or STC measurements) are commonly used to evaluate the acoustical effectiveness of walls, partitions, doors, etc. for
isolating noise between adjoining rooms. This is typically
accomplished by placing a speaker in one of the rooms, producing noise in that room, and making the measurement in the
adjoining room. Three measurements need to be made to accomplish this type of measurement: A 1/3 octave band sound pressure measurement in the source room; a 1/3 octave band
measurement in the receiving room, and an RT60 data measured
in the receiving room.
Following is a procedure to determine the Transmission Loss
and STC of a partition/wall between two adjoining rooms. You
will use the RT60 data that was just acquired as the receiving
8-21
rta_3200_training.book Page 22 Monday, March 2, 1998 11:00 AM
3200 TRAINING MANUAL
room RT60. All that needs to be done at this point is a SPL measurement in a source room and one in a receiving room.
Setting Up the RTA for Sound Transmission Loss Measurements
SCREEN
SYSTEM
R
B
1. Press SYSTEM, STANDRD [C] to get back to the SYSTEM
menu.
2. Then EXIT to the Main menu.
EXIT
]
P
Q
A
3. Press AUTOSTR[P] to get back to the Autostore menu.
4. Turn off the Autostore option by pressing OFF[A].
Notice that the bTIME label on the left side of the screen has
disappeared. Autostore is now disabled.
5. Press EXIT
EXIT
8-22
The RT60 register that was completed earlier will be used for the
receiving room reverberation time and thus will be included in
rta_3200_training.book Page 23 Monday, March 2, 1998 11:00 AM
3200 TRAINING MANUAL
the Sound Transmission Loss calculation. Let's verify that it is
the current or active RT60.
Y
I
T
D
6. To check this, press ROOMS[I].
7. Next, press RT60[D].
You should be viewing the RT60 register that you previously
filled.
SCREEN
SYSTEM
8. Press the SYSTEM hardkey to get back to the system menu.
Next, measure the sound pressure levels (in 1/3 octave bands) of
the source and receiving rooms. You can do this one of 2 ways.
You can measure them one at a time (using the analyzer in the
STANDRD single channel mode) or measure them simultaneously (using STANDRD dual channel mode of the 3200). For
simplicity, lets measure one channel at a time.
8-23
rta_3200_training.book Page 24 Monday, March 2, 1998 11:00 AM
3200 TRAINING MANUAL
S
C
X
H
Q
A
X
H
8-24
Q
A
9. Put the analyzer in single channel mode by using the STANDRD [C] key and # Chanls [A] key.
10. Set the averaging type and time by first pressing the EXIT
hardkey, and then select DETECTR[H].
11. For this part of the test, you will use linear single averaging.
Choose LIN.S[A].
12. Choose an averaging time (20 seconds for example), by first
pressing AV.TIME[H].
rta_3200_training.book Page 25 Monday, March 2, 1998 11:00 AM
3200 TRAINING MANUAL
13. Enter 20 seconds by typing in the value shown in the following graph.
EXIT
SCREEN
SYSTEM
14. Press the EXIT to enter the 20 second averaging time and
then press SYSTEM to return to the System Menu.
You are now ready to make a measurement. you'll start with the
source room sound pressure measurement. Again, using the
pink noise generator of the 3200 with a speaker/amplifier is the
ideal way to make this measurement.
Place the speaker in a corner of the source room (facing into the
room). Next, put the microphone on a tripod in the room. Turn
on the pink noise generator of the RTA.
Z
J
15. To enable the noise generator, first press SIG.GEN [J] or
NOISE [J], from the System menu.
Pink noise is better to use for this type of testing since it provides
constant energy for all of the 1/3 octave frequency bands.
#
M
16. Press PINK [J] to select pink noise.
8-25
rta_3200_training.book Page 26 Monday, March 2, 1998 11:00 AM
3200 TRAINING MANUAL
17. Turn the noise generator on by pressing ON[A].
Q
A
The noise generator will deliver a pink noise signal to the
speaker/amplifier system.
RESET
R/S
18. Press R/S. Adjust the channel one input gain of the RTA,
such that the signal is optimized without creating an overload condition. The best way to do this is to press the down
arrow hard key until an overload occurs.
19. Then range up (by pressing the up arrow hard key) until the
overload indicator disappears.
You may also need to adjust the output level of the amplifier/speaker in order to insure that all of the frequencies of
interest are being excited equally. The spectrum displayed on
the RTA should be fairly flat within this frequency range.
The output level of the speaker/amplifier should also be
loud enough such that there is a significant difference
between the background (ambient) level and the excited
level (for each frequency of interest) in both rooms. Leave the
noise generator on.
8-26
rta_3200_training.book Page 27 Monday, March 2, 1998 11:00 AM
3200 TRAINING MANUAL
Making Airborne Sound Transmission Loss Measurements
You are now ready to make a measurement in the source room.
Verify that your speaker and microphone are both located in
appropriate locations within the source room.
RESET
R/S
&
STORE
1. Once the desired output level and input gain have been
achieved, press R/S to begin the 20 second measurement.
2. Upon completion of the measurement, press the STORE
hardkey to save the record into the ROOMS file.
Once again, it is common practice to make a number of measurements at various locations in the source room, and then
average them together. This yields a better statistical result
by averaging out background noise, etc.
RESET
R/S
3. Move the microphone to another location. Press R/S to begin
the second measurement.
4. Once the measurement is complete, press STORE again to
save the data to memory.
8-27
rta_3200_training.book Page 28 Monday, March 2, 1998 11:00 AM
3200 TRAINING MANUAL
For this exercise, make one more measurement in the source
room at a different microphone location, then store it. you
now have a total of 3 measurements in the source room.
Before you average them together, let’s perform the measurements in the receiving room.
RESET
R/S
&
STORE
5. Leave the speaker in the source room, and move the microphone to a desired location in the receiving room. Assuming
the pink noise generator is still turned on, press R/S to begin
a 1/3 band octave sound pressure measurement in the
receiving room.
6. Press STORE to save this first receiving room measurement.
Perform two additional measurements (at different microphone locations) and store them to the memory of the RTA.
7. Turn the Pink Noise Generator off by pressing OFF [B]. Now
it is time measure the background noise of the receive room.
Press R/S to begin the background noise measurement. Store
the measurement when complete (memory 7).
8-28
rta_3200_training.book Page 29 Monday, March 2, 1998 11:00 AM
3200 TRAINING MANUAL
8. If you wanted to keep the memory records straight, you
could go to the FILES menu in the SYSTEM menu and attach
notes to the records. The first three could be labeled “sendx.”
The next three could be labeled “receivedx.” Record number
7 could be labeled “backgnd.”
You should now have 3 source room measurements., 3 receiving
room measurements with noise, and one background noise measurement in the receiving room. Now use the block averaging
capabilities of the RTA to compute an averaged source room
measurement, and an averaged receiving room measurement.
CLEAR
RECALL
R
B
9. To average them together, first press the RECALL hardkey.
The last receiving room measurement that you acquired will
be on the display. You can display the 5 other measurements
by pressing the left arrow key hardkey.
10. Now, let’s average the source room measurements together
(Normal 1 thorough 3). Press B.AVG [B].
11. In the field on the top right side of the display, type in 0001 0003. This tells the 3200 that you want to average the 3
source room spectra.
8-29
rta_3200_training.book Page 30 Monday, March 2, 1998 11:00 AM
3200 TRAINING MANUAL
EXIT
12. Then press the EXIT hardkey to initiate the calculation. The
new spectrum that appears in the display is the average of
the 3 source room spectra. Notice that the word AVERAGED
appears on the right side of the display next to SPL.
&
STORE
13. Press the STORE hardkey to save the data to memory. Note
that this new averaged spectrum is stored in the ROOMS file
as Normal record 8.
R
B
14. Now, let’s average the 3 receiving room spectra together.
Press B.AVG[B].
In the field on the top right side of the display, type in 0004 0006. This tells the 3200 that you want to average the 3
receiving room spectra.
8-30
rta_3200_training.book Page 31 Monday, March 2, 1998 11:00 AM
3200 TRAINING MANUAL
15. Press EXIT to initiate the averaging calculation. The new
spectrum that appears in the display is the average of the 3
receiving room spectra.
EXIT
16. Press STORE to save the averaged receiving room spectra
into the ROOMS file. Notice that it is stored as Normal 8.
&
STORE
X
H
EXIT
CLEAR
RECALL
X
H
17. Press KEEP[H] to get back to the Noise menu and then press
EXIT.
18. Recall the background spectrum by pushing the RECALL
hard key and locating memory 7. Now push the KEEP [H]
key to “keep” the spectra and return to the main menu.
8-31
rta_3200_training.book Page 32 Monday, March 2, 1998 11:00 AM
3200 TRAINING MANUAL
@
L
19. Return to the Rooms menu by pressing ROOMS [Y]. Enter
this background spectrum by pushing the SET-> [L] and
BACK.GD [O] keys. Exit to the Main menu by pressing the
EXIT key.
CLEAR
RECALL
X
H
20. Recall the send or source room spectrum by pushing the
RECALL hard key and locating memory 8. Now push the
KEEP [H] key to “keep” the spectra and return to the Main
menu.
Y
I
@
L
21. Return to the Rooms menu by pressing ROOMS [Y] and
enter this source room spectrum by pushing SET-> [L] and
SOURCE [M]. Exit back to the Main menu.
X
H
22. Recall the receive room spectrum by pressing the RECALL
hard key and locating memory 9. Now push the KEEP [H]
key to “keep” the spectrum and return to the Main menu.
Y
I
[
O
#
M
CLEAR
RECALL
8-32
rta_3200_training.book Page 33 Monday, March 2, 1998 11:00 AM
3200 TRAINING MANUAL
Y
I
@
L
23. Return to the Rooms menu by pressing ROOMS [Y] and
enter this receive room spectrum by pressing SET-> [L] and
RECEIVE [N].
%
N
T
D
EXIT
U
E
24. As part of the Transmission Loss (and STC) calculation, the
surface area of the partition in square meters and volume of
the receiving room in cubic meters need to be factored in as
part of the calculation. Press surface[D] to access the surface
area entry field.
25. Enter the surface area of the partition room (10 square
meters). Then press the EXIT to enter this value.
26. Next, press volume [E] to access the room volume entry
field.
8-33
rta_3200_training.book Page 34 Monday, March 2, 1998 11:00 AM
3200 TRAINING MANUAL
EXIT
#
M
27. Type in the volume of the receiving room (in cubic meters).
Press EXIT to enter the volume.
28. Now that they are defined, the data blocks can be displayed
by pressing SOURCE [M], RECEIVE [N], or BACK.GD [O].
Only the data in the frequency range 100 Hz-4 kHz are saved
in these files since the analysis is limited to that frequency
range.
Y
I
29. Select the standards organization whose standards you wish
to follow for the determination of the airborne sound transmission parameters by pressing either ASTM [I] or ISO [J].
For this exercise use the American Standard ASTM [I].
Q
A
30. Now you have a choice of looking at Noise Reduction NR
[A], Normalized Noise Reduction NNR [B], Transmission
Loss TL [C], and Field Transmission Loss FTL [D].
Now, assuming the RT60 table is full of RT60 values taken in
the receiving room, all the pieces are in place.
Impact Sound Isolation
Impact sound isolation is a measure of sound generated in a
room resulting from repeated impacts (is. Footsteps) on the floor
of the room above. In practice, a standardized tapping machine
is utilized as a source of impacts on the floor above and the
resulting sound pressure level produced in the room below is
measured in 1/3 octave frequency bands.
8-34
rta_3200_training.book Page 35 Monday, March 2, 1998 11:00 AM
3200 TRAINING MANUAL
Resultant measurement choices are found at the bottom of the
screen in either the ASTM or ISO menus. These include Ln
(ASTM) and L’n and L’nT (ISO).
Noise Ratings
Noise Criterion (NC [A])
SCREEN
SYSTEM
Q
A
W
G
A single number technique for representing the character of
steady indoor background noise is based on the 1957 Noise Criteria Curves. These are a set of similar octave band reference
curves which are overlaid graphically upon an octave frequency
spectrum measured in the room to represent the background
noise. Each of the curves is designated by a number, called the
Noise Criterion, which represents the value of sound pressure
level corresponding to the 1 kHz band. Since the curves are
stored in the 2900B, this function can be performed automatically using a displayed 1/1 octave spectrum which has either
just been measured, or has been recalled from memory.
1. To enter the 1 octave mode, press SYSTEM, press FILTER [G]
and then press 1⁄1 OCT [A].
2. Press Exit twice to get back to the main menu.
EXIT
RESET
R/S
3. Press R/S to begin the measurement. To stop the measurement press R⁄S again.
8-35
rta_3200_training.book Page 36 Monday, March 2, 1998 11:00 AM
3200 TRAINING MANUAL
Y
I
Q
A
4. While in the Main menu, press ROOMS [I] and then NC [A]
to look at the NC curve.
5. Press EXIT to return to the Main menu.
Noise Rating Curves (NR [B])
The Noise Rating (NR) curves are used in the same manner as
the Noise Criteria curves, but are used to measure noise in conformance with international standards. NR is obtained the same
way as Noise Criterion and is found in the Rooms menu.
Room Criterion (RC [C])
The Room Criterion procedure is can be found in ANSI S12.21995. In addition to producing a single number rating of the
steady background noise, the quality of the spectra is described
in terms of one or more of the following: Neutral Spectrum (N),
Rumbly spectrum (R), Hissy Spectrum (H), tonal Spectrum (T),
and Acoustically Induced perceptible vibration (Va and/or Vb).
!
K
8-36
#
M
As with the NC and NR rating procedures, the steady background noise spectrum is displayed in the 1/1 octave bandwidths format. The main difference is the low frequency needs
to be set with a low limit frequency of 1 Hz. This is done by
pressing INPUT [K] in the System menu and setting the frequency limits to 1-10K [M]. If this low limit isn’t set, the instrument will give you an error message.
rta_3200_training.book Page 37 Monday, March 2, 1998 11:00 AM
3200 TRAINING MANUAL
To access RC, simply press RC [C] in the Rooms menu.
S
C
8-37
rta_3200_training.book Page 38 Monday, March 2, 1998 11:00 AM
3200 TRAINING MANUAL
8-38
rta_3200_training.book Page 1 Monday, March 2, 1998 11:00 AM
CHAPTER
9
Statistics and Ln Calculations
Statistical analysis can be performed with the analyzer in either
the 1/1 or 1/3 octave frequency bandwidths.
!
K
1. Press the STAT [K] key from the Main menu to access the statistics menu.
R
B
2. Press the S.Time [B] key to enter the desired time interval
that the data will be taken from the measurement buffer to
the Statistics Table.
EXIT
3. Enter the desired interval time in seconds via the numeric
keypad. Press the EXIT hardkey.
9-1
rta_3200_training.book Page 2 Monday, March 2, 1998 11:00 AM
3200 TRAINING MANUAL
S
C
CURSOR
Q
A
%
N
4. Press the dB-SPAN [C] key to set the measurement range.
The present range is indicated on the lower right side of the
display. (Note that statistics must be off.)
5. Press the horizontal keys to move the 120dB range to encompass the desired range of input values for the measurement
to be made. After you have made the range selection press
the CURSOR hardkey to re-assign the control of the cursor
to the horizontal keys.
6. Press the ON/OFF [A] key to turn on the Statistics mode.
(Repeated presses will toggle between on and off.). The
“STAT” indicator will appear on the left side of the display
indicating that the STAT mode has been activated.
7. Press the N [N] key to select the desired Ln to be calculated.
A. Select the trace number (1-6), via the numeric keypad,
whose parameter value is to be changed. a “>>” will
appear next to the selected trace number.
B. Press the horizontal keys until the desired Ln value
appears. The analyzer is capable of calculating Ln values
between 1 and 99.
9-2
rta_3200_training.book Page 3 Monday, March 2, 1998 11:00 AM
3200 TRAINING MANUAL
CURSOR
RESET
R/S
C. Press the Cursor hardkey to re-assign Ln control of the
cursor to the right and left arrow keys.
8. Press the R/S hardkey to begin the analysis. The state of the
analyzer will change to RUN, which is indicated just above
“PEN” on the right side of the screen.
You will not see any update of the display until either the
analysis is stopped by pressing the R/S hardkey or by pressing the REDRAW [H] key.
RESET
R/S
9. Press the R/S hardkey to stop the analysis. The display will
update with the Ln values and curves.
10. Press the horizontal keys to move the cursor to the desired
frequency of interest. Note that as you move the cursor
through the different frequencies the Ln values change.
These values are correlated to the amplitude of the trace drawn
on the display.
9-3
rta_3200_training.book Page 4 Monday, March 2, 1998 11:00 AM
3200 TRAINING MANUAL
Hiding a trace
1. Select the desired trace to hide by pressing the trace number
via the numeric keypad.
V
F
2. Press the HIDE [F] key. An “*” asterisk will appear next to
the trace number indicating that the trace has been hidden.
To un-hide a trace, select the trace with the “*” asterisk next to it
and press the HIDE [F] key. The “*” will disappear and the hidden trace will re-appear.
Storing the Ln Trace
Prior to storing an Ln trace it is recommended that a descriptive
note be attached to the trace for future reference. (See “Annotation of a Measurement” in Chapter 1.
&
STORE
1. Press the STORE hardkey to store the data associated with
the statistics parameter table presently displayed. The message “STORE - Ln Trace N” will appear on the upper right
side of the display.
This step will only store enough information to recreate the Ln
traces and the Ln values that were active upon storing the information.
9-4
rta_3200_training.book Page 5 Monday, March 2, 1998 11:00 AM
3200 TRAINING MANUAL
Storing the Statistics Table
Prior to storing the Statistics table it is recommended that a
descriptive note be attached to the table for future reference. (See
“Annotation of a Measurement” in Chapter 1.
Y
I
1. Press the STO-TBL [I] key to store the complete Statistics
Table to memory. Note that the storage of the Stats table
requires a large amount of memory, in excess of 22k bytes.
This step will store the entire Ln Table which will re-create the
traces and the Ln table to enable you to select different Ln values
(1-99) and view the associated dB values.
Recalling Ln traces
While in the STATS mode press the RECALL hardkey. The message “RECALL - Ln Trace N” will appear. If there is more than
one record you may use the horizontal keys to scroll through the
stored Ln trace records. The stored traces will appear on the display.
Recalling a Statistics Table
Z
J
1. Press the RCL-TBL [J] to recall a statistics table to the display.
9-5
rta_3200_training.book Page 6 Monday, March 2, 1998 11:00 AM
3200 TRAINING MANUAL
EXIT
2. Enter the record number, via key numeric keypad, to be
recalled. Press the EXIT hardkey.
3. Press the Yes [A] to recall the table, or No [C] to return to the
Statistics menu.
Merging Statistics Tables
!
K
1. Press the MRG-TBL [K] to merge a stored Stats table into
with the active stats table.
2. Enter the record number, via the numeric keypad, to be
merged.
9-6
rta_3200_training.book Page 7 Monday, March 2, 1998 11:00 AM
3200 TRAINING MANUAL
EXIT
Q
A
3. Press the EXIT hardkey. The message “*ARE YOU SURE*”
will appear on the display. To proceed press YES [A]. To
abort the recall and maintain the present Stats table intact,
press NO[C]. Upon pressing “Yes” the new “merged” traces
and statistic table appear on the display.
S
C
9-7
rta_3200_training.book Page 8 Monday, March 2, 1998 11:00 AM
3200 TRAINING MANUAL
9-8
rta_3200_training.book Page 1 Monday, March 2, 1998 11:00 AM
CHAPTER
10
Modal Analysis
impact hammer
load cell
to channel 1
to channel 2
accelerometer
SMS beam
FFT analyzer
What is Modal Analysis?
The process of characterizing the dynamic properties of an elastic structure in terms of its modes of vibration (frequency, damping, & mode shapes).
10-1
rta_3200_training.book Page 2 Monday, March 2, 1998 11:00 AM
3200 TRAINING MANUAL
Dynamic Analysis
• Analytical Modal Analysis
-
Mathematical determination of dynamic properties of a
structure using the Finite Element method.
• Experimental Modal Analysis
-
Experimental determination of the dynamic properties.
Modal Models
The frequency, damping, and mode shape are the properties of a
mode of vibration and the basis of the “modal model”.
.
..
[m]{x} + [c]{x} + [k]{x} = {f(t)}
m1
m2
m3
m4
[Ms2 + Cs + K]{X} = {F}
{X} = [Ms2 + Cs + K]-1{F} or {X} = [H]{F}
Modes
Hij(w) = ∑ ((rij,k/2j(jw-pk) - (r*ij,k/2j(jw-pk*))
k=1
What is a mode?
Vibration is caused when energy becomes trapped within the
boundaries of the structure, moves freely within the boundaries,
and cannot readily escape.
• The mode shapes are standing wave deformations of the
structure at certain natural frequencies, caused by trapped
energy.
10-2
rta_3200_training.book Page 3 Monday, March 2, 1998 11:00 AM
3200 TRAINING MANUAL
1st Mode
2nd Mode
The Frequency Response Function (FRF)
A structure’s overall vibration can be described as a summation
of the vibration at each of its modes.
Overall
➀
➁
➂
➃
➄
Modal Parameters from FRF’s
• Damping and frequency are the same at each measurement
point.
• The mode shape is obtained at a single frequency from all of
the measurement points.
10-3
rta_3200_training.book Page 4 Monday, March 2, 1998 11:00 AM
3200 TRAINING MANUAL
Why Use Modal Analysis?
• Verify analytical models
-
Verify the accuracy of FEA models by providing an independent check of the modeling accuracy.
-
Experimental modal analysis can be used to provide
damping values for the FEA model.
-
If experimental model and mathematical models are
closely matched, the FEA model can be used for further
analysis and simulation.
• Troubleshoot noise and vibration problems.
• To evaluate fixes.
10-4
rta_3200_training.book Page 5 Monday, March 2, 1998 11:00 AM
3200 TRAINING MANUAL
Making Modal Measurements
impact hammer
load cell
to channel 1
to channel 2
accelerometer
SMS beam
FFT analyzer
Excitation Techniques
• Impact Hammer
• Shaker
• Servo
• Self Induced Vibration
Impact Hammer
• Advantages
-
Easy set up
-
Easy to make measurements
-
Inexpensive
-
“Field portable”
10-5
rta_3200_training.book Page 6 Monday, March 2, 1998 11:00 AM
3200 TRAINING MANUAL
• Disadvantages
-
Large amplitude on the impulse can cause non-linear
behavior.
-
Difficult to excite large structures (especially at distances
far from the impact point).
Time Domain and Frequency Domain Signals
10-6
rta_3200_training.book Page 7 Monday, March 2, 1998 11:00 AM
3200 TRAINING MANUAL
Impact Hammers - Frequency Range
• The usable frequency range is determined by the tip and the
mass of the hammer.
• Soft tips (such as rubber) provide a long impulse and yields a
lower frequency range, centered at low frequencies.
• Hard tips (such as steel or hard plastic) provide a short
impulse and a short frequency range, at higher frequencies.
• Heavier hammers will lower the frequency but increases the
amplitude of the force spectrum.
• The useful frequencyrange of an impact hammer is from DC
to where the spectrum rolls off (10 to 20 dB).
Impact Hammer Tips
Soft rubber tip
Plastic tip
Steel tip
10-7
rta_3200_training.book Page 8 Monday, March 2, 1998 11:00 AM
3200 TRAINING MANUAL
Impact Hammers-Double Hits
• Double hits occur when the hammer strikes the test item
twice.
• Double hits render the measurement useless.
• Double hits are difficult to avoid at measurement points on
the test item that exhibit a lot of motion at resonance.
• Impact testing is easy but does require practice and technique. Pulling the hammer back, or letting it recoil naturally
after impact helps.
Impact Hammers - Off Axis Hits
• Off axis his will result in reduced energy in the intended
direction. This causes errors in the measurement.
• This may excite modes (resonances) that would not normally
be excited.
• The actual force that the test item experiences is less than the
measured force that the load cell see. The amplitude of the
frequency response function will be too high.
10-8
rta_3200_training.book Page 9 Monday, March 2, 1998 11:00 AM
3200 TRAINING MANUAL
Impact Hammers - Averaging
• Averaging a number of measurements together will improve
the quality of the measurement.
• 4 to 20 averages should be sufficient.
• If the measurement does not improve by increasing the number of averages, something is wrong.
Exponential Windowing
• Exponential windowing prevents spectral leakage.
• Leakage causes measurement errors, particularly in lightly
damped structures.
• The response signal is multiplied times the decaying exponential curve (window) to insure that there is no amplitude
at the end of the measurement.
• The exponential window is a time domain window.
• You do not always need to use an exponential window.
• Exponential windows introduce artificial damping to the
FRF’s. If you are concerned with damping values, you’ll need
to correct for this.
10-9
rta_3200_training.book Page 10 Monday, March 2, 1998 11:00 AM
3200 TRAINING MANUAL
No Exponential Window
Exponential Window
Exponential Window applied
10-10
rta_3200_training.book Page 11 Monday, March 2, 1998 11:00 AM
3200 TRAINING MANUAL
Leakage (Why We Use Windows)
Shaker Excitation
• Advantages
-
Shakers normally provide more accurate results.
-
Actual test time is significantly reduced.
-
Shakers provide more energy to larger structures.
-
Shakers can be driven by a variety of signals (sine, swept
sine, random, etc.), which provides flexibility.
• Disadvantages
-
Requires more equipment and setup time.
-
Shakers not generally transportable; not convenient for
field measurements.
-
Shaker systems tend to be expensive.
10-11
rta_3200_training.book Page 12 Monday, March 2, 1998 11:00 AM
3200 TRAINING MANUAL
Shaker Test Schematic
elastic cables
amplifier
to channel 1
to channel 2
accelerometer
load cell
source
ouput
(with stinger)
SMS beam
FFT analyzer
Shaker Excitation Functions
• Swept sine
-
Highest accuracy; excellent signal to noise ratio; often
used when testing very non-linear structures; test times
are very long.
• Random Noise
-
Good general purpose excitation; best linearized approximation for non-linear system; test times are very short;
not good for testing systems with backlash (such as a gear
drive).
• Chirp
-
10-12
Similar to swept sine but faster; good signal to noise ratio;
good for testing “noisy” systems.
rta_3200_training.book Page 13 Monday, March 2, 1998 11:00 AM
3200 TRAINING MANUAL
Attaching Accelerometers
• Metal Stud
-
Very secure; usable frequency range: DC to 20 KHz.
• Cement/Wax
-
Easy to attach & remove. Usable frequency range: DC to
15–20 KHz.
• Magnet
-
Easiest to attach & remove; usable frequency range: D.C.
to 5 Khz.
Test Setup - Establishing a Measurement Grid
• How many measurements?
• Need to take enough measurements to be able to resolve the
highest order mode of interest.
• Too many measurements is a waste of time; too few measurements yields little information about the dynamics of the
structure.
Test Setup - Determining the Reference Point
• When using a shaker, the location of the load cell is the “reference point” (fixed excitation).
• When using an impact hammer, you can do one of two
things:
10-13
rta_3200_training.book Page 14 Monday, March 2, 1998 11:00 AM
3200 TRAINING MANUAL
-
impact at a single point and move the accelerometer (fixed
excitation).
-
fix the accelerometer at one point and move the hammer
(fixed response).
• Fixed response is preferred.
• Once you select a method (fixed response or fixed excitation),
you must adhere to it.
• The reference point is determined by performing a “driving
point” survey.
Test Setup - The Driving Point Survey
• Driving point measurements are Frequency Response Functions in which the force impulse (hammer) and the resulting
response (accelerometer) have been measured at the same
location and axis.
• The driving point survey is used to find the “reference point”
that excites all of the modes of interest.
• Used to avoid the mistake of performing an entire modal test
with the “reference point” on a nodal line.
10-14
rta_3200_training.book Page 15 Monday, March 2, 1998 11:00 AM
3200 TRAINING MANUAL
Fixturing (Boundary Conditions)
• Structures can be tested in free or constrained boundary conditions.
• If you are testing the structure in a free-free boundary condition, the structure can be suspended from soft elastic cords,
or rested on soft foam.
• The highest rigid body mode frequency should be less than
one tenth the frequency of the first structural mode.
• If you are using constrained boundary conditions, you must
make sure that the constraining system’s dynamic properties
do not affect the dynamics of the test item.
Setting Up the Analyzer
• Set the number of FFT lines to established frequency resolution of your measurements.
• Establish the frequency baseband.
• Select the windowing method.
-
Impact test: force window on channel one, exponential
window on channel two.
10-15
rta_3200_training.book Page 16 Monday, March 2, 1998 11:00 AM
3200 TRAINING MANUAL
-
Shaker test with a continuous signal (random noise) use a
hanning window.
• Choose averaging method or detector.
-
Impact test: select count averaging and the number of
averages desired.
-
Shaker test: select the averaging algorithm (linear average) and averaging time.
• Choose measurement units.
• Setup triggering if using the impact method.
• Set the input range (gain) for the A/D.
• Attach the transducers to test item.
Setting up the Model 3200 for Modal Testing
Modal Analysis measurements can be made using a variety of
techniques. The most common utilizes a two channel analyzer
(capable of making cross channel measurements), a calibrated
impact hammer, and an accelerometer. Integral to the impact
hammer is a load cell.
The load cell measures the force of the hammer blow used to
excite the test structure. The accelerometer is used to measure
the resulting response (acceleration) of the structure. These two
signals are measured simultaneously, and a transfer function is
calculated between channel one and channel two. Following are
the steps used to configure the Model 3200 for measuring transfer functions.
Setting up the Model 3200
First, verify that the impact hammer signal is connected to channel one of your Larson•Davis Model 3200, and that the accelerometer signal is connected to channel two.
10-16
rta_3200_training.book Page 17 Monday, March 2, 1998 11:00 AM
3200 TRAINING MANUAL
T
D
1. Turn on the Model 3200 analyzer. After the analyzer has completed its bootup procedure, enter the System Menu by pressing SYSTEM. Next, press CROSS [D].
CROSS enables the Model 3200 to measure cross channel
properties. The transfer function is a cross channel measurement between channel one and channel two.
W
G
2. Next, the analyzer needs to be set up to measure in narrowband, or FFT mode. Press FILTER [G]. The analyzer is now
displaying an autospectrum.
@
L
3. Then select the desired resolution of the narrowband measurement (100 line [I], 200 line [J], 400 line [K], or 800 line [L])
by pressing one of these soft key options. For this exercise,
choose 800 line[L].
[
O
4. After selecting the resolution, select the measurement baseband frequency by pressing BASE-Bd [O].
10-17
rta_3200_training.book Page 18 Monday, March 2, 1998 11:00 AM
3200 TRAINING MANUAL
T
D
5. Your choices for baseband or upper frequency limit are 20
kHz [A], 10 kHz [B], 5 kHz [C], and 2.5 kHz [D]. Since most
of the interesting structural resonances occur at the lower
frequencies, and the impact technique is limited to lower frequency excitation, choose 2.5kHz [D].
If you wish to expand the frequency scale further, first move
the dotted cursor to the extreme left side of the display. To do
this, press CURSOR, then press the left arrow key until the
dotted cursor is at the left side of the display as far as it can
move.
U
E
R
B
6. Next, press SHIFT and the H.SCALE[E].
7. The 1 [A], 2 [B], 4[C]. and 8[D] keys will expand the display
by the associated numerical multiplier. Press 2[B] to expand
the display by a factor of 2.
8. Press EXIT to return to the filter menu.
EXIT
10-18
When making FFT measurements, windows often need to be
applied to the data to prevent a phenomena called spectral
leakage. In the case of an impact modal test, an impact window should be applied to channel one and an exponential
window to channel two.
rta_3200_training.book Page 19 Monday, March 2, 1998 11:00 AM
3200 TRAINING MANUAL
9. Select WINDOW [N].
%
N
Selecting an exponential window (EXP-2 [F], EXP-4 [G], EXP-6
[H]) automatically assigns an exponential window to channel
two and an impact window to channel one. EXP-2 [F] applies an
exponentially decaying curve to the time domain response
(acceleration) so that the response decays to zero at approximately 50% of the measurement duration. EXP-4 [G] insures that
the measurement decays to zero at about 25% of the measurement duration. EXP-6 [H] insures that the measurement decays
to zero at about 16.7% of the measurement duration.
10. Press EXP-4 [G]
W
G
EXIT
!
K
11. After selecting the desired exponential window, leave the
FILTER menu by choosing EXIT. Then, press INPUT [K]
within the SYSTEM menu.
10-19
rta_3200_training.book Page 20 Monday, March 2, 1998 11:00 AM
3200 TRAINING MANUAL
12. Next, select a high and low pass filter (typically in a modal
test, one would choose 1-10K [M]). Choose 1-10K [M] (press
CH2 hardkey and repeat step 12).
#
M
$
CH2
]
P
In the process of making impact measurements, it is often
necessary to establish an offset between the channel one
input range and the channel two input range. This is done
because the channel two response signal is normally greater
than the channel 1 force signal (due to structural resonances).
Select CH2 to activate channel two of the analyzer. Next,
press ∆RANGE [P] to activate the range offset.
13. Then press the right arrow key once to establish a 10 dB offset between channel two and channel one.
EXIT
14. Toggle CH1 and CH2 to verify (on the measurement display)
the 10 dB range difference. Press EXIT to leave the INPUT
menu.
15. Press EXIT again to enter the MAIN menu.
EXIT
X
H
10-20
16. Next, press DETECTOR [H] to set up the measurement averaging method.
rta_3200_training.book Page 21 Monday, March 2, 1998 11:00 AM
3200 TRAINING MANUAL
17. Select COUNT.M [G] averaging.
W
G
COUNT.M (count manual accept averaging) is the averaging
method that should be used when one is measuring transfer
functions using an impact hammer. The COUNT.M method
permits the user to examine the data before the spectrum is
accepted and averaged in with other spectra.
X
H
S
C
SCREEN
SYSTEM
18. Next, choose AV.TIME [H] to establish the number of spectral
averages for the FRF measurement.
19. For this test, we will use 4 averages. Press 4[C].
20. Press SYSTEM to get back into the SYSTEM menu.
10-21
rta_3200_training.book Page 22 Monday, March 2, 1998 11:00 AM
3200 TRAINING MANUAL
V
F
21. You now need to define the measurement units that we wish
to work with. Press UNITS[F] to enter the UNITS menu.
Note that Channel 2 is selected.
R
B
22. From within the UNITS menu, press name[B] so that you
can create the label for the response channel (accelerometer).
We will use g’s.
W
G
23. Press one of the undef (undefined) UNITS keys, such as
undef[K] and type in G.
24. Type EXIT to enter this label.
EXIT
!
K
10-22
25. Press G [K] to activate the label.
rta_3200_training.book Page 23 Monday, March 2, 1998 11:00 AM
3200 TRAINING MANUAL
\
CH1
R
B
27. Press one of the undef (undefined) UNITS keys, such as
undef[L] and type in LBF (pounds force).
T
D
EXIT
26. Press CH1 to activate channel one. Press name[B] so that we
can create the label for the input channel (load cell). Note
that Channel 1 is selected.
T
D
28. Press EXIT to enter this value. Then press LBF[D] to activate
the label.
The last parameter that needs to be configured is triggering.
When using the impact hammer technique, the measurement needs to begin at or before the exact moment of the
hammer blow. Consequently, the analyzer needs to be set up
to trigger from channel one on the positive slope of the time
domain impulse. You also need to establish a delay (or pretrigger on channel one) so that the entire impulse is captured.
29. Press EXIT twice to return to the MAIN menu.
EXIT
#
M
30. Press T.TRIG [M] from the DISPLAY menu.
10-23
rta_3200_training.book Page 24 Monday, March 2, 1998 11:00 AM
3200 TRAINING MANUAL
#
M
31. Next, select a trigger level as a percentage of full range by
pressing LEVEL [M].
32. Use the right arrow hard key to increment the trigger level
(+10% for example). The trigger level can be viewed on the
lower left portion of the 3200 set up summary on the right
hand side of the display screen. Note, positive % indicates a
positive trigger level; negative % indicates a negative trigger
level.
@
L
%
N
10-24
33. Next, check that the analyzer is set up to trigger on a positive
slope. This can be verified by the arrow next to the trigger
level. An arrow pointing upward indicates positive slope
while an arrow pointing downward indicates a negative
slope. The slope can be changed from negative to positive by
pressing SLOPE [L].
34. Press DELAY [N] to establish a pretrigger on channel one.
rta_3200_training.book Page 25 Monday, March 2, 1998 11:00 AM
3200 TRAINING MANUAL
35. Press the left arrow hard key to increment the desired negative delay (-20 samples for instance). This value may need to
be experimented with to make sure that the time domain
impulse has been fully captured. If this signal is not fully
captured (unclipped), measurement errors will result.
36. Press EXIT to return to the MAIN menu.
EXIT
RESET
R/S
37. The 3200 is now set up to make transfer function measurements. Press R/S to arm the trigger.
The 3200 is now waiting for the first average. If you impact
the structure and do not have a resulting measurement, the
input ranges may need to be adjusted. Also, the trigger level
and delay may need to be fine tuned.
Providing that you are successful and have a good measurement on the screen, press SPACE to save the spectra, and
impact the structure again.
Continue taking averages until you feel you have a successful transfer function (typically 4 to 10 averages should suffice).
10-25
rta_3200_training.book Page 26 Monday, March 2, 1998 11:00 AM
3200 TRAINING MANUAL
38. Then, press R/S to halt the measurement.
RESET
R/S
$
CH2
U
E
\
CH1
10-26
39. You are now viewing the input autospectra for channel one.
It should look similar to the display above. Notice that the
spectra is somewhat flat across the frequency band, rolling
off at the higher frequencies. Press CH2 to view the channel
2 autospectra.
40. Now press TIME [E] to view the response time history for
channel two. The signal should decay to zero as does the
measurement in the display below.
41. Press CH1 to view the input time history for channel one. It
should also look similar to the display below. The impulse
from the hammer should be fully captured
rta_3200_training.book Page 27 Monday, March 2, 1998 11:00 AM
3200 TRAINING MANUAL
42. Press X-FER [C] to display the transfer function. This is the
averaged transfer function (sometimes called a frequency
response function) from the test item. Notice the peaks (resonances of the structure).
S
C
NOTE:
Y
I
!
K
Y
I
A vertical offset may need to be used to view the transfer function. To do this press SHIFT, then the V-OFFSET[D] key. Press
the right arrow key to bring the spectrum into view.
43. Press ALTERN[I] to view the phase of the transfer function.
44. Press P<>R[K] to switch from rectangular coordinates to
polar coordinates of the transfer function.
45. You are viewing the real portion of the transfer function.To
view the imaginary part, press ALTERN[I]
10-27
rta_3200_training.book Page 28 Monday, March 2, 1998 11:00 AM
3200 TRAINING MANUAL
T
D
10-28
46. Press COHER. [D] to display the coherence function. The
coherence function is a measure of signal to noise ratio and is
an indicator of the quality of the measurement. A good
“coherent” measurement has a value at or near one all the
way across the frequencies of interest (except at anti-resonances).
rta_3200_training.book Page 1 Monday, March 2, 1998 11:00 AM
CHAPTER
11
Acoustic Intensity
Why use Acoustic Intensity?
• Determine the Sound Power of a noise source
• Locate and rank sources of the sound
Sound Pressure versus Sound Power
• A sound source radiates Sound Power. The result is sound
pressure.
• The perceived Sound Pressure is dependent on the distance
from the sound source plus the measurement environment.
11-1
rta_3200_training.book Page 2 Monday, March 2, 1998 11:00 AM
3200 TRAINING MANUAL
Sound Power Analogy
• A heat source (heater) emits power in watts. The result is a
temperature.
• A sound source emits sound in watts. The result is sound
pressure.
Acoustic Intensity? What is it?
• Sound Intensity is a vector quantity. It describes the net
amount and direction of flow of acoustic power at a point in
space.
• Sound Intensity multiplied times the area over a measured
surface yields sound power.
I2
I1
Area 1
Area 2
r1
r2
Advantages of Acoustic Intensity
• Does not require a special test space (can be done in-situ).
• Measurements not affected by steady ambient noise.
• Easy conversion to Sound Power.
• Can be used to locate sound sources.
• Provides a means to rank sound sources.
11-2
rta_3200_training.book Page 3 Monday, March 2, 1998 11:00 AM
3200 TRAINING MANUAL
Acoustic Intensity measurement hardware
• Microphone probe and a spectrum analyzer.
• Spectrum analyzer should make measurements in octave
bands and/or FFT.
• Spectrum Analyzer should make measurements in real time.
11-3
rta_3200_training.book Page 4 Monday, March 2, 1998 11:00 AM
3200 TRAINING MANUAL
Acoustic Intensity - nuts & bolts
• Acoustic Intensity measurements require simultaneous measurement of sound pressure and particle velocity.
-
i = p•v
• The velocity is estimated by measuring a pressure gradient
(sound pressure difference between the two microphones).
-
vr = -1/ρ ∫ (dp/dr) dt
-
vr = -1/ρ ∫ ((pa-pb)/dr) dt
ρ = fluid density
dp/dr = (P b - P a)/ r
Pa
Pb
direction
r
mic b
mic a
Time Domain
• Pressure estimated by averaging the two microphone pressure.
-
p = (pa + pb)/2
• Intensity = (Pa + Pb)/2ƒ∆r ∫ (pa - pb) dt
• This yields the intensity at a given location and direction for
all frequencies
11-4
rta_3200_training.book Page 5 Monday, March 2, 1998 11:00 AM
3200 TRAINING MANUAL
Frequency Domain
• The Acoustic Intensity in the frequency domain is computed
using the cross spectra between the two microphone channels.
-
I = (-1/ρw∆r)Im(Gab)
ρ = fluid density
w = angular frequency
∆r = microphone spacing
Im (Gab) = Imaginary part of the cross spectra
• This computation is the acoustic intensity at a given location
in a given direction for a single frequency
Measuring Sound Power
Method 1
Acoustic Intensity
6
5
9
8
7
2
3
1
Method 2
4
Sound Pressure
11-5
rta_3200_training.book Page 6 Monday, March 2, 1998 11:00 AM
3200 TRAINING MANUAL
Sound Pressure Method
• Performed typically in an hemi -anechoic or reverberation
room.
• Background sound pressure level should be at least 10 dB
lower than the noise generated by the test article.
• Test procedures are outlined in ANSI S1.34, ISO 7779, ECMA
74, etc.
• Measurements in free-field are taken in a parallel piped rectangle, or a hemispherical dome around the test item.
• Sound pressure is measured in 1/3 octave bands at each of
the microphones
• Sound pressure level is averaged for 8 - 32 seconds.
Sound Power Setup using the Sound Pressure Method
6
measurement
surface
5
microphone
positions
9
8
7
2
3
1
4
11-6
rta_3200_training.book Page 7 Monday, March 2, 1998 11:00 AM
3200 TRAINING MANUAL
Sound Power Calculation for Hemi-Anechoic
• Step 1: Calculate the total averaged sound pressure level
-
Lp = 10 log (1/n ∑ 10 0.1 Lpi)
n = the number of microphone locations
Lp = the total averaged sound pressure level
Lpi = the sound pressure at each microphone
• Step 2: Calculate the total sound power level
-
Lw = Lp + 10 log (S/So)
Lw = the total sound power level
S = the total area of the measurement surface
So = the reference area (= 1 square meter)
Sound Pressure Method (pros and cons)
• Advantages
-
good repeatability
-
standards are well documented
-
instrumentation is relatively inexpensive and easy to use
• Disadvantages
-
anechoic and hemi-anechoic chambers are very expensive
-
field measurements are difficult or impossible
-
test is very time consuming
-
setup is very time consuming
-
background noise (air conditioning, voices, etc.) may
invalidate the test
11-7
rta_3200_training.book Page 8 Monday, March 2, 1998 11:00 AM
3200 TRAINING MANUAL
Why Use Acoustic Intensity?
• Does not require a special test space
• Measurements not typically affected by steady and stationary sources
• Easy conversion to sound power
• Yields location of sound sources
• Provides a means to rank sound sources
The Acoustic Intensity Probe
The Acoustic Intensity probe consists of two phase matched
microphones, hardware to fix the microphones in the proper orientation, signal conditioning, and microphone polarization voltage.
The microphones are kept at a fix distance apart by means of a
spacer.
Typical microphone orientation is face to face.
The probe is directional. A signal in the front of the probe will
register as positive intensity, while a signal at the back of the
probe yields negative intensity. A signal at 90 degrees will result
in zero intensity.
11-8
rta_3200_training.book Page 9 Monday, March 2, 1998 11:00 AM
3200 TRAINING MANUAL
Intensity Probe Spacer Selection
The probe spacer and the microphone diameter will determine
the frequency range for the intensity measurement.
f(Hz)
250
125
1.25K
5K
10K
for accuracy of +/- 1 dB
Large spacer/large microphone diameter for large wavelengths.
Small spacer/small microphone diameter for short wavelengths.
Spacer Errors (High Frequency)
Underestimation at high frequency
2
spacer
0
8 mm
dB
-2
-4
12 mm
-6
50 mm
-8
100 Hz
1 KHz
10 KHz
11-9
rta_3200_training.book Page 10 Monday, March 2, 1998 11:00 AM
3200 TRAINING MANUAL
Intensity Probe Directivity Pattern
Oo
0.0 dB
3O
o
-0.6 dB
o
6O
-3.0 dB
o
9O
-
dB
• Off axis measurements will result in measurement errors.
Measurement Considerations
• Acoustic Intensity measurements can be performed using
FFT (narrowband) or octave bands. Measurement should be
made in real time.
• Acoustic Intensity is measured by spatial averaging. Spatial
averaging is achieved by either taking measurements at a
number of fixed points, or by scanning the probe about a surface. The Acoustic Intensity for the area tested is the average
of the fixed point measurements, or the value determined
during the scan.
• The Acoustic Intensity measurements are done across a measurement surface. The standard measurement surfaces are:
-
11-10
Parallel piped or box
rta_3200_training.book Page 11 Monday, March 2, 1998 11:00 AM
3200 TRAINING MANUAL
-
Hemispherical
-
Conformal
Measurement Techniques
1. Select the spatial averaging technique (fixed point or scan).
2. Establish a measurement grid.
3. Measure the surface area (in square meters).
4. Divide the measurement surface (rectangle or sphere) into
components and subcomponents.
5. Measure the ambient pressure and temperature.
6. Select the proper spacer and microphones. This is determined by the frequency range of interest.
Fixed Point or Scanning
• The fixed point method is preferred if you wish to generate
detailed graphics such as contour maps. (Although you
could scan within a small grid.)
11-11
rta_3200_training.book Page 12 Monday, March 2, 1998 11:00 AM
3200 TRAINING MANUAL
• The fixed point method is more repeatable.
• The fixed point method requires a longer setup time.
• The scanning method is quicker.
• The scanning method is more accurate.
Setting up the Model 3200 for Acoustic Intensity
Measurements
Connect the Larson•Davis Model 2250 (or 2260) Acoustic Intensity probe to channel one and channel two of the 3200 RTA.
Probe cable one (near) should be plugged in the channel one
microphone input. Probe cable two (far) should be plugged in
the channel two microphone input. Connect the remote control
cable (15 pin connector) to the I/O port on the right side of the
3200.
Next, insert the appropriate spacer between the phase matched
microphones (13 mm or 50 mm). In general, the 13 mm spacer is
the appropriate choice for most measurement applications. In
the case where one is interested in low frequency data, the 50
mm spacer should be used.
Acoustic Intensity measurements can be done in full octave
bands, 1/3 octave bands or narrowband (FFT). Since most inten-
11-12
rta_3200_training.book Page 13 Monday, March 2, 1998 11:00 AM
3200 TRAINING MANUAL
sity surveys are performed in 1/3rd octave bands, we will setup
the 3200 RTA accordingly.
1. Press SYSTEM to enter the main menu of the 3200.
SCREEN
SYSTEM
2. Select FILTER [G] to enter the filter menu.
W
G
R
B
Y
I
3. Then choose 1/3oct [B] to activate the 1/3 octave band digital
filters. Press short [G] to select the short filter.
4. Press EXIT to get back to the System menu.
EXIT
!
K
5. Next, we need to select the high and low pass analog filters.
For this example, we will set the high pass filter at 20 Hz.
and the low pass filter at 10 KHz. To do this, press INPUT
[K].
11-13
rta_3200_training.book Page 14 Monday, March 2, 1998 11:00 AM
3200 TRAINING MANUAL
6. Then select 20-10k [N] to activate the 20 Hz and 10KHz filters.
%
N
7. Press the SAME[O] key to assign the 20-10 kHz to channel 2.
8. Press EXIT twice to return to the MAIN menu.
EXIT
Selecting an Exponential detector
For now, keep the detector type set for exponential averaging
and the integrating time at 1/8 sec. If the 3200 is not already set
up for this averaging option (see right side of display), do so at
this time.
EXIT
S
C
11-14
X
H
1. To set these values, first press EXIT. Then choose DETECTR
[H] to enter the detector or averaging menu.
2. Select EXP [C] to activate the exponential detector.
rta_3200_training.book Page 15 Monday, March 2, 1998 11:00 AM
3200 TRAINING MANUAL
3. Then press AV.TIME [H] (averaging time).
X
H
4. Next, select 1/8 [D] sec.
T
D
EXIT
SCREEN
SYSTEM
5. Press EXIT to return to the MAIN menu, then press the SYSTEM hardkey.
Microphone calibration
Next, perform an amplitude calibration for the two probe microphones. To do this, first loosen the microphone fixture on the
probe so that the microphones can be separated. Remove the
spacer. Next, insert the channel one microphone into the opening of your Larson Davis CAL200 or CAL250 calibrator (or any
other SPL calibrator you have).
\
CH1
RESET
R/S
1. Press the CH1 hard key to display channel one. Turn the calibrator on, then press R/S to begin a measurement. Adjust the
input range up or down (using the up or down arrow hard
keys) until the gain level is optimized. One way to do this is
to press the down arrow until an overload occurs. Then press
the up arrow one or two steps.
11-15
rta_3200_training.book Page 16 Monday, March 2, 1998 11:00 AM
3200 TRAINING MANUAL
CURSOR
RESET
R/S
2. Press CURSOR and then move the dotted cursor to the cursor band within which the calibration tone resides (250 Hz
for the CA250 calibrator). Press R/S to stop the measurement. Press UNITS [F],
V
F
X
H
3. Press level [H].
4. Type in the output level of your calibrator (114.0 dB for the
CA250).
5. Press EXIT. Channel one is now calibrated.
EXIT
RESET
R/S
RESET
R/S
11-16
6. To verify calibration, make sure that your calibrator is still on
and press R/S to begin another measurement. The level that
you read at the cursor location should be the output level
that you defined (114.0 dB for the CA250). If not, repeat the
calibration.
7. Press R/S to stop the measurement.
rta_3200_training.book Page 17 Monday, March 2, 1998 11:00 AM
3200 TRAINING MANUAL
$
CH2
EXIT
8. Now calibrate the Channel two microphone. First, remove
the channel one microphone from the calibrator, and insert
the channel 2 microphone. Press CH2 to activate the channel
two display. Repeat the above calibration procedure for
channel two. Press EXIT.
Programming remote control keys
The next step is to program the remote control keys on the 2260
(or 2250) acoustic intensity probe. Notice on the probe handle
that there are two keys or buttons: one on the front of the handle
and one on the back of the handle. The key on the front is KEY
A; the one on the back is KEY B. KEY A and KEY B can be
assigned any function or keystroke of the 3200 RTA. Typically,
one assigns KEY A the task of initiating and terminating a measurement, and KEY B the task of storing a measurement. Let’s go
with this convention.
KEY A
Y
I
KEY B
1. Press I/O [I] to enter the communications menu.
11-17
rta_3200_training.book Page 18 Monday, March 2, 1998 11:00 AM
3200 TRAINING MANUAL
2. Next, press the RS1/INT[G] key.
3. Press INT2260[D] (or INT2250[B]) to initialize the probe.
4. Press EXIT key.
T
D
RESET
R/S
5. Now, to program the KEY A to activate the R/S hard key,
pressthe KEY A [D] first.
6. Then press the “-” hard key followed by the R/S hard key.
Pressing KEY A on the probe will now remotely activate the
measurement process in the 3200.
7.
U
E
11-18
Press KEY B [E] to program KEY B on the probe to remotely
store data.
rta_3200_training.book Page 19 Monday, March 2, 1998 11:00 AM
3200 TRAINING MANUAL
&
STORE
8. Then press “-” followed by the STORE hard key. Pressing
KEY B on the probe will now store the current (displayed)
measurement to the active data file in the 3200 memory.
9. Press EXIT twice to return to the SYSTEM menu.
EXIT
Creating a measurement data file
Next, we need to create a measurement data file. This is the file
where our Acoustic Intensity measurements will be stored.
[
O
1. Press FILES [O] to enter the file menu.
11-19
rta_3200_training.book Page 20 Monday, March 2, 1998 11:00 AM
3200 TRAINING MANUAL
2. Next, press create [A].
Q
A
3. Using the alpha keys above and below the display, create a
file name (such as AITEST).
4. Then press EXIT to enter the file name. Press EXIT again.
EXIT
U
E
EXIT
11-20
EXIT
Notice the file name appears at the lower left corner of the
display. This indicates that this is the active measurement
file. All of our acoustic intensity data records will be stored
in this file.
5. Select INTENSY [E] to activate the Acoustic Intensity analysis measurement option.
6. Press EXIT to leave the SYSTEM menu and enter the Acoustic Intensity display menu.
rta_3200_training.book Page 21 Monday, March 2, 1998 11:00 AM
3200 TRAINING MANUAL
Normalization of input channels
At this point, it is recommended that you phase and amplitude
match the input channels (1 and 2) by performing a channel normalization. You can use the optional built in noise generator of
your Model 3200 or an external noise generator to do this. Please
refer to your user manual to perform a channel normalization.
This is recommended but not required.
Within the Intensity display screen, one can establish the various
acoustic intensity measurement correction parameters. These
include the ambient barometric pressure, temperature and
spacer length.
@
L
1. Press pr/t/sp [L] to edit and enter the values for static pressure (in millibars), temperature (degrees Celsius), and the
spacer length (in millimeters).
EXIT
2. After you have established the values of these parameters,
press EXIT to enter the changes.
11-21
rta_3200_training.book Page 22 Monday, March 2, 1998 11:00 AM
3200 TRAINING MANUAL
Naming a job, part, and area
For a sound power determination, we need to give the test a job
name, and create names for the components (part), and subcomponents (area).
Y
I
EXIT
Z
J
EXIT
11-22
1. Press job [I] to enter the name creation field for the job name.
2. Press the various alpha soft keys to build the job name that
you desire. Then choose EXIT to enter the job name.
3. Press part [J] to enter the name creation field for the part
name.
4. The part would be a subcomponent of the job. Again, press
the various alpha soft keys to create the part name that you
wish. Then choose EXIT to enter the part name.
rta_3200_training.book Page 23 Monday, March 2, 1998 11:00 AM
3200 TRAINING MANUAL
!
K
5. Press area [K] to enter the name creation field for the area
name.
EXIT
6. The area would be a subcomponent of the part. Once again,
press the various alpha soft keys to create the area name.
Then choose EXIT to enter the area name.
EXIT
7. After you enter the area name, you will be prompted to enter
the “area” (in square meters) of the test area. Type in this
value, and then press EXIT to enter this value.
Selecting a Linear Detector
Prior to performing a measurement, adjust the input range of
the 3200 so that it is optimized for the test that you are performing. To do this, first make sure that your test item is on and is
generating noise.
RESET
R/S
1. Then, press R/S to begin a measurement. Adjust the input
range of the 3200 using the up and down arrow hard keys.
11-23
rta_3200_training.book Page 24 Monday, March 2, 1998 11:00 AM
3200 TRAINING MANUAL
2. The proper input range would be at the range setting one or
two steps above the setting where the 3200 overloads. Starting from a high range, step down (using the down arrow
key), the range one 10 dB increment at a time until OVER
appears on the screen. Then arrow up one or two 10 dB
steps. You are now range optimized.
RESET
R/S
X
H
Q
A
X
H
11-24
3. Press R/S to stop the measurement. The autorange feature of
the 3200 can also be used but usually more time consuming
than the manual method.
4. Set the detector for linear single averaging by first pressing
DETECTR [H].
5. Then choose LIN.S[A].
6. Next, press AV.TIME [H].
rta_3200_training.book Page 25 Monday, March 2, 1998 11:00 AM
3200 TRAINING MANUAL
EXIT
7. Enter a DETECTOR TIME of some value between 20 and 60
seconds. In general, you will get a more accurate measurement with a longer averaging time. Press EXIT to enter this
value.
8. Press EXIT to return to the MAIN menu.
Performing a measurement
Now to make a measurement, point the front of the intensity
probe towards the noise source.
RESET
R/S
1. Press KEY A on the probe (or the R/S hard key) to initiate the
measurement. Either “scan” the probe about the measurement surface (in an orthogonal fashion) or fix the probe at a
single point (orthogonal to the surface) until the end of the
averaging time is reached. The first measurement is now
complete.
The 1/3 octave bands above the center line of the display
denote positive acoustic intensity. Bands below the center
line indicate negative intensity.
On the right hand side of the screen, the values for intensity
and sound power are listed for each of the 1/3 octave bands
for this particular spectra and for the overall summations. If
you would like to look at the power and intensity values at
other specific frequencies.
11-25
rta_3200_training.book Page 26 Monday, March 2, 1998 11:00 AM
3200 TRAINING MANUAL
CURSOR
T
D
U
E
S
C
2. Press the CURSOR hard key, then press the left or right
arrow key to move the cursor to the various 1/3 octave
bands.
3. Press SPL [D] to view the averaged sound pressure level that
was measured.
4. Press P.VELOC [E] to view the Particle Velocity that was
measured.
5. Press QUALITY [C] to view the Quality Indicator Function
measurement.
In general, the Quality should be between 0 and -10 dB (no
greater than -15 dB) for the measurement to be deemed
“acceptable”.
11-26
rta_3200_training.book Page 27 Monday, March 2, 1998 11:00 AM
3200 TRAINING MANUAL
6. If you wish to continue the sound power survey, first store
this initial measurement (to RAM) by pressing KEY B on the
probe (or the STORE hard key). Before beginning the next
measurement, change the name of the area by pressing
area [K].
!
K
7. As you did earlier, type in the new area name using the
alpha soft keys.
EXIT
EXIT
8. Then press EXIT to enter this area name. If the surface area
of the measurement is different, change the value (in square
meters). Then press EXIT to enter the new value.
RESET
R/S
&
STORE
9. You are now ready to take the next measurement. Press R/S
to begin the measurement. When the measurement is complete and you are satisfied with the Quality, press STORE to
store the data to memory.
Continue the sound power survey until you have acquired
all of the area measurements for the current part and have
stored them away. You are now ready to go to the next “part”
in the acoustic intensity “job”.
Z
J
10. Press part [J] to create the next part name.
11-27
rta_3200_training.book Page 28 Monday, March 2, 1998 11:00 AM
3200 TRAINING MANUAL
EXIT
11. After you have created the new part name, press EXIT. Continue the test, modifying the area names (and sizes) as you
go along.
12. When you have completed the acoustic intensity test of the
“job”, you can use the summing capabilities of the 3200 to
generate sound power totals for the entire job, or for individual parts.
Q
A
Y
I
13. To do this, first press POWER [A] to bring up the sound
power summation menu.
14. If you are interested in determining the total sound power
emanating from your test item, press S>JOB [I].
Notice that the job name appears at the top right corner of
the display. This field tells you which data will be used for
the sound power summation calculation.
11-28
rta_3200_training.book Page 29 Monday, March 2, 1998 11:00 AM
3200 TRAINING MANUAL
15. In this case, all of the sound intensity measurements for the
job are used. Press Power[A] to initiate the sound power
summation.
Q
A
16. On the display you will see the total sound power spectra of
the job. At the right of the display you can read the values of
the total overall sound power (Linear & A-Weighted) of the
job, plus the sound power at each 1/3 octave band.
CURSOR
Q
A
EXIT
17. Press CURSOR and then the left or right arrow keys to move
the cursor to view the sound power levels at the other 1/3
octave bands. Press EXIT
18. To generate sound power totals for an individual “part” of
the “job”, press S>JOB [I] .
11-29
rta_3200_training.book Page 30 Monday, March 2, 1998 11:00 AM
3200 TRAINING MANUAL
Z
J
19. Next, press S>EDIT [L]. Use the arrow keys to move to the
desired “Part” field. Enter the name of the part for the sound
power calculation.
Now the name of the last part that you created/measured
will appear at the top corner of the display (next to the job
name).
Q
A
20. Press Power[A] to perform the sound power summation.
On the display you will see the total sound power spectra of
the specified part.
At the right of the display you can read the values of the
total overall sound power (Linear & A-Weighted) of the part,
plus the sound power at each 1/3 octave band.
11-30
rta_3200_training.book Page 31 Monday, March 2, 1998 11:00 AM
3200 TRAINING MANUAL
21. To view the sound power of a specific area of a part, press
S>EDIT [L]. Enter the desired area and press EXIT.
22. Press Power [A] to perform the sound power summation.
On the display you will see the total sound power spectra of the
specified job, part, and area.
11-31
rta_3200_training.book Page 32 Monday, March 2, 1998 11:00 AM
3200 TRAINING MANUAL
11-32
rta_3200_training.book Page 1 Monday, March 2, 1998 11:00 AM
CHAPTER
12
Autostore byTACH, vsRPM
Display and Order Tracking
The Model 3200 has the capability to acquire data as a function
of RPM (speed) utilizing the built in tachometer input feature.
This is very useful when measuring vibration or noise from a
device that has a variable operating speed such as a turbine,
transmission, etc.
For this exercise, you will explore the vsRPM features of the
3200 by making vibration measurements on plate that is
attached to a dc motor. As the motor “runs up” or increases in
RPM, the vibration frequencies of the plate will also shift
upward as a function of speed. You will measure the vibration
using an accelerometer although other transducers could be
used for this test as well.
The TACH INPUT of the 3200 is designed to be used with a
tachometer that outputs an analog pulse (TTL) train that is proportional to the rate of rotation of the test device. For this test
you will use an optical pickup in conjunction with the Larson
Davis Model T100 tachometer to detect one pulse per revolution
of the dc motor.
byTACH Autostore Measurements
The first method that you will use to acquire variable RPM data
is the Autostore byTach feature. This method is very similar to
the Autostore byTime function. The key difference that instead
of gathering spectra over a time duration at a specified time
interval, you will capture spectra over a range of RPM values at
a predetermined RPM delta.
12-1
rta_3200_training.book Page 2 Monday, March 2, 1998 11:00 AM
3200 TRAINING MANUAL
For this test, you will capture spectra from the dc motor plate (as
it “runs up” in speed) between 500 RPM and 3000 RPM at 20
RPM increments using autostore. The end result will be a set of
frequency spectra starting at 500 RPM with roughly 20 RPM
increments between them (500, 520, 540...). The last spectrum
acquired will be at 3000 RPM.
Setting up the 3200 Measurement Parameters
OFF
ON
SCREEN
SYSTEM
R
B
W
G
12-2
1. Connect the output of the tachometer to the TACH INPUT of
the Model 3200. Attach the accelerometer (either via a 950B or
AD012 adaptor) to the Channel 1 input. Press ON to boot up
the 3200.
2. Press SYSTEM to get to the main System menu.
3. Press STAND1[B] to enable a single channel measurement.
4. For this exercise, you will use FFT filters and analyze the
data in a range of 0 to 5 kHz. frequency baseband. Press FILTER[G] to enter the filter menu.
rta_3200_training.book Page 3 Monday, March 2, 1998 11:00 AM
3200 TRAINING MANUAL
!
K
%
N
R
B
[
O
5. You will use a 400 line FFT for this test. Press 400line[K] to
establish this frequency resolution choice.
6. Choose an FFT window. You will use a Hanning window for
this measurement. If Hanning is not already enabled, press
WINDOW[N] to enter the Window selection menu.
7. Press HANNING[B] to activate the Hanning window.
8. As mentioned, you will measure our FFT spectra out to 5
kHz frequency. Let's establish this baseband by pressing
BASE-Bd [O].
12-3
rta_3200_training.book Page 4 Monday, March 2, 1998 11:00 AM
3200 TRAINING MANUAL
9. Select 5kHz[C] as the upper band edge frequency.
S
C
EXIT
V
F
R
B
12-4
10. Notice that the frequency scale has changed to reflect this
baseband selection. Press EXIT to get back to the System
menu.
11. Next, let's establish a units label and calibration value for our
accelerometer (or whatever transducer you are using). Press
UNITS[F] to enter the Units selection menu.
12. For this exercise you will use the acceleration label “G's”.
Press name[B] to create this unit name.
rta_3200_training.book Page 5 Monday, March 2, 1998 11:00 AM
3200 TRAINING MANUAL
!
K
W
G
13. You will assign this label to one of the undef keys. Press
undef [K] or another undef key if [K] is already assigned to
another label.
14. Type in G[G] as the units name.
15. Press EXIT to enter this new label.
EXIT
!
K
V
F
16. Now select this new unit key to activate it. Press G [K].
17. Next, let's enter a calibration value for the accelerometer. For
this test you will use the manufacturers specification of the
accelerometer sensitivity of 10 mv/G. Press mV cal [F] to
enter the mV cal entry field.
12-5
rta_3200_training.book Page 6 Monday, March 2, 1998 11:00 AM
3200 TRAINING MANUAL
18. Type in the accelerometer sensitivity value. For this exercise,
type in 10 mV/G as 1.00 E+01.
19. Press EXIT to enter this scale factor.
EXIT
20. Press EXIT again to return to the System menu.
EXIT
!
K
#
M
EXIT
EXIT
12-6
21. Typically with vibration measurements, one is interested in
low frequency information. Let's modify our high and low
pass filters from the current 20Hz. to 20 kHz. selection. Press
INPUT [K] to enter the Input menu.
22. Choose 1-10k [M] to activate a high pass filter at 1 Hz. and a
low pass filter at 10 kHz.
23. Press EXIT to return to the System menu.
24. Next, you need to modify the exponential detector integration time to a faster rate than the 1/8 seconds that it is currently set at. Press EXIT to enter the STAND1 analysis menu.
rta_3200_training.book Page 7 Monday, March 2, 1998 11:00 AM
3200 TRAINING MANUAL
25. Press DETECTR [H] to enter the Detector (averaging) menu.
X
H
X
H
Q
A
EXIT
26. Within the Detector menu, choose AV.TIME [H] to modify the
integration time.
27. Press 1/64 [A] to select the fastest exponential detector integration time.
28. Press EXIT to return to the STAND1 analysis menu.
Setting the byTACH Autostore parameters
]
P
1. As mentioned earlier, you will be utilizing the Autostore
byTach feature for this test. Press AUTOSTR [P] to enter the
autostore menu
12-7
rta_3200_training.book Page 8 Monday, March 2, 1998 11:00 AM
3200 TRAINING MANUAL
2. To activate byTACH autostore, press byTACH [J].
Z
J
!
K
Q
A
3. Notice that the label bTACH appear on the left side of the
display. You next need to configure the tachometer parameters for the autostore acquisition. Press TACHSET K] to enter
the Tach parameter setup menu.
4. The first item that you need to concern yourself with is the
scaling of the tachometer signal as it enters the TACH
INPUT of the 3200. The tach signal enters the 3200 with units
of frequency (cycles or pulses per second). Since you would
prefer to view the tach signal in units of RPM (cycles per
minute) you need to apply a scale factor (multiplier) of 60 to
the signal (60 x (cycles/sec)= cycles/min). Press t.scale [A]
to enter the tachometer scaling entry field.
5. Type in the scale factor of 60 as 6.000 E+01.
12-8
rta_3200_training.book Page 9 Monday, March 2, 1998 11:00 AM
3200 TRAINING MANUAL
R
B
6. As mentioned at the beginning of this chapter, you will be
acquiring spectra from an accelerometer attached to a plate
on a dc motor at 20 RPM increments as it sweeps up in speed
from 500 RPM to 3000 RPM. The range of 500 to 3000 RPM is
our measurement span for the autostore. This range is
entered in the t.span field. Press t.span [B] to get into the
tachometer span entry field.
7. Type in the desired RPM range as LOW/HIGH 00500.0/
03000.0
8. Press EXIT to enter this span.
EXIT
As discussed, for this exercise you would like to capture
spectra during the autostore at 20 RPM increments. Unfortunately, it is nearly impossible to capture data at exactly 20
RPM steps because of the difficulty to precisely control variable speed machinery. Because of this, you need to establish
a range for the autostore “delta” that you would accept a
spectrum using the t.∆min and t.∆max parameters. For
t.∆min you will use 20 RPM. What you are telling the 3200
here is that the minimum increase in speed of the dc motor is
20 RPM before you will capture a spectrum. t.∆max establishes a maximum change in RPM that you would accept.
Normally, one would choose a large number such as 1000
RPM to insure that something is captured.
Setting these delta values is particularly important when
testing things like chain saws whereby it is extremely difficult for the operator to control the running speed.
12-9
rta_3200_training.book Page 10 Monday, March 2, 1998 11:00 AM
3200 TRAINING MANUAL
1. Press t.∆min [C] to enter the minimum tach delta entry field.
S
C
2. Type in 20 RPM as 00020.0 to establish this minimum delta
value.
T
D
3. Next, press t.∆max [D] to enter the maximum tach delta
entry field.
4. Type in 1000 RPM as 01000.0 to establish this maximum delta
value.
12-10
rta_3200_training.book Page 11 Monday, March 2, 1998 11:00 AM
3200 TRAINING MANUAL
U
E
5. t.input toggles between the various options for the TACH
INPUT. The choices are CH1, CH2, and jack. Press
t.input [E] to toggle through the choices until jack is
selected.
x-cal is a feature that allows you to calibrate a tachometer
from a known reference. You feed a known tachometer signal into the TACH INPUT of the 3200. For example, a signal
at 1000 RPM exactly is fed into the 3200. Within the x-cal
field, the 1000 RPM factor is entered as a reference signal.
The 3200 would then be calibrated for this tachometer. You
will not use this feature for this exercise. Please refer to the
3200 User Manual for more details on this feature.
W
G
6. As established earlier, you will acquire data from the dc
motor plate as it sweeps up (runs up) in RPM. You first need
to let the 3200 know that you want to trigger the autostore
when the speed (RPM) reaches 500 RPM as it sweeps up. In
other words, you want the autostore to trigger on the positive slope. If you were doing a rundown measurement you
would establish a trigger on the negative slope. Press
SLOPE [G] and toggle through the choices until “STORE
SLOPE = +” is chosen.
X-AVG is used to average out the errors in the tachometer
signal that might be caused by DC “jittering”. DC “jitter” is
caused by vibrations on the surface of the device that the
tach signal is coming. For example, someone is using an optical pickup to capture a tach signal on a rotating shaft, which
12-11
rta_3200_training.book Page 12 Monday, March 2, 1998 11:00 AM
3200 TRAINING MANUAL
is vibrating due to looseness, imbalance, etc. You will not use
the X-AVG feature for this exercise. Please refer to the 3200
User Manual for more details on this feature.
EXIT
You have now established all of the parameters necessary to
perform the byTACH Autostore measurement. Before you
begin the test, let's create a measurement file where the data
records will be stored. Press EXIT to return to Autostore
menu.
Creating a Measurement File
[
O
Q
A
1. Press FILES [O] to enter the Files menu.
2. Next press create [A].
3. Type in a name for the measurement file such as DCMOTOR.
12-12
rta_3200_training.book Page 13 Monday, March 2, 1998 11:00 AM
3200 TRAINING MANUAL
EXIT
EXIT
4. Press EXIT to enter this filename. Notice that the filename
and creation date and time appear in the MEMORY file window.
5. Press EXIT to return to the Autostore menu.Notice that the
filename appears at the lower left corner of the display. This
indicates that it is the active file where measurement records
will be stored.
You are now ready to make byTACH autostore measurements.
Performing the byTACH Autostore Measurement
Verify that the output of the tachometer is connected to the
TACH INPUT jack of the Model 3200. Also check that the accelerometer is connected (either via a 950B or AD045 adaptor) to
the Channel 1 input. Make sure that your tachometer is turned
on and is reading an accurate tach signal from the rotating test
article that is below the trigger speed (500 RPM).
12-13
rta_3200_training.book Page 14 Monday, March 2, 1998 11:00 AM
3200 TRAINING MANUAL
RESET
R/S
1. Press R/S to initiate the measurement. Notice that the FFT
from the accelerometer is being displayed on the 3200 screen.
Also notice that the trigger is ARMED and waiting. Note the
current RPM reading from the tachometer is displayed on the
lower right side of the display.
2. Next, you will increase the speed of the DCmotor until the
autostored is triggered at 500 RPM. Notice that TRIGGERED
appears at the top corner of the display indicated that the
byTACH autostore has begun.
3. As you continue to increase the speed of the DC motor, spectra will be stored in approximate 20 RPM increments until
the speed reaches 3000 RPM. At that point the autostore is
complete and the data will be automatically stored. Below is
the final spectra acquired at 3000 RPM.
12-14
rta_3200_training.book Page 15 Monday, March 2, 1998 11:00 AM
3200 TRAINING MANUAL
Viewing the byTACH Autostored Data
CLEAR
RECALL
1. To view the individual spectra that were autostored during
the “run up”, press RECALL.
Press the right arrow hardkey to increment through each of
the captured spectra.
Q
A
U
E
1. Another interesting way to view the autostored data is to utilize the waterfall display capability of the 3200. Press
W.FALL [A] to enter the Waterfall display window.
2. First, you need to establish which spectra to show in the display. You do this by establishing a start spectra (typically the
first or 1), an end spectra (typically the last or in this case
number 113), and a delta. You'll set a delta of 3. This means
that it will plot every 3rd spectra in the waterfall map. Press
START [E] to enter these values.
12-15
rta_3200_training.book Page 16 Monday, March 2, 1998 11:00 AM
3200 TRAINING MANUAL
3. These number should be entered as W.FALL s0001, e0113,
d0003.
EXIT
4. Press EXIT to enter the waterfall display values and initiate
the plot.
Below is the DRAW-1 waterfall display. Notice that it plots the
individual spectra on top of one another. Notice how the frequencies have shifted as the speed increased.
T
D
EXIT
5. To view the waterfall map in a skewed, quasi-3D format,
choose DRAW-2 [D].
6. Press EXIT.
vsRPM Graphics
Another useful way to view byTACH autostored data is by
using the vsRPM graphics display feature of the Model
3200.This feature allows one to view either frequencies or orders
in an amplitude vs. RPM format.
12-16
rta_3200_training.book Page 17 Monday, March 2, 1998 11:00 AM
3200 TRAINING MANUAL
1. Press vsRPM [D] to enter the vsRPM Graphics menu.
T
D
T
D
2. The data that is displayed in the vsRPM graphics displayed
is the data that you just acquired during the vsRPM
autostore measurement of the dc motor run up.If the horizontal scaling is different that the 500 to 3000 RPM t.span
that you used to acquire the vsTACH data, you'll need to
modify the X-SPAN. To do this, press X-SPAN [D] to enter
the x-axis scaling entry field.
3. Type in 00500/03000 into the LOW/HIGH entry field.
The vsRPM graphics display has some interesting features.
First, notice that the display is currently viewing 6 different
frequencies (from the accelerometer) as they changed in
amplitude during theDC motor run up. The frequencies that
are currently displayed are shown on the right of the display.
Notice also that each of the 6 traces are labeled accordingly
on the left side of the display.
12-17
rta_3200_training.book Page 18 Monday, March 2, 1998 11:00 AM
3200 TRAINING MANUAL
4. Push the right arrow hardkey to move the cursor along the
RPM axis.The amplitudes of the frequencies at a particular
RPM are shown at the right.
You are currently viewing the following frequency bands in
the vsRPM mode: 12.5 Hz., 25.0 Hz., 37.5 Hz., 50.0 Hz., 62.5
Hz., and 75.0 Hz. To change these values so that you can
view other frequencies, first select a frequency that you wish
to modify. For example, if you would prefer to view the 200
Hz. frequency band instead of the 75 Hz. band, you can
make this change by first pressing the numerical PEN key
associated with the 75 Hz frequency. In this case it would be
PEN 06.
>
6
]
P
12-18
5. Press the numerical hardkey 6 to activate PEN 06.
6. Then, press FREQ [P] to enable the frequency modification
mode.
rta_3200_training.book Page 19 Monday, March 2, 1998 11:00 AM
3200 TRAINING MANUAL
7. Next, press the right arrow key until the PEN 06 frequency
has changed to 200 Hz.
#
M
8. Press REDRAW [M].
The 6 frequency traces will be redrawn on the display. PEN
06 now contains the 200 Hz frequency band. PENS 01
through 06 can be modified in this fashion to display any frequencies that you wish.
Post Process Order Tracking
The vsRPM graphics display also allows us to view orders
rather than frequencies in the amplitude vs. RPM format. The
orders for the byTACH autostored data are calculated using the
tachometer information that is appended with each of the frequency spectra that were acquired during the autostore.
12-19
rta_3200_training.book Page 20 Monday, March 2, 1998 11:00 AM
3200 TRAINING MANUAL
1. To change the display to orders, Press B-ORDER [L].
@
L
S
C
2. The next screen will ask you to SELECT THE MAXIMUM
ORDER. Press 400 [C].
The vsRPM graphics display is now viewing the first 6 orders
(harmonics) as they changed in amplitude during the dc motor
run up. The orders that are currently displayed are shown on the
right of the display. Notice also that each of the 6 traces are
labeled accordingly on the left side of the display.
Push the right arrow hardkey to move the cursor along the RPM
axis.The amplitudes of the orders at a particular RPM are shown
at the right. As you did with the frequency display, you can easily modify the order number that you wish to display in the
same way.
Real-time vsRPM Graphics
There is a method of acquiring vsRPM data without using the
Autostore feature. This technique allows you to view frequency
and order curves live as the data is being acquired. You will
12-20
rta_3200_training.book Page 21 Monday, March 2, 1998 11:00 AM
3200 TRAINING MANUAL
repeat the dc motor run up test using the Real-time graphics
capability of the 3200.
EXIT
X
H
Q
A
1. Press EXIT to return to the Autostore display menu.
2. Press KEEP [H] to get back to the Autostore enable menu.
3. Turn autostore off by pressing OFF [A].
Notice that the bTACH label is removed from the left side of the
display.
EXIT
Z
J
4. Press EXIT to return to the STAND1 display menu.
1. Press vsRPM [J] to enter the Real-time vsRPM graphics display.
The measurement parameters from the byTACH autostore are
still active and will be used for the Real-time vsRPM measurement. Thus, there is no need to modify the parameters. Let's do a
live frequency vs. RPM measurement first.
12-21
rta_3200_training.book Page 22 Monday, March 2, 1998 11:00 AM
3200 TRAINING MANUAL
1. Press B-ORDER [L] to change the trace display to frequency.
@
L
You will use the current PEN frequencies. If you wish to change
them, refer to the previous section (vsRPM Graphics). Note that
the frequencies (or orders) need to be established before the test.
You cannot change PEN frequencies (or orders) after the measurement is complete and redraw the display as you did with
the byTACH autostore data.
Verify that the output of the tachometer is connected to the
TACH INPUT jack of the Model 3200. Also check that the accelerometer is connected (either via a 950B or AD045 adaptor) to
the Channel 1 input. Make sure that your tachometer is turned
on and is reading an accurate tach signal from the rotating test
item that is below the beginning of our X-SPAN (500 RPM).
SHIFT
RESET
R/S
12-22
RESET
R/S
2. Press SHIFT then R/S to reset the measurement.you are now
ready to begin the live vsRPM measurement.
3. Press R/S to initiate the measurement. Notice that since the
RPM of the tachometer signal is below 500 nothing appears
on the display although you can see the trace labels on the
left side. Note the current RPM reading from the tachometer
is displayed on the lower right side of the display.
rta_3200_training.book Page 23 Monday, March 2, 1998 11:00 AM
3200 TRAINING MANUAL
Now as you sweep up the running speed of the dc motor,
you can watch as the selected frequencies change in amplitude as you run up from 500 RPM to 3000 RPM.
RESET
R/S
4. When the speed of the motor reaches 3000 RPM, press R/S to
halt the measurement.The completed measurement appears
below.
As with the vsRPM autostore test, notice that the display is
currently viewing 6 different frequencies (from the accelerometer) as they changed in amplitude during the dc motor
run up. The frequencies that are currently displayed are
shown on the right of the display. Notice also that each of the
6 traces are labeled on the display
CURSOR
&
STORE
5. Press CURSOR to activate the dotted cursor. Push the right
arrow hardkey to move the cursor along the RPM axis.The
amplitudes of the frequencies at each RPM are shown at the
right.
6. When you are finished viewing the data, press STORE to
store the measurement record into the DCMOTOR file.
Notice the message “STORE vsRPM Trace 1" appears at the
top right corner of the display indicating that the data have
been archived.
12-23
rta_3200_training.book Page 24 Monday, March 2, 1998 11:00 AM
3200 TRAINING MANUAL
Real-time vsRPM Order Tracking
@
L
1. Now, let's do a Real-time vsRPM order analysis. Change
from frequency display to order display by pressing
B-ORDER [L].
Q
A
2. Press YES [A] to answer the question: “ARE YOU SURE?”.
You are being scrutinized because answering yes will clear
the display. You will lose the data unless you have already
saved it to the 3200 memory.
S
C
3. The next screen will ask you to SELECT THE MAXIMUM
ORDER. Press 400 [C].
You are now ready to make the measurement. Notice that the
FREQUENCY column on the right side of the display has
changed to ORDER. The measurement is currently set up to
do a live display of orders 1 through 6. If you would prefer
to look at different orders, you can change the order number
as shown in the earlier section, “vsRPM Graphics”.
Once again, check that the output of the tachometer is connected to the TACH INPUT jack of the Model 3200. Also
check that the accelerometer is connected to the Channel 1
12-24
rta_3200_training.book Page 25 Monday, March 2, 1998 11:00 AM
3200 TRAINING MANUAL
input. Make sure that your tachometer is turned on and is
reading an accurate tach signal from the rotating test item
that is below the beginning of our X-SPAN (500 RPM).
RESET
R/S
4. Press R/S to initiae the measurement. Notice that since the
RPM of the tachometer signal is below 500 nothing appears
on the display although you can see the trace labels on the
left side. Note the current RPM reading from the tachometer
is displayed on the lower right side of the display.
Now as you sweep up the running speed of the dc motor,
you can watch as the selected orders change in amplitude as
you run up from 500 RPM to 3000 RPM.
RESET
R/S
5. When the speed of the motor reaches 3000 RPM, press R/S to
halt the measurement.The completed measurement appears
below.
The display is currently viewing 6 different orders as they
changed in amplitude during the dc motor run up. The
orders that are currently displayed are shown on the right of
the display (orders 1 through 6). Notice also that each of the
6 traces are labeled on the display.
12-25
rta_3200_training.book Page 26 Monday, March 2, 1998 11:00 AM
3200 TRAINING MANUAL
&
STORE
6. Press STORE to archive the measurement to the DCMOTOR
file.
Notice the message “STORE vsRPM Trace 2” appears at the top
right corner of the display indicating that the data has been
saved.
12-26
rta_3200_training.book Page 1 Monday, March 2, 1998 11:00 AM
Index
A
Acoustic Intensity
definition 11-1
setup of 2900B 11-12
Analog Input Filters 2-22
Autostore
block averaging spectra 1-33
by time 1-27
byTACH 12-1
display of waterfall 1-31
recalling 1-29
vsRPM 12-16
renaming a 1-21
transferring disk files to analyzer
memory 1-26
transferring to a disk 1-24
Filters
FFT 2-7
Fractional Octave 2-5
Octave 2-5
I
I/O Communications 2-10
I/O port control 2-11
INTENSITY 2-2
B
L
Basic Acoustics
Acoustics
basics 4-1
baud rate 2-10
Beeper Control 2-12
Block Averaging 1-33
Leq 1-4
Linear Scale 3-3
Ln and Statistics Calculations 9-1
Logarithmic Scale 3-3
C
Calculations
statistics and Ln 9-1
Calibration 2-2
on a reference signal 2-4
on a transducer sensitivity value 2-5
Clock
setting 2-24
Color Monitor
activation of 2-24
D
Detectors
selection of 1-10
DETECTR 1-10
Dig.Wgt 1-7
Display weighting 1-5
F
File 1-18
Files
creating a 1-19
deleting a 1-22
recalling a stored record 1-23
3/2/98
M
Main Menu 1-4
Max 1-4
Max.Spec. 1-4
Min 1-4
Modal Analysis
definition of 10-1
setting up the Model 2900B 10-16
Modes of operation 2-1
Multi
display 1-6
N
Noise Generator
Option 10 2-13
Normal 1-4
Note 1-9
O
Order Tracking 12-1
R
Reference Spectrum
defining 3-1
Resets 2-26
Room Acoustics
airborne sound transmission loss
Index-1
rta_3200_training.book Page 2 Monday, March 2, 1998 11:00 AM
measurements 8-27
impact sound isolation 8-34
Noise Ratings 8-35
NC 8-35
NR 8-36
RC 8-36
sound decay measurements 8-2
sound transmission loss measurements
8-21
S
Scale
linear 3-3
logarithmic 3-3
SEL 1-4
Setup
analyzer 1-2
Setups
storage and recall 1-15
Signal Generator
Option 11 2-14
Statistics and Ln Calculations 9-1
T
Triggering 1-12
frequency domain 1-12
W
Waterfall
autostore 1-31
Z
Zoom
changing vertical and horizontal 3-4
Zwicker
Zw.Diff 1-8
Zw.Free 1-8
Index-2
Model 3200 Training Manual
3/2/98
PostScript error (--nostringval--, --nostringval--)