1
Data Consolidation and Importing Software for Microsoft Dynamics
GP Performance Tests
by
Qiang Zhang
Bachelor of Science, Nanjing University
A Project
Submitted to the Graduate Faculty
of the
University of North Dakota
in partial fulfillment of the requirements
for the degree of
Master of Science
Grand Forks, North Dakota
November 2006
ii
iii
TABLE OF CONTENTS
PERMISSION.................................................................................................................... iii
TABLE OF CONTENTS................................................................................................... iv
LIST OF FIGURES ........................................................................................................... vi
LIST OF TABLES............................................................................................................. ix
ACKNOWLEDGMENTS .................................................................................................. x
ABSTRACT....................................................................................................................... xi
CHAPTERS
I.
INTRODUCTION ...................................................................................... 1
1.1 Significance........................................................................................... 1
1.2 Objectives ............................................................................................. 2
1.3 Project Outline ...................................................................................... 3
1.4 Background Information....................................................................... 4
1.5 Report Organization.............................................................................. 5
II.
REQUIREMENTS AND SPECIFICATIONS ........................................... 6
2.1 Requirements ........................................................................................ 6
2.2 Specifications........................................................................................ 7
iv
2.3 Format of Test Results .......................................................................... 8
III.
HIGH-LEVEL AND LOW-LEVEL DESIGN ......................................... 12
3.1 System Architecture............................................................................ 12
3.2 Use Case Diagram............................................................................... 14
3.3 Data Flow Diagrams ........................................................................... 15
3.4 User Interface Design ......................................................................... 24
IV.
IMPLEMENTATION............................................................................... 33
4.1 Class Diagrams ................................................................................... 33
4.2 Data Models and Data Access ............................................................ 44
V.
TESTING AND VERIFICATION ........................................................... 49
5.1 System Testing.................................................................................... 49
5.2 Acceptance Testing............................................................................. 51
VI.
CONCLUSION AND FUTURE WORK ................................................. 57
REFERENCES ................................................................................................................. 59
APPENDIX A................................................................................................................... 61
APPENDIX B ................................................................................................................... 65
v
LIST OF FIGURES
Figure 1. Sample Folder Structure of XML Test Results ................................................... 9
Figure 2. System Architecture .......................................................................................... 13
Figure 3. Use Case Diagram ............................................................................................. 15
Figure 4. Level-1 Data Flow Diagram .............................................................................. 17
Figure 5. Level-2 Data Flow Diagram .............................................................................. 18
Figure 6. Level-3 Data Flow Diagram: Process user input............................................... 20
Figure 7. Level-3 Data Flow Diagram: Parse test files..................................................... 22
Figure 8. Level-3 Data Flow Diagram: Upload results..................................................... 23
Figure 9. User Interface: Main Entry................................................................................ 25
Figure 10. User Interface: Radio Button Disabled............................................................ 27
Figure 11. User Interface: Folder Browser Dialog ........................................................... 28
Figure 12. User Interface: Select Files in List .................................................................. 30
Figure 13. User Interface: File Viewer Example .............................................................. 31
Figure 14. User Interface: Message Box Example ........................................................... 32
Figure 15. Package-Level Class Diagram: Process User Input ........................................ 34
Figure 16. Package-Level Class Diagram: Control Flow and Data Objects..................... 34
Figure 17. Package-Level Class Diagram: Parse Test Files ............................................. 35
Figure 18. Package-Level Class Diagram: Upload Results .............................................. 35
Figure 19. Class-Level Class Diagram: ToolDataAccess................................................. 35
vi
Figure 20. Class-Level Class Diagram: ToolHelper......................................................... 36
Figure 21. Class-Level Class Diagram: DataTable_viewer.............................................. 36
Figure 22. Class-Level Class Diagram: ApplicationSettings and ApplicationItem ......... 37
Figure 23. Class-Level Class Diagram: StatusForm......................................................... 37
Figure 24. Class-Level Class Diagram: UserInputs.......................................................... 38
Figure 25. Class-Level Class Diagram: ObjectXMLSeriaLizer ....................................... 39
Figure 26. Class-Level Class Diagram: Driver................................................................. 39
Figure 27. Class-Level Class Diagram: TestCaseCollection, TestCaseItem,
MachineItem and Event ...................................................................................40
Figure 28. Class-Level Class Diagram: XMLTestFile, XMLTestItem and
XMLEventItem ............................................................................................... 41
Figure 29. Class-Level Class Diagram: TxtTestFile, TxtTestItem and
XMLSingleUserItem....................................................................................... 42
Figure 30. Class-Level Class Diagram: IParser, XMLParser, TXTParser,
LookUpTable and ParserHelper ..................................................................... 43
Figure 31. Class-Level Class Diagram: Loader and LoaderDataAccess .......................... 44
Figure 32. Error Message for an Invalid User Input ......................................................... 50
Figure 33. Table Display for an Invalid Test Data ........................................................... 51
Figure 34. Table Display for Valid Test Data................................................................... 54
Figure 35. Message Box After Processing........................................................................ 54
Figure 36. A Screenshot of ABench Webpage ................................................................. 55
Figure 37. A Screenshot of ABench Webpage ................................................................. 55
Figure 38. A Screenshot of ABench Webpage ................................................................. 56
vii
Figure 39. User Interface: Select Application, OS and Tier ............................................. 62
Figure 40. User Interface: Add or Select Build Number .................................................. 63
Figure 41. User Interface: Select Action on Existing Build Number ............................... 63
Figure 42. User Interface: Enter Test Results Folder and Select Files ............................. 64
Figure 43. User Interface: Start Process ........................................................................... 64
Figure 44. User Interface: Close the Software.................................................................. 64
viii
LIST OF TABLES
Table 1. AllTestCaseLookUp Database Table.................................................................. 46
Table 2. AllTestCasePerfCounters Database Table.......................................................... 46
ix
ACKNOWLEDGMENTS
I would like to express sincere thanks to the many people who have contributed to
the completion of this study. I would like to thank Dr. Wen-Chen Hu for his support and
guidance through the duration of this work. Many thanks to Shawn Hanson, Mark Dowell
and Russ Brown, for their encouragement, advices and assistance on this project. Special
thanks go to my family, for their constant love, understanding and many sacrifices,
without which would have made this work impossible.
x
ABSTRACT
Data compatibility and presentation are always a major issue of computer science.
This project was conducted at the Microsoft Corporation for a complex business
application, Dynamics GP (formerly Microsoft Great Plains). It is a part of the efforts of
publishing the performance test results of a project to a web-based reporting system,
ABench. The proposed system tries to extract and process information from various
sources and save the data into the ABench SQL database with minimal manual
processing.
The proposed system is a database-driven, multi-tier windows application using
C# and .NET. It includes four major components:
1. Graphical user interface: It lets users set up and run the system after entering
necessary information.
2. Configuration & verification unit: It performs the following tasks:
•
Checks file availability, database connectivity, default application setting,
etc.
•
Checks predefined data in database tables.
•
Launches the data parser.
3. Data parser: It includes two functions:
•
Parses and processes data.
•
Saves data by using a consistent format.
xi
4. Data loader: It uploads the processed data to a database.
This project requires knowledge from both of the different performance testing
results and the ABench SQL Server database. Many design/programming features are
used to develop a generic tool such as dynamic instantiation. In addition to software
design and development, the following tasks are also critical to this research:
•
Design and implement algorithms for processing the raw testing data.
•
Establish precise mappings from the test results to the data schemas and
models used by ABench database.
•
Design and implement a helper database for storing configuration information,
lookup tables, etc.
•
Implement an ABench website and database on a local machine for system
development and testing.
xii
CHAPTER I
INTRODUCTION
1.1 Significance
Performance testing is one of the most crucial steps in software development life
cycle. It is used to test the run-time performance within the context of an integrated
system. The application's features and transactions are tested and compared to measurable
goals and objectives, such as response time from the server for a web based application.
A final assessment report detailing executive summaries and pass/fail results is created
for management to make decisions about the product release.
There are many different ways to go about performance testing, depending on the
application type and test purpose. The tests are usually conducted by automated tools
running against scripted test suites and test cases. Final test results are logged on local
disks for further interpretation. These raw test results are organized in different ways
depending on the testing tool. For a complex enterprise solution that normally have a
family of applications, each application can have its own test tool, which will create test
results in totally different form and data format. Because of the data inconsistency,
creating and presenting compatible results are often a frustrating and time-consuming
process.
This software engineering project was conducted at the Microsoft Corporation for
a complex business solution, Dynamics GP, which consists of a variety of applications.
Raw test results are stored in a plain text (TXT) format for some applications and an
1
XML format for others. Currently these raw data have to be converted to Excel
spreadsheets for the management to interpret. The problems of this approach include:
1. With the amount of information generated in a given release, the number of
spreadsheets to monitor becomes cumbersome and difficult to manage.
2. It requires great manual interference from the testers to convert the data.
3. The spreadsheets are difficult to read and interpret.
4. It is not easy to conduct comparisons between results and goals or previous
test runs.
5. It is hard to communicate the results with other teams, as the format is unique
to certain application type.
ABench, a web-based reporting website was chosen to be the achieving and
publishing system for the performance testing team. It provides a uniform framework to
for multiple projects, scenarios, test cases, performance metrics, execution tiers and
baselines. This project is a part of the efforts of publishing the performance test results of
different applications to ABench. It is also desirable that the project to be able to
consolidate and process test results from other possible applications using similar
formats.
1.2 Objectives
The primary objectives for this system are
1. To parse XML results and TXT results according to the application types and
predefined configurations.
2. To process and save the parsed data into the remote ABench SQL database.
2
3. To build a tool that is adaptable to other applications that use similar output
format.
1.3 Project Outline
The proposed system is a database-driven, multi-tier Windows application using
C# and .NET programming. By integrating with ABench website, it is expected to solve
the problems of data compatibility and presentation for performance testing data with
minimal manual processing. After the implementation is completed, initial testing and
debugging will be performed by the developers on the local system. The test team will
then take the project for a satisfaction testing on the product system. Feedback from the
test team will be collected to guide a second iteration of the software development life
cycle.
This project requires knowledge from both of the various performance testing
results and the ABench SQL Server database. Many design/programming features are
used to develop a generic tool such as dynamic instantiation. In addition to software
design and development, the following tasks are also critical for this research:
•
Design and implement algorithms for processing the raw testing data.
•
Establish precise mappings from the test results to the data schemas and
models used in ABench database.
•
Design and implement a helper database for storing configuration information,
lookup tables, etc.
•
Implement an ABench website and database on a local machine for system
development and testing.
3
1.4 Background Information
Some background information about this research include:
•
Microsoft Dynamics GP (formerly Microsoft Great Plains). Microsoft
Dynamics GP is a comprehensive business-management solution built on the
highly scalable and affordable platform of Microsoft technologies. It offers a
cost-effective solution for managing and integrating finances, e-commerce,
supply chain, manufacturing, project accounting, field service, customer
relationships, and human resources [5].
•
ABench website and database. ABench is a scalable and generic framework
for archiving and displaying performance data. It is used by a variety of
performance test teams. The front end provides several viewing options that
range from high-level executive summaries to detailed charts and tables.
. Performance results for various projects are reported using a standard format
making it easy for teams and management read performance results. The
database is hosted on a centrally located server using SQL Server. Users need
to log on with Windows authentication to access the database. The database
uses stored procedures to upload test results to the tables.
•
.NET and C#. The .NET is a framework for programming on the Windows
platform. Along with the .NET framework, C# is a language that has been
designed from scratch to work with .NET, as well as take advantage of all the
features provided by Visual Studio 2005, an object-oriented programming and
development environment [6].
4
1.5 Report Organization
The organization of this report is as follows:
•
Chapter II describes the requirements and specifications of this project.
•
Chapter III contains high-level and low-level design.
•
Chapter IV focuses on implementation of this project.
•
Chapter V is testing and verification.
•
Chapter VI includes conclusion and future directions.
•
Appendix A includes the user manual.
•
Source code is stored in the CD-Rom attached as Appendix B.
5
CHAPTER II
REQUIREMENTS AND SPECIFICATIONS
A requirement specification describes the user’s needs of this system. It serves as
an agreement between the end user and developer, it’s viewed as a definition of what the
implementation must achieve. The performance test team, as the end user of this system,
provided requirements and specifications.
2.1 Requirements
The users have the following functional requirements for the data consolidation
system:
1. Provide a unified method of processing test results. The results are processed
by different tools depending on the application type in the current system.
2. Publish results to the ABench web system with minimal manual intervention.
Only Excel spreadsheets are created for reporting in the current system.
3. The system should be adaptable to other applications that use similar output
formats.
After integration with the ABench website, the whole system should achieve the
following goals:
1. Displays results from performance test runs in an easy to read and interpret
format.
2. Allows comparisons between results and goals or previous test runs.
3. Minimizes manual processing of raw data from test execution to publication.
6
4. Shows product performance over time
The business justifications for this system are specified as follows:
1. Improved productivity for performance test team. In other words, the system
should help the team to cover more tests.
2. Consistency in reporting for program team.
3. Single point of reference for all performance test results.
2.2 Specifications
The system specifications are discussed in the following list:
1. Input:
•
Be able to process TXT and XML performance test results.
•
Be able to specify application type, build number and testing environment
information, such as operating system, data server, web server, etc.
•
The user must have the following two options according to the application
type:
a. Process all test results for a test run
b. Select and process multiple test results
2. Output:
•
Upload processed results to ABench database. Must be able to view test
reports on ABench website.
•
Report errors and warning messages during the process.
•
Create log file at the end of the process.
3. Security:
7
Must work within the constraints of an isolated environment. Performance
tests are primarily run within their own networks, it is important that no
interaction with outside domains be required.
4. Database:
Any database schema and models designed for this system should be flexible
enough to handle a wide variety of performance test types.
5. Data format:
The data must be setup in a way that makes reporting from it easier than the
current methods.
6. Interface:
The interface must be easy to use and not cumbersome to set up. Implicit in
this requirement is that the user should only have to specify a minimal amount
of set up information each time results are imported.
7. System environments: The most popular environments are
•
Windows Server 2003 (Developer can also use Windows XP environment
for development and testing)
•
.NET 2.0 framework
•
SQL Server 2005
2.3 Format of Test Results
As part of the input requirement for this system, the raw test results must be
stored in a consistent agreed upon format, which includes folder structure, folder naming
convention, and file structure. These files contain raw data that needs to be parsed and
summarized into useful data.
8
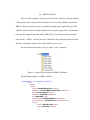
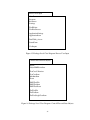
2.3.1 XML Test Results
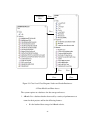
The test results should be stored in a two-level folder structure as shown in Figure
2. The parent folder is the physical location for this test run. The subfolder contains the
XML test files for a certain scenario or module depending on the application type. The
subfolder name should end with the number of users and the string “User” to indicate the
user load. For example, the folder name “APTrx1User” means the scenario or module
name tested is “APTrx”, and only one user is simulated. If a folder name failed to follow
the above convention, default value of the number of users is one.
No constraint for file names as long as it has a “.xml” extension.
Figure 1. Sample Folder Structure of XML Test Results
The following example is a XML result file.
!
"
!
"# #
#
$
# $ ##
" $ $#
%
$
%
9
!
"
# $
%
%
&
…
%
The <test> element contains information of a test suite. The test tags include:
•
<name>: test name
•
<starttime>: time at which the results were logged
•
<type>: the type of test
•
<machine>: machine name on which the test was run
•
<os>: operating system
•
<osVersion>: version of the operating system
•
<netFramework>: version of the .NET framework
•
<event>: information of this particular iteration
The tags inside the <event> tag include:
•
<time>: time at which this iteration of the test case was recorded
•
<type>: type of entry
•
<message>: description message
•
<iteration>: iteration index
•
<data>: total response time for this iteration
10
2.3.2 TXT Test Results
The test results should be stored in a one-level folder structure. The folder is the
physical location for all the TXT files of this test run. No subfolder is allowed. File name
should end with the number of users to indicate the user load. For example, the file name
“glent7.txt” means the scenario or module name is “glent”, and seven users are simulated.
The raw data are saved in delimited plain text file. Each line in the files contain
the following data:
•
TestID: Test ID assigned to a test run
•
UserID: User ID index
•
EventID: a unique ID used to identify a test case
•
Time: time at which the results are logged
•
MSTime: number of milliseconds since benchmarks started
•
Type: flag to show start or stop: 0 = start, 1 = stop
•
RowID: row index
The following is an example of the contents from a result text file.
TestID
100
100
100
100
100
100
100
100
100
100
100
UserID
2
1
4
7
5
3
6
7
1
3
5
EventID
1101
1101
1101
1101
1101
1101
1101
1101
1101
1101
1101
Time
1/1/1900 5:56:15 PM
1/1/1900 5:56:15 PM
1/1/1900 5:56:15 PM
1/1/1900 5:56:15 PM
1/1/1900 5:56:15 PM
1/1/1900 5:56:15 PM
1/1/1900 5:56:15 PM
1/1/1900 5:56:21 PM
1/1/1900 5:56:21 PM
1/1/1900 5:56:21 PM
1/1/1900 5:56:21 PM
11
MSTime
18760
18766
18769
18775
18781
18788
18790
24083
24084
24088
24105
Type RowID
0
0
0
0
0
0
0
1
1
1
1
1
2
3
4
5
6
7
8
9
10
11
CHAPTER III
HIGH-LEVEL AND LOW-LEVEL DESIGN
Based on the specification analysis, several design models of the system are
developed at difference levels of abstraction. This chapter describes the high-level and
low-level design in details.
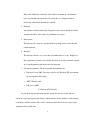
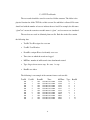
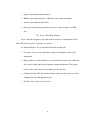
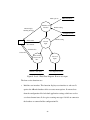
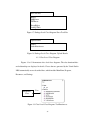
3.1 System Architecture
System architecture is the top-level design that gives us the overview of the whole
project. There are three main architectural pieces as shown in Figure 2:
1. Data consolidation and importing tool, which can be further divided into
several functional components.
2. Raw data files generated by performance test.
These files are the input files for the import tool and must be stored in a
consistent format.
3. SQL database to store the processed data.
The production database is hosted on a remote SQL Server named
RM_PERFORMANCE. For development and testing purpose, the project uses
ABench database on local machine.
12
XML
Results
TXT
Results
User
UI
XML Parser
Configuration &
Verification
TXT Parser
Data Loader
Database
Figure 2. System Architecture
The data consolidation and importing tool itself can be broken down to user
interface and three major functional components:
1. User interface: It allows users to enter necessary information to setup and run
the tool.
2. Configuration & verification unit: This unit performs the following tasks:
•
Receives inputs from the user interface.
•
Checks configuration files availability, Database connectivity, default
application setting, etc.
•
Checks if the predefined data has been setup correctly in Database tables,
such as test cases, performance counters, etc.
•
If existing build number has been selected from the user interface, prompts
user to choose whether to overwrite or append to previous test run.
13
•
Launches the data parser
3. Data Parser: based on the file type of the test results, one of the Parser classes
is instantiated: XMP Parser or TXT Parser. Its functionalities include
•
Get the input files
•
Parse through files and process data, conduct calculation when necessary
•
Organize and save data in a consistent format
•
Pass processed data to data loader
4. Data Loader
•
Get processed data from Parser
•
Verify data integrity according to database model and configuration file
•
Upload the valid results to database
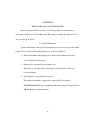
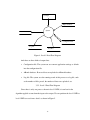
3.2 Use Case Diagram
Use case diagram is used to show the interaction between actors and the system.
An actor represents a user or another system that will interact with the system. A use case
is an external view of the system that represents some action the user might perform in
order to complete a task [1]. In this project the only actor is the user.
The use cases are:
1. Input application settings, which include
•
Input application type
•
Input operating system
•
Input execution tier (hardware and server information)
2. Input build number for this application
3. Specify input files. This task include two steps:
14
•
Input result folder
•
Select test files to process
4. Start process. User starts the process via User Interface.
Figure 3 demonstrates the User Case Diagram for this project.
Input application
name
Input operating
system
Input application
settings
Input execution tier
Input build number
Input result folder
User
Specify input files
Select files
Start process
Figure 3. Use Case Diagram
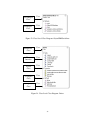
3.3 Data Flow Diagrams
A Data Flow Diagram (DFD) shows the flow of data from external entities into
the system and how the data moves from one process to another. DFD may partition into
levels that represent increasing information flow and function detail. For this project,
three-level DFDs are developed. Figure 4 to Figure 8 show DFDs using the Gane and
Sarson notation [1], which include four symbols:
15
•
Squares representing external entities.
•
Bubbles representing processes, which take data as input and output.
•
Arrows representing the data flows.
•
Open-ended rectangles representing data stores, such as databases or XML
files.
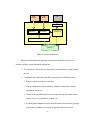
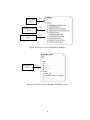
3.3.1. Level-1 Data Flow Diagram
Level-1 data flow diagram is also called context model or a fundamental system
model. The whole system is considered as a process.
As shown in Figure 4, the system takes four kinds of input data:
•
User input: User provides application settings, build number, and test file
information.
•
Helper database: A helper database is needed for the system to store additional
data such as lookup table and performance counter information. The system
needs to access these data to successfully parse the test files.
•
Configuration file: This file contains default settings for this system as well as
configurations for each application type.
•
Test files: Test results to be processed.
16
User Input
Helper database
System
ABench database
Configuration file
Log file
Test files
Figure 4. Level-1 Data Flow Diagram
And there are three kinds of output data:
•
Configuration file: The system can save current application settings as default
into the configuration file.
•
ABench database: Processed data are uploaded to ABench database.
•
Log file: The system save the running record of this process to a log file, such
as the number of files parsed, the number of data rows uploaded, etc.
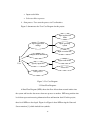
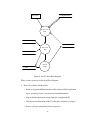
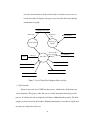
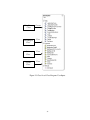
3.3.2. Level-2 Data Flow Diagram
Since there is only one process shown in level-1 DFD, it is unclear for the
algorithm applied to transform the input to the output. We can partition the level-1 DFD to
level-2 DFD to reveal more detail, as shown in Figure 5.
17
Configuration file
User input
Process user
input
Test files
ABench database
Parse test
files
Helper database
Log file
Upload
results
Figure 5. Level-2 Data Flow Diagram
There are three processes in this Data Flow Diagram.
•
Process User Input, which include
o Retrieve data from ABench database tables about available application
types, operating systems, execution tiers and build numbers.
o Extract default application settings from the configuration file.
o Display above information on the User Interface and takes user input.
o Process and pass information to the next process.
18
•
Parse test files, which include
o Get information from the previous process
o Get information from help database and parse the test files
o Pass the processed data to the next process
o Record running information to log file
•
Upload results, which include
o Get processed data from the previous process
o Upload data to ABench database
o Record running information to log file
Please note that level-2 DFD does not show the details about the data flows and
transforms between the processes.
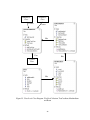
3.3.3. Level-3 Data Flow Diagram
Level-2 DFD can be further partitioned to level-3 DFDs for each process. In these
level-3 DFDs, internal data objects used to transfer information between processes are
explained.
•
Process user input
This process is further broken down to four services functions, as shown in Figure
6. There are two kinds of output data for this process: file information data object and
user input data object. These two data objects will be transferred to the next process.
19
Menu options
Menu display,
Warning message
Initialize user
interface
ABench database
Default setting
Configuration file
User
Select menu,
Input test folder,
Save default
Default setting
Get user
input
Available files
Select files
Parse folder
and save file
info.
Save user
inputs
File info. data object
User input data object
Figure 6. Level-3 Data Flow Diagram: Process user input
The four service functions are:
o Initialize user interface. This function displays user interface to end-user. It
queries the ABench database tables to create menu options. It extracts data
from the configuration file for default application settings, which are used to
set selected menu items. It also gives warning messages if it fails to connect to
the database or cannot find the configuration file.
20
o Get user input. This function gets the user input when the user selects items
from menu, inputs test folder or chooses to save the settings as default. It also
save the default settings to the configuration file if user decides to so.
o Parse folder and save file information. This function will parse through the
folder and display available files to user interface. It takes input when the user
selects from the displayed files. It also extracts the information of “number of
users” from the folder/file names. Finally it saves all the file information into
an easy-access data object.
o Save user inputs. This function saves user inputs into an easy-access data
object.
•
Parse test files
Level-3 DFD for this process is shown in Figure 7. As one can see in the diagram,
this process takes two data objects generated by the previous process. At the end of the
process, it saves the results to a new test case results data object as an output.
Here are the service functions:
o Create parser. This function takes the parser type information from the user
input data object and creates a parser object accordingly.
o Create lookup table. This function gets application type from the user input
data object. It then creates a lookup table in memory by querying the helper
database.
o Parse files. This function takes input from file information data objects, and
then uses the lookup table to find test case information including test case IDs
and names. It parses through every test file, does necessary calculations on the
21
raw data, and summarizes all the results of this test run into a new test case
results data object. It displays message to user if needed and record running
information to log file.
User input data object
Application
type
Parser type
Create lookup table
Create parser
User
Message
Helper database
Test case ID
Test case name
Parse files
Lookup table
Log file
File info. data object
Test case results data object
Test files
Figure 7. Level-3 Data Flow Diagram: Parse test files
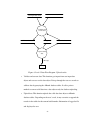
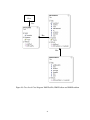
•
Upload results
Figure 8 represents level 3 DFD for this process, which can be divided into two
service functions. This process takes the test case results data object from the previous
process. It validates the data and uploads valid data to ABench database tables. The final
outputs are inserted rows in the database. Running information is recorded in log file and
messages are displayed for the user.
22
Test case results data object
User input data object
Validate and
convert data
Valid Data data object
Log file
ABench database
Upload valid
data
Message
User
Figure 8. Level-3 Data Flow Diagram: Upload results
o Validate and convert data. This function gets inputs from user input data
object and test case results data object. It loops through the test case results to
validate data by querying the ABench database tables. It calls a private
method to convert valid data into a data object ready for database uploading.
o Upload data. This function uploads the valid-data data object to ABench
database tables. Depending on the user’s need, it may overwrite or append the
records in the tables for the current build number. Information is logged to file
and displayed to user.
23
3.3.4. Conclusion of Data Flow Diagrams
These three levels of data flow diagrams give clear insights of system design in a
top-down approach. Detailed design and implementation for each functional component
can start from the level-3 DFDs.
Please be noted that there might be a variety of smaller functional units to support
each service function, such as methods of database access, searching and sorting, etc.
These functional units are the smallest building blocks of the system, however, they are
too detailed to be included in data flow diagrams.
3.4 User Interface Design
User interface design aims to create an effective communication medium between
the user and the system. The design begins with identification of users, tasks and
environmental requirements. After the functionality analysis and modeling, user
scenarios are created to define a set of interface objects and actions. Based on the
interface objects and actions, layouts of the interface elements are generated, such as
menus, icons, buttons, etc.
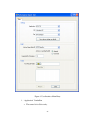
This system uses a windows-based graphical user interface, as shown in Figure 9.
The interface was designed using Microsoft Visual Studio 2005, which provides rich user
interface features for Microsoft Windows operating system.
The user interface is easy to use and setup. The main part of interface is a
Windows Form that prompts the user for additional information for menu items. It has
the following components (Windows controls) and functionalities:
24
Figure 9. User Interface: Main Entry
1. “Application” ComboBox
•
The control is for Select only.
25
•
Items are retrieved from database.
•
User must select an existing Application Type from the list.
2. “OS” ComboBox
•
The control is for Select only.
•
Items are retrieved from database.
•
User must select an existing Operating System from the list.
3. “Tier” ComboBox
•
The control is for Select only.
•
Items are retrieved from database.
•
User must select an existing Execution Tier from the list.
4. “Save above settings as default” Button
•
Set the selected Application type, OS and Tier as the default values. These
data will be saved in the configuration file.
5. “Add or Select Build #” ComboBox
•
User must either write in the box to add a new Build Number or select an
existing one from the dropdown list.
6.
•
Dropdown list items are retrieved from database.
•
Input data validation enabled.
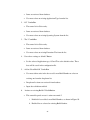
“Actions on existing Build #” RadioButtion
•
This control depends on user’s action on control 5
i. Disabled if user added a new Build Number, as shown in Figure 10
ii. Enabled if user selected an existing Build Number.
26
•
It has two options for the existing Build Number
i. Append new results to the previous test run (default value)
ii. Overwrite the results of previous test run
Figure 10. User Interface: Radio Button Disabled
7. “Expected # of Iterations” TextBox
•
This control depends on data from configuration file
i. Disabled if <showExpectedIteration> value for this application
type is False
ii. Enabled if <showExpectedIteration> value for this application
type is True
•
User needs to input an integer value in the box. The value is used to check
if iterations processed for a test case matches the expectation.
•
Input data validation enabled.
27
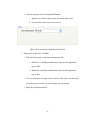
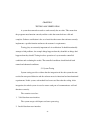
Figure 11. User Interface: Folder Browser Dialog
8. “Test Results Folder” Button
•
User clicks this button to open a Folder Browser Dialog, as shown in
Figure 11. The dialog is used to select the test results folder by navigating
to the location and then clicking OK.
•
The selected full path from Folder Browser Dialog will be shown in the
TextBox (control 9) next to this button.
9. “Test Results Folder” TextBox
•
User has two options to populate this box with the full path of test results
folder
28
i. Click on the button in front of this box and select from the folder
browser dialog, as described previously.
ii. Write the full path in the box.
•
Input data validation enabled.
10. “Show Files”/”Select Files” Button
•
This control depends on the contents of control 9
i. Enabled if “Test Results Folder” TextBox is not empty
ii. Disabled otherwise
•
The name depends on data from configuration file
i. If <alwaysParseAllFiles> value for this application type is true,
name is “Show Files”
ii. If <alwaysParseAllFiles> value for this application type is false,
name is “Select Files”
•
Click it will parse the folder specified in “Test Results Folder” TextBox
(control 9) and populate the below Files ListBox (control 11) with all
eligible files found in the folder.
11. Files ListBox
•
Disabled by default; Enabled after clicking “Show Files”/”Select Files”
Button (control 10).
•
Lists all eligible files found in the test results folder.
•
User needs to selects files to process
29
i. If control 10 is “Select Files”, user can select individual files to
process (see Figure 12). If user does NOT select any file in the list,
ALL files will be processed by default.
ii. If control 10 is “Show Files”, user cannot select individual files to
process. ALL files will be processed always.
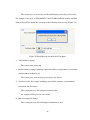
Figure 12. User Interface: Select Files in List
12. File viewer
•
Opens up when user double-clicks a file name in the listbox (control 11).
•
Displays contents of the file in a spreadsheet format for user’s
convenience. Figure 13 shows an example. The file used in the example is
“glent.txt”.
30
Figure 13. User Interface: File Viewer Example
13. “Process” Button
•
Disabled by default; Enabled after Files ListBox (control 11) has been
populated, which means there are files to process.
•
Clicks to start the process, which include
i. Validates input data
ii. Launches backend process driver
14. “Close” Button
•
Close the main Windows Form and terminates the system.
In addition to the controls in main form discussed above, a few Message boxes
are used to display warnings, errors, progress status, etc. when necessary. For example,
Figure 14 shows an error message for invalid input value of Expected iteration.
31
Figure 14. User Interface: Message Box Example
32
CHAPTER IV
IMPLEMENTATION
After completing the high level and low level design, the functional modules are
implemented by using C# and .NET framework. The development environment is Visual
Studio (VS) 2005 and SQL Server 2005 is used for backend database solution. TransactSQL statements are used for database queries and scripts. The complete source code is in
the attached CD. This chapter discusses implementation details by giving class diagrams
and data models and accesses.
4.1 Class Diagrams
Class diagrams are used to describe a group of classes in a system and their
relationships, such as containment, inheritance and associations [2]. A class represents an
entity of a given system that provides an encapsulated implementation of certain
functionality [3]. In C#, classes are composed of three things: a name, attributes that
include fields and properties, and some methods to fulfill the functionalities.
This system consists of thirty classes. Among them, four classes are generated
automatically by the VS development environment to start a Windows Form application.
The remaining classes are explained in detail in class diagrams.
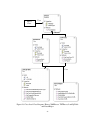
4.1.1 Package-Level Class Diagram
Classes that are either similar in nature or related are grouped in a package. This
provides better readability for complex class diagrams. There are four class packages in
this system, as shown in Figure 15 to Figure 18.
33
Process user input
MainForm
Program
Resources
Settings
ToolHelper
ToolDataAccess
ApplicationSettings
ApplicationItem
DataTable_viewer
StatusForm
UserInputs
Figure 15. Package-Level Class Diagram: Process User Input
Control flow and data objects
Driver
ObjectXMLSerializer
TestCaseCollection
TestCaseItem
MachineItem
Event
XMLTestFile
XMLTestItem
XMLTestEvent
TxtTestFile
TxtTestItem
TxtTestSingleUserItem
Figure 16. Package-Level Class Diagram: Control Flow and Data Objects
34
Parse test files
IParser
XMLParser
TXTParser
ParserHelper
LookUpTable
Figure 17. Package-Level Class Diagram: Parse Test Files
Upload results
Loader
LoaderDataAccess
Figure 18. Package-Level Class Diagram: Upload Results
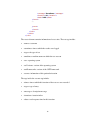
4.1.2 Class-Level Class Diagram
Figures 19 to 31 demonstrate class level class diagrams. The class functionalities
and relationships are displayed in details. Classes that are generated by the Visual Studio
2005 automatically are not described here, which include MainForm, Program,
Resources, and Settings.
MainForm
Class
Uses
Figure 19. Class-Level Class Diagram: ToolDataAccess
35
Uses
MainForm
Class
ApplicationSettings
Class
XMLObjectSerializer
Class
Uses
Uses
Figure 20. Class-Level Class Diagram: ToolHelper
MainForm
Class
Uses
Figure 19. Class-Level Class Diagram: DataTable_viewer
36
Has
Uses
ToolHelper
Class
Figure 20. Class-Level Class Diagram: ApplicationSettings and ApplicationItem
MainForm
Class
Uses
Figure 21. Class-Level Class Diagram: StatusForm
37
MainForm
Class
Creates
ParserHelper
Class
Uses
Driver
Class
Uses
Loader
Class
Uses
Figure 22. Class-Level Class Diagram: UserInputs
38
ParserHelper
Class
Uses
ToolHelper
Class
Uses
Figure 23. Class-Level Class Diagram: ObjectXMLSeriaLizer
MainForm
Class
Uses
IParser
Interface
Uses
Loader
Class
Uses
UserInputs
Class
Uses
LookUpTable
Class
Uses
Figure 24. Class-Level Class Diagram: Driver
39
XMLParser
Class
TXTParser
Class
Creates
Creates
Has
Uses
Has
Loader
Class
Has
Figure 25. Class-Level Class Diagram: TestCaseCollection, TestCaseItem, MachineItem
and Event
40
XMLParser
Class
Uses
Has
Has
Figure 26. Class-Level Class Diagram: XMLTestFile, XMLTestItem and XMLEventItem
41
Has
Uses
Has
TXTParser
Class
Figure 27. Class-Level Class Diagram: TxtTestFile, TxtTestItem and
XMLSingleUserItem
42
Driver
Class
Uses
Inherits
Uses
Uses
Figure 28. Class-Level Class Diagram: IParser, XMLParser, TXTParser, LookUpTable
and ParserHelper
43
UserInputs
Class
Uses
Uses
Uses
TestCaseCollection
Class
Uses
Driver
Class
Figure 29. Class-Level Class Diagram: Loader and LoaderDataAccess
4.2 Data Models and Data Access
The system requires two databases for data storage and access:
1. ABench: It is a database that has been used by a variety of performance test
teams for their projects and has the following features:
•
It is the backend data storage for ABench website.
44
•
It is the production database that holds all the processed test results.
•
In this system, it is the destination for uploading data; it is also used
for system initialization and data validation.
2. Helper: It is a database designed and developed for this system only.
•
As the name suggests, it helps the system to do the parsing.
•
It holds the information that cannot be included in the ABench
database.
4.2.1 Data Models
Whether the database is designed reasonable and sufficient will have a direct
effect on the quality of the application. Data models focuse on what data should be stored
in the database. For relational database, the data model is used to design the relational
tables.
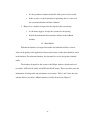
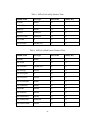
The database designed for this system is the Helper database, which consists of
two tables: AllTestCaseLookUp and AllTestCasePerfCounters. These two tables store the
information of lookup table and performance test counters. Table 1 and 2 show the data
schema of these two tables. ABench database is briefly discussed in Chapter 1
.
45
Table 1. AllTestCaseLookUp Database Table
Collumn Name
Data Type
Allow Nulls
Primary Key
ProjectID
smallint
No
No
TestCaseType
char(50)
Yes
No
NumUsers
smallint
Yes
No
FileName
varchar(64)
Yes
No
OrigTestCaseID
varchar(64)
Yes
No
TestCaseID
Int
No
No
TestCaseName
nvarchar(255)
No
No
Table 2. AllTestCasePerfCounters Database Table
Collumn Name
Data Type
Allow Nulls
Primary Key
ProjectID
smallint
No
Yes
TestCaseID
int
No
Yes
TestCaseName
nvarchar(255)
No
No
TestCaseType
char(50)
No
Yes
TestCaseTypeID
int
No
No
TestCaseOwner
char(50)
No
No
TestCaseOwnerID
smallint
No
No
TestCasePriority
smallint
No
No
ScenarioID
Smallint
No
No
PerfCounterID
Smallint
No
Yes
PerfCounterOrder
Smallint
No
No
PerfCounterName
varchar(50)
No
No
PerfCounterUnitID
Smallint
No
No
46
4.2.2 Data Access
From the data access point of view, the system can be largely divided into the
following three layers:.
•
Data Presentation Layer: It contains User Interface components
•
Business Logic Layer: It contains the parsing and processing modules.
•
Data Access Layer: It is used to access and perform operations on database
tables.
1)
Connects to the database
2)
Retrieves data from database
3)
Uploads processed data to database
Data Access layer encapsulates database related operations. As a result, it makes
it easier to maintain the data manipulation methods without affects other modules.
The data access layer developed for this system includes two classes:
ToolDataAccess class and LoaderDataAccess. Please refer to the class diagrams Figure
20 and Figure 28 for their description. These classes make use of Microsoft ADO.NET
and stored procedures written with Transact-SQL statements.
Following is a sample method in ToolDataAccess class. The method is used to
retrieve the maximum value of a field in a database table. Inputs are the TableName
string and FieldName string. Out put is an integer, or 0 if the result is not found. Sample
usage is GetMax (“TestCaseTable”, “TestCaseID”).
// Retrieve the Max value of FieldName in TableName
public int GetMax(string TableName, string FieldName)
{
DbCommand getMax = _db.GetSqlStringCommand("SELECT Max(" +
FieldName + ") FROM " + TableName);
object result = _db.ExecuteScalar(getMax);
47
if (result == null || result.ToString() == string.Empty)
{
return 0;
}
else
{
return int.Parse(result.ToString());
}
}
In this method, “_db” is the database connection. “GetSqlStringCommand” is a
method to create a database command from an in-line Transact-SQL query string.
“ExecuteScalar” queries the database and returns result to object “result”. If “result” is
not “null” or empty string, it is parsed to an integer and finally returned.
48
CHAPTER V
TESTING AND VERIFICATION
A system that cannot be trusted to work correctly has no value. This means that
the programs must function correctly and the results that come back are valid and
complete. Software verification is the set of activities that ensure that software correctly
implements a specific function and meets the customer’s requirements.
Testing plays an extremely important role in verification. It should intentionally
attempt to find problems, for example things happen when they shouldn't or things don't
happen when they should. Testing involves operation of a system under controlled
conditions and evaluating the results. The controlled conditions should include both
normal and abnormal conditions.
5.1 System Testing
System testing provides evidence that the integration of the sub-systems has not
resulted in unexpected behavior and the software meets its functional and non-functional
requirements. In this system, each module has been tested first after the coding. After
integration, the whole system is tested to ensure each part of it communicates well and
functions correctly.
The scenarios tested are:
1. Valid data from user interface:
The system accepts valid inputs and starts processing.
2. Invalid data from user interface:
49
The system gives error message for the invalid input, processing is not started.
For example, if we enter “c:\NoSuchFolder” in the TestResultsFolder textbox and then
click on Select Files button, the system gives the following error message (Figure 32):
Figure 30. Error Message for an Invalid User Input
3. Valid database settings
The system starts processing.
4. Invalid database settings, including connection failure, wrong database server name,
wrong database credential, etc.
The system gives error message, processing is not started.
5. Good test results file settings, including correct folder structure, correct naming
convention and file format.
The system processes files and gives correct results.
An example will be given in next section.
6. Bad test results file settings
The system processes files and displays information to user.
50
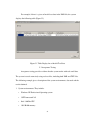
For example, if there’s a piece of invalid test data in the XML file, the system
displays the following table (Figure 33):
Figure 31. Table Display for an Invalid Test Data
5.2 Acceptance Testing
Acceptance testing provides evidence that the system works with real world data.
The system is tested extensively using real test files, including both XML and TXT files.
The following example gives a description of the system environments, data used and the
results obtained.
1. System environments: They include:
•
Windows XP Professional Operating system
•
.NET framework 2.0
•
Intel 1.66Ghz CPU
•
1.0G RAM memory
51
2. Database settings: The settings include:
•
Database server: local machine Sony Vaio Laptop
•
Instance name: (local)\SQLEXPRESS
•
Security: windows authentication
•
Database name: ABench
3. Test files information:
•
Test results folder: C:\Qiang\project_implementation\BPResults
•
Number of test files: 18
•
Type of test files: XML
•
Sample of test file: (Only part of the contents are listed here)
'( )
$
"
!
"
!
"# #
#
# $ ##
!
#
"
%
%
##
#
""
4. Inputs from user interface: The input include:
•
Application type: BP-STD
•
OS: Windows XP
52
# $
•
Tier: BP-Standard
•
Bulild #: BP-Test-Qiang
•
Expected # of Iterations: 10
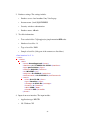
5. Results: The results include:
•
Files are parsed and processed. Figure 34 shows the valid data processed.
•
Results are successfully uploaded to ABench database. Figure 35 shows the
information. Totally 192 test cases are parsed and 3302 rows are uploaded to the
database.
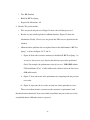
•
ABench website publishes the new updated data for this build number “BP-TestQiang”, as shown in Figure 36, 37 and 38.
i. Figure 36 shows the executive summery for the Build # “BP-Test-Qiang”. As
we can see, the two test cases listed in the table have passed the predefined
Goals. For example, the performance value of test case “3000290BP-AdminUI-Loader-Home-5User” is 2683 milliseconds, which is below the Goal set as
6500 milliseconds.
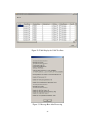
ii. Figure 37 shows the trend of the performance by comparing with the previous
test results.
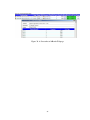
iii. Figure 38 represents the test values of each user for the particular test case.
These tests indicate that the system meets the customer’s requirements, both
functional and un-functional. It can successfully consolidate and process the test results
and publish them in ABench website as expected.
53
Figure 32. Table Display for Valid Test Data
Figure 33. Message Box After Processing
54
Figure 34. A Screenshot of ABench Webpage
Figure 35. A Screenshot of ABench Webpage
55
Figure 36. A Screenshot of ABench Webpage
56
CHAPTER VI
CONCLUSION AND FUTURE WORK
In this project, a data consolidation and importing software was design and
developed. It is a database-driven, multi-tier Windows application using C# and .NET
programming. The project is a part of the efforts of publishing the performance test
results of different applications to ABench web reporting system. The main
functionalities of this system are
4. Parse XML results and TXT results according to the application types and
predefined configurations.
5. Process and save the parsed data into the remote ABench SQL database.
6. Process test results of other applications that use similar output format.
Requirements specification, design and implementation details are included in this
report. Many design/programming features are used to develop a generic tool such as
dynamic instantiation. After the implementation is completed, the system was tested by
real test files and gave correct results as expected. As a conclusion, it solves the problems
of data compatibility and presentation for performance testing data with minimal manual
processing.
This project requires knowledge from both of the various performance testing
results and the ABench SQL Server database. In addition to software design and
development, the following tasks are also critical for this research:
•
Design and implement algorithms for processing the raw testing data.
57
•
Establish precise mappings from the test results to the data schemas and
models used in ABench database.
•
Design and implement a helper database for storing configuration information,
lookup tables, etc.
•
Implement an ABench website and database on a local machine for system
development and testing.
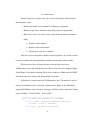
Future work for this project can include:
1. In the current system, users need to modify and save configurations in XML
files. A configuration dialog in the user interface can be used to manage
configurations.
2. In the current system, the data tables of the Helper database have to be created
and populated manually. A function that will initialize these tables from the
user interface can be added to the system.
3. The current system can only process test results in TXT and XML formats. It
will be more beneficial if test results in other formats can also be processed,
such as Excel spreadsheets.
58
REFERENCES
[1] Martin Fowler, Kendall Scott, UML Distilled: A Brief Guide to the Standard Object
Modeling Language, second edition Addison-Wesley, 2000
[2] Carlo Ghezzi, Mehdi Jazayeri, Dino Mandrioli , Fundamentals of Software
Engineering, second edition, Prentice Hall, 2002
[3] Roger S. Pressman, Roger Pressman, Software Engineering, sixth edition, McGrawHill Science/Engineering/Math, 2005
[4] Remez Elmasri, Shamkant B. Navathe, Fundamentals of Database Systems, third
edition, Addison-Wesley, 2000
[5] Product information for Microsoft Dynamics GP, Retrieved November 10, 2006,
from http://www.microsoft.com/dynamics/gp/product/productoverview.mspx
[6] Christian Nagel, Bill Evjen, Jay Glynn, Morgan Skinner, Karli Watson, Allen Jones,
Professional C# 2005, third version, Wrox, 2005
[7] Juval Lowy, Programming .NET Components, second version, O'Reilly Media, 2005
[8] Cem Kaner, Jack Falk, Hung Q. Nguyen, Testing Computer Software, second version,
Wiley, 1999
[9] Erik T. Ray, Learning XML, second version, O'Reilly Media, 2003
59
APPENDICES
APPENDIX A
User Manual
This user manual provides instructions of how to setup and use the Data
Consolidation and Importing Software. Users should follow the following steps:
1. Check system configuration
Make sure the computer running this system have the following configurations:
•
Operating system: Windows Server 2003 or Windows XP Professional
•
.NET framework version: 2.0
2. Obtain user permission
The user must get appropriate credentials to databases:
•
The user has access to ABench and Helper database server
•
The user has permission to upload and delete records on ABench
3. Prepare test results
The test results must be stored in a consistent agreed upon format, which include
folder structure, folder naming convention and file structure.
•
Please refer to “ Format of Test Results” in Chapter 3.
4. Install the software
Copy the whole product folder of “ PerfImportTool” to local disk. The folder contains
•
One executable file: “ PerfImportTool.exe”
•
Three dynamic link library (DLL) files: “ Parser.dll” ,
“ Microsoft.Practices.EnterpriseLibrary.Common.dll” and
“ Microsoft.Practices.EnterpriseLibrary.Data.dll”
•
Two configuration files: “ PerfImportToo.exe.config” and “ PerfToolSettings.xml”
61
5. Setup configuration files
•
Open up “ PerfImportToo.exe.config” , find the following statement
!
"
#$ % &'
'
(
( )* &
! % *
&
!
•
"
#$
'
% &'
(
( )* &
Change the “ Server=(local)\SQLEXPRESS” to your database server instance
name.
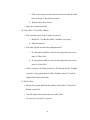
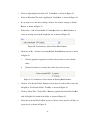
6. Start the system: click on “ PerfImportTool.exe” , the main entry Windows form will
display on the screen.
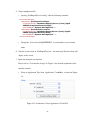
7. Input data using the user interface
Please refer to “ User interface design” in Chapter 3 for detailed explanation of the
interface controls.
•
Select an Application Type from “ Application” ComboBox, as shown in Figure
39.
Figure 39. User Interface: Select Application, OS and Tier
62
•
Select an Operating System from “ OS” ComboBox, as shown in Figure 39.
•
Select an Execution Tier from “ Application” ComboBox, as shown in Figure 39.
•
If you want to save the above settings, click on “ Save above settings as default”
Button, as shown in Figure 39.
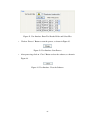
•
Write in the “ Add or Select Build #” ComboBox add a new Build Number or
select an existing one from the dropdown list, as shown in Figure 40.
Figure 40. User Interface: Add or Select Build Number
•
Check one of the “ Actions on existing Build #” RadioButtions accord, as shown
in Figure 41.
i.
Click on Append to append new results to the previous test run (default
value)
ii.
Click on Overwrite to overwrite the results of previous test run
Figure 41. User Interface: Select Action on Existing Build Number
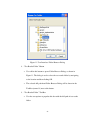
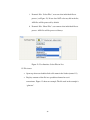
•
Click on “ Test Results Folder” Button to locate the test results folder or write the
full path in “ Test Results Folder” TextBox, as shown in Figure 42.
•
Click on “ Show Files” /” Select Files” Button to populate the below Files ListBox
with all eligible files found in the folder, as shown in Figure 42.
•
Select files from the Files ListBox to process. Do not select any file is all files are
to processed, as shown in Figure 42.
63
Figure 42. User Interface: Enter Test Results Folder and Select Files
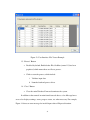
•
Click on “ Process” Button to start the process, as shown in Figure 43.
Figure 43. User Interface: Start Process
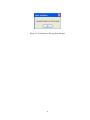
•
After processing, click on “ Close” Button to close the software, as shown in
Figure 44.
Figure 44. User Interface: Close the Software
64
APPENDIX B
Source Code
The source code is not printed. It is stored in the accompanied Compact Disk.
65