1
Instruction Manual
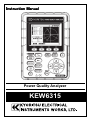
Power Quality Analyzer
KEW6315
Contents
KEW6315
Contents 1
Unpacking Procedure 5
Safety warnings 8
Chap. 1 Instrument overview 11
1.1 Functional overview 11
1.2 Features 13
1.3 Constructional drawing 14
1.4 Steps for measurement 15
Chap.2 Instrument layout 16
2.1 Display (LCD)/ Keys 16
2.2 Connector 17
2.3 Side face 18
2.4 Voltage test lead and Clamp sensor 19
Chap.3 Basic operations 20
3.1 Key operation 20
3.2 Icons on the LCD 21
3.3 Symbols on the LCD 22
3.4 Backlight and Contrast Adjustment 22
3.5 Screens 23
Inst/ Integration/ Demand 23
Vector 24
Waveform 24
Harmonic Analysis 25
Power quality 26
Settings 26
Chap.4 Getting started 27
4.1 Preparation 27
Putting Input terminal plate on the Input terminal 27
Attaching Markers to Voltage test leads and Clamp sensors 28
-1-
KEW6315
KEW6315
Contents
4.2 Power Supply 29
Battery 29
Battery Mark on the LCD/ Battery level 30
How to install batteries 31
Power cord connection 31
Power supply rating 32
4.3 Placing / removing SD card 33
Inserting SD card 34
Removing SD card 34
4.4 Voltage test leads and Clamp sensor connection 35
4.5 Start KEW6305 36
Start-up Screen 36
Cautionary message 36
4.6 Recording procedures 37
Start of recording 37
End of recording 38
Start measurement with “Quick start guide” 39
Chap.5 Settings 47
5.1 List of setting items 47
5.2 Basic setting 48
Settings of wiring system 49
Wiring connection 51
Settings of voltage measurement 53
VT/CT 54
Settings of current measurement 56
Settings of External input terminal/ reference frequency 58
5.3 Measurement setting 59
KEW6315
Settings of demand measurement 59
Outline of demand measurement concept 62
Settings for Harmonic analysis 63
Threshold setting for Power quality (Event) 65
-2-
Contents
KEW6315
Filter setting for Flicker measurement 69
Target power factor for Capacitance calculation 70
5.4 Recording setting 71
Settings for recording items 72
Saved items 73
Recording method 74
Possible recording time 76
5.5 Other settings 77
Settings for system environment 77
KEW6315 Setting 79
5.6 Saved data 82
To delete, transfer or format the recorded data 82
Type of the saved data 87
KEW6315 settings and Data loading 89
Chap. 6 Displayed items 92
6.1 Instantaneous value “W” 92
List display of the measured values 92
Zoom display 96
Displaying Trend graph 97
Changing displayed items and display position 99
6.2 Integration value “Wh” 100
6.3 Demand 102
Showing the measured values 102
Shifts in specific period 103
Demand change 104
6.4 Vector 105
6.5 Waveform 107
6.6 Harmonics 108
Displaying harmonics on the bar graph 108
Displaying the list of harmonics 112
-3-
KEW6315
KEW6315
Contents
6.7 Power quality 114
Factors impair power quality and symptoms 114
Displaying recorded events 116
Displaying measured flicker values in list form 120
Displaying trend graph of Pst, 1min 121
Displaying changes of Plt 122
Chap.7 Other functions 123
Chap.8 Device connection 125
8.1 Data transfer to PC 125
8.2 Using Bluetooth® function 126
8.3 Signal control 126
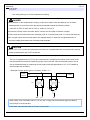
Connection to input/ output terminals 126
8.4 Getting power from measured lines 128
Chap. 9 PC software for setting and data analysis 129
Chap.10 Specification 130
10.1 Safety requirements 130
10.2 General specification 130
10.3 Measurement specification 133
Measured items and the number of analysis points 133
Items measured at Instantaneous measurement 134
Items to be calculated 137
Items measured at Integration measurement 140
Items measured at Demand measurement 143
Items measured at Harmonics measurement 144
Items measured at Power quality measurement 149
10.4 Specification of Clamp sensor 152
Chap. 11 Troubleshooting 157
11.1 General troubleshooting 157
11.2 Error messages and actions 158
KEW6315
-4-
Unpacking Procedure
KEW6315
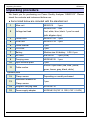
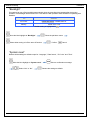
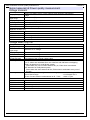
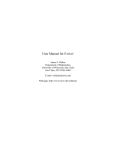
Unpacking procedure
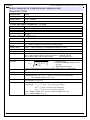
We thank you for purchasing our Power Quality Analyzer “KEW6315”. Please
check the contents and instrument before use.
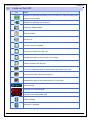
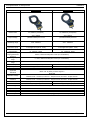
● Items listed below are included with the standard set:
1
Main unit
KEW6315
:1 pce
MODEL7255 :1 set
2
Voltage test lead
*red, white, blue, black: 1 pce for each
(with alligator clips)
3
Power cord
MODEL7169 :1 pce
4
USB cord
MODEL7219 :1 pce
5
Quick manual
1 pce
6
CD-ROM
1 pce
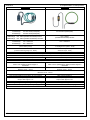
7
Battery
Alkaline size AA battery LR6: 6 pcs
8
SD card
M-8326-02
9
Carrying case
MODEL9125 :1 pce
10
Input terminal plate
1 pce
11
Cable marker
:1 pce (2GB)
8-color x 4pcs each (red, blue, yellow,
green, brown, gray, black, white)
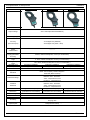
Optional parts
12
13
Clamp sensor
Instruction manual for
Clamp sensor
Depending on model purchased
1 pce
14
Magnetic carrying case
MODEL9132
15
Power supply adapter
MODEL8312(CAT. III 150V, CAT. II 240V)
-5-
KEW6315
KEW6315
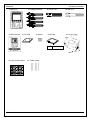
Unpacking Procedure
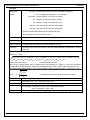
1. Main unit
5. Quick manual
2. Voltage test lead
6.CD-ROM
3. Power cord
7. Battery
8. SD card
2GB
10. Input terminal plate
KEW6315
11. Cable marker
-6-
M-8326-02
4.USB cord
9. Carrying case
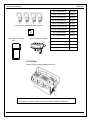
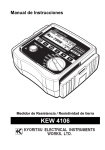
Unpacking Procedure
KEW6315
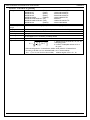
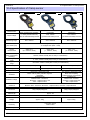
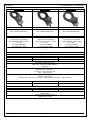
12. Clamp sensor (depending on model purchased)
13. Instruction manual for Clamp sensor
14. Magnetic carrying
case
15. Power supply adapter
50A Type(ø24mm)
M-8128
100A Type(ø24mm)
M-8127
200A Type(ø40mm)
M-8126
500A Type(ø40mm)
M-8125
1000A Type(ø68mm)
M-8124
3000A Type(ø150mm)
M-8129
1000A Type(ø110mm)
M-8130
10A Type(ø24mm)
M-8146
10A Type(ø40mm)
M-8147
10A Type(ø68mm)
M-8148
1A Type(ø24mm)
M-8141
1A Type(ø40mm)
M-8142
1A Type(ø68mm)
M-8143
● Storage
Store the items as shown below after use.
● In case any of the items listed above are found to be damaged or missing or if
the printing is unclear, please contact your local KYORITSU distributor.
-7-
KEW6315
KEW6315
Safety warnings
Safety warnings
This instrument has been designed, manufactured and tested according to IEC 61010-1: Safety requirements
for Electronic Measuring apparatus, and delivered in the best condition after passing quality control tests.
This instruction manual contains warnings and safety procedures which have to be observed by the user
to ensure safe operation of the instrument and to maintain it in safe condition. Therefore, read through
these operating instructions before starting to use the instrument.
WARNING
- For about Instruction manual ● Read through and understand the instructions contained in this manual before using the instrument.
● Keep the manual at hand to enable quick reference whenever necessary.
● The instrument is to be used only in its intended applications.
● Understand and follow all the safety instructions contained in the manual.
● Read the enclosed Quick manual after reading this instruction manual.
● As to the Clamp sensor use, refer to the instruction manual supplied with the sensor.
It is essential that the above instructions are adhered to. Failure to follow the above instructions may cause
injury, instrument damage and/or damage to equipment under test. Kyoritsu assumes no responsibility for
damage and injury caused by misuse or not following the instructions in the manual.
The symbol
indicated on the instrument, means that the user must refer to the related parts in the manual for
safe operation of the instrument. It is essential to read the instructions wherever the symbol appears in the manual.
DANGER
: is reserved for conditions and actions that are likely to cause serious or fatal injury.
WARNING
: is reserved for conditions and actions that can cause serious or fatal injury.
CAUTION
: is reserved for conditions and actions that can cause injury or instrument damage.
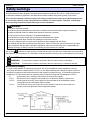
Measurement Category
To ensure safe operation of measuring instruments, IEC 61010 establishes safety standards for various
electrical environments, categorized as O to CAT.IV, and called measurement categories. Higher-numbered
categories correspond to electrical environments with greater momentary energy, so a measuring instrument
designed for CAT.III environments can endure greater momentary energy than one designed for CAT.II.
O
: Circuits which are not directly connected to the mains power supply.
CAT.II
: Electrical circuits of equipment connected to an AC electrical outlet by a power cord.
CAT.III : Primary electrical circuits of the equipment connected directly to the distribution panel,
and feeders from the distribution panel to outlets.
CAT.IV : The circuit from the service drop to the service entrance, and to the power meter and
primary overcurrent protection device (distribution panel).
KEW6315
-8-
Safety warnings
KEW6315
DANGER
● The instrument is to be used only in its intended applications or conditions. Otherwise, safety functions
equipped with the instrument will not work, and instrument damage or serious personal injury may
occur. Verify proper operation on a known source before taking action as a result of the indication of the
instrument.
● With attention to the measurement category to which the object under test belongs, do not make
measurements on a circuit in which the electrical potential exceeds the following values.
* 300V AC for CAT. IV, 600V AC for CAT. III, 1000V AC for CAT. II
● Do not attempt to make measurement in the presence of flammable gasses. Otherwise, the use of the
instrument may cause sparking, which can lead to an explosion.
● Never attempt to use the instrument if its surface or your hand is wet.
- Measurement ● Do not exceed the maximum allowable input of any measuring range.
● Never open the Battery compartment cover during a measurement.
- Battery ● Do not try to replace batteries during a measurement.
● Brand and type of the batteries to be used should be harmonized.
- Power cord ● Connect the Power cord to an outlet.
● Use only the Power cord supplied with this instrument.
- Power supply connector ● Never touch the Power supply connector although it is insulated while the instrument is operating with
batteries.
- Voltage test leads ● Use only the ones supplied with this instrument.
● Choose and use the test leads and caps that are suitable for the measurement category.
● When the instrument and the test lead are combined and used together, whichever lower category
either of them belongs to will be applied. Confirm that the measured voltage rating of the test lead is
not exceeded.
● Do not connect a Voltage test lead unless required for measuring the desired parameters.
● Connect Voltage test leads to the instrument first, and only then connect them to the circuit under test.
● Keep your fingers behind the barrier during a measurement.
Barrier: provides protection against electrical shock and ensuring the minimum required air and
creepage distances.
● Never disconnect the voltage test leads from the connectors of the instrument during a measurement
(while the instrument is energized).
● Do not touch two lines under test with the metal tips of the test leads.
● Never touch the metal tips of the test leads.
- Clamp sensor ● Use only the ones dedicated for this instrument.
● Confirm that the measured current rating of the test lead and the maximum rated voltage are not
exceeded.
● Do not connect a Clamp sensor unless required for measuring the desired parameters.
● Connect sensors to the instrument first, and only then connect them to the circuit under test.
● Keep your fingers behind the barrier during a measurement.
Barrier: provides protection against electrical shock and ensuring the minimum required air and
creepage distances.
-9-
KEW6315
KEW6315
Safety warnings
● Never disconnect sensors from the connectors of the instrument while the instrument is in use.
● Connect to the downstream side of a circuit breaker since a current capacity at the upstream side
is large.
● Do not touch two lines under test with the metal tips of the test leads.
Caution
● Caution should be taken since conductors under test may be hot.
● Never apply currents or voltages exceeding the maximum allowable input for the instrument for a
long time.
● Do not apply currents or voltages for the Clamp sensors or Voltage test leads while the instrument
is off.
● Don’t use the instrument at dusty places or to be spattered.
● Don’t use the instrument under a strong electric storm or in the vicinity of energized object.
● Never give strong vibrations or drop shocks.
● Insert an SD card to the slot with the top side turned up. If the card is inserted up-side-down, the SD
card or the instrument may be damaged. Confirm the
● While using an SD card, do not replace or remove the card. (The
symbol blinks while accessing
SD card.) Otherwise, the saved data in the card may be lost or the instrument may be damaged.
- Clamp sensor ● Do not bend or pull the cable of the Clamp sensor.
- Treatment after use ● Power off the instrument and disconnect the Power cord, Voltage test leads and Clamp sensors from
the instrument.
● Remove the batteries if the instrument is to be stored and will not be in use for a long period.
● Remove the SD card when carrying the instrument.
● Never give strong vibrations or drop shocks when carrying the instrument.
● Do not expose the instrument to direct sunlight, high temperatures, humidity or dew.
● Use a damp cloth with neutral detergent or water for cleaning the instrument. Do not use abrasives
or solvents.
● Do not store the instrument if it is wet.
Carefully read and follow the instructions:
described in each section.
DANGER,
WARNING,
CAUTION and NOTE (
Meaning of symbols on the instrument:
User must refer to the explanations in the instruction manual.
Instrument with double or reinforced insulation
~
AC
(Functional) Earth terminal
KEW6315
- 10 -
)
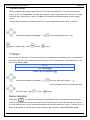
1.1 Functional overview
KEW6315
Chap. 1 Instrument overview
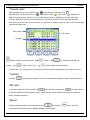
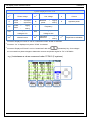
1.1
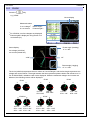
Functional overview
Start/ Stop
Choose either “Quick start guide” or “Start now”” to start
recording. Can do simple and fast start-up
up setting by
selecting “Quick start guide”.
See “4.6 Recording procedures” (P.37) for further details.
Inst/ Integration/ Demand
Display the avg// max/ min instantaneous values of current/
voltage/ active power/ apparent power/ reactive power.
Integration values also can be viewed by switching screens.
Moreover, demand values with the preset target value can
also be checked.
See “6.1 Inst “W” (P.92), 6.2 Integration “Wh” (P.100),
(P.
6.3 Demand (P.102) ” for further details.
Vector and Wiring check
Vectors of voltage and current per CH are displayed
on a graph. Executing wiring check function is
possible from this screen.
See “6.4
“
Vector” (P.105) for further details.
- 11 -
KEW6315
KEW6315
1.1 Functional overview
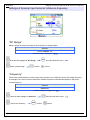
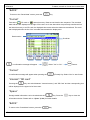
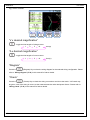
Waveform
Waveforms of voltage and current per CH are displayed on a
graph.
See “6.5 Waveform”
Waveform (P.107) for further details.
Harmonic Analysis
Harmonic components of voltage and current per CH are
displayed on a graph.
See “6.6.
“
Harmonics” (P.108) for further details.
Setting (SET UP)
Adjust settings of KEW6315 and measurements.
See “5. Settings” (P.47) for further details.
KEW6315
Power Quality (QUALITY) event
Display voltage swell, dip, int, transient, inrush current
and flicker.
See “6.7. Power Quality” (P.114) for further details.
- 12 -
1.2 Features
1.2
KEW6315
Features
This is a Clamp-type Power Quality Analyzer that can be used for various wiring systems. It can be used
for simple measurements of instantaneous/ integration/ demand values, and also for analysis of harmonics
and events related to power quality and for the simulation of power factor correction with capacitor banks.
Moreover, it can display waveforms and vectors of voltage and current. Data can be saved either on the
SD card or in the internal memory, and can be transferred to PC via USB, or in real time via Bluetooth
®
communication.
Safety construction
Designed to meet the international safety standard IEC 61010-1 CAT.IV 300V/ CAT.III 600V/ CAT.II 1000V.
Power quality analysis
KEW6315 is designed to meet the international standard IEC61000-4-30 Class S and can measure
frequency and r.m.s. voltage with high accuracy, and also can analyze harmonics. Moreover, it can measure
swell, dip, interruption, transient, inrush current and flicker, gapless, all at once.
Power measurement
KEW6315 measures active/reactive/apparent power, electrical energy, power factor, r.m.s. current, phase
angle and neutral current simultaneously.
Wiring configuration
KEW6315 supports: Single-phase 2-wire (4-system), Single-phase 3-wire (2-system), Three-phase 3-wire
(2-system) and Three-phase 4-wire.
Demand measurement
Electricity consumption can be easily monitored so as not to exceed the target maximum demand values.
Waveform/ vector display
Voltage and current can be displayed by waveform or vector.
Saving data
KEW6315 is endowed with a logging function with the preset recording interval. Data can be saved by manual
operation or by specifying date & time. Screen data can be saved by using the Print Screen function.
Dual power supply system
KEW6315 operates either with AC power supply or with batteries. Size AA alkaline dry-cell batteries and
size AA Ni-MH rechargeable batteries can both be used. To charge size AA Ni-MH rechargeable batteries,
use the charger which is manufactured by the same company as the batteries. In the event of power
interruption, while operating with AC power supply, power to the instrument is automatically restored by the
batteries in the instrument.
Large display
TFT color display with large screen.
Light & compact design
Clamp sensor type, compact and light weight design.
Application
Data in the SD card or the internal memory can be saved in PC via USB. Analysis of the downloaded
data and instrument settings are possible by using the special software “KEW Windows for KEW6315”.
®
Real-time communication with android devices is available via Bluetooth .
Input/ Output function
Analog signals from thermometers or light sensors can be measured simultaneously with electrical power
data via 2 analog inputs (DC voltage); when any events related to power quality occur, signals can be
transmitted to alarm devices via one digital output.
- 13 -
KEW6315
KEW6315
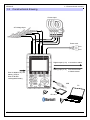
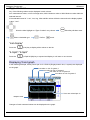
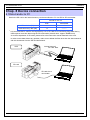
1.3
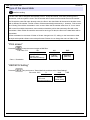
1.3 Constructional overview
Constructional drawing
Current input
AC Voltage input
Power cord
Digital output (1 ch) to recorder or alarm
Analog input (2 ch)
Size AA alkaline dry-cell
battery (LR6) or
Size AA Ni-MH
rechargeable battery
from thermometer
or illuminometer
USB
PC
SD card
KEW6315
- 14 -
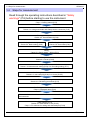
1.4 Steps for measurement
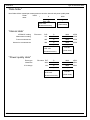
1.4
KEW6315
Steps for measurement
Read through the operating instructions described in “Safety
warnings” (P.8) before starting to use the instrument.
Preparation
Chap. 4: Getting started (P.27)
Cord and Sensor Connection
Clause 4.4: Voltage test leads and Clamp sensor connection (P.35)
Turning on the instrument.
Clause 4.5: Start KEW6315 (P.36)
Making basic settings.
Clause 5.2: Basic setting (P.48)
Reading the setup data
Clause 5.6: Saved data (P.82)
Wiring
Clause 5.2: Basic setting – Wiring (P.51)
Wiring check
Clause 6.4: Vector (P.105)
Advanced setting and data save method
Clause 5.3: Measurement setting (P.59)/ 5.4: Recording setting (P.71)
Confirming the measured values.
Clause 6.1: Inst value [W] (P.92)/ 6.4: Vector (P.105)
Start/ stop recording
Clause 4.6: Recording procedures (P.37)
Confirming the measured data.
Chap. 6: Displayed items (P.92)
Disconnect the cords and sensors from the measurement line, and turn off
the instrument.
Data analysis on PC
Clause 8.1: Data transfer to PC (P.125)
Chap. 9: PC software for setting and data analysis (P.129)
- 15 -
KEW6315
KEW6315
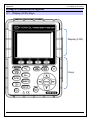
2.1 Display (LCD)/ Keys
Chap.2 Instrument layout
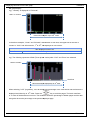
2.1
Display (LCD)/ Keys
Display (LCD)
Keys
KEW6315
- 16 -
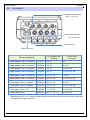
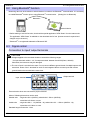
2.2 Connector
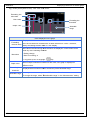
2.2
KEW6315
Connector
AC Voltage Input Terminal
(VN, V1, V2, V3)
Current Input Terminal
(A1, A2, A3, A4)
Terminal Cover
Power Connector
Current Input
Terminal*
AC Voltage Input
Terminal
Wiring configuration
Single-phase 2-wire (1-system)
1P2W×1
VN, V1
A1
Single-phase 2-wire (2-system)
1P2W×2
VN, V1
A1, A2
Single-phase 2-wire (3-system)
1P2W×3
VN, V1
A1, A2, A3
Single-phase 2-wire (4-system)
1P2W×4
VN, V1
A1, A2, A3, A4
Single-phase 3-wire (1-system)
1P3W×1
VN, V1, V2
A1, A2
Single-phase 3-wire (2-system)
1P3W×2
VN, V1, V2
A1, A2, A3, A4
Three-phase 3-wire (1-system)
3P3W×1
VN, V1, V2
A1, A2
Three-phase 3-wire (2-system)
3P3W×2
VN, V1, V2
A1, A2, A3, A4
3P3W3A
V1, V2, V3
A1, A2, A3
3P4W×1
VN, V1, V2, V3
A1, A2, A3
Three-phase 3-wire
Three-phase 4-wire
3A
* Measurements of r.m.s. values and harmonics are possible at the Current terminals, which are
not used for wiring connection.
- 17 -
KEW6315
KEW6315
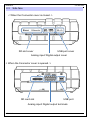
2.3
2.3 Side face
Side face
< When the Connector cover is closed. >
USB port cover
SD slot cover
Analog input/ Digital output cover
< When the Connector cover is opened. >
SD card slot
USB port
Analog input/ Digital output terminals
KEW6315
- 18 -
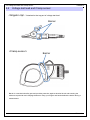
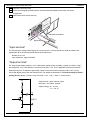
2.4 Voltage test lead and Clamp sensor
2.4
KEW6315
Voltage test lead and Clamp sensor
<Alligator clip> * Attached to the top part of voltage test lead
Barrier
<Clamp sensor>
Barrier
Barrier is a mechanical safety part and provides protection against electrical shock and ensuring the
minimum required air and creepage distances. Keep your fingers and hands behind the barrier during a
measurement.
- 19 -
KEW6315
KEW6315
3.1 Key operation
3
Basic operations
3.1
Key operation
PRINT SCREEN Key
Function Key
Save the displayed screen as BMP file.
Execute the displayed function.
DATA HOLD Key/ KEY LOCK Key
Hold the readings on the display.
* Measurement continues while the
readings are being held on the display.
Long press (at least 2 sec) disables
all Keys to prevent operational
errors. Another long press (at least
2 sec) is required to restore the
disabled Keys.
KEY
LOCK
LCD Key
Turn on/ off the backlight.
Long press (at least 2 sec) changes
the brightness and contrast.
Cursor Key
Select items or switch displays.
ENTER Key
Confirm the entries.
START/ STOP Key
Start/ stop
measurement.
Power Key
ESC Key/ RESET Key
Power on/ off.
Cancel setting changes and return to
the previous settings.
Status LED
Green
Red
SETUP Key
Light up: Recording& measuring
Blink: Stand-by
Change and confirm: Basic, Measurement, Record-
Blink: Backlight is off.
ing and other settings, and also edit the saved data.
Menu Key
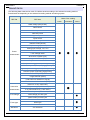
W/Wh
Vector
Waveform
View inst, integration
Harmonic
View harmonic voltage, current
and demand values.
Analysis
and power energy.
View phases.
Power
View voltage/ current
Quality
waveforms.
KEW6315
- 20 -
View the detailed info about:
swell, dip, int, transient, inrush
current and flicker.
3.2 Icons on the LCD
3.2
KEW6315
Icons on the LCD
Icon
Status
KEW6315 is operating with battery. This icon varies in 4 steps according to the
battery power condition.
KEW6315 is operating with AC power.
Holding the display update.
Keys are locked.
Buzzer is off.
SD card is set and available.
Recording the data on the SD card.
Available free space in the SD card is not enough.
Failed to access to the SD card.
Internal memory is available.
* This icon is displayed when a measurement starts without SD card.
Recording the data in the internal memory.
Available free space in the internal memory is not enough.
Stand-by mode
Recording the measured data.
Capacity of recording media is full.
USB is available.
®
Bluetooth is available.
- 21 -
KEW6315
KEW6315
3.3
3.3 Symbols on the LCD
Symbols on the LCD
V*1
Phase voltage
P
PF
Active
power
+ consumption
-
regenerating
Power
factor
+
lagging
-
leading
voltage at 1ch
An*2
Neutral current
Active power energy
WP+
(consumption)
Active power energy
WP-
(regenerating)
Line voltage
Reactive
power
Q
Analog input
DC1
VL*1
f
+
lagging
-
leading
A
Current
S
Apparent
power
Frequency
DC2
3
PA*
WS+
WS-
Analog input
voltage at 2ch
Phase
+
lagging
angle
-
leading
3
C*
Apparent power energy
(consumption)
Apparent power energy
(regenerating)
WQi+
WQc+
Reactive power energy
(lagging)
Reactive power energy
(leading)
Voltage/ Current
THD
total distortion factor
Pst
Voltage flicker (1 min)
(1min)
Pst
Short term voltage flicker
Plt
*1
W screen: Displays of V and VL can be “customized” when “3P4W” is selected.
*2
W screen: “An” is displayed only when “3P4W” is selected.
*3
W screen: Displays of PA and C can be “customized”.
3.4
Capacitance calculation
Long term voltage flicker
Backlight and Contrast Adjustment
Hold down the “
” LCD Key at least 2 sec to show the sliding bar to adjust the backlight brightness and
display contrast. Use the Cursor Key to slide the cursor on the bar for the adjustment. Press the ENTER
Key and exit from the adjustment mode. Press the ESC or LCD Key again to cancel the adjustment and exit
from the adjustment mode.
Brightness adjustment
Backlight brightness can be changed by 11 levels.
Contrast adjustment
Contrast can be changed by 11 levels.
KEW6315
- 22 -
Inst/ Integration/ Demand
KEW6315
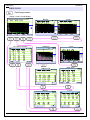
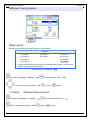
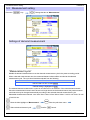
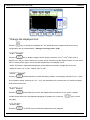
3.5 Screens
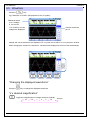
Inst/ Integration/ Demand
Switching screens
Press the
key to toggle the screens.
W (Inst value)
Wh (Integration value)
Demand
Customize
Select and change the items to be displayed.
Trend
Changes of measured values are
displayed on a graph.
Zoom
Zoom and display the selected items.
4-split
8--split
- 23 -
KEW6315
KEW6315
Vector
Vector
Switching screens
Wiring check
Checked results will be displayed.
Wiring diagram
Diagram of the selected wiring is
displayed.
Waveform
Switching screens
KEW6315
- 24 -
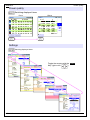
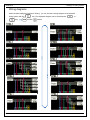
Harmonics
KEW6315
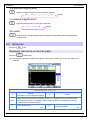
Harmonics
Switching screens
Voltage, Linear, Overall display
Current
List, Rate of content
Logarithm
Phase angle
Current
- 25 -
Power
Zoom
RMS value
Power
KEW6315
KEW6315
Power quality
Power quality
Switching displayed items
Flicker
Event
Settings
Switching displayed items
Toggle the screens with the Cursor
Key. (right or left
)
KEW6315
- 26 -
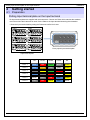
Putting Input terminal plate on the Input terminal
4
KEW6315
Getting started
4.1 Preparation
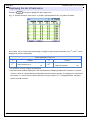
Putting Input terminal plate on the Input terminal
Six Input terminal plates are supplied with this instrument. Choose one Plate which matches the standard
cord colors where the instrument is used. Put the Plate to the Input terminal observing the orientation.
* Clean the Input terminal before putting the Plate and confirm it isn’t wet.
TYPE1
TYPE4
TYPE2
TYPE5
TYPE3
TYPE6
Put a proper Input terminal plate.
Input terminal plate
VN
V1/A1
V2/A2
V3/A3
A4
TYPE 1
blue
red
green
black
yellow
TYPE 2
blue
brown
black
gray
yellow
TYPE 3
black
yellow
green
red
white
TYPE 4
blue
black
red
white
yellow
TYPE 5
white
black
red
blue
yellow
TYPE 6
black
red
yellow
blue
white
- 27 -
KEW6315
KEW6315
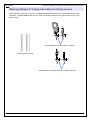
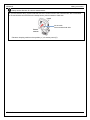
Attaching Markers to Voltage test leads and Clamp sensors
Attaching Markers to Voltage test leads and Clamp sensors
Attach Markers to the both ends of the Voltage test leads and Clamp sensors harmonized with the Input
terminals. * Supplied Markers are 32 pcs in total : 4pcs each color (red, blue, yellow, green, brown, gray,
black, white).
Attach Markers to the both ends of a Sensor.
Marker (32 pcs in total)
Attach Markers to the both ends of a Voltage test lead.
KEW6315
- 28 -
Battery
KEW6315
4.2 Power Supply
Battery
KEW6315 operates with either an AC power supply or batteries. Capable of performing measurements in
the event of AC power interruption, power to the instrument is automatically restored by the batteries
installed in the instrument. Size AA alkaline dry-cell batteries (LR6) or size AA Ni-MH batteries can both
be used. To charge the rechargeable battery, use the charger which is manufactured by the same company
as the batteries. KEW6315 cannot charge batteries.
* Size AA alkaline dry-cell batteries (LR6) are supplied as accessories.
DANGER
● Never open the Battery compartment cover during a measurement.
● Brand and type of the batteries to be used should be harmonized.
● Never touch the Power supply connector, although it is insulated, while the instrument is operating with
batteries.
WARNING
● Ensure that the Power cord, Voltage test leads and Clamp sensor are removed from the instrument,
and that the instrument is switched off when opening the Battery compartment cover for battery
replacement.
CAUTION
● Never mix new and old batteries.
● Install batteries in correct polarity as marked inside the Battery compartment area.
Batteries are not installed in the instrument at the time of purchase. Please insert the supplied batteries
before starting to use the instrument. Battery power is consumed even if the instrument is being off. Remove
all the batteries if the instrument is to be stored and will not be in use for a long period. When the instrument is
powered by an AC power supply, it doesn’t operate with batteries.
If an AC supply is interrupted and the batteries have not been inserted, the instrument goes off and all
data may lost.
- 29 -
KEW6315
KEW6315
Battery Mark on the LCD/ Battery level
Battery Mark on the LCD/ Battery level
Power supply icon changes as follows, and the battery icon varies according to the battery condition.
Powered by AC
Possible continuous measurement hours:
- approx 3 hours with size AA alkaline batteries, and
Powered by
battery
- approx 4.5 hours with size AA Ni-MH (1900mA/h)
batteries.
Battery level
Power supply icon
4-level
* These are ref. values with LCD turned off.
Instrument works normally.
* Voltage of full-charged Ni-MH battery is lower than that of
the full-charged alkaline battery, so the level indicator may
not be the same as the one shown to the left even after the
batteries are fully charged.
Measurement continues, but data save is ceased.
(Further data will not be saved, but the data measured before
the battery level drops to the lowest level are saved.)
KEW6315
- 30 -
How to install batteries
KEW6315
How to install batteries:
Follow the steps below and install batteries.
Battery compartment
Screw
cover
LR6: Size AA Alkaline battery
1
Disconnect the power cord, voltage test leads and clamp sensors from the instrument, and
power off the instrument.
2
Loosen two Battery compartment cover-fixing screws and remove the Cover.
3
Take out all the batteries.
4
Insert six batteries (Size AA alkaline battery: LR6) in correct polarity.
5
Install the Battery compartment cover and fix it with two screws.
Power cord connection
The following should be checked before the connection.
DANGER
● Use only the Power cord supplied with this instrument.
● Connect the Power cord to a mains outlet. The mains supply voltage must not exceed AC240V.
(max rated voltage of supplied Power cord MODEL7169 : AC125V)
WARNING
● Confirm that the instrument is powered off, and then connect the Power cord.
● Connect the Power cord to the instrument first. The cord should be firmly connected.
● Never attempt to make measurement if any abnormal conditions are noted, such as a broken cover and
exposed metal parts.
● When the instrument is not in use, disconnect the Power cord from the outlet.
● When unplugging the cord from the mains socket outlet, do so by removing the plug first and not by
pulling the cord.
- 31 -
KEW6315
KEW6315
Power supply rating
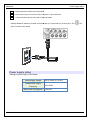
Follow the procedure below, and connect the Power cord.
1
Confirm that the instrument is powered off.
2
Connect the Power cord to the Power connector on the instrument.
3
* Connect another end of the Power cord to the outlet.
* Getting KEW6315 started is possible 2 seconds after it is connected to a power source. The
does not work in this period.
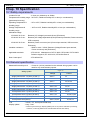
Power supply rating
Rating of power supply is as follows.
Rated supply voltage
100 to 240V AC (±10%)
Rated power supply
45 to 65Hz
frequency
Max power consumption
KEW6315
7VA max
- 32 -
Key
4.3 Placing / removing SD card
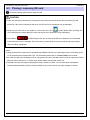
4.3
KEW6315
Placing / removing SD card
Check the following points before using SD card.
CAUTION
● Follow the instructions described in “Inserting SD card” and insert the SD card to the slot with the top side
turned up. If the card is inserted up-side-down, the SD card or the instrument may be damaged.
● While using an SD card, do not replace or remove the card. (The
symbol blinks while accessing SD
card.) Otherwise, the saved data in the card may be lost or the instrument may be damaged.
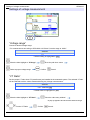
● The indicator “
“ blinks during record. Do not remove the SD card. Otherwise, the saved data
or the instrument may be damaged. Do not remove the card until the record ends and the pop-up message
“Stop recording.” disappears.
Notes:
● Newly purchased SD cards must be formatted with KEW6315 before use. Data might not be successfully saved
on SD cards that are formatted with a PC. For the details, please refer to “Format” (P.86) in this manual.
● If the SD card has been frequently used for a long period, the life of the flash memory may be expired and further
data may not be saved on it. In such a case, please replace the card with a new one.
● The data in the SD card might be damaged or lost by accident or failure. It is recommended to backup the
recorded data periodically. Kyoritsu will not be liable for any loss of data or any other damages or losses.
- 33 -
KEW6315
KEW6315
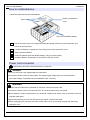
Inserting SD card
Inserting SD card:
1
Open the Connector cover.
2
Insert the SD card into the SD card slot with the topside turned up.
3
Then close the cover. Please use the instrument with the Connector cover closed unless it is not
necessary.
Removing SD card:
1
Open the Connector cover.
2
Gently push the SD card towards inside, and then the card comes out.
3
Remove the card slowly.
4
Then close the cover. Please use the instrument with the Connector cover closed unless it is not
necessary.
SD card
Connector cover
KEW6315
- 34 -
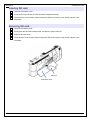
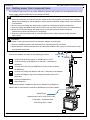
4.4 Voltage test leads and Clamp sensor connection
4.4
KEW6315
Voltage test leads and Clamp sensor connection
Check the following before connecting the test leads and sensors.
DANGER
● Use only the Voltage test leads supplied with this instrument.
● Use the dedicated Clamp sensors for this instrument, and confirm that the measurement current rating of
the Clamp sensor is not exceeded.
● Do not connect all the Voltage test leads or Clamp sensors unless required for measuring the desired
parameters.
● Connect the test leads and sensors to the instrument first, and only then connect them to the circuit
under test.
● Never disconnect the Voltage test leads and sensors while the instrument is in use.
WARNING
● Confirm that the instrument is powered off, and then connect the Power cord.
● Connect the Power cord to the instrument first. The cord should be firmly connected.
● Never attempt to make measurement if any abnormal conditions are noted, such as a broken Cover and
exposed metal parts.
Follow the procedure below, and connect the Voltage test leads and Clamp sensors.
1
Confirm that the instrument is powered off.
2
Connect the appropriate Voltage test lead to the AC Voltage input terminal on the instrument.
3
Connect the appropriate Clamp sensor to the Current input terminal on the instrument.
Match the direction of the arrow mark indicated on the output terminal of the clamp sensor and
the mark on the Current input terminal on the instrument.
Match the
arrow marks.
Number of Voltage test leads and Clamp sensors to be used will be different depending on the wiring
configuration under test. For further details, refer to “Wiring diagrams” (P.50) in this manual.
- 35 -
KEW6315
KEW6315
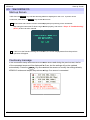
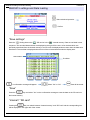
Start-up Screen
4.5 Start KEW6315
Start-up Screen
Hold down the POWER key until the following screen is displayed on the LCD. To power off the
instrument, hold down the POWER key at least 2 seconds.
1
Model name and software version will be displayed upon powering on the instrument.
Stop using the instrument if it does not get started properly, and refer to “Chap. 11 Troubleshooting”
(P.157) in this instruction manual.
2
If this is not the first time starting the instrument, the screen displayed last from the previous
operation will appear.
Cautionary message
If the connected Clamp sensors are not the same ones used during the previous test, the list
of the connected sensors
rs will be displayed for 5 sec; but the settings will not be updated
automatically. Press the
key and re-detect
re
the sensors or modify the settings directly.
KEW6315 retains and adopts the previous settings if no sensor is connected.
KEW6315
- 36 -
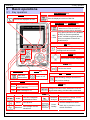
Start of recording
4.6
KEW6315
Recording procedures
Start of recording
Press the
Key.
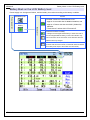
Choose either “Quick start guide” or “Start now” to start recording. One can do the simple and fast start-up by
selecting “Quick start guide”. Only the settings of wiring and recording are included in the “Quick start guide”.
Press the
key and adjust advanced settings if necessary. When the necessary settings are
already done, or no change of settings is required, select “Start now” to start recording. Before starting
measurement, ensure all safety and necessary preparations have been checked.
Move the blue highlight to “Quick start guide” or “Start now”.
- 37 -
Confirm.
Cancel.
KEW6315
KEW6315
End of recording
End of recording
Press the
Key.
Data no.
Recording method
Items to be recorded
Check the information about recording, or stop the recording.
Items displayed on the LCD
Data no.
Elapsed time
Data no. of the recorded data. It is also used as a folder name at data saving.
The time that elapses while recording.
Manual
Recording method
Constant rec.
Time period rec.
Save to
Items recorded
Show the ”Recording start date and time”.
Show the ”Recording start/ end date and time”.
Show the ”Recording start date and time”, “Recording Period”
and “Recording Time”.
Data location to save the data.
Items being recorded.
Move the blue highlight to “Cancel” or “Stop”.
KEW6315
- 38 -
Confirm.
Cancel.
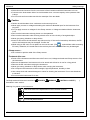
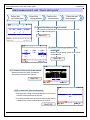
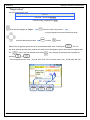
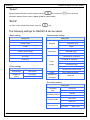
Start measurement with “Quick start guide”
KEW6315
Start measurement with “Quick start guide”
Select the
recording item
Select the
wiring system
Confirm the
connections
Check the test
environment
(1) Select the item you want to record.
* The number of selected items will have effect on file size and
also on max recording time.
See P.37.
P.
(2) Select the wiring system to be
measured.
* Select a proper wiring system for accurate
measurements.
See P.41.
(3) Connect to the circuit to be tested.
* Read and follow the safety precautions
described in the instruction manual.
See P.27.
(4)(5) Check the Test environment.
* Self-diagnosis,
diagnosis, wiring check and detection of connected
sensors will be performed in this test.
* It is recommended to do this test for ensuring the testing
conditions are correct. It takes about 10 seconds.
See P.42.
- 39 -
KEW6315
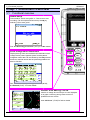
KEW6315
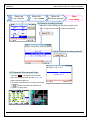
Start measurement with “Quick start guide”
Select the
rec. interval
Select the
ethod
rec. method
Check the
selected method
Start
recording
(6) Select a recording interval.
* Selecting a short interval gets the file size large. In this
case, a long period recording cannot be performed.
See P.76.
P.
(7)(8)(9) Select a recording method.
See P.45.
(10) Prepared. Recording will start.
The mark “ REC ” will appear on the screen
when the recording starts, and the green LED
(status indicator) lights up.
If you want to terminate the recording, press the
“
” button and follow the instructions
displayed on the screen.
KEW6315
- 40 -
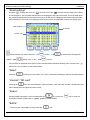
Start measurement with “Quick start guide”
KEW6315
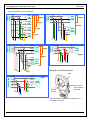
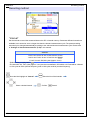
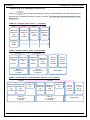
(2) Wiring system
Any of the following can be selected.
L
L
N
V1VN
1P2W×1
Power
supply
Power
supply
Load
N (1)
1P2W
L
Load
N (2)
1P2W
L
Load
N (3)
1P2W
L
Load
N (4)
1P2W
L1
N
Load
(1)
L2 1P3W
L2
N Load
(2)
L2 1P3W
1P2W×3
1P2W×4
V1V2
VN
3P3W×1
Power
supply
Power
supply
Load
L2(S) (1)
L3(T) 3P3W
L3(T)
1P3W×1
1P3W×2
L1
L1(R)
L2(S)
N
1P2W×2
A1A2
A3A4
L1(R)
L1
A1A2
A3A4
L1(R)
L1(R)
L2(S)
L2(S)
L3(T)
L3(T)
Load
3P3W
3P3W3A
3P3W×2
L1(R)
Load
(2)
3P3W
L3(T)
L2(S)
V1V2
VN
V1V2 A1A2
V3
A3
A1A2
A3A4
Orientation of Clamp sensor
Load
Power supply
L1(R)
L1(R)
L2(S)
L2(S)
3P4W
Load
L3(T) 3P4W
L3(T)
N
N
V1
V2V3
VN
Power
source
A1A2
A3
Arrow mark:
Point towards
load side.
Reverse clamping switches the symbols (+/-)
for active power (P).
- 41 -
KEW6315
KEW6315
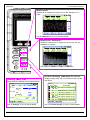
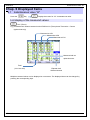
Start measurement with “Quick start guide”
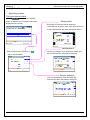
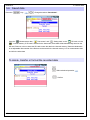
(4)(5) Test Environment Check
Switching screens
Test environment check
Select “ Start test ”and press the “ENTER”
Wiring check
button to start the test. The test result will be
displayed on the screen.
Test results of each item will be displayed.
* NG result may be given, even if the wiring is correct,
at the measurement site under bad power factors.
Self-diagnosis
Select and press the “ENTER” on “OK”/
Operating condition of the instrument system will
”NG” to see the details.
be checked and the result will be displayed.
Sensor detection
The connected sensors are automatically
detected and their max Ranges will be set.
KEW6315
- 42 -
Start measurement with “Quick start guide”
KEW6315
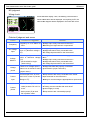
NG judgment
Wiring check
Close the result display. Then, the blinking vectors and the
values of NG items will be displayed. If everything is OK, the
ideal vector diagram will be displayed in the lower left corner.
Criteria of judgment and cause
Check
Criteria of Judgment
Frequency
Frequency of V1 is within 40
- 70Hz.
- Voltage clip is firmly connected to the DUT?
- Measuring too high harmonic components?
AC Voltage
input
AC voltage input is 10% or
more of (Nominal voltage x
VT).
- Voltage clip is firmly connected to the DUT?
- Voltage test lead is firmly connected to the
AC voltage
v
input terminal on the instrument?
Voltage
balance
AC voltage input is within
±20% of reference voltage
(V1).
* (not checked for singlephase wiring)
- Settings are matched with the wiring system under
test?
- Voltage clip is firmly connected to the DUT?
- Voltage test lead is firmly connected to the
AC voltage
v
input terminal on the instrument?
Phase of AC voltage input is
- Voltage test leads are properly connected?
Voltage
phase
within ±10º of reference value
input
Current
phase
(Connected to proper channels?)
(proper vector).
Current input is 5% or more
Current
Causes
and 110% or less of (Current
- Clamp sensors are firmly connected to the Power
input terminals on the instrument?
Range x CT).
- Setting for Current Range is appropriate for input levels?
- Power factor (PF, absolute
- Arrow mark on the Clamp sensor and the orientation
value) at each CH is 0.5 or
more.
- Active power (P) at each
of flowing current coincide with each other?
(Power supply to Load)
- Clamp sensors are connected properly?
CH is positive value.
- 43 -
KEW6315
KEW6315
Start measurement with “Quick start guide”
Self-diagnosis
If “NG” judgment is given frequently, there might be something wrong with the instrument. Stop using the
instrument and refer to “Chap.11 Troubleshooting
oting” (P.157).
Sensor detection
If the detection result is NG, each sensor type will be displayed in red.
Criteria of judgment and cause
Check
Type of
current sensor
???
(cause unknown)
Causes
- Types of the connected current sensors are harmonized? Types of the current
sensors used for measurements should be the same.
- Current sensors are firmly connected to the instrument?
- If any failures are in doubt:
Exchange the connections of the sensors and test again.
Connect the current sensor, for which "NG" is given, to the CH on which
another sensor is properly detected.
If the result "NG" is given for the same CH, a defect of the instrument is
suspected. A defect of sensor is suspected if "NG" is given for the same
sensor connected to another CH.
Stop using the instrument and the sensor, if any defects are in doubt, and
refer to "Chap. 11 Troubleshooting"
Troubleshooting (P.157) in this manual.
KEW6315
- 44 -
Start measurement with “Quick start guide”
KEW6315
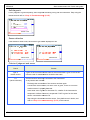
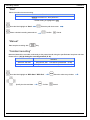
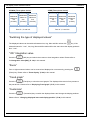
(8)(9) Setting for recording method
The following explains how to set recording start date and time.
(8)
Specify the recording start date and time.
During the selected period, KEW6315 records data at the preset intervals.
Example: When
hen the date & time are specified as above,
above the recording period will be as follows.
From 8:00 on August 2, 2013 to 18:00 on August 7, 2013,
(9)
Specify the recording time period.
KEW6315 records data during the selected time period at the preset intervals, and repeats the
recording process during the preset time span.
Example: When
hen the time period is specified as above,
above the recording period is as follows.
(i)
8:00 to 18:00 on August 1, 2013,
(ii) 8:00 to 18:00 on August 2, 2013,
(iii) 8:00 to 18:00 on August 3, 2013,
(iv) 8:00 to 18:00 on August 4, 2013,
(v) 8:00 to 18:00 on August 5, 2013,
(vi) 8:00 to 18:00 on August 6, 2013,
(vii) 8:00 to 18:00 on August 7, 2013,, and
(viii) 8:00 to 18:00 on August 8, 2013.
- 45 -
KEW6315
KEW6315
Start measurement with “Quick start guide”
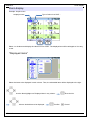
Switching of displayed parameters
Basically, the Cursor Key
is used for selecting an item, the ENTER Key
is for confirming the
selection, and the ESC Key
is for canceling the alternation. Taking the procedures in “Quick Start
Guide” as an example, Key operations are explained as follows.
Press the Cursor Key to move the blue highlight, showing the item
is being selected, over the items
i
in blue letters. In the screen to the
left is the Recording start screen. Press the Cursor Key and move
the blue highlight on the desirable recording method, and press the
ENTER Key to confirm the selection. To quit the start guide, press
the ESC Key.
If the display of the
t selectable items is similar to the one shown
to the left, then the up, down, right and left Cursor Keys can be
used. Use the Cursor Keys to select the proper wiring system and
press the ENTER Key to confirm the selection. To return to the
previous screen and cancel the changes, press the ESC Key.
To alter the numbers such as Date/ Time, move the blue highlight
over digits with the right and left Cursor Keys and alter the number
with the up and down Cursor Keys.
In the screen to the left, the tenth place of the day is being selected.
The number can be increased or decreased by 1 with the up/ down
Cursor Keys.
Key Press the ENTER Key to confirm the selection, or
press the ESC Key to return to the previous screen and cancel
the changes.
CAUTION:
If "AUTO" is set for "A Range", either "Power + Harmonics" or "Power only" is selectable at step (1): Select
desirable recording item.. To record the items related to power quality, set it to any other proper current ranges
other than "AUTO". Only the settings of wiring and recording are included in the “Quick start guide”.
The following should be selected and entered before starting a record. Press the
key to show the
setting screen.
* Nominal voltage// frequency, THD for power quality event and filter coefficient (ramp) for Flicker measurement.
When the setting of "A Range" is set to other than "AUTO", the settings of "+ Clamp" will be automatically
altered to "OFF".
KEW6315
- 46 -
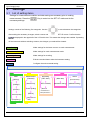
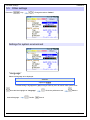
List of setting items
KEW6315
5
Settings
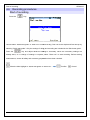
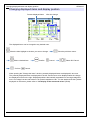
5.1
List of setting items
Settings for measurement condition and data saving are necessary prior to making
measurements. Press the
Key to enter into the SET UP mode and do the
necessary settings.
Settings consist of the following five categories. Use the
to move between the categories.
After making the necessary changes, switch screens and exit from the SET UP screen. Confirm that the
is displayed in the upper left of the LCD at this time. This means the changes are enabled. If powering
off the instrument without switching screens, the changes you made will be cleared.
Basic Setting
Make settings for the items common to each measurement.
Measurement Setting
Make settings for each measurement mode.
Recording Setting
Make settings for recoding.
Save Data
Edit the recorded data or alter the instrument setting.
Others
Configure the environmental setting.
Each setting
Recording
Saved data
Others
(Wiring)
(Demand)
(REC item)
(REC data)
(Environment)
(Voltage)
(Harmonics)
(REC method)
(KEW6315 setting)
(KEW6315 setting)
(Current)
(Power quality)
(Manual/
Constant rec./
Time period rec.)
Basic
Measurement
(External input DC)
(Frequency)
(Flicker)
(Capacitance
calc.)
- 47 -
KEW6315
KEW6315
5.2
Basic setting
Basic setting
Press the
KEW6315
Key.
Use the
Key to display the Basic setting screen.
- 48 -
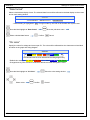
Settings of wiring system
KEW6315
Settings of wiring system
”Basic wiring”
Choose one according to the wiring system to be measured.
Selection
(1) 1P2W×1
(5) 1P3W×1
(7) 3P3W×1
(2) 1P2W×2
(6) 1P3W×2
(8) 3P3W×2
(3) 1P2W×3
(9) 3P3W3A
(4) 1P2W×4
(10) 3P4W
* Current terminals that are not used in the selected wiring system can be used to
measure rms currents and harmonics.
* Default setting is highlighted in gray.
Move the blue highlight to “Wiring”.
Select a proper wiring system.
Show the pull-down menu.
Confirm.
Cancel.
“+ Clamp” : Optional clamp sensors
Move the blue highlight to “+ Clamp”.
Select a proper clamp setting.
Show the pull-down menu.
Confirm.
- 49 -
Cancel.
KEW6315
KEW6315
Settings of wiring system
Wiring diagrams
When the blue highlight is located at “Wiring”, you can check the wiring diagram of the selected
wiring system with the
key.
KEW6315
key. The displayed diagram can be switched with
Confirm.
Cancel.
- 50 -
or
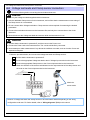
Wiring connection
KEW6315
Wiring connection
Read the following precautions prior to wiring connection.
DANGER
● With attention to the measurement category to which the object under test belongs, do not make
measurements on a circuit in which the electrical potential exceeds the following values.
* 300V AC for CAT. IV, 600V AC for CAT. III, 1000V AC for CAT. II
● Use the voltage test leads and clamp sensors dedicated for this instrument.
● Connect the clamp sensors, voltage test leads and power cord to the instrument first, and then connect
them to the measured object or the power source.
● When the instrument and the test lead are combined and used together, whichever lower category
either of them belongs to will be applied. Confirm that the measured voltage rating of the test lead is
not exceeded.
● Do not connect voltage test leads or clamp sensors unless required for measuring the desired
parameters.
● Clamp sensors should always be connected on the downstream side of a circuit breaker, which
is safer than the upstream side.
● Do not open-circuit the secondary side of a supplementary CT while it is energized because of the high
voltage generated at the secondary side terminals.
● Be careful to avoid short-circuiting the power line with the un-insulated part of the voltage test probes
during the setting up of the instrument. Do not touch the tip metal part.
● Transformer jaw tips are designed in such a way to avoid short-circuiting. If the circuit under test has
exposed conductive parts, extra care should be taken to minimize the possibility of shorting.
● Keep your fingers behind the barrier during a measurement.
Barrier: provides protection against electrical shock and ensuring the minimum required air and
creepage distances.
● Never disconnect the voltage test leads from the connectors of the instrument during a measurement
(while the instrument is energized).
● Do not touch two lines under test with the metal tips of the test leads.
WARNING
● To avoid possible electric shock and short-circuit, always turn off the line under test at wiring connection.
● Do not touch the un-insulated tip of voltage test leads.
- 51 -
KEW6315
KEW6315
Wiring connection
Clamp sensor direction for correct measurement:
● Confirm that the wiring system selected with the instrument and of the measured line are harmonized.
● Ensure that the arrow mark on the clamp sensor points towards to load side.
Load
Arrow mark:
Point towards load side.
Power
source
* Reverse clamping switches the symbols (+/-) for active power (P).
KEW6315
- 52 -
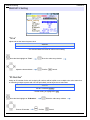
Settings of voltage measurement
KEW6315
Settings of voltage measurement
“Voltage range”
Choose a desired voltage range.
* For measurements according to IEC61000-4-30 Class S, set the range to “600V”.
Selection
600V/1000V
* Default setting is highlighted in gray.
Move the blue highlight to “V Range”.
Select a proper voltage range.
Show the pull-down menu.
Confirm.
Cancel.
”VT Ratio”
Set the proper VT ratio when VTs (transformer) are installed in the measured system. The selected VT ratio
will be reflected to all the values measured during any voltage measurements.
Selection
0.01 - 9999.99(1.00)
* Default value is highlighted in gray.
Move the blue highlight to “VT Ratio”.
Show the value entry window.*
* A pop-up appears and shows the effective range.
Set the VT Ratio.
Confirm.
- 53 -
Cancel.
KEW6315
KEW6315
VT/ CT
VT/CT*
* This setting belongs to Current measurement setting.
DANGER
● With attention to the measurement category to which the object under test belongs, do not make
measurements on a circuit in which the electrical potential exceeds the following values.
* 300V AC for CAT. IV, 600V AC for CAT. III, 1000V AC for CAT. II
● Connect the Power cord to an outlet. Never connect it to the outlet of AC240V or higher.
● This instrument must be used on the secondary side of VT (transformer) and CT (current transformer).
● Do not open-circuit the secondary side of the supplementary CT while it is energized because of
the high voltage generated at the secondary side terminals.
CAUTION
● When a VT or CT is used, the measurement accuracy is not guaranteed due to several factors namely
phase characteristics and VT/CT accuracies.
The use of supplementary VT/CT’s may be required if the voltage/current values of the circuit under
test fall outside the instrument measuring range. In this case the value at the primary side of circuit
can be obtained directly by measuring the secondary side with appropriate an VT or CT installed in
the line under test as follows.
< Example of single-phase 2-wire (1-system) “1P2W x 1” >
L
Power
source
Load
N
CT
VT
i
VN
V1
A1
When rating of the secondary side of CT is 5A, use of Clamp sensor 8128 (50A type) and testing
at 5A Range is recommended.
In this case, set the actual ratio of VT and CT to be used.
KEW6315
- 54 -
Settings of voltage measurement
KEW6315
”Nominal voltage”
Set the nominal voltage values applied from the measured object.
Selection
50V - 600V(100V)
* Default value is highlighted in gray.
Move the blue highlight to “Nominal V”.
Show the value entry window.*
* A pop-up appears and show the effective range.
Enter the nominal voltage value.
Confirm.
Cancel.
Default values
When the blue highlight is located at “Nominal V”, you can check a list of the popular values
with the
key.
Selection
100V/ 101V/ 110V/ 120V/ 200V/ 202V/ 208V/ 220V/ 230V/
240V/ 277V/ 346V/ 380V/ 400V/ 415V/ 480V/ 600V
Choose the appropriate voltage.
Confirm.
- 55 -
Cancel.
KEW6315
KEW6315
Settings of current measurement
Settings of current measurement
“Clamp” : Clamp sensors for current measurement
Select the model names of the connected sensors. If an optional sensor is used and set for “+Clamp”,
an exceptional sensor can be set for 4ch. The rated current and the max conductor size are displayed
in a pop-up while opening the list of sensor model names.
Selection
8128:5/ 50A/ AUTO
8127:10/ 100A/ AUTO
Clamp sensors for power measurement
8126:20/ 200A/ AUTO
8125:50/ 500A/ AUTO
8124/ 8130:100/ 1000A/ AUTO
8129:300/ 1000/ 3000A
8141:
8142:
500mA/ AUTO
Clamp sensors for leakage current measurement
8143:
8146:
8147:
1/ 10A/ AUTO
8148:
* Default setting is highlighted in gray.
Move the blue highlight to “Clamp”.
Show the pull-down menu.
Select the model name of the sensor.
KEW6315
- 56 -
Confirm.
Cancel.
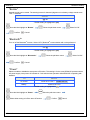
Settings of voltage measurement
KEW6315
”Current range”
Choose a desired current range. While “Record” is set at the “Recording Tab” to record the power quality
events, “AUTO”* is not selectable. To enable auto-ranging at current range, select “Do not record” for “Event”
in the REC Item. Please refer to “VT/ CT ” (P. 54) in this manual for the detailed settings of power quality
events.
* Measurements according to IEC61000-4-30 Class S cannot be performed while “AUTO” is selected.
Move the blue highlight to “A Range”.
Select a desired range.
Show the pull-down menu.
Confirm.
Cancel.
”CT Ratio”
Set the proper CT ratio when CTs (current transformer) are installed in the measured system. The selected CT
ratio will be reflected to all the values measured during any current measurements. The details about CT are
described in “VT/CT” (P.54).
Selection
0.01 - 9999.99(1.00)
* Default value is highlighted in gray.
Move the blue highlight to “CT Ratio”.
Show the value entry window.*
* A pop-up appears and show the effective range.
Set the CT Ratio.
Confirm.
Cancel.
Sensor detection
Pressing the
key detects and displays the model names of the connected sensors automatically.
However, if the connected sensors are not the ones that should be connected for the selected wiring system,
or sensor detection fails, an error message will appear and the values entered at “Clamp”, “A Range” and “CT
Ratio” will be cleared. The details about “Sensor detection” are described in “Sensor detection” (P.44).
- 57 -
KEW6315
KEW6315
Settings of External input terminal/ reference frequency
Settings of External input terminal/ reference frequency
”DC Range”
Select a proper DC range according to the incoming DC voltage signals.
Selection
100mV/ 1000mV/ 10V
* Default setting is highlighted in gray.
Move the blue highlight to “DC Range”.
Select a proper range.
Show the pull-down menu.
Confirm.
Cancel.
”Frequency”
Choose the nominal frequency of the system to be measured. If it is difficult to specify the voltage frequency,
for example, in the event of power interruption, KEW6315 performs measurements based on the preset
nominal frequency.
Selection
50Hz/ 60Hz
* Default setting is highlighted in gray.
Move the blue highlight to “Nominal f”.
Choose the frequency.
KEW6315
Show the pull-down menu.
Confirm.
- 58 -
Cancel.
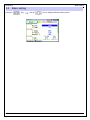
5.3 Measurement setting
5.3
KEW6315
Measurement setting
Press the
Key.
Change the tabs to “Measurement”.
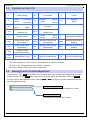
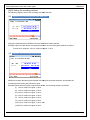
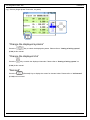
Settings of demand measurement
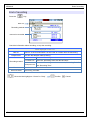
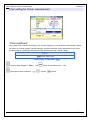
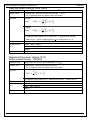
“Measurement cycle”
Disable the demand measurement or set the demand measurement cycle in the preset recording period.
When a demand measurement start, the measured demand values will be recorded at the selected
measurement cycle. The cycle time should be selected from the following.
Selection
Not be used./ 10 min/ 15 min/ 30 min
* Default setting is highlighted in gray.
The selected demand measurement cycle has an influence on the selection of the measurement intervals.
Since the measurement interval cannot be set to a longer time than the demand interval, the preset measurement interval may be changed automatically according to the selected demand measurement cycle.
Selectable measurement intervals: 1sec/ 2sec/ 5sec/ 10sec/ 15sec/ 20sec/ 30sec/ 1 min/ 2 min/ 5 min/ 10 min/
15 min/ 30 min.
Move the blue highlight to “Measurement”.
Select a desired demand cycle.
Show the pull-down menu.
Confirm.
- 59 -
Cancel.
KEW6315
KEW6315
Settings of demand measurement
”Target value”
Set the demand target value.
Selection
0.001mW - 999.9TW(100.0kW)
* Default setting is highlighted in gray.
Move the blue highlight to “Target”.
Show the value entry window.*
* A pop-up appears and show the effective range.
Enter the desired target value.
Confirm.
Cancel.
Either active or apparent power can be set as a demand target value. Pressing the
“VA”/ “W”
key while opening the value entry window can switch active and apparent power. Move the blue highlight with
the
pressing
keys to the unit and alter the unit with
or
keys. Moving the decimal point is possible by
.
* Unit for apparent power: mVA, _VA, kVA, MVA, GVA, TVA / for active power: mW, _W, kW, MW, GW, TW
KEW6315
- 60 -
Settings of demand measurement
KEW6315
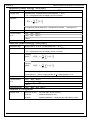
”Inspection cycle”
The buzzer sounds when the predicted value exceeds the target value within the selected inspection cycle.
The inspection cycle should be shorter than the demand measurement cycle. The relations between the
measurement and inspection cycles are as follows.
Measurement cycle
Inspection cycle
10 min/ 15 min
1 min/ 2 min/ 5 min
30 min
1 min/ 2 min/ 5 min/ 10 min/ 15 min
* Default value is highlighted in gray.
Move the blue highlight to “Inspection”.
Show the value entry window.*
* A pop-up appears and show the effective range.
Select a desirable time.
Confirm.
Cancel.
- 61 -
KEW6315
KEW6315
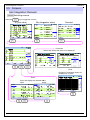
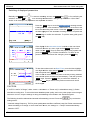
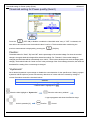
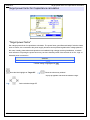
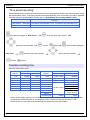
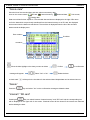
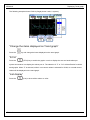
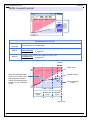
Outline of demand measurement concept
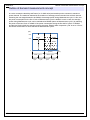
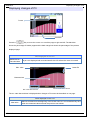
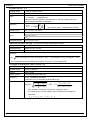
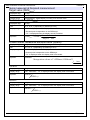
Outline of demand measurement concept
In such a contract the electricity tariff rates (i.e. for kWhr units) are based upon the consumer’s maximum
power demand. The maximum demand is the maximum of average powers recorded over a 30min interval.
Assuming the max target demand to be 500kW, the average power during Measurement cycle 1 is fine, but
the power consumption for the first 15 min of Measurement cycle 2 is 600kW. In such a case, the average
power during Measurement cycle can be maintained at 500kW (same as Measurement cycle 1) by reducing
the power of the last 15 min to 400kW. If the power consumption during the first half of cycle 2 is 1000kW
and the last 15min is 0kW, the average power is the same: 500kW. While “Inspection cycle” is set to “15 min”,
the buzzer sounds after 15 min at the start of Measurement cycle 2.
(kW)
600kW
600
500
500kW
500kW
400kW
0
15
30
Meas. cycle 1
15
(Buzzer)
Meas. cycle 2
Inspection Inspection Inspection Inspection
cycle
cycle
cycle
cycle
KEW6315
- 62 -
30
(min)
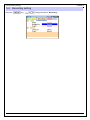
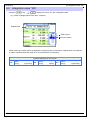
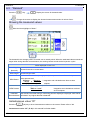
Settings for Harmonic analysis
KEW6315
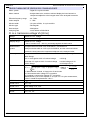
Settings for Harmonic analysis
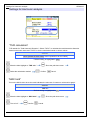
“THD calculation”
THD stands for ”Total Harmonic Distortion”. Select “THD-F” to calculate the total harmonics distortion
based on the basic wave and “THD-R” to do the calculation based on all rms values.
Selection
THD-F (based on basic wave)/ THD-R (based on all rms values)
* Default setting is highlighted in gray.
Move the blue highlight to “THD calc.”.
Select the calculation method.
Show the pull-down menu.
Confirm.
Cancel.
”MAX hold”
Turn on the MAX hold to show the mark indicates the max rate of content on a harmonics graph.
Selection
ON/ OFF
* Default setting is highlighted in gray.
Move the blue highlight to “MAX hold”.
Turn on/ off.
Confirm.
Show the pull-down menu.
Cancel.
- 63 -
KEW6315
KEW6315
Settings for Harmonic analysis
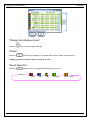
”Edit allowable range”
Set the EMC allowable range (rate of content) for harmonics per order. The edited ranges are displayed
as bar graph on the graph of harmonics.
Selection
Default/ can be customized (V/ A)
* Default setting is highlighted in gray.
Move the blue highlight to “Edit allowable range”.
Show the list of the ranges.
Select any desired harmonic order.
Show the value entry window.*
* A pop-up appears and show the effective range.
Set the allowable values.
Confirm.
Cancel.
The values in each box by default are complied with the international EMC standard IEC61000-4-7:
Industrial environment Class 3. Press the
Press the
key (Default) to restore the edited values to default.
key (A/V [%]) to switch current and voltage. The
the Measurement setting screen.
KEW6315
- 64 -
key is to return to
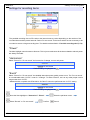
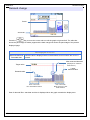
Threshold setting for Power quality (Event)
KEW6315
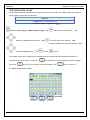
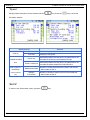
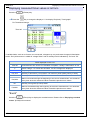
Threshold setting for Power quality (Event)
Press the
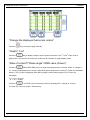
(OFF/ ON) to disable or enable the “threshold value” entry. If “OFF” is selected, the
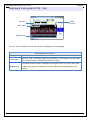
item will not be recorded even the threshold value is set for it. The threshold value used during the
previous measurement is displayed by pressing the
(ON) key.
Caution:
Threshold values for “Swell”, “Dip” and “INT” are the percentage of the nominal voltage. So when the nominal
voltage is changed, threshold voltage will be altered accordingly. For “Transient”, if the nominal voltage is
changed, the initial value will be automatically set to “300%”, which is three times the new nominal voltage (peak
voltage). The threshold value for “Inrush current” is the percentage of the Current Range, therefore, the value will
be altered if the setting of the current range is changed.
”Hysteresis”
Set a desired hysteresis in percentage to disable the event detection for the specific area. Setting a proper
hysteresis will be helpful to prevent unnecessary detections of events which are caused by voltage or
current fluctuations around the threshold values.
Selection
1 - 10%against the nominal voltage (5%)
* Default value is highlighted in gray.
Move the blue highlight to “Hysteresis”.
Show the value entry window.*
* A pop-up appears and show the effective range.
Set the hysteresis [%].
Confirm.
- 65 -
Cancel.
KEW6315
KEW6315
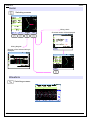
Threshold setting for Power quality (Event)
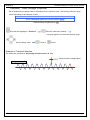
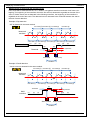
“Transient”: Over-voltage (Impulse)
Set an instantaneous voltage value as a threshold for the transient event. The following selection range
varies depending on the selected VT ratio.
Selection
±50 to ±2200Vpeak against the nominal voltage (300%)
* Default setting is highlighted in gray.
Move the blue highlight to “Transient”.
Show the value entry window.*
* A pop-up appears and show the effective range.
Set the voltage value.
Confirm.
Cancel.
Example of Transient detection:
The details are described in “Displaying recorded events” (P. 116).
Threshold value (voltage value)
Voltage waveform
KEW6315
- 66 -
Threshold setting for Power quality (Event)
KEW6315
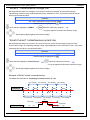
“SWELL”: Instantaneous voltage rise
Set the threshold value (rms voltage in one cycle) for swell in percentage of the nominal voltage.
The following selection range varies depending on the selected VT ratio. The preset hysteresis has an
effect on this threshold value.
Selection
100 - 200% against the nominal voltage (110%)
* Default setting is highlighted in gray.
Move the blue highlight to “SWELL”.
Show the value entry window.*
* A pop-up appears and show the effective range.
Set the percentages against the nominal voltage.
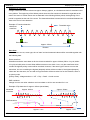
“Inrush Current”: Instantaneous current rise
Set the threshold value (rms current in one cycle) for inrush current in percentage of the max value
of the Current range. The following selection range varies depending on the selected CT ratio. The preset
hysteresis has an effect on this threshold value.
Selection
0 - 110% against the nominal voltage (100%)
* Default setting is highlighted in gray.
Move the blue highlight to “InrushCurrent”.
Show the value entry window.*
* A pop-up appears and show the effective range.
Set the percentages against the nominal voltage.
Example of Swell/ Inrush current detection:
The details are described in “Displaying recorded events” (P. 116).
rms value(2)
rms value(4)
rms value(6)
rms value(8)
Measured
waveform
rms value(1)
rms value(3)
rms value(5)
rms value(7)
rms value(9)
(5)
Threshold
RMS waveform (1)
(2)
(4)
(6)
(3)
Hysteresis
(7)
- 67 -
(8)
(9)
KEW6315
KEW6315
Threshold setting for Power quality (Event)
“DIP”: Instantaneous voltage drop
Set the threshold value (rms voltage in one cycle) for dip in percentage of the nominal voltage. The
following selection range varies depending on the selected VT ratio. The preset hysteresis has an
effect on this threshold value.
Selection
0 - 100% against the nominal voltage (90%)
* Default setting is highlighted in gray.
Move the blue highlight to “DIP”.
Show the value entry window.*
* A pop-up appears and show the effective range.
Set the percentages against the nominal voltage.
“INT”: A short period of power interruption
Set the threshold value (rms voltage in one cycle) for INT in percentage of the nominal voltage. The following
selection range varies depending the preset VT ratio. The preset hysteresis has an effect on this threshold
value. If rms voltages, 10V or less, are used for event detections, ensure that the Int event detection is
enabled. Otherwise, events will not be detected properly.
Selection
0 - 100% against the nominal voltage (10%)
* Default setting is highlighted in gray.
Move the blue highlight to “INT”.
Show the value entry window.*
* A pop-up appears and shows the effective range.
Set the percentages against the nominal voltage.
Example of Dip/ Int detection:
The details are described in “Displaying recorded events” (P. 116).
rms value(2)
rms value(4)
rms value(6)
rms value(8)
Measured
waveform
rms value(1)
RMS waveform
(1)
rms value(3)
(2)
rms value (5) rms value (7)
(3)
(7)
(4)
Threshold
KEW6315
(6)
(5)
- 68 -
(8)
rms value(9)
(9)
Hysteresis
Filter setting for Flicker measurement
KEW6315
Filter setting for Flicker measurement
“Filter coefficient”
Set a proper filter coefficient according to the nominal voltage for accurate flicker measurements. Select
the values of nominal voltage, nominal frequency and filter coefficient values appropriate to the actual
measured object. If possible, harmonize the filter coefficient and the nominal voltage.
Selection
230V/ 220V/ 120V/ 100V
* Default setting is highlighted in gray.
Move the blue highlight to “Filter”.
Select proper Filter coefficient.
Show the pull-down menu.
Confirm.
- 69 -
Cancel.
KEW6315
KEW6315
Target power factor for Capacitance calculation
Target power factor for Capacitance calculation
“Target power factor”
Set a target power factor for capacitance calculation. The power factor gets influenced badly if inductive loads,
such as motors, are connected to the power supply because current phases lag behind the voltage phases in
this case. Usually, phase advanced capacitors are installed in high-voltage-receiving installations, to reduce
such influences. Improving the power factor may cut down electricity tariffs if the customer is on low-, high- or
industrial power construction.
Selection
0.5 – 1 (1.000)
* Default setting is highlighted in gray.
Move the blue highlight to “Target PF”.
Show the value entry window.*
* A pop-up appears and show the effective range.
Select a desired target PF.
KEW6315
- 70 -
5.4 Recording setting
5.4
KEW6315
Recording setting
Press the
Key.
Change the tabs to “Recording”.
- 71 -
KEW6315
KEW6315
Settings for recording items
Settings for recording items
The possible recording time on SD cards or the internal memory varies depending on the number of the
recorded items and the preset intervals. Select “Do not record” for the items which are not necessary to be
recorded to secure a longer recording time. The details are described in “Possible recording time”(P. 76).
“Power”
The blue highlight cannot locate on this area. This is just to make sure all the items related to electric power
are always recorded.
“Harmonics”
Select “Record” or “Do not record” the harmonics of voltage, current and power.
Selection
Record/ Do not record
* Default setting is highlighted in gray.
“Event”
Select “Record” or “Do not record” the detailed data when power quality events occur. The “Do not record”
is not selectable when “AUTO”* is set for “A Range”. To select “Record”, set it to any other proper current
ranges other than “AUTO”.
* Measurements complied with IEC61000-4-30 Class S cannot be performed with “AUTO” setting.
Selection
Record/ Do not record
* Default setting is highlighted in gray.
Move the blue highlight to “Harmonics”/ “Event”.
Show the pull-down menu.
Select “Record” or “Do not record”.
Cancel.
KEW6315
Confirm.
- 72 -
Saved items
KEW6315
Saved items
The following data measured on each CH will be saved according to the selected recording method.
Saved items are depending on the selected recording method and wiring system.
Meas./ Rec. setting
REC file
REC item
Power
+Harmonics
+Event
RMS voltage (line/ phase)
RMS current
Active power
Reactive power
Apparent power
Power factor
Frequency
Neutral current(3P4W)
V/ A phase angle (1st order)
Analog input voltage, 1CH, 2CH
Power
measurement
V/A unbalance ratio
1-min Voltage flicker
Short-term V Flicker (Pst)
Long-term V Flicker (Plt)
Capacitance calculation
Active power energy (consumption/ regenerating)
Reactive power (consumption) lagging/ leading
Apparent power energy (consumption/ regenerating)
Reactive power (regenerating) lagging/ leading
Demand (W/VA)
Target demand (W/VA)
Total harmonic distortion of V(F/R)
Total harmonic distortion of A(F/R)
Harmonic V/ A(1-50th order)
Harmonics
V/ A phase angle (1-50th order)
measurement
V/ A phase difference (1-50th order)
Harmonic power (1-50th order)
V/ A Change
RMS voltage per half-cycle
RMS current per half-cycle
Event detected date & time
Event type
Event type
Measured values at event detection
Waveform
V/A waveform
- 73 -
KEW6315
KEW6315
Recording method
Recording method
“Interval”
Set the interval to record the measured data on the SD or internal memory. Seventeen different intervals are
available, but it cannot be set to a longer time than the demand measurement cycle. The preset recording
interval may be changed automatically according to the selected demand measurement cycle. Please refer
to “Settings of demand measurement” (P. 59) in this manual.
Selection
1 sec/ 2 sec/ 5 sec/ 10 sec/ 15 sec/ 20 sec/ 30 sec/
1 min/ 2 min/ 5 min/ 10 min/ 15 min/ 20 min/ 30 min/
1 hour/ 2 hours/ 150,180 cycles (approx. 3 sec)
* Default setting is highlighted in gray.
* The intervals: 150, 180 cycles (approx. 3 sec) are the ones defined in IEC61000-4-30. Data will be collected
in 150 cycles at 50Hz (nominal frequency) and in 180 cycles at 60Hz (nominal frequency).
Move the blue highlight to “Interval”.
Select a desired interval.
KEW6315
Show the list of the intervals.
Confirm.
- 74 -
Cancel.
Recording method
KEW6315
“Start”
Select the method to start recording.
Selection
Manual/ Constant rec./ Time period rec.
* Default setting is highlighted in gray.
Move the blue highlight to “Start”.
Show the pull-down menu.
Select a desired recording start method.
Confirm.
Cancel.
”Manual”
Start/ stop the recording with
Key.
“Constant recording”
Measured data will be recorded continuously at the preset interval during the specified start/ stop time and date.
Please refer to “(8)/ (9) Setting for recording method” (P. 45).
Selection
Start time and date
Day/ Month/ Year Hour:Minute (00/00/0000 00:00)
Stop time and date
Day/ Month/ Year Hour:Minute (00/00/0000 00:00)
Move the blue highlight to “REC Start”/ “REC End”.
Specify the time and date.
Confirm.
- 75 -
Show the value entry window.
Cancel.
KEW6315
KEW6315
Possible recording time
“Time period recording”
Measured data will be recorded at the preset interval for the specified time period of the selected period. When
the specified time comes, a recording will start and end automatically; such a recording cycle will be repeated
everyday during the specified period. Please refer to “(8)/ (9) Setting for recording method” (P. 45).
Selection
REC Period
Start-Stop
Day/ Month/ Year (DD/ MM/ YYYY) - Day/ Month/ Year (DD/ MM/ YYYY)
REC Time
Start-Stop
Hour:Minute (hh:mm) - Hour:Minute(hh:mm)
Move the blue highlight to “REC Period”.
Specify the time and date.
“REC Time.
Confirm.
Show the value entry window.
Confirm.
Show the value entry window.
Cancel.
Move the blue highlight to
Specify the time and date.
Cancel.
Possible recording time
When the 2GB of SD is used:
Interval
1sec
2sec
5sec
10sec
15sec
20sec
30sec
REC item
Power
+Harmonics
13days
15days
38days
2.5months
3.5months
5months
7.5months
3days
3days
7days
15days
23days
1month
1.5months
Interval
1min
2min
5min
10min
15min
20min
30min
1hour
2hours
150/180-cycle
Power
REC item
+Harmonics
1-year or more
2-year or more
6-year or more
10-year or more
3months
6months
1-year or more
2-year or more
3-year or more
5-year or more
7-year or more
10-year or more
23days
4days
* Data of power quality events are not considered to estimate the possible recording time. The max possible
recording time will be shortened by recording such events. The max file size per recording is 1GB.
* Please ensure to use the SD cards provided with this instrument or as optional parts.
KEW6315
- 76 -
5.5 Other settings
5.5
KEW6315
Other settings
Press the
Key.
Change the tabs to “Others”.
Settings for system environment
“Language”
Select the language to be displayed.
Selection
Japanese/ English
* Default setting is highlighted in gray. Changes made by user will remain after system reset.
Move the blue highlight to “Language”.
desired language.
Confirm.
Show the pull-down menu.
Select a
Cancel.
- 77 -
KEW6315
KEW6315
Settings for system environment
“Date format”
Select a desired date display format. The selected date format will be reflected to the date display on the screen
and on each setting window.
Selection
YYYY/ MM/ DD / MM/ DD/ YYYY / DD/ MM/ YYYY
* Default setting is highlighted in gray. Changes made by user will not be cleared after system reset.
Move the blue highlight to “Date format”.
Select a desired date format.
Show the pull-down menu.
Confirm.
Cancel.
“CH color”
Specify the colors for voltage and current per CH. The colors will be reflected into the characters on item label
and lines on the graph and wiring diagram.
Selection
White/ Yellow/ Orange/ Red/ Gray/ Blue/ Green
The selected colro for VN is refected into the wiring diagram only.
* Default color setting is: VN: Yellow/ 1CH: Red/ 2CH: White/ 3CH: Blue/ 4CH: Green.
Changes done by user will not be restored to default even after the system is reset.
Move the blue highlight to “CH Color”.
Select colors.
KEW6315
Confirm.
Show the color setting window.
Cancel.
- 78 -
KEW6315 Setting
KEW6315
KEW6315 Setting
“Time”
Adjust and set the internal system clock.
Selection
dd/ mm/ yyyy hh:mm
* The selected date format has an effect on this setting.
Move the blue highlight to “Time”.
Show the value entry window.
Adjust the time and date.
Confirm.
Cancel.
“ID Number”
Assign an ID number for the unit. Assigning ID numbers will be helpful to use multiple units at the same time
or measuring multiple systems with one unit periodically and analyze the recorded data.
Selection
00-001 to 99-999 (00-001)
* Default setting is highlighted in gray.
Move the blue highlight to “ID Number”.
Enter an ID number.
Show the value entry window.
Confirm.
- 79 -
Cancel.
KEW6315
KEW6315
KEW6315 Setting
“Buzzer”
Keypad sounds can be muted. The warning buzzer for demand judgment or low battery voltage sounds even
“OFF” is selected.
Selection
On/ Off
* Default setting is highlighted in gray.
Move the blue highlight to “Buzzer”.
Confirm.
Show the pull-down menu.
Select On/ Off.
Cancel.
“Bluetooth®”
®
®
Turn on/ off the Bluetooth function. Select “Off” if Bluetooth communication will not be performed.
Selection
On/ Off
* Default setting is highlighted in gray.
®
Move the blue highlight to “Bluetooth ”.
Confirm.
Show the pull-down menu.
Select On/ Off.
Cancel.
“Power”
Select to enable or disable the auto-power-off function. This setting is for the case KEW6315 operates with an
AC power supply. Auto-power-off activates in 5 min after the last operation while KEW6315 is operating with
batteries.
For:
AC Power
Selection
Power off in 5 min. / Disable auto-off
Battery
Power off in 5 min.
* Default setting is highlighted in gray.
Move the blue highlight to “Power”.
Show the pull-down menu.
Select either turning on/ off the auto-off function.
KEW6315
- 80 -
Confirm.
Cancel.
KEW6315 Setting
KEW6315
“Backlight”
This setting can turn off the backlight automatically when the prescribed time passes after the last key
operation. The backlight will be turned off in 2 min after the last operation while KEW6315 is operating with
batteries.
For:
Selection
AC Power
Power off in 5 min. / Disable auto-off
Battery
Power off in 2 min.
* Default setting is highlighted in gray.
Move the blue highlight to “Backlight”.
Show the pull-down menu.
Select either turning on/ off the auto-off function.
Confirm.
Cancel.
“System reset”
Restore all the settings to default except for “Language”, “Date format”, ”CH Color” and “Time”.
Move the blue highlight to “System reset”.
Select “Yes” or “No”.
Show a confirmation message.
Restore the settings to default.
- 81 -
KEW6315
KEW6315
5.6
Saved data
Press the
Key.
Save the “
“
5.6 Saved data
”: Measurement data, “
Change the tabs to “Saved data”.
”: Print screen” and “
”: Setting data” on the “
”SD card or in the
” internal memory. If SD card is inserted in the instrument, these data will be automatically saved on the
SD card. Remove or do not insert the SD card to save the data in the internal memory. Data save destination
is not adjustable. Max number of the file that can be saved in the internal memory is: 3 for measurement data
and 8 for the other data.
To delete, transfer or format the recorded data
Select a desired operation.
Confirm.
KEW6315
- 82 -
To delete, transfer or format the recorded data
KEW6315
“Delete data”
Show the list of the recorded data, and then select unnecessary data.
Icons on the screen means:
: SD card,
: Internal memory,
Measured data,
: Print screen,
: Setting data
Data are not listed in time sequence. The recorded date and time are displayed to the right of file name.
As for the data which are previously transferred from the internal memory to an SD card, the displayed
time means when the data were transferred. The scroll bar is displayed when the list of the recorded
data exceeds the display area.
Data location
Scroll bar
Checkbox
Move the blue highlight to the data you want to delete.
message will appear.
A check mark “
Select “Yes” or “No”.
Confirm.
A confirmation
Delete the data.
” will be put in the checkbox for the selected data. Multiple data can be selected at once.
“Delete”
Press the
Key and select “Yes” on the confirmation message to delete the data.
“Internal”/ “SD card”
Pressing the
Key can switch between “Internal memory” and “SD Card” and the corresponding icon
will be displayed in the upper left of the screen. Checked boxes will be cleared if the screens are switched
before deleting the data.
- 83 -
KEW6315
KEW6315
To delete, transfer or format the recorded data
“Space”
Storage media information can be checked with the
Key. Press the
Key to close the
information window.
Displayed items
Capacity
Possible recording
time
Max number of
saved data
Selection
Total size
Total memory capacity
Free size
Capacity of free space
Power only
Power+ Harmonics
Measurement data
* Internal memory
Settings/
only
Print screen
Estimated possible recording time if the parameters to be
recorded are limited to power-related ones only.
Estimated possible recording time if the parameters to be
recorded are power-related ones and harmonics.
Number of measurement data files saved in the memory
* Max number of files: 3
Number of KEW6315 setting and print screen data files
* Max number of files: 8
“BACK”
To return to the “Saved data” screen, press the
KEW6315
Key.
- 84 -
To delete, transfer or format the recorded data
KEW6315
“Transfer data”
Select the data you want to transfer from the “
Data files which can be transferred are: “
”: internal memory to the SD card “
”: Measurement data, “
”.
”: Print screen, “
”: Setting data.
Data are not listed in time sequence. The recorded date and time are displayed to the right of file name.
As for the data which are previously transferred from the internal memory to an SD card, the displayed
time means when the data were transferred. The scroll bar is displayed when the list of the recorded data
exceeds the display area.
Data location
Scroll bar
Checkbox
Select the data you want to transfer.
appear.
A check mark “
Confirm.
Select “Yes” or “No”.
A confirmation message will
Selected data will be transferred.
” will be put in the checkbox for the selected data. Multiple data can be selected at once.
“Transfer”
Press the
(Transfer) Key and select “Yes” on the confirmation message to transfer the selected data.
“SD card”
To check the data on the SD card, press the
(SD card) Key. Pressing the
Key again returns
to the list of data saved in the internal memory. Checked boxes will be cleared if the screens are switched
before transferring the data.
“Space”
Storage media information can be checked with the
Key. Press the
Key to close the
information window. Please refer to “Space” (P. 84) for further details.
- 85 -
KEW6315
KEW6315
To delete, transfer or format the recorded data
“BACK”
To return to the “Saved data” screen, press the
Key.
“Format”
Format the “
”: SD card or “
”: Internal memory. Data are not listed in time sequence. The recorded
date and time are displayed to the right of file name. As for the data which are previously transferred from
the internal memory to an SD card, the displayed time means when the data were transferred. The scroll
bar is displayed when the list of the recorded data exceeds the display area.
Data location
Scroll bar
A confirmation message will appear.
Select “Yes” or “No”.
Format.
“Format”
A confirmation message will appear when pressing the
(Format) Key. Select “Yes” to start format.
“Internal”/ “SD card”
Pressing the
Key can switch between “Internal memory” and “SD Card” and the corresponding icon
will be displayed in the upper left of the screen.
“Space”
Storage media information can be checked with the
Key. Press the
information window. Please refer to “Space” (P. 84) for further details.
“BACK”
To return to the “Saved data” screen, press the
KEW6315
Key.
86
Key to close the
Type of the saved data
KEW6315
Type of the saved data
Data file handling
The file name will be assigned automatically. File no. is kept and saved, even after powering off the
instrument, until the system is reset. The file number will increase until it exceeds the max file number.
If a file with the same file name already exists, the files in the data folder will be saved as another name
with a different file number. The file number will be automatically increased by 1. However, “Print screen”
and “Setting” files will be overwritten in such a case. When the file number starts from “0” or one same
SD is used for multiple instruments, extra cautions should be paid so that necessary files will not be
overwritten. When all the file numbers are used for each type of data, the files on the data folder will be
overwritten.
If files are deleted or the name of folder or file are changed on a PC, editing on the instrument or data
analysis with special software cannot be performed. Please do not change the name of folder or file.
“Print screen”
Press the
to save the screen images as BMP files.
File name: PSSD
|
Dest. code
SD:SD card
ME:Internal memory
* Dest. = Destination
000
|
.BMP
|
File No.
(000-999)
Extension
(BMP file)
“KEW6315 Setting”
Press the
key and move to “Saved data” tab, and then select “Save Settings”.
File name: SUP
S
|
Dest. code
S:SD card
M:Internal memory
- 87 -
0000
|
.PRE
File No.
(0000-9999)
KEW6315
KEW6315
Type of the saved data
“Data folder”
New folder will be created per measurement to save the interval and power quality data.
Folder
/ KEW /
S
0000
name:
|
Dest. code
S:SD card
M:Internal memory
|
Data No.
(0000-9999)
“Interval data”
KEW6315 setting
File name
SUP
S
0000
.KEW
Measurement setting
INI
S
0000
.KEW
Power measurement
INP
S
0000
.KEW
Harmonics measurement
INH
S
0000
.KEW
|
|
Dest. code
S:SD card
M:Internal memory
Data No.
(0000-9999)
“Power quality data”
Event type
File name EVT
S
0000
.KEW
Waveform
WAV
S
0000
.KEW
V/ A change
VAL
S
0000
.KEW
|
|
Dest. code
S:SD card
M:Internal memory
KEW6315
- 88 -
Data No.
(0000-9999)
KEW6315 settings and Data loading
KEW6315
KEW6315 settings and Data loading
Select a desired operation.
Confirm.
“Save settings”
Save the “
”: Setting data on the “
”: SD card or in the “
”: internal memory. Data are not listed in time
sequence. The recorded date and time are displayed to the right of file name. As for the data which are
previously transferred from the internal memory to an SD card, the displayed time means when the data were
transferred. The scroll bar is displayed when the list of the recorded data exceeds the display area.
Data location
Scroll bar
A confirmation message will appear.
Select “Yes” or “No”.
Data will be saved.
“Save”
Press the
Key and select “Yes” on the confirmation message to save the data on the SD card or in
the internal memory.
“Internal”/ “SD card”
Pressing the
Key can switch between “Internal memory” and “SD Card” and the corresponding icon
will be displayed in the upper left of the screen.
- 89 -
KEW6315
KEW6315
KEW6315 settings and Data loading
“Space”
Storage media information can be checked with the
Key. Press the
Key to close the
information window. Please refer to “Space” (P. 84) for further details.
“BACK”
To return to the “Saved data” screen, press the
Key.
The following settings for KEW6315 can be saved.
Basic setting
Measurement setting
Setting item
Setting item
Measurement cycle
Wiring
Voltage range
Demand
Inspection cycle
VT ratio
Target
Nominal voltage
THD(total harmonic distortion) calc.
Harmonics
Clamp/ Current range
Allowable range
CT ratio
MAX HOLD
DC range
Threshold for Hysteresis
Threshold for Transient
Frequency
Threshold for Swell
Power
quality
Threshold for Dip
Other settings
Threshold for INT
Setting item
Threshold for Inrush current
Environment
Date format
Flicker
KEW6315
ID number
Capacitance
setting
Buzzer
calculation
Filter coefficient (Ramp)
Target PF
Recording setting
Setting item
Recording
Harmonics
item
Power quality (event)
Interval
Recording method
Start
REC Start
Constant meas.
Time period rec.
KEW6315
- 90 -
REC End
Rec. period
Start – End
Time period
Start – End
KEW6315 settings and Data loading
KEW6315
“Read settings”
Read the “
”: Setting data from the “
”: SD card or from the “
”: internal memory. Data are not listed
in time sequence. The recorded date and time are displayed to the right of file name. As for the data which
are previously transferred from the internal memory to an SD card, the displayed time means when the data
were transferred. The scroll bar is displayed when the list of the recorded data exceeds the display area.
Data location
Scroll bar
Check box
Select the data you want to transfer.
appear.
Confirm.
Select “Yes” or “No”.
A confirmation message will
Confirm.
The scroll bar is displayed when the list of the recorded data exceeds the display area. A check mark “
”
will be put in the checkbox for the selected data.
“Read”
Press the
(Transfer) Key and select “Yes” on the confirmation message to transfer the selected data.
“Internal”/ “SD card”
Pressing the
Key can switch between “Internal memory” and “SD Card” and the corresponding icon
will be displayed in the upper left of the screen.
“Space”
Storage media information can be checked with the
Key. Press the
Key to close the
information window. Please refer to “Space” (P. 84) for further details.
“BACK”
To return to the “Saved data” screen, press the
Key.
91
KEW6315
KEW6315
Instantaneous value “W”
Chap. 6 Displayed Items
6.1
Instantaneous value “W”
Press the
Key.
Display the screen for “W”: Instantaneous value.
List display of the measured values
“List” (/Zoom)
e.g.) Instantaneous values measured under 3P3W3A+1A (Three-phase Three-wire + Current
(optional sensor))
Measured at 1CH
Measured at 2CH
Measured at 3CH
Measured with an
optional sensor.
Total
Elapsed time/
(1ch+2ch+3ch)
Selected interval
Multiple measured values can be displayed on one screen. The displayed items can be changed by
pressing the corresponding keys.
KEW6315
- 92 -
List display of the measured values
KEW6315
Symbol displayed on the LCD
V
*1
P
PF
DC1
2
An*
Phase voltage
Active
power
+
consumption
-
regenerating
Power
factor
+
Lagging
-
leading
Analog input
Voltage at 1ch
Neutral current
VL
*1
Q
f
Reactive
power
+
Lagging
-
leading
A
Current
S
Apparent power
Frequency
DC2
PA
Line voltage
*3
Analog input
Voltage at 2ch
V/A Phase
difference
+
Lagging
-
leading
C*
*1
W screen: Displays of V and VL can be “customized” when “3P4W” is selected.
*2
W screen: “An” is displayed only when “3P4W” is selected.
*3
W screen: Displays of PA and C can be “customized” with the
3
Capacitance calculation
(customize) Key. Line voltages
are converted into phase voltages to determine currents and phase angles for “PA” of 3P3W3A.
e.g.) Instantaneous values measured under 1P3W-2 (2 systems)
- 93 -
KEW6315
KEW6315
List display of the measured values
“Switching the displayed systems”
Press the
key and switch the displayed systems. Items displayed in a screen depend on the
selected wiring configuration and the number of systems. The dotted lines represent the space of each
display area.
1P2W-1 to -4 (Single phase, 2-wire, 1 – 4 systems)
1-system
2-system
3-system
4-system
Measured
values on
1ch
(V1/A1)
Measured
values on
1ch
(V1/A2)
Measured
values on
1ch
(V1/A3)
Measured
values on
1ch
(V1/A4)
Total
values
1P3W-1, -2 (Single phase, 3-wire, 1 or 2 systems)
1-system
2-system
Measured
values on
1ch
Measured
values on
2ch
Measured
values on
1ch
(V1/A1)
(V2/A2)
(V1/A3)
Sum of
1ch and 2ch of
1 system
Σ
Measured
values on
2ch
(V2/A4)
Sum of
1ch and
2ch of
1 system
Sum of
1ch and 2ch of
2 systems
Sum of
1ch and
2ch of
2 systems
Total values
3P3W-1, -2 (Three-phase, 3-wire, Blondel’s theorem, 1 or 2 systems)
1-system
Measured
values on
1ch
Measured
values on
2ch
(V12/A1)
(V23/A2)
Sum of
1, 2 and 3ch of
1 system
KEW6315
Σ
2-system
Computed
values on
3ch
Measured
values on
1ch
(V12/A3)
Measured
values on
2ch
(V23/A4)
Sum of
1, 2 and 3ch of
2 systems
- 94 -
Computed
values on
3ch
Sum of
1, 2 and
3ch of
1 system
Sum of
1, 2 and
3ch of
2 systems
Total values
List display of the measured values
KEW6315
3P3W3A (Three-phase 3-wire)
Measured
values on
1ch
(V12/A1)
Measured
values on
2ch
Measured
values on
3ch
(V23/A2)
(V31/A3)
3P4W (Three-phase 4-wire)
Measured
values on
1ch
(V1/A1)
Sum of 1, 2 and 3ch
Measured
values on
2ch
(V2/A2)
Measured
values on
3ch
(V3/A3)
Sum of 1, 2 and 3ch
“Switching the type of displayed values”
The displayed values can be switched between Inst, Avg, Max and Min values with
key. If the
selected interval is “1 sec”, Inst, Avg, Max and Min values will be the same since the display update is
also “1 sec”.
“Wh” Integration value
Press the
(Wh) key and switch the screens to view integration values. Please refer to
“6.2 Integration value [Wh]” (P. 100) in this manual.
“Zoom”
Four or eight measured values can be zoomed and displayed on one screen by pressing the
(Zoom) key. Please refer to “Zoom display” (P. 96) in this manual.
“Trend graph”
Press the
(Trend) key to show the trend graphs. The displayed time area is from present to
the past 60 min. Please refer to “Displaying Trend graph” (P. 97) in this manual.
“Customize”
Press the
(Customize) key to switch the displayed items and change the display positions.
Please refer to “Changing displayed items and display position” (P. 99) in this manual.
- 95 -
KEW6315
KEW6315
Zoom display
Zoom display
Example: 8-split screen
Displayed item
Type of value: Inst/ AVGa.
Select 4 or 8 values and display the values on one screen. The displayed text will be enlarged so it is easy
to see.
”Displayed items”
Select the items to be displayed in each column. Then, the selectable items will be displayed to the right.
Move the blue highlight to a Displayed item in any column.
Select a desired item to be displayed.
KEW6315
- 96 -
Confirm.
Show the list.
Cancel.
Displaying Trend graph
KEW6315
”Type of value”
Any of the following values can be displayed in each column.
Inst: Instantaneous value, or AVG: Average value, MAX: Maximum value or MIN: Minimum value within the
selected interval.
If the selected interval is “1 sec”, Inst, Avg, Max and Min values will be the same since the display update
is also “1 sec”.
Move the blue highlight to a Type of value in any column.
Select a desirable type.
Confirm.
Show the pull-down menu.
Cancel.
“List display”
Press the
(List) key to display all the values on the list.
”4-Split”/ ”8-Split”
Press the
(4-Split/ 8-Split) key to expand and display 4 or 8 items on one screen.
Displaying Trend graph
In the following example, active powers per ch for 1P3W-2 (Single-phase 3-wire, 2-system) are displayed
on the graph.
Inst value on 1ch of system 1
Inst value on 2ch of system 1
Inst value on 1ch of system 2
Inst value on 2ch of system 2
Lines are colored per ch.
Elapsed time
Changes of each measured values can be displayed on the graph.
- 97 -
KEW6315
KEW6315
Displaying Trend graph
The following example shows 1P3W-2 (Single-phase 3-wire, 2-system).
”Change the items displayed on Trend graph”
Press the
key and change the items displayed on the trend graph.
“Σ/CH”
Press the
(Σ/CH) key to switch the graphs: one is to display the sum and total values per
system and another is to display the values per ch. The selection of “Σ” or “CH” will be effective for all the
trend graphs. When “Σ” is selected, while A: rms current values is selected for 3P4W, An: neutral current
values will be displayed on the trend graph.
“List display”
Press the
KEW6315
(List) to show all the values on a list.
- 98 -
Changing displayed items and display position
KEW6315
Changing displayed items and display position
Present displayed items
After the change
The displayed items can be changed to any desired ones.
Move the blue highlight to the item you want to change.
Select a desired item.
Confirm.
Confirm.
Show the pull-down menu.
Cancel.
Select OK/ Cancel.
Cancel.
When opening the "Change the items" window, presently displayed items are displayed in two rows.
The presently displayed items are displayed on the left, and the items to be displayed after the change
are displayed in blue on the right. Displayed positions are basically separated into two large categories:
one is for voltage/ current and another is for power/ capacitance calc.. For the details about the symbols
displayed on the screen, please refer to “List display of the measured values” (P. 93).
- 99 -
KEW6315
KEW6315
6.2
6.2 Integration value “Wh”
Integration value “Wh”
Press the
Key.
Display the screen for “Wh”: Integration value.
e.g.) 1P3W-2 (Single-phase Three-wire, 2-system)
Elapsed time
Σ: Total amount
Σ:sum per system
Power used in the certain period is displayed as integral power consumption. Integral power consumption
is used to calculate electricity tariffs or to control the power consumption.
Symbols displayed on the screen
WP
KEW6315
Active
power
energy
+
consumption
-
regenerating
WQ
Reactive
power
energy
- 100 -
+
-
lagging
leading
WS
Apparent
power
energy
+
consumption
-
regenerating
6.2 Integration value “Wh”
KEW6315
e.g.) 1P3W-2 (Single-phase Three-wire, 2-system)
“Change the displayed systems”
Press the
Key to switch the displayed systems. Please refer to “Setting of wiring system”
(P. 49) in this manual.
”Change the displayed chs”
Press the
Key to switch the displayed channels. Please refer to “Setting of wiring system” on
(P. 49) in this manual.
”Demand”
Press the
(Demand) Key to display the screen for demand value. Please refer to “6.3 Demand”
(P. 102) in this manual.
- 101 -
KEW6315
KEW6315
6.3
6.3 Demand
”Demand”
Press the
Key.
Display the screen for demand value.
Change the screens to display the demand measurement results in various forms.
Showing the measured values
Move the blue highlight to “Meas.”.
The demand is the average powers recorded over a certain period. When the estimated value exceeds the
target value during demand measurements, the warning buzzer sounds at the inspection cycles.
Items displayed on the LCD
Remaining time
(time left)
DEM Target
Demand interval is counted down.
Demand target value.
Predicted demand value (average power) when preset demand interval elapses
DEM Guess
under present load.
(Present
(Present
value) x
interval)
(Elapsed time)
* Integration and calculations are done as time
elapses.
Demand value (average power) within a demand interval.
DEM Present
DEM Max
“WP+ x 1 hour”
Interval
* Integration and calculations are done
as time elapses.
Max demand recorded during a measuring period is displayed. Displayed value will be
Recorded date refreshed if any higher demand is detected.
Instantaneous value “W”
Press the
(W) Key to show instantaneous values on the screen. Please refer to “6.1
Instantaneous value “W”” (P. 92) in this manual for further details.
KEW6315
- 102 -
Shifts in specific period
KEW6315
Shifts in specific period
Items displayed on the LCD
Remaining time
(time left)
DEM P
DEM G
Demand interval is counted down.
Percentage of the present value against the target value.
Present value
is displayed.
Target value
Percentage of the predicted value against the target value.
Predicted value
Target value
is displayed.
Time left
Target value
When the predicted value
exceeds the target value
during demand measurements, the warning buzzer
sounds at the inspection
cycles.
Predicted value
Present demand
value
Meas. cycle
Inspection
cycle
Inspection
cycle
Inspection
cycle
Save point
- 103 -
KEW6315
KEW6315
Demand change
Demand change
Cursor
Scroll bar
Press the
Key to move the cursor and to scroll the graph to right and left. The white bar
shows the percentage of hidden pages and the dark orange bar shows the percentage of the present
displayed page.
Items displayed on the LCD
Measured demand/
Recorded date
Demand value is displayed with recorded date & time info where the cursor is
located.
Max measured demand
(Displayed on measurement screen.)
Target value
Latest
demand value
Demand value
Start of demand/
Rec. start date and time
End of demand/
Most recent rec. start
date and time
Start of demand/ Rec. start date and time is displayed when the graph exceeds the display area.
KEW6315
- 104 -
6.4 Vector
6.4
KEW6315
Vector
Press the
Key.
e.g.) 3P4W
Vector display
Measured values
1
2
V: rms voltage*
/Phase angle*
A: rms current
/ Phase angle*
2
*1
For 3P3W3A, rms line voltages are displayed.
*2
Phase angled is displayed: using Phase of V1
o
as the base (0 ).
Phase angle (Leading)
-0° to -180°
Vector display:
rms voltage (solid line)
rms current (dotted line)
±180°
±0°
Phase angle (Lagging)
+0° to +180°
The circle (solid line) represents the max values at V and A Ranges, and the line length represents rms
voltage and current values. The angle between the lines represents phase relation with reference to V1.
For 3P3W3A/3P4W, unbalance ratio is also displayed. While the measured voltages and currents are
balanced, the following vectors will be displayed.
3P3W
1P3W
1P2W
V
A
±0°
±0°
V
1CH:±0°
2CH:±180°
V
1CH:±0°
2CH:±180°
1CH:±0°
2CH:-60°
A
1CH:-90°
2CH:+30°
3P4W
3P3W3A
V
A
A
1CH:±0°
1CH:+30°
2CH:+120° 2CH:+150°
3CH:-120° 3CH:-90°
V
A
1CH:±0°
2CH:+120°
3CH:-120°
1CH:±0°
2CH:+120°
3CH:-120°
- 105 -
KEW6315
KEW6315
6.4 Vector
e.g.) Vector of 3P4W:
”V x desired magnification”
: toggle the line lengths of voltage vector.
1
2
5
*time(s)
10
”A x desired magnification”
: toggle the line lengths of current vector.
1
2
5
*time(s)
10
“Diagram”
Press the
(Diagram) Key to show the wiring diagram for the selected wiring configuration. Please
refer to “Wiring diagram” (P. 50) in this manual for further details.
”Check”
Press the
(Check) Key to check the wiring connections and show the result. * NG result may
be given, even if the wiring is correct, at the measurement site under bad power factors. Please refer to
“Wiring check” (P. 43) in this manual for further details.
KEW6315
- 106 -
6.5 Waveform
6.5
KEW6315
Waveform
Press the
Key.
e.g.) Waveform of 1P3W-2 (Single-phase 3-wire, 2-system):
Measured values
V: rms voltage*
A: rms current
*
Colored waveforms
per ch
For 3P3W3A, rms line
voltages are displayed.
Voltage and current waveforms are displayed: for 10 cycles max. at 50Hz, for 12 cycles max. at 60Hz.
When changing the screens for “Waveform”, waveforms are displayed in the max scale automatically.
*time(s)
”Changing the displayed waveforms”
Press the
Key to change the displayed waveforms.
”V x desired magnification”
: toggle the magnifications of voltage waveform (vertical).
0.1
0.5
1
2
5
- 107 -
10
*time(s)
KEW6315
KEW6315
6.6 harmonics
”A x desired magnification”
: toggle the magnifications of current waveform (vertical).
0.1
0.5
1
2
5
*time(s)
10
”t x desired magnification”
: toggle the magnifications of time axis (horizontal).
1
2
5
*time(s)
10
“full scale”
: Restore all the changed magnification settings and automatically select the appropriate
magnification.
6.6
Harmonics
Press the
Key.
Displaying harmonics on the bar graph
Press the
(Graph) Key.
e.g.) The following represents 3P4W (Three-phase 4-wire) while “Linear” and “Full-scale display” are
selected.
Symbols displayed on the LCD
V
THD
P
KEW6315
Voltage
*
For 3P3W3A, rms line voltages are displayed.
A
Current
Voltage total harmonic distortion is displayed while “V” is displayed and current total distortion
factor is displayed while “A” is displayed. Total harmonic distortion is calculated according to
the selected THD calculation method.
Active power per ch
+
in
-
out
- 108 -
ΣP
Sum of each ch/
total active power
+
in
-
out
Displaying harmonics on the bar graph
KEW6315
Bar graph display
e.g.) “Linearity” is displayed in “Full-scale”.
Rate of content
th
Harmonics analysis: up to 50 order
In the above example, “Linear” and “full-scale” are selected. In this case, the upper limit of the rate of
st
th
content is “100%” and all harmonics, 1 to 50 , are displayed on one screen.
Item displayed on the LCD
Rate of content
Harmonic content of each order against the 1st basic wave.
e.g.) The following represents 3P4W (Three-phase
phase 4-wire)
4
while “LOG” and “Zoom” are selected.
Rate of content
Scroll bar
Harmonics analysis: displayed up to 15th order
When selecting “LOG” (Logarithm),, 10% will be the max percentage of the vertical axis and the harmonics
th
displayed are limited up to 15 order. Press the
key to scroll the pages. The basic waveform
st
of 1 order is fixed and does not move. The white
hite bar shows the percentage of hidden pages and the dark
orange bar shows the percentage
ercentage of the present displayed page.
- 109 -
KEW6315
KEW6315
Displaying harmonics on the bar graph
e.g.) 3P4W (Three-phase 4-wire) : with “LOG” and “Zoom”.
Exceeding the
axis value
Max value
Exceeding the
threshold
Graph color
Allowable
range
Items displayed on the graph
Displayed when the rate of harmonics content of each order is more than 10%.
Exceeding
The rate of harmonics content of the 1st basic waveform is “100%”, therefore,
the axis value
always exceeding the axis value in “LOG” display.
Max values recorded during measurements are displayed. These values can be
reset any of the following methods.
Max value
* Setting change,
* Start of recording, or
* Long press (2 sec or longer) of
Graph color
Exceeding the
threshold
Allowable range
KEW6315
Key.
When multiple measurement channels are used, each graph is displayed in
different colors.
Displayed when measured values exceed the preset allowable range.
Preset by default and complied with IEC61000-2-4 Class3.
To change the range, select “Edit allowable range.” in the “Measurement” setting.
setting
- 110 -
Displaying harmonics on the bar graph
KEW6315
“Change the displayed chs”
Press the
Key to change the displayed chs. The details about the relation between the wiring
configuration and ch are described in “Settings of wiring system” (P.49).
“List”/”Graph”
Press the
st
th
Key to display voltage/ current/ power harmonics, from 1 to 50 order, in list or
graphic form. Only the rate of harmonics content can be checked on graph display screen, but rms value/
rate of content/ phase angle* can be checked respectively on list display screen.
* While “P”(Power) is selected and displayed, phase differences between voltage and current are
displayed. Inflow: ±0° to ±90°, Outflow: ±90° to 180°.
“LOG”/ “Linear”
Press the
(LOG/Linear) Key to switch the display modes. Linear display, with ticks of 0% - 100%,
and Logarithm display, with ticks of 0.1% - 10%, are switchable on the vertical axis. It is useful to analyze
lower level of harmonics.
“Full”/”Zoom”
Press the
(Zoom/Full) Key to zoom and display fifteen harmonics on one screen. Voltage/
Current/ Power harmonics are separately displayed in graphic form. Press the
Key to scroll
the pages.
“V/A/P/ΣP”
Press the
(V/A/P/ΣP) Key and select the parameter to be analyzed.
- 111 -
KEW6315
KEW6315
Displaying the list of harmonics
Displaying the list of harmonics
Press the
(List) Key to display the list of harmonics.
e.g.) “P: Power harmonics” and “Power” of 1P3W-2 (Single-phase 2-wire, 2-system) are listed.
st
th
Rms values, rate of content and phase angle of voltage/ current/ power harmonics, from 1 to 50 , can be
displayed in list form respectively.
Items displayed on the LCD
V
P
*2
Voltage
Active power per ch
*1
A
+
in
-
out
ΣP
*2
Current
Sum of each ch /
+
in
total active power
-
out
*1
For 3P3W3A, rms line voltages are displayed.
*2
The letters and numbers displayed on the top represent the displayed parameter and the ch or system
number. If there is a space between the alphabet and the following number, the displayed no. represents
the system no.. In this case, the listed values are sum per system. If “P” is displayed alone, the listed
values are total amounts.
KEW6315
- 112 -
Displaying the list of harmonics
KEW6315
”Change the displayed harmonics orders”
Press the
Key to scroll the page vertically.
”Graph”/ ”List”
Press the
st
th
Key to display voltage/ current/ power harmonics, from 1 to 50 order, in list or
graphic form. Only the rate of harmonics content can be checked on graph display screen,
”Rate of content”/”Phase angle”/ RMS value (Power)”
Press the
(Rate/ DEG/ RMS) Key to change the displayed items on the list. While “V”:voltage or
o
“A”: Current are displayed on the screen, Rate/ DEG (phase angle with V1 basis (0 )) / RMS are switchable.
While “P” (ΣP): Power is displayed, Rate/ DEG (voltage/ current phase angle per ch) / Power are
switchable.
“V”/”A”/”P/ΣP”
Press the
(V/A/P/ΣP) Key and select the items to be analyzed: V: voltage/ A: Current/
P: Power (ΣP: Sum per system, Total amount).
- 113 -
KEW6315
KEW6315
6.7
6.7 Power quality
Power quality
Press the
Key to display Power quality screen.
Factors impair power quality and symptoms
Power quality
Waveform
Symptom
Inverter and Thyristor circuits
(phase-control circuit) are used
for the control circuit of general
Harmonics
devices; these circuits affect
currents and causes
harmonics.
Adverse effect
Burnout of capacitors and
reactors, buzzes from
transformers, malfunction
of circuit breakers, flicker in
screen or noises on stereos
due to currents with
harmonic components.
Inrush currents occur when
switches for power lines are
Swell
on, and then voltages
increase instantaneously.
RMS
Inrush currents occur when
Dip
motor loads are activated, and
dip in current occurs.
RMS
Power supply is interrupted
INT
for a second due to lightning
strikes.
KEW6315
- 114 -
Shutdown of devices or
robots or reset on PC and
business machines may be
caused.
Factors impair power quality and symptoms
Power quality
KEW6315
Waveform
Symptom
Adverse effect
Damage to a power source
Transient,
Over-voltage
(impulse)
Contact failure at a circuit
or reset of the device may
breaker, magnet or relay.
occur due to a drastic
voltage fluctuation (spike).
Instantaneous large currents
(surge) flow on devices with a
motor, incandescent lamp and
Inrush current
flat capacitor when powering
them on.
Influences on welded
contacts for Power switch,
blowing fuse, trip on
breaker, rectifier circuit
and fluctuations in power
supply voltage may occur.
Heavy loading on specific
Unbalance
rate
phase due to fluctuations in
Influences on voltage,
load of power line or drastic
current, motor operation
extension of installations.
occur; negative sequence
Distortions of voltage / current
voltage and harmonics
waveforms, dip and negative
occur.
sequence voltages are caused.
Too much load is caused on
certain phases due to increase
Flicker
RMS
RMS
and decrease of the loads
Unbalanced or reversed
connected to each phase such
voltages and harmonics
as supply lines or heavy use of
occur and result in motor
specific equipments, as a
instability, trip of 3E circuit
result, distortions on voltage
breaker or heating due to
and current waveforms, dip
overload.
and reversed voltages are
observed.
- 115 -
KEW6315
KEW6315
Displaying recorded events
Displaying recorded events
Press the
(Event) Key to display the list of the recorded events.
Measured values
Symbol indicating
event type
Items and symbols displayed on the LCD
Start
End
Swell
Dip
Symbol
INT
Transient
Inrush current
Instantaneous values recorded at the detection of the start and end of the event.
If the occurred event terminates in quite short period, the value measured at the
Measured value
end of the event may not be displayed. To check the r.m.s. values recorded before/
after the detection, please check r.m.s. variation data. Interval measurement data
will be helpful to check the measured values of long lasting events. To record power
quality events, short interval is useful in analysis.
Occurred time
and date
Time and date when KEW6315 detect the start and end of the event.
Event detection on poly-phase systems.
”INT”
When INT states are detected on all the chs selected according to the wiring configuration, it is regarded as
the start of the event. When the INT state ends on any of the measurement chs, it is regarded as the end of
the event.
”Swell”/ ”Dip”/ “Inrush current”/ “Transient”
When voltage or current falls into any event states on any one of the measurement chs selected according
to the wiring system, it will be regarded as the start of the event. When the state ends on all measurement
chs, it is regarded as the end of the event.
KEW6315
- 116 -
Displaying recorded events
KEW6315
Measurement of Swell/ Dip/ INT/ Inrush current
Each event will be detected with the r.m.s. values in one gapless waveform and with a half-wave overlapping. The beginning of the waveform where the first event is detected is regarded as the start of the
event. If further events are not detected in the following waveform, the beginning of the waveform is
regarded as the end of the event. The detected event is assumed to be continued between the start to
the end of event detection.
Example of Dip detection
* INT is detected in the same method.
rms value (2) rms value (4) rms value (6)
rms value (8)
Measured
waveform
rms value (1)
(1)
RMS waveform
rms value (3)
(2)
rms value (5)
(3)
rms value (7)
(7)
(4)
Threshold
(8)
(6)
rms value (9)
(9)
Hysteresis
(5)
Start of dip
End of dip
Duration
Example of Swell detection
* Inrush current is detected in the same method.
rms value (2) rms value (4)
rms value (6)
rms value (8)
Measured
waveform
rms value (1)
rms value (3)
rms value (5)
rms value (7)
rms value (9)
(5)
Threshold
RMS
waveform
(1)
(2)
(4)
(6)
(3)
Hysteresis
(7)
Start of swell
(8)
(9)
End of swell
Duration
- 117 -
KEW6315
KEW6315
Displaying recorded events
Detection of Transient
Voltage waveforms will be monitored at approx 40ksps, gapless, to calculate and check for transient event
every 200ms. The beginning of the 200ms period where the first transient is detected is regarded as the
start of the event. If further events are not detected in the following 200ms period, the beginning of the
period is regarded as the end of the event. The detected transient is assumed to be continued between the
start to the end of event detection.
Example of Transient detection
Threshold value
Measured
waveform
Start of transient
End of transient
Approx. 200ms
Duration
Save data
When an event occurs, event type, time of start/ end and measured values will be recorded together with
the following data.
Event waveform
Waveforms and also event data on all the chs are recorded for approx. 200ms (50Hz: 10-cycle, 60Hz:
12-cycle) at 8192 points in total. When different events occur within 1 sec, only the waveforms which
contain the highest-priority events will be recorded. However, if the same type of events occur at the
same time, the one containing the highest (deepest) values will be recorded. If the highest (deepest)
values are also the same, the one with a longer duration will be recorded. As for the channels, there is
no priority order.
[Priority order]: Voltage transient -> INT -> Dip -> Swell -> Inrush current
RMS variations
Voltage/ current rms value variations and event data on all chs are recorded for 1 sec.
Example of Dip detection for approx. 800ms (saved data)
.
Measured
waveform
Approx. 200ms
Approx. 200ms
RMS waveform
Approx. 1 sec.
KEW6315
- 118 -
Approx. 1 sec.
Displaying recorded events
KEW6315
”Change the displayed area”
Press the
Key to scroll the page vertically.
“Flicker”
Press the
(Flicker) Key to display the recorded flicker values. Details are described in
“Displaying measured flicker values in list form” (P. 120).
”Event detection”
Press the
(Detection) Key and toggle the displayed type of event.
All events
Swell
Dip
INT
- 119 -
Transient
Inrush current
KEW6315
KEW6315
Displaying measured flicker values in list form
Displaying measured flicker values in list form
Press the
Press the
(Flicker) Key.
Key to change the displays: V: List display/ Pst(1min): Trend graph/
Plt: Transitional change.
Time left
If variable loads, such as arc furnace, are connected, voltages may vary and cause changes in illumination
levels. Such phenomenon is called as “voltage flicker” and its severity level is indicated by “Pst” and “Plt”.
Items displayed on the LCD
Time left
Counted down time until a Pst calculation completes. Usually it takes about 10 min.
V
Phase voltage * For 3P3W and 3P3W3A, rms line voltages are displayed.
f
Frequency
Pst,1min
Pst
Pst,MAX
Plt
Plt,MAX
Severity of short term (1 min) flicker. It is useful for power quality survey or study.
Severity of short term (10 min) flicker.
Max Pst recorded through the beginning to the end of measurement. It is refreshed
every time when the measured values exceed the previous max values.
Severity of long term (2 hours) flicker.
Max Plt recorded through the beginning to the end of measurement. It is refreshed
every time when the measured values exceed the previous max values.
”Event”
Press the
(Event) Key to display the recorded events. Please refer to “Displaying recorded
events” (P. 116) in this manual.
KEW6315
- 120 -
Displaying trend graph of Pst, 1min
KEW6315
Displaying trend graph of Pst, 1min
Latest
Pst,1min
Pst,1min
Max values
Elapsed time
The “Pst, 1min” measured in the recent 120 min is displayed on the trend graph.
Items displayed on the LCD
Pst,1min
Max value
The latest Pst (1 min)
Max “Pst, 1min” recorded through the measurement. It is refreshed every time when
the measured values exceed the previous max values.
The latest measured value is displayed at the right end (on 0 min tick), and it shifts
Elapsed time
to left as time goes by. Changes in the recent 120 min can be displayed on one
screen.
- 121 -
KEW6315
KEW6315
Displaying changes of Plt
Displaying changes of Plt
Cursor
Scroll bar
Press the
Key to move the cursor or to scroll the page to right and left. The black bar
shows the percentage of hidden pages and the dark orange bar shows the percentage of the present
displayed page.
Items displayed on the LCD
Measured Plt /
Recoded date
Plt per ch is displayed with recorded date & time info where the cursor is located.
Latest Plt
Max value
Measured Plt
Latest record date and time
Rec. start date and time
The rec. start date and time is displayed when changes of Plt cannot be described on one page.
Items displayed on the LCD
Max value
KEW6315
Max Plt recorded from the beginning of the record until now. It is refreshed every time
when the measured values exceed the previous max values.
- 122 -
Chap. 7 Other functions
KEW6315
Chap. 7 Other functions
“Data hold”
Display update can be disabled by pressing the “DATA HOLD” Key. The “
” icon will appear while
display update is disabled. The icon will disappear and display update will be enabled by pressing the
“DATA HOLD” Key again. Switching screens is possible, moreover, measured values and event information
are continuously recorded even while the Data hold function is activated.
“Key lock”
Pressing the “DATA HOLD” Key 2 sec or more disables all Keys, except for LCD key, and “
” icon
appears. Another long press (2 sec or more) is required to restore the disabled Keys.
“Turning off the Backlight”
Press the LCD Key to turn off the backlight. Pressing any keys, except for the Power key, turns on the
backlight again.
“Backlight Auto-off”
While KEW6315 is connected to an AC power source:
The LCD backlight is turned off automatically 5 min after the last key operation. Press any key except
for the Power key to turn on the light again. To disable the Backlight auto-off function, select “Disable
auto-off” on the setup menu.
While KEW6315 operates with battery:
The brightness will be cut by half. The backlight will be automatically turned off 2min after it is turned on.
Press any key except for the Power Key to turn on the backlight again. The backlight does not on
continuously while the instrument is operating with batteries.
“Auto-power-off”
While KEW6315 is connected to an AC power source:
The instrument is powered off automatically 5 min after the last key operation. This function does not
operate while the instrument is recording data. Press the Power key to power on the instrument again.
To disable the auto-power-off function, select “Disable auto-off” on the setup menu.
While KEW6315 operates with battery:
The instrument is powered off automatically 5 min after the last key operation. This function does not
operate while the instrument is recording data. Press the Power key to power on the instrument again.
- 123 -
KEW6315
KEW6315
Chap. 7 Other functions
“Auto-ranging” (Current range)
Current ranges of each sensor are automatically switched according to the measured rms currents. This
function does not work while recoding the power quality events. A range shifts to one upper range when
the input exceeds 300%peak of each range and shifts to one lower range when the input drops under
100%peak of each range. However, while “AUTO” is selected, the upper range will be adopted to display
the values.
“Sensor detection”
Press the “Detection” key on the SETUP menu to detect the connected clamp sensors. KEW6315
automatically detects the connected sensors and checks the settings of the sensors.
“Recovery from power fails”
When the power supply to the instrument is inadvertently lost during a record, the interrupted record will
be resumed after the power supply is restored.
“Print screen”
Press the “PRINT SCREEN” Key to save the displayed screen as a BMP (bitmap) file.
* Max file size: approx. 77KB
“Retain settings”
Settings used during the previous test will not be cleared after powering off the instrument. KEW6315
retains and adopts the previous settings. * Default values will be displayed for the first time after purchase.
”Quick start guide”
Press the “START/STOP” Key to run the “Quick start guide”. It is useful to start recording just by adjusting
some simple settings according to the displayed screens.
”Status indicator”
The red indicator LED blinks when the backlight is off, and the green indicator LED stays on during
recording regardless of the backlight states. The green indicator LED blinks during stand-by mode.
KEW6315
- 124 -
8.1 Data transfer to PC
KEW6315
Chap. 8 Device connection
8.1 Data transfer to PC
Data in the SD card or the internal memory can be transferred to PC via USB or SD card reader.
Transfer to PC via:
USB
*1
*1
Card reader
SD card data (file)
∆
O
Internal memory data (file)
O
---------
: It is recommended to transfer the large data by use of SD card since transferring large data files by
USB requires more time than using the SD card reader. (transfer time : approx 320MB/ hour)
As to the manipulation of SD cards, please refer to the instruction manual attached to the card.
In order to save data without any problem, make sure to delete the files other than the data measured
with this instrument from the SD card beforehand.
USB
Internal memory/
SD card data
SD card
SD card slot or
card reader
- 125 -
KEW6315
KEW6315
8.2
8.2 Using Bluetooth® function
®
Using Bluetooth function
®
Measuring data can be checked on android devices in real-time via Bluetooth communication. It is necessary
®
®
to enable Bluetooth function prior to using Bluetooth communication. (Setting No. 26: Bluetooth)
®
Bluetooth
Android device
* Before starting to use this function, download the special application “KEW Smart” from the Internet site.
The application “KEW Smart” is available on the download site for free. (Internet access is required and
charges may be incurred.)
®
* “Bluetooth ” is a registered trademark of Bluetooth SIG.
8.3 Signal control
Connection to input/ output terminals
CAUTION
● Voltages applied to the terminals should not exceed the following ranges.
* for input terminals: within ± 11V, for output terminals: between 0 and 30V(50mA, 200mW)
Otherwise, the instrument may be damaged.
● The root of each L-terminal is the same. Do not connect different ground levels of multiple inputs at the
same time. Roots of the L terminals for each Ch are integrated. Never connect inputs with various
ground levels to the terminal at the same time.
Output terminal
Input terminal
Ensure that the wires are connected to proper terminals.
Wires of following dimensions can be used.
Suitable wire
2
: single-wire Φ1.2 (AWG16), twisted wire 1.25mm (AWG16),
strand size Φ0.18mm or more
Usable wire
2
: single-wire Φ0.4 - 1.2 (AWG26 - 16), twisted wire 0.2 - 1.25mm (AWG24 - 16),
strand size Φ 0.18mm or more
Standard length of bare wire: 11mm
KEW6315
126
Connection to input/ output terminals
KEW6315
1
Open the Connector cover.
2
Press the rectangular protrusion above a terminal with a flat-blade screw driver, and insert
a signal wire.
3
Remove the driver and fix the wire.
Flat-blade screwdriver
Signal wire
”Input terminal”
For monitoring the voltage output signals of Thermo sensors. These terminals are useful to measure the
signals from other devices and power failures at the same time.
Number of Ch: 2ch
Input resistance : approx 225.6kΩ
”Output terminal”
For fixing the generating outputs to “Low” while power quality events are lasting. Usually, it is fixed to “High”,
but changed to “Low” if the duration of an event is less than 1 sec. This is applicable to the events with the
highest-priority only. To adjust the generating outputs to the events with low-priority, select “OFF” for the
events with higher priority than the desired event. The details are described in “Threshold setting for Power
quality (Event)” (P. 65). * [Priority order]: Transient -> INT -> Dip -> Swell -> Inrush current
+5V
Output format : Open collector output
Max input : 30V, 50mA, 200mW
Output voltage : Hi – 4 to 5V
Lo – 0 to 1V
H
OUTPUT
L
127
KEW6315
KEW6315
8.4
8.4 Getting power from measured lines
Getting power from measured lines
If it is difficult to get power from an outlet, KEW6315 operates with power from the measured line by using
Power supply adapter MODEL8312 and voltage test leads.
DANGER
● When the instrument and the test lead are combined and used together, whichever lower category
either of them belongs to will be applied. Confirm that the measured voltage rating of the test lead is
not exceeded.
● Do not connect a Voltage test lead unless required for measuring the desired parameters.
● Connect Voltage test leads to the instrument first, and only then connect them to the measured line.
● Never disconnect the voltage test leads from the connectors of the instrument during a
measurement (while the instrument is energized).
● Connect to the downstream side of a circuit breaker since a current capacity at the upstream
side is large.
WARNING
● Power off the instrument before connecting the adapter and test leads.
● Connect Voltage test lead to the instrument first. It should be firmly connected.
● Never attempt to make measurement if any abnormal conditions are noted, such as a broken cover
and exposed metal parts.
Connect the Adapter according to the following procedure.
240V or more
1
Confirm that the Power switch on MODEL8312 is “OFF”.
2
Connect the Plug of MODEL8312 to VN and V1 terminals on
5
KEW6315.
3
Connect the Power Plug of MODEL8312 to the Power connector
On KEW6315.
4
5
Connect the Voltage test leads to VN and V1 terminals of the Adapter.
Connect the Alligator clips of the voltage test leads to the circuit
under test.
6
Power on MODEL8312.
7
Start KEW6315.
4
* Reversed procedure is applied to remove the Adapter from KEW6315.
1/6
Please refer to the instruction manual for MODEL8312 for further details.
2
MODEL8312
3
Measurement CAT.III 150V CAT.II 240V
Fuse rating : AC500mA/ 600V,
Fast acting, Φ6.3 x 32mm
7
KEW6315
- 128 -
Chap. 9 PC software for setting and data analysis
KEW6315
Chap. 9 PC software for setting and data analysis
The special software “KEW Windows for KEW6315” for data analysis and for making KEW6315 settings
is available. * Automatic creation of graph and list from recorded data. Uniform management of setting and
recorded data acquired from multiple devices. Data can be expressed in crude oil and CO2 equivalent
values in the report.
Please refer to the installation manual for “KEW Windows for KEW6315” and install the application and
USB driver in your PC.
● Interface
®
This instrument is equipped with USB and Bluetooth interfaces.
Communication method : USB Ver2.0
®
®
Bluetooth : Bluetooth Ver2.1+EDR (Class2)
Compliant profile: SPP
®
The following can be done by USB/ Bluetooth communication.
* Downloading files in the internal memory of the instrument to a PC
* Making settings for the instrument via a PC
* Displaying the measured results on a PC as graphs in real-time and also
saving the measured data at the same time
● System Requirements
* OS (Operation System)
®
Windows 8/ 7/ Vista/ XP
* Display
1024 × 768 dots, 65536 colors or more
* HDD (Hard-disk space required)
1Gbyte or more (including Framework)
*.NET Framework (3.5 or more)
●Trademark
®
* Windows is a registered trademark of Microsoft in the United States.
®
* Bluetooth is a registered trademark of Bluetooth SIG.
The latest software is available for download from our homepage.
http://www.kew-ltd.co.jp
- 129 -
KEW6315
KEW6315
10.1 Safety requirements
Chap. 10 Specification
10.1 Safety requirements
Location for use
: In door use, Altitude up to 2000m
Temperature & humidity range : 23ºC±5ºC, Relative humidity 85% or less (no condensation)
(guaranteed accuracy)
Operating Temperature &
: 0ºC to 45ºC, Relative humidity 85% or less (no condensation)
humidity range
Storage Temperature &
: -20ºC to 60ºC, Relative humidity 85% or less (no condensation)
humidity range
Withstand voltage
AC5160V/ for 5 sec.
Between (AC Voltage input terminal) and (Enclosure)
AC3310V/ for 5 sec.
Between (AC Voltage input terminal) and (Current input terminal, Power connector,
USB connector)
AC2210V/ for 5 sec.
Between (Power connector) and (Current input terminal, USB connector,
Enclosure)
Insulation resistance
: 50MΩ or more / 1000V; Between (Voltage/Current input terminal,
Power connector) and (Enclosure)
Applicable standards
: IEC 61010-1 Measurement CAT.IV 300V CAT.III 600V CAT.II 1000V
Pollution degree 2, IEC 61010-031, IEC61326 Class A
Dust-/ water-proof
: IEC 60529 IP40
10.2 General specification
Measured line and Input ch
: Current ch (A2-A4) unrelated to the selected wiring system can be
used for any measurement purpose.
Input ch
Wiring system
Voltage
Current
Single-phase2-wire-1-system (1P2W-1)
VN-V1
A1
Single-phase2-wire-2-system (1P2W-2)
VN-V1
A1,A2
Single-phase2-wire-3-system (1P2W-3)
VN-V1
A1,A2,A3
Single-phase2-wire-4-system (1P2W-4)
VN-V1
A1,A2,A3,A4
Single-phase3-wire-1-system (1P3W-1)
VN-V1,V2
A1,A2
Single-phase3-wire-2-system (1P3W-2)
VN-V1,V2
A1,A2,A3,A4
Three-phase3-wire-1-system (3P3W-1)
VN-V1,V2
A1,A2
Three-phase3-wire-2-system (3P3W-2)
VN-V1,V2
Three-phase3-wire(3P3W3A)
V1-V2,V2-V3,V3-V1
A1,A2,A3
VN-V1,V2,V3
A1,A2,A3
Three-phase4-wire(3P4W)
LCD
Display update
A1,A2,A3,A4
: 3.5inch, TFT, QVGA(320×RGB×240)
: every 1 sec*
* There may be time lag in display update (max. 2 sec) due to arithmetic processing,
however, no time lag between the recorded data and the time stamp.
KEW6315
- 130 -
10.2 General specification
Backlight (Press the LCD Key to turn off, press any key other than “Power” to turn on.)
PQ measurement
: IEC 61000-4-30 Ed.2 Class S
Dimension
: 175(L)×120(W)×68(D)mm
Weight
: approx. 900g (including batteries)
Accessories
: V test leads MODEL7255 (red, white, blue, black) with alligator clip 1 set
Power cord MODEL7169 1 pce
USB cable MODEL7219 1 pce
Quick manual 1 pce
CD-ROM 1 pce
PC software for setting and data and data analysis
(KEW Windows for KEW6315)
Instruction manual data (PDF file)
Alkaline size AA battery (LR6) 6 pcs
SD card M-8326-02 1 pce
Carrying case MODEL9125 1 pce
Input terminal plate 1 pce
Cable marker 8-color x 4pcs each (red, blue, yellow,
green, brown, gray, black, white)
Optional parts
: Clamp sensor
MODEL8128 (Clamp sensor 50A
ø24mm)
MODEL8127 (Clamp sensor 100A
ø24mm)
MODEL8126 (Clamp sensor 200A
ø40mm)
MODEL8125 (Clamp sensor 500A
ø40mm)
MODEL8124 (Clamp sensor 1000A
ø68mm)
MODEL8129 (Flexible sensor 3000A
ø150mm)
MODEL8130 (Flexible sensor 1000A
ø110mm)
MODEL8146 (Leakage sensor 10A
ø24mm)
MODEL8147 (Leakage sensor 10A
ø40mm)
MODEL8148 (Leakage sensor 10A
ø68mm)
MODEL8141 (Leakage sensor 1A
ø24mm)
MODEL8142 (Leakage sensor 1A
ø40mm)
MODEL8143 (Leakage sensor 1A
ø68mm)
Instruction manual for Clamp sensor
Carrying case with magnet MODEL9132
Power supply adapter MODEL8312 (CAT.III 150V, CAT.II 240V)
Accuracy
:within ±5 sec/ day
Power source
: AC power supply
Voltage range
AC100V(AC90V) - AC240V(AC264V)
Frequency
50Hz(47Hz) - 60Hz(63Hz)
Power consumption
7VAmax
KEW6315
: DC power supply
Dry-cell battery
Rechargeable battery
Voltage
DC3.0V
(1.5V×2 in series × 3 in parallel)
DC2.4V
(1.2V×2 in series × 3 in parallel)
Battery
Size AA Alkaline (LR6)
Size AA Ni-MH (1900mA/h)
Current consumption
1.0A typ.(@3.0V)
1.1A typ.(@2.4V)
Battery life *ref. value at 23ºC
3 hours: Backlight OFF
4.5 hours: Backlight OFF
* with fully charged batteries
- 131 -
KEW6315
KEW6315
Real-time OS
10.2 General specification
:
This Product uses the Source Code of T-Kernel under T-License granted by the T-Engine Forum
(www.t-engine.org) Portions of this software are copyright (c) 2010 The FreeType Project (www.freetype.org).
All rights reserved.
External communication function
: USB * USB cable length: 2m max.
Connector
mini-B
Communication method
USB Ver2.0
USB identification no.
Vendor ID: 12EC(Hex)
Product ID: 6315(Hex)
Serial no.: 0+7 digit individual no.
Communication speed
12Mbps (full-speed)
®
: Bluetooth
®
Communication method
Bluetooth Ver2.1+EDR Class2
Profile
SPP
Frequency
2402 - 2480MHz
Modulation method
GFSK(1Mbps), π/4-DQPSK(2Mbps), 8DPSK(3Mbps)
Transmission system
Frequency-hopping system
Digital output terminal :
Normally, it is set to “High”. It changes to “Low” while the measured values are exceeding the thresholds
set for each power quality event. Usually, it is fixed to “High”, but changed to “Low” if the duration of an
event is less than 1 sec. This is applicable to the events with the highest-priority only. To adjust the
generating outputs to the events with low-priority, select “OFF” for the events with higher priority than the
desired event.
* [Priority order]: Transient -> INT -> Dip -> Swell -> Inrush current
Connector
Terminal block with 6-polarity (black, red, gray ML800-S1H-6P)
Output format
Open collector output, Low active
Input voltage
0 - 30V, 50mAmax, 200mW
Output voltage
High:4.0V-5.0V,
KEW6315
- 132 -
Low:0.0 - 1.0V
10.2 General specification
KEW6315
Data storage location
: Internal FLASH memory
Storage capacity
4MB (Data storage capacity: 3,437,500byte)
Max data size
14,623byte/data (max: 234 data) * 3P3W-2/1P3W-2 (Power + Harmonics)
Max number of saved file
Icon display
3 * Number of times that you can start a measurement.
When the internal memory is available, the “
” icon is displayed on the
LCD during record.
FULL indication
The “
” icon blinks when saved data size or number of saved file exceeds
the capacity. Data cannot be saved while this mark is being displayed.
The instrument measures integration/ demand continuously, but does not
record the data.
: SD card
Storage capacity
2GB (Data storage capacity: 1.86Gbyte)
Max data size (2GB)
14,623byte/data (Max:1,271,964 data) *3P3W-2/1P3W-2(Power+ Harmonics)
Max number of saved file
(2GB)
Icon display
65536 * Number of times that you can start a measurement.
When the SD card is available, the “
Format (2GB)
FULL indication
” icon is displayed on the LCD.
FAT16
The “
” icon blinks when saved data size or number of saved file exceeds
the capacity. Data cannot be saved while this mark is being displayed.
The instrument measures integration/ demand continuously, but does not
record the data.
10.3 Measurement specification
Measured items and the number of analysis points
Computed with 8192-point data while regarding 200ms(50Hz:10-cycle, 60Hz:12-cycle) as one
measurement area.
Frequency, r.m.s. voltage/ current, active power, apparent power, reactive power, PF, Capacitance calc.
Computed with 2048-point data while regarding 200ms(50Hz:10-cycle, 60Hz:12-cycle) as one
measurement area.
Voltage/current unbalance ratio, r.m.s. harmonics voltage/current (rate of content), harmonics reactive
power, total harmonics voltage/ current distortion factor (THDV-F/R)/ (THDA-F/R), phase angle of
harmonics voltage/ current, phase difference of harmonics voltage/ current
Computed with 819-point data (50Hz), 682-point data (60Hz) while regarding one waveform overlapped
every half wave as one measurement area.
Voltage dip, voltage swell, INT, Inrush current
Described based on inst values measured at 40.96ksps.
Voltage/ current waveform, External input voltage
- 133 -
KEW6315
KEW6315
Items measured at Instantaneous measurement
Items measured at Instantaneous measurement
Frequency f [Hz]
Displayed digit
4-digit
Accuracy
±2dgt (40.00Hz - 70.00Hz, V1 Range 10% - 110%, sine wave)
Display range
10.00 - 99.99Hz
Input source
V1 (fix)
10-sec average frequency f10 [Hz]
Displayed digit
Meas. system
Accuracy
Display range
Input source
4-digit * e.g. averaged frequency values at 10 sec of intervals
Complied with IEC61000-4-30
±2dgt (40.00Hz - 70.00Hz, V1 Range 10% - 110%, sine wave)
10.00 - 99.99Hz
V1 (fix)
R.M.S. Voltage V [Vrms]
Range
600.0/1000V
Displayed digit
Effective input
range
Display range
4-digit
Crest factor
Meas. system
Accuracy
3 or less
Complied with IEC61000-4-30
Assuming that measuring 40-70Hz, sine wave at 600V Range:
10% - 150% against 100V or more of nominal V :Nominal V±0.5%
Out of above range and at 1000V Range
:±0.2%rdg±0.2%f.s.
approx 1.67MΩ
Input impedance
1% - 120% of Range (rms) and 200% of Range (peak)
0.15% - 130% of Range (“0” is displayed at less than 0.15%)
Equation
i : sampling point*
n: number of sampled values at 10 or
Vc =
12-cycle
c : Measurement channel
* 50Hz: 8192 points in 10 waveforms, 60Hz: 8192 points in 12 waveforms
1P2W-1 to 4
V1
1P3W-1 to 2
V1, V2
3P3W-1 to 2
Line voltage: V12 、V23 、V31 = √(V23^2 + V12^2+2×V23×V12×cosθV)
※
θV=relative angles of V12 , V23
3P3W3A
Line voltage:V12, V23, V31
3P4W
Phase voltage: V1, V2, V3
1 n −1
∑ (V ci )2
n i =0
Line voltage :
V12 = √( V1^2 + V2^2-2×V1×V2×cosθV1 )
V23 = √( V2^2 + V3^2-2×V2×V3×cosθV2 )
V31 = √( V3^2 + V1^2-2×V3×V1×cosθV3 )
*
θV1 = relative angles of V1 ,V2, θV2 = relative angles of V2 ,V3,
θV1 = relative angles of V3 ,V1
KEW6315
- 134 -
Items measured at Instantaneous measurement
KEW6315
R.M.S. Current A [Arms]
Range
Displayed digit
Effective input
range
Display area
Crest factor
Meas. system
Accuracy
Input impedance
Equation
MODEL8128
(50A)
:5000m/50.00A/AUTO
MODEL8127
(100A)
:10.00/100.0A/AUTO
MODEL8126
(200A)
:20.00/200.0A/AUTO
MODEL8125
(500A)
:50.00/500.0A/AUTO
MODEL8124/30
(1000A)
:100.0/1000A/AUTO
MODEL8141/8142/8143 (1A)
:500.0mA
MODEL8146/8147/8148 (10A)
:1000m/10.00A/AUTO
MODEL8129
(3000A)
:300.0/1000/3000A
4-digit
1% - 110% of each Range (rms) and 200% of Range (peak)
0.15% - 130% of each range (“0” is displayed at less than 0.15%)
3 or less
Complied with IEC61000-4-30
Assuming that measuring 40-70Hz, sine wave:
±0.2%rdg±0.2%f.s.+ accuracy of clamp sensor
approx 100kΩ
c : Measurement channel A1, A2, A3, A4
i :sampling point*
n: number of sampled values at 10 or
12-cycle
* 50Hz: 8192 points in 10 waveforms, 60Hz: 8192 points in 12 waveforms
* A3 value for 3P3W-1 to 2 is calculated with r.m.s. current values.
1 n −1
2
Ac = ∑ ( Aci )
n i =0
A3 = √(A1^2 + A2^2+2×A1×A2×cosθA)
- 135 -
relative angles of θA = A1 , A2
KEW6315
KEW6315
Items measured at Instantaneous measurement
Active power P [W]
Range
Current
8128
Voltage
8127
8126
50.00A
5000mA
100.0A
10.00A
200.0A
20.00A
1000V
50.00k
5000
100.0k
10.00k
200.0k
20.00k
600.0V
30.00k
3000
60.00k
6000
120.0k
12.00k
Current
8125
Voltage
8124/30
8146/47/48
500.0A
50.00A
1000A
100.0A
10.00A
1000mA
1000V
500.0k
50.00k
1000k
100.0k
10.00k
1000
600.0V
300.0k
30.00k
600.0k
60.00k
6000
600.0
Current
8141/42/43
Voltage
8129
500.0mA
3000A
1000A
300.0A
1000V
500.0
3000k
1000k
300.0k
600.0V
300.0
1800k
600.0k
180.0k
Displayed digit
4-digit
Accuracy
±0.3%rdg±0.2%f.s.+ accuracy of clamp sensor (PF 1, sine wave, 40-70Hz)
※
Sum values are total amounts of the used channels.
Influence of PF
±1.0%rdg (40Hz-70Hz, PF0.5)
Polarity
Formula
Consumption (flow-in):+( no sign), Regenerating( flow-out):-
1 n−1
Pc = ∑ (Vci × Aci )
n i=0
c: Measurement channel
i: sampling point*
n: number of sampled values
* 50Hz: 8192 points in 10 waveforms, 60Hz: 8192 points in 12 waveforms
1P2W-1 to 4
P1, P2, P3, P4, Psum=P1+P2+P3+P4
1P3W(3P3W)-1
to 2
P1, P2, Psum1=P1+P2
P3, P4, Psum2=P3+P4
Psum=Psum1+Psum2
3P3W3A
P1, P2, P3, Psum=P1+P2+P3 * Phase voltages are used.
3P4W
P1, P2, P3, Psum=P1+P2+P3
External input voltage DCi [V]
Range
100.0mV/ 1000mV/ 10.00V
Displayed digit
Effective input
4-digit
1% - ±100% (DC) of each Range
range
Display range
0.3% - ±110% of each Range (“0” is displayed at less than 0.3%)
Accuracy
±0.5%f.s (DC)
Input impedance
Approx. 225.6kΩ
Saved item
External input voltage
KEW6315
- 136 -
Items to be calculated
KEW6315
Items to be calculated
Apparent power S [VA]
Range
Same as active power.
Displayed digit
Same as active power.
Accuracy
±1dgt against each calculated value (for sum : ±3dgt)
Sign
No polarity indication
Equation
Sc=Vc×Ac; when Pc>Sc, regarding Pc=Sc. c: Measurement channel
1P2W-1 to 4
S1, S2, S3, S4, Ssum=S1+S2+S3+S4
1P3W-1 to 2
S1, S2, Ssum1=S1+S2
S3, S4, Ssum2=S3+S4
Ssum=Ssum1+Ssum2
3P3W-2
S1, S2, Ssum1=√3/2( S1+S2 )
S3, S4, Ssum2=√3/2( S3+S4 )
Ssum=Ssum1+Ssum2
3P3W3A
S1, S2, S3, Ssum=S1+S2+S3 * Phase angles are used.
3P4W
S1, S2, S3, Ssum=S1+S2+S3
Reactive power Q [Var]
Range
Displayed digit
Accuracy
Sign
Equation
Same as active power.
Same as active power.
±1dgt against each calculated value (for sum : ±3dgt)
-
: leading phase (current phase against voltage)
+ (no sign)
: lagging phase (current phase against voltage)
Harmonics reactive power is calculated per ch, and the polarity sign of the
reversed basic waveform is displayed.
Qc= sign
Sc 2 − Pc 2
sign: Polarity sign , c: Measurement channel
1P2W-1 to 4
Q1, Q2, Q3, Q4, Qsum=Q1+Q2+Q3+Q4
1P3W(3P3W)-1
to 2
Q1, Q2, Qsum1=Q1+Q2
Q3, Q4, Qsum2=Q3+Q4
Qsum=Qsum1+Qsum2
3P3W3A(3P4W)
Q1, Q2, Q3, Qsum=Q1+Q2+Q3
- 137 -
KEW6315
KEW6315
Items to be calculated
Power factor: PF
Display range
-1.000 to 0.000 to 1.000
Accuracy
±1dgt against each calculated value (for sum : ±3dgt)
-
: leading phase
+ (no sign)
: lagging phase
Harmonics reactive power is calculated per ch, and the polarity sign of the
Sign
reversed basic waveform is displayed.
Equation
PF c = sign Pc
Sc
1P2W-1 to 4
PF1, PF2, PF3, PF4, PFsum
1P3W(3P3W)-1
PF1, PF2, PFsum1
to 2
PF3, PF4, PFsum2
sign: Polarity mark, c: Measurement channel
PFsum
3P3W3A(3P4W)
PF1, PF2, PF3, PFsum
Neutral current An [A] * only when the wiring configuration is 3P4W.
Range
Same as r.m.s. current.
Displayed digit
Same as r.m.s. current.
Display area
Same as r.m.s. current.
Equation
An=
{A1 + A2 cos(θ 2 − θ 1) + A3 cos(θ 3 − θ 1)}2 + {A2 sin (θ 2 − θ 1) + A3 sin(θ 3 − θ 1)}2
* θ1,2,3 represent the phase differences between V1 and A1,2 and 3 respectively.
Voltage unbalance ratio Uunb [%]
Displayed digit
5-digit
Display range
0.00% to 100.00%
Wiring
3P3W, 3P4W
Meas. system
Complied with IEC61000-4-30
Accuracy
±0.3%: at 50/60Hz, sine wave
(between 0 to 5 % according to IEC61000-4-30)
Equation
1−
Vumb =
1+
(3 − 6β )
× 100
(3 − 6β )
β=
V124 + V234 + V314
(V
2
12
+ V232 + V312
)
2
* The 1st order components of harmonic voltage are used.
* For 3P4W system, phase voltages are converted to line voltages for
calculation.
V12 = V1- V2, V23 = V2- - V3, V31 = V3 - V1
KEW6315
- 138 -
Items to be calculated
KEW6315
Current unbalance ratio Aunb [%]
Displayed digit
5-digit
Display range
0.00% to100.00%
Wiring
Equation
3P3W, 3P4W
1−
Iumb =
1+
(3 − 6β )
×100
(3 − 6β )
β=
A124 + A234 + A314
(A
2
12
2
+ A23
+ A312
)
2
* The 1st order components of harmonic current are used.
* For 3P4W system, phase voltages are converted to line voltages for
calculation.
A12 = A1 - A2, A23 = A2 - A3, A31 = A3 - A1
Capacitance calculation
Displayed digit
4-digit, Unit: nF, µF, mF, kvar
Display range
Equation
0.000nF - 9999F, 0.000kvar - 9999kvar
1
C C = PC ×
−1 −
PF 2
C
=
PC × 10 9
2πf × VC
Cc
2
1
PFC _ T arg et
1
×
−1 −
PF 2
C
2
− 1 [k var ]
1
PFC _ T arg et
2
− 1 [µF ]
: Capacitance needs for improvement
Pc : Load power (active power)〔kW〕
f : Frequency
Vc : R.m.s. voltage
PFc : Measured PF
PFc_Target : New power factor (target)
c : Measurement channel
1P2W-1 to 4
C1, C2, C3, C4, Csum=C1+C2+C3+C4
1P3W(3P3W)-1
to 2
C1, C2, Csum1=C1+C2
C1, C2, Csum2=C3+C4
Csum=Csum1+ Csum2
3P3W3A(3P4W)
C1, C2, C3, Csum=C1+C2+C3
- 139 -
KEW6315
KEW6315
Items measured at Integration measurement
Items measured at Integration measurement
Power consumption (if P>0)
Active power energy +WP [Wh]
Displayed digit
Display area
+ WS )
0.00000mWh - 9999.99TWh (harmonized with + WS )
6-digit, Unit: m, k, M, G, T (harmonized with
* “OL” is displayed when the display area is exceeded.
Equation
+ WPc =
1
∑ (+ Pci )
h i
h: integration period (3600 sec), c: Measurment channel,
1P2W-1 to 4
+WP1 , +WP2 , +WP3 , +WP4 , +WPsum
1P3W(3P3W)-1
+WP1 , +WP2 , +WPsum1
to 2
+WP3 , +WP4 , +WPsum2
i: Data point no.
+WPsum
3P3W3A(3P4W)
+WP1 , +WP2 , +WP3 , +WPsum
Apparent power energy +WS [VAh]
Displayed digit
Display area
+ WS )
0.00000mVAh - 9999.99TVAh (harmonized with + WS )
6-digit, Unit: m, k, M, G, T (harmonized with
* “OL” is displayed when the display area is exceeded.
Equation
+ WSc =
1
∑ (Sci )
h i
h: integration period (3600 sec), c: Measurment channel,
1P2W-1 to 4
+WS1 , +WS2 , +WS3 , +WS4 , +WSsum
1P3W(3P3W)-1 to
+WS1 , +WS2 , +WSsum1
2
+WS3 , +WS4 , +WSsum2
+WSsum
3P3W3A(3P4W)
+WS1 , +WS2 , +WS3 , +WSsum
Saved item
Apparent power energy
KEW6315
- 140 -
i: Data point no.
Items measured at Integration measurement
KEW6315
Reactive power energy +WQ [Varh]
Displayed digit
Display area
+ WS )
0.00000mvarh - 9999.99Tvarh (harmonized with + WS )
6-digit, Unit: m, k, M, G, T (harmonized with
* “OL” is displayed when the display area is exceeded.
Equation
Leading
phase
1
+ WQc _ c = ∑ (+ Qci ) 、
h i
Lagging
phase
+ WQi _ c =
1
∑ (− Qci ) 、
h i
h: integration period (3600 sec), n: System No., c: Measurement channel,
i: Data point no. * where: Lagging phase: Q >0, Leading phase: Q < 0
1P2W-1 to 4
+WQ1 , +WQ2 , +WQ3 , +WQ4 , +WQsum
1P3W(3P3W)-1
+WQ1 , +WQ2 , +WQsum1
to 2
+WQ3 , +WQ4 , +WQsum2
+WQsum
3P3W3A(3P4W)
+WQ1 , +WQ2 , +WQ3 , +WQsum
Regenerating power (where: P<0)
Active power energy - WP[Wh]
Displayed digit
Display area
+ WS )
0.00000mWh - 9999.99TWh (harmonized with + WS )
6-digit, Unit: m, k, M, G, T (harmonized with
* “OL” is displayed when the display area is exceeded.
Equation
− WPc =
1
∑ (− Pci )
h i
h: integration period (3600 sec), c: Measurment channel,
1P2W-1 to 4
1P3W(3P3W)-1
to 2
3P3W3A(3P4W)
i: Data point no.
-WP1 , -WP2 , -WP3 , -WP4 , -WPsum
-WP1 , -WP2 , -WPsum1
-WP3 , -WP4 , -WPsum2
-WPsum
-WP1 , -WP2 , -WP3 , -WPsum
- 141 -
KEW6315
KEW6315
Items measured at Integration measurement
Apparent power energy -WS[VAh]
Displayed digit
Display area
+ WS )
0.00000mVAh - 9999.99TVAh (harmonized with + WS )
6-digit, Unit: m, k, M, G, T (harmonized with
* “OL” is displayed when the display area is exceeded.
Equation
− WSc =
1
∑ (Sci )
h i
h: integration period (3600 sec), c: Measurment channel,
1P2W-1 to 4
-WS1 , -WS2 , -WS3 , -WS4 , -WSsum
1P3W(3P3W)-1
-WS1 , -WS2 , -WSsum1
to 2
-WS3 , -WS4 , -WSsum2
i: Data point no.
-WSsum
3P3W3A(3P4W)
-WS1 , -WS2 , -WS3 , -WSsum
Reactive power energy -WQ [Varh]
Displayed digit
Display area
+ WS )
0.00000mvarh - 9999.99Tvarh (harmonized with + WS )
6-digit, Unit: m, k, M, G, T (harmonized with
* “OL” is displayed when the display area is exceeded.
Equation
Leading
phase
Lagging
phase
1
− WQc _ c = ∑ (+ Qci ) 、
h i
− WQi _ c =
1
∑ (− Qci )
h i
h: integration period (3600 sec), n: System No., c: Measurement channel,
i: Data point no. * where: Lagging phase: Q >0, Leading phase: Q < 0
1P2W-1 to 4
-WQ1 , -WQ2 , -WQ3 , -WQ4 , -WQsum
1P3W(3P3W)-1
-WQ1 , -WQ2 , -WQsum1
to 2
-WQ3 , -WQ4 , -WQsum2
-WQsum
3P3W3A(3P4W)
-WQ1 , -WQ2 , -WQ3 , -WQsum
Duration of integration
Display area
KEW6315
00:00:00 (0 sec) -
99:59:59 (99 h 59 min 59 sec) ,
0100:00
-
9999:59 (9999 h 59 min) ,
010000
-
999999 (999999 h) * Displayed time will transit in series.
- 142 -
Items measured at Demand measurement
KEW6315
Items measured at Demand measurement
Target value (DEMTarget)
Displayed digit
4-digit
Unit
m, k, M, G, T
Display range
0.000mW(VA) - 999.9TW(VA) *according to the selected values
Predicted value (DEMGuess)
Displayed digit
6-digit
Unit
m, k, M, G, T (depending on DEMTarget value)
Display range
0.00000mW(VA) - 99999.9TW(VA)
* Decimal point is dependent on the DEMTarget.
* “OL” is displayed when the display area is exceeded.
Equation
DEM Guess = ΣDEM ×
Demand
Elapsed
interval
time
Present value, Measured demand value (ΣDEM)
Displayed digit
6-digit , Unit: m, k, M, G, T (depending on DEMTarget value)
Unit
m, k, M, G, T (depending on DEMTarget value)
Display range
0.00000mW(VA) - 99999.9TW(VA)
* Decimal point is dependent on the DEMTarget.
* “OL” is displayed when the display area is exceeded.
Equation
ΣDEM=
(Integration values of "+WPsum (+WSsum)")
×
1 hour
Interval
Load factor
Displayed digit
6-digit
Display range
0.00 - 9999.99% * “OL” is displayed when the display area is exceeded.
Equation
ΣDEM
DEM Terget
Estimation
Displayed digit
6-digit
Display range
0.00 - 9999.99% * “OL” is displayed when the display area is exceeded.
Equation
DEM Guess
DEM Terget
- 143 -
KEW6315
KEW6315
Items measured at Harmonics measurement
Items measured at Harmonics measurement
Meas. system
: Digital PLL synchronization
Meas. method
: Analyze harmonics, and then add and display the inter-harmonics
components adjacent to the integral order of the analyzed harmonics
Effective frequency range
: 40 - 70Hz
Order analysis
: 1 - 50th
Window width
: 10-cycle at 50Hz, 12-cycle at 60Hz
Window type
: Rectangular
Data analysis
: 2048 points
Analyzing rate
: once/ 200ms at 50Hz/60Hz
R. m.s. harmonics voltage Vk [Vrms]
Range
Same as r.m.s. voltage
Displayed digit
Same as r.m.s. voltage
Display range
Same as r.m.s. voltage
* rate of content 0.0% - 100.0%, percentage against the basic wave
Measurement
Complied with IEC61000-4-30, IEC61000-4-7, IEC61000-2-4
system
Analysis window width is 10/12-cycle for 50/60Hz, and the measured values
Accuracy
Complied with IEC61000-2-4 Class3 where 10% - 100% of input range for
contain the inter-harmonics components adjacent to the analyzed order.
600V Range.
3% or more against 100V of nominal voltage
: ±10%rdg
Less than 3% against 100V of nominal voltage
: nominal voltage ±0.3%
1000V Range
: ±0.2%rdg±0.2%f.s.
Equation
V ck =
1
∑ (V c (10 k + n )r ) + (V c (10 k + n )i )
2
n =−1
2
Rate of
content
=
V ck × 100
V c1
c: Measurement channel, k: Harmonics of each order
Vr: Real number after Voltage FFT conversion
Vi: Imaginary number after Voltage FFT conversion
Measurement cycle in this equation is 10-cycle. For 12-cycle measurement,
"10k+n" should be replaced with "12k+n”.
1P2W-1 to 4
V1k
1P3W-1 to 2
V1k, V2k
3P3W-1 to 2
Line voltage V12k, V32k
3P3W3A
Line voltage V12k, V23k, V31k
3P4W
V1k, V2k, V3k
KEW6315
- 144 -
Items measured at Harmonics measurement
KEW6315
R.m.s. harmonics current Ak [Arms]
Range
Same as r.m.s. current
Displayed digit
Same as r.m.s. current
Same as r.m.s. current
* Rate of content: 0.0% - 100.0% (percentages to the basic wave)
Complied with IEC61000-4-7, IEC61000-2-4
Analysis window width: 10/12 cycle for 50/60Hz, Measured values contain the
inter-harmonics adjacent to the analyzed orders’ harmonics
Meets the accuracy specified in IEC61000-2-4 Class3 at 10% - 100% of
the input range of the measurement range.
10% or more to max. input range
: ±10%rdg + Accuracy of Clamp sensor
Less than 10% to max. input range
: max value of the range±1.0% +
Accuracy of Clamp sensor
Display range
Meas. system
Accuracy
Equation
A ck =
1
∑ ( A c (10 k + n )r ) + ( A c (10 k + n )i )
2
2
n = −1
Rate of
content
=
A ck × 100
A c1
c: Measurement channel: A1k, A2k, A3k, A4k, k: Harmonics of each order
r: Real number after FFT conversion, i: Imaginary number after FFT conversion
Measurement cycle in this equation is 10-cycle. For 12-cycle measurement,
"10k+n" should be replaced with "12k+n”.
Harmonics power Pk [W]
Range
Same as active power
Displayed digit
Same as active power
Same as active power * rate of content 0.0% - 100.0%, percentage against the
absolute value of basic wave
Display range
Meas. system
Accuracy
Equation
Complied with IEC61000-4-7
±0.3%rdg±0.2%f.s.+ accuracy of clamp sensor (PF 1, sine wave: 50/60Hz)
(Sum represents the total values obtained through the used channels.)
Pck=Vc(10k)r×Ac(10k)r-Vc(10k)i×Ac(10k)I
Rate of
content
=
P ck × 100
P c1
c: Measurement channel, k: Harmonics of each order
r: Real number after FFT conversion, i: Imaginary number after FFT conversion
Measurement cycle in this equation is 10-cycle. For 12-cycle measurement,
"10k" should be replaced with "12k”.
1P2W-1 to 4
P1k, P2k, P3k, P4k, Psumk=P1k+P2k+P3k+P4k
1P3W-1 to 2
P1k, P2k, Psum1k=P1k+P2k
P3k, P4k, Psum2k=P3k+P4k
Psumk=Psum1k+Psum2k
3P3W-1 to 2
P1k, P2k, Psum1k=P1k+P2k
P3k, P4k, Psum2k=P3k+P4k
Psumk=Psum1k+Psum2k
3P3W3A
Phase voltage
P1k:V1 = ( V12-V31 )/3, P2k:V2 = ( V23-V12 )/3,
P3k:V3 = ( V31-V23 )/3, Psumk=P1k+P2k+P3k
3P4W
P1k, P2k, P3k, Psumk=P1k+P2k+P3k
- 145 -
KEW6315
KEW6315
Items measured at Harmonics measurement
Harmonics reactive power Qk [var] (used for internal calculation only)
Equation
Pck=Vc(10k)r×Ac(10k)i-Vc(10k)i×Ac(10k)r
c: Measurement channel: A1k, A2k, A3k, A4k, k: Harmonics of each order
r: Real number after FFT conversion, i: Imaginary number after FFT conversion
Measurement cycle in this equation is 10-cycle. For 12-cycle measurement,
"10k" should be replaced with "12k”.
1P2W-1 to 4
Q1kQ2k, Q3k, Q4k, Qsumk=Q1k+Q2k+Q3k+Q4k
1P3W-1 to 2
Q1k, Q2k, Qsum1k=Q1k+Q2k
Q3k, Q4k, Qsum2k=Q3k+Q4k
Qsumk=Qsum1k+Qsum2k
3P3W-1 to 2
Q1k, Q2k, Qsum1k=Q1k+Q2k
Q3k, Q4k, Qsum2k=Q3k+Q4k
Qsumk=Qsum1k+Qsum2k
3P3W3A
Phase voltage
Q1k:V1 = ( V12-V31 )/3, Q2k:V2 = ( V23-V12 )/3,
Q3k:V3 = ( V31-V23 )/3, Qsumk=Q1k+Q2k+Q3k
3P4W
Q1k, Q2k, Q3k, Qsumk=Q1k+Q2k+Q3k
Harmonics voltage total distortion factor THDVF [%]
Displayed digit
4-digit
Display range
Equation
0.0% - 100.0%
50
THDVF
c
=
∑ (V ck )
2
× 100
k =2
c: Meas. channel
V: Harmonics voltage
k: Harmonics of each order
V c1
1P2W-1 to 4
THDVF1
1P3W-1 to 2
THDVF1 , THDVF2
3P3W-1 to 2
Line voltage THDVF12 , THDVF32
3P3W3A
Line voltage THDVF12 , THDVF23 , THDVF31
3P4W
THDVF1 , THDVF2 , THDVF3
Harmonics current total distortion factor THDAF [%]
Displayed digit
4-digit
Display range
Equation
0.0% - 100.0%
50
THDAF c =
KEW6315
∑ ( Ack )
2
k =2
A c1
- 146 -
× 100
c: Meas. ch
THDAF1 , THDAF2 ,
THDAF3 , THDAF4
A: Harmonics current
k: Harmonics of each order
Items measured at Harmonics measurement
KEW6315
Harmonics voltage total distortion factor THDVR [%]
Displayed digit
4-digit
Display range
Equation
0.0% - 100.0%
50
∑ (V ck )
2
× 100
k =2
THDVR c =
50
c: Meas. channel
V: Harmonics voltage
k: Harmonics of each order
∑ (V ck )
2
k =1
1P2W-1 to 4
THDVR1
1P3W-1 to 2
THDVR1 , THDVR2
3P3W-1 to 2
Line voltage THDVR12 , THDVR32
3P3W3A
Line voltage THDVR12 , THDVR23 , THDVR31
3P4W
THDVR1 , THDVR2 , THDVR3
Harmonics current total distortion factor THDAR [%]
Displayed digit
4-digit
Display range
Equation
0.0% - 100.0%
50
2
∑ ( A ck ) × 100
c: Meas. ch.
THDAR3 , THDAR4
k =2
THDAR c =
50
∑ ( A ck )
2
THDAR1 , THDAR2 ,
A: Harmonics current
k: Harmonics of each order
k =1
Harmonics voltage phase angle θVk [deg]
Displayed digit
4-digit
Display range
Equation
0.0º to ±180.0º
V ckr
− V cki
θ V ck = tan −1
c: Measurement channel
V: Harmonics voltage
k: Harmonics of each order
r: Real number after FFT conversion,
i: Imaginary number after FFT conversion
1P2W-1 to 4
θV1 k
1P3W-1 to 2
θV1k , θV2k
3P3W-1 to 2
θV12k , θV32k * Line voltages are used.
3P3W3A
θV12k , θV23k , θV31k * Line voltages are used.
3P4W
θV1k , θV2k , θV3k
- 147 -
KEW6315
KEW6315
Items measured at Harmonics measurement
Total harmonics current phase angle θAk [deg]
Displayed digit
4-digit
Display range
Equation
0.0º to ±180.0º
A ckr
− A cki
θ A ck = tan −1
c: Measurement channel
θA1k , θA2k , θA3k , θA4k
A: Harmonics current
k:Harmonics of each order
r: Real number after FFT conversion,
i: Imaginary number after FFT conversion
Harmonics voltage current phase angle difference θk [deg]
Displayed digit
4-digit
Display range
Equation
0.0º to ±180.0º
1P2W-1 to 4
Q sumk
P sumk
−1 Q sum 1k
θ1k , θ2k , θ sum 1k = tan
P sum 1k
−1 Q sum 2 k
θ3k , θ4k , θ sum 2 k = tan
P sum 2 k
Q sumk
θ sumk = tan −1
P sumk
−1 Q sumk
θ1k , θ2k , θ3k , θ sumk = tan
P sumk
θck = θAck − θVck
θ1k , θ2k , θ3k , θ4k ,
1P3W(3P3W)-1
to 2
3P3W3A(3P4W)-1
KEW6315
c: Measurement channel, k: Harmonics of each order
θ sumk = tan −1
- 148 -
Items measured at Power quality measurement
KEW6315
Items measured at Power quality measurement
Voltage transient
Meas. system
Displayed digit
Effective
input range
Display range
Accuracy
Input impedance
Threshold value
Approx. 40.96ksps (every 2.4µs) gapless event detection (50Hz/60Hz)
4-digit
50V - 2200V (DC)
50V - 2200V (DC)
0.5%rdg * at 1000V (DC)
Approx. 1.67MΩ
Absolute peak voltage value
Detection channel (ch)
1P2W-1 to 4
V1
1P3W-1 to 2
V1 , V2
3P3W-1 to 2
Line voltage
3P3W3A
Line voltage
3P4W
V1 , V2 , V3
V12 , V32
V12 , V23 , V31
Voltage swell, Dip, INT
Range
Same as r.m.s. voltage
Displayed digit
Effective
input range
Display range
Same as r.m.s. voltage
Crest factor
Same as r.m.s. voltage
Same as r.m.s. voltage
Same as r.m.s. voltage
Input impedance
Threshold value
Meas. system
Same as r.m.s. voltage
Percentage of the nominal voltage value
Complied with IEC61000-4-3
*r.m.s. values are calculated from one waveform with half-wave overlapping.
Swell, dip detection for multi-phase system:
Starts when any one of events starts at any ch, Ends when it terminates.
INT detection for multi-phase system:
Starts when the event starts at all chs, Ends when it terminates at any one of
the chs.
Accuracy
10% - 150% (to 100V or higher nominal voltages)
: nominal voltage ±1.0%
Out of above range
: ±0.4%rdg±0.4%f.s.
Errors of event duration measurement at 40 - 70Hz
: within 1-cycle
Detection channel (ch)
1P2W-1 to 4
V1
1P3W-1 to 2
V1 , V2
3P3W-1 to 2
Line voltage V12 , V32
3P3W3A
Line voltage V12 , V23 , V31
3P4W
V1 , V2 , V3
- 149 -
KEW6315
KEW6315
Items measured at Power quality measurement
Inrush current
Range
Same as r.m.s. current
Displayed digit
Same as r.m.s. current
Effective
input range
Same as r.m.s. current
Display range
Same as r.m.s. current
Crest factor
Same as r.m.s. current
Input impedance
Same as r.m.s. current
Threshold value
Percentage of the measurement range
Meas. system
Accuracy
Calculate r.m.s. values from one waveform with half-wave overlapping.
±0.4%rdg±0.4%f.s.+ accuracy of clamp sensor
Detection channel
A1 , A2 , A3 , A4
(ch)
KEW6315
- 150 -
Items measured at Power quality measurement
KEW6315
Flicker
Displayed
Time left: Counted down time until a Pst calculation completes.
items
V: r.m.s. voltage per half-wave, 1 sec average
Pst(1min): Flicker value for 1 min (Pst ref. value)
Pst: Severity of short term flicker (10 min)
Plt: Severity of long term flicker (2 hours)
Max Pst: Max value of Pst, and time information
Max Plt: Max value of Plt, and time information
Pst(1min) Latest trend graph (for the recent 120 min)
Plt trend graph for the recent 600 hours
Displayed digit
4-digit, Resolution: log 0.001 - 6400 P.U. in 1024-split
Ramp model
230VRamp/220VRamp/120VRamp/100VRamp
Meas. method
Complied with IEC61000-4-30 and IEC61000-4-15 Ed.2
Accuracy
Pst (max. 20):±10%rdg according to the test method defined by IEC61000-4-15 Ed.2
Class F3.
Equation
Pst(1min)c , Pstc=
0 .0314 × P 0.1 + 0 .0 525 × P1S + 0 .0 657 × P 3 S + 0 .28 × P10 S + 0 .08 × P 50 S
V1S=(P0.7+P1+P1.5)/3 , V3S=(P2.2+P3+P4)/3 , V10S=(P6+P8+P10+P13+P17)/5 ,
V50S=(P30+P50+P80)/3
c: Measurement channel
The 10-min* measurement data is classfied into 1024 classes (0 - 6400P.U.), using the non-linear
classification, to determine the culamitive probability function (CPF). It will be then corrected by the
non-linear interpolating method, and do the calculation with the smoothed values. * Pst(1min): 1 min
N
Plt C = 3 ×
1P2W-1 to 4
∑ Pst
3
i
i =1
c: Measurement channel, N:12 times(2-hour meas.)
N
Pst(1min)1 , Pst1 , Plt1
1P3W-1 to 2
Pst(1min)1, Pst1 , Plt1 , Pst(1min)2, Pst2 , Plt2
3P3W-1 to 2
Line voltage
3P3W3A
Line voltage
Pst(1min)12, Pst12 , Plt12 , Pst(1min)32, Pst32 , Plt32
Pst(1min)12, Pst12 , Plt12 , Pst(1min)23, Pst23 ,
Plt23 , Pst(1min)31, Pst31 , Plt31
3P4W
Pst(1min)1, Pst1 , Plt1 , Pst(1min)2, Pst2 , Plt2 , Pst(1min)3, Pst3 , Plt3
- 151 -
KEW6315
KEW6315
10.4 Specification of Clamp sensor
10.4 Specification of Clamp sensor
<MODEL8128 >
<MODEL8127 >
<MODEL8126 >
Rated current
AC 5Arms
[Max. AC50Arms(70.7Apeak)]
AC 100Arms
(141Apeak)
AC 200Arms
(283Apeak)
Output voltage
0 - 50mV (AC 50mV/AC 5A)
[Max.AC 500mV/AC50A]:10mV/A
AC0 - 500mV
(AC500mV/AC100A):5mV/A
AC0 - 500mV
(AC 500mV/AC200A):2.5mV/A
Measuring range
AC0 - 50Arms
AC0 - 100Arms
AC0 - 200Arms
Accuracy
(sine wave input)
Phase
characteristics
Temp. & humidity
range (guaranteed
accuracy)
Operating temp.
range
Storage temp.
range
±0.5%rdg±0.1mV (50/60Hz)
±1.0%rdg±0.2mV (40Hz - 1kHz)
within ±2.0°
(0.5 - 50A/45 - 65Hz)
0 - 50ºC, relative humidity 85% or less (no condensation)
-20 to 60ºC, relative humidity 85% or less (no condensation)
AC50Arms (50/60Hz)
Output impedance
Location for use
Approx. 20Ω
Withstand voltage
Insulation
resistance
Max conductor size
Dimension
AC100Arms (50/60Hz)
AC200Arms(50/60Hz)
Approx. 10Ω
Approx. 5Ω
In-door use, altitude 2000m or less
IEC 61010-1,IEC 61010-2-032
IEC 61010-1, IEC 61010-2-032
Meas. CAT. III (300V), Pollution degree 2
Meas. CAT. III (600V),
IEC61326
Pollution degree 2, IEC61326
AC3540V/5 sec.
AC5350V/5 sec.
Between Jaws – Enclosure,
Between Jaws – Enclosure,
Enclosure – Output terminal, and
Enclosure – Output terminal, and
Jaws – Output terminal
Jaws – Output terminal
50MΩ or more/ 1000V
Between Jaws – Enclosure, Enclosure – Output terminal, and Jaws – Output terminal
Approx. ø24mm (max.)
Approx. ø40mm (max.)
100(L)×60(W)×26(D)mm
Cable length
Approx. 3m
Output terminal
MINI DIN 6PIN
Weight
within ±1.0°
(2 - 200A/45 - 65Hz)
23±5ºC, relative humidity 85% or less (no condensation)
Allowable input
Applicable
standards
within ±2.0°
(1 - 100A/45 - 65Hz)
Approx. 160g
128(L)×81(W)×36(D)mm
Approx. 260g
Accessory
Instruction manual
Cable marker
Optional parts
7146 (Banana ø 4 Adjuster plug), 7185(Extension cable)
KEW6315
- 152 -
10.4 Specification of Clamp sensor
KEW6315
<MODEL8125 >
<MODEL8124 >
Rated current
AC 500Arms (707Apeak)
AC 1000Arms (1414Apeak)
Output voltage
AC0 - 500mV
(AC500mV/500A):AC 1mV/A
AC0 - 500mV
(AC500mV/1000A):0.5mV/A
Measuring range
AC0 - 500Arms
AC0 - 1000Arms
Accuracy
(sine wave input)
Phase
characteristics
Temp. & humidity
range (guaranteed
accuracy)
Operating temp.
range
Storage temp.
range
Allowable input
Output impedance
Location for use
±0.5%rdg±0.1mV (50/60Hz)
±1.0%rdg±0.2mV (40Hz - 1kHz)
within ±1.0°
(5 - 500A/45 - 65Hz)
±0.5%rdg±0.2mV (50/60Hz)
±1.5%rdg±0.4mV (40Hz - 1kHz)
within ±1.0°
(10 - 1000A/45 - 65Hz)
23±5ºC, relative humidity 85% or less (no condensation)
0 - 50ºC, relative humidity 85% or less (no condensation)
-20~60ºC, relative humidity 85% or less (no condensation)
Insulation
resistance
Max conductor size
Dimension
AC500Arms (50/60Hz)
AC1000Arms (50/60Hz)
Approx. 2Ω
Approx. 1Ω
In-door use, altitude 2000m or less
IEC 61010-1,IEC 61010-2-032
Meas. CAT. III (600V), Pollution degree 2
IEC61326
AC5350V/5 sec
Between Jaws – Enclosure, Enclosure – Output terminal, and Jaws – Output terminal
50MΩ or more/ 1000V
Between Jaws – Enclosure, Enclosure – Output terminal, and Jaws – Output terminal
Approx. ø40mm (max.)
Approx. ø68mm (max.)
128(L)×81(W)×36(D)mm
186(L)×129(W)×53(D)mm
Cable length
Approx. 3m
Applicable
standards
Withstand voltage
Output terminal
Weight
Accessory
Optional parts
MINI DIN 6PIN
Approx. 260g
Approx. 510g
Instruction manual, Cable marker
7146 (Banana ø 4 Adjuster plug), 7185(Extension cable)
- 153 -
KEW6315
KEW6315
10.4 Specification of Clamp sensor
<KEW8129 >
<KEW8130 >
300A Range:
AC 300 Arms( 424Apeak)
AC 1000 Arms(1850Apeak)
1000A Range:
AC 1000 Arms(1414Apeak)
3000A Range:
AC 3000 Arms(4243Apeak)
300A Range: AC0 - 500mV(AC500mV/AC 300A):1.67mV/A
AC0 - 500mV
1000A Range: AC0 - 500mV(AC500mV/AC1000A):0.5mV/A
(AC500mV/AC1000A):0.5mV/A
3000A Range: AC0 - 500mV(AC500mV/AC3000A):0.167mV/A
300A Range:
30 - 300Arms
1000A Range:
100 - 1000Arms
AC0 - 1000Arms
3000A Range:
300 - 3000Arms
±1.0%rdg (45 - 65Hz)
±0.5%rdg±0.2mV (45 - 65Hz)
(at the center point))
±1.5%rdg±0.4mV (40Hz - 1kHz)
within ±1.0°
within ±2.0° (45 - 65Hz)
(in each measuring range: 45 - 65Hz)
within ±3.0°(40 - 1kHz)
23±5ºC, relative humidity 85% or less (no condensation)
-10 - 50ºC, relative humidity 85% or less (no condensation)
-20 to 60ºC, relative humidity 85% or less (no condensation)
AC3600Arms (50/60Hz)
AC1300Arms (50/60Hz)
Approx. 100Ω or less
In-door use, altitude 2000m or less
IEC 61010-1,IEC 61010-2-032
IEC 61010-1,IEC 61010-2-032
Meas. CAT. III (600V) Pollution degree 2
Meas. CAT. III (600V)/CAT.IV (300V) Pollution degree 2
IEC61326
IEC61326
AC5350V/5 sec
AC5160V/5 sec
Between circuit – sensor
Between circuit – sensor
50MΩ or more/ 1000V
Between circuit – sensor
Approx. ø150mm (max)
Approx. ø110mm (max.)
111(L)×61(W)×43(D)mm (protrusions are not included)
65(L)×25(W)×22(D)mm
Sensor part: Approx. 2m
Sensor part: Approx. 2.7m
Output cable: Approx. 1m
Output cable: Approx.0.2m
MINI DIN 6PIN
8129-1: Approx.410g/8129-2: Approx.680g/8129-3: Approx.950g
Approx.170g
Instruction manual, Output cable(M-7199), Carrying case
Instruction manual, Cable marker, Carrying case
-
KEW6315
- 154 -
10.4 Specification of Clamp sensor
KEW6315
<MODEL8141 >
<MODEL8142 >
Rated current
AC1000mArms
Output voltage
AC0 - 100mV(AC100mV/AC1000mA)
Measuring range
AC0 - 1000mArms
Accuracy
(sine wave input)
±1.0%rdg±0.1mV (50/60Hz)
±2.0%rdg±0.1mV (40Hz - 1kHz)
Phase
characteristics
Temp. & humidity
range (guaranteed
accuracy)
Operating temp.
range
Storage temp.
range
Allowable input
Output impedance
Location for use
Applicable
standards
Withstand voltage
Insulation
resistance
Max conductor size
Dimension
Cable length
Output terminal
Weight
Accessory
Optional parts
<MODEL8143 >
-------------
23±5ºC, relative humidity 85% or less (no condensation)
0 - 50ºC, relative humidity 85% or less (no condensation)
-20 to 60ºC, relative humidity 85% or less (no condensation)
AC100Arms (50/60Hz)
Approx. 180Ω
AC200Arms (50/60Hz)
AC500Arms (50/60Hz)
Approx. 200Ω
Approx. 120Ω
In-door use, altitude 2000m or less
IEC 61010-1,IEC 61010-2-032
Meas. CAT. III (300V), Pollution degree 2
IEC61326 (EMC standard)
AC3540V/5 sec
Between Jaws – Enclosure,
Jaws – Output terminal, and
Enclosure – Output terminal
50MΩ or more/ 1000V
Between Jaws – Enclosure,
Jaws – Output terminal, and
Enclosure – Output terminal
Approx. ø24mm (max)
Approx. ø40mm (max)
Approx. ø68mm (max)
100(L)×60(W)×26(D)mm
128(L)×81(W)×36(D)mm
186(L)×129(W)×53(D)mm
(protrusions are not included)
(protrusions are not included)
(protrusions are not included)
Approx. 2m
MINI DIN 6PIN
Approx. 150g
Approx. 240g
Approx. 490g
Instruction manual
Carrying case
7146 (Banana ø 4 Adjuster plug)
7185(Extension cable)
- 155 -
KEW6315
KEW6315
10.4 Specification of Clamp sensor
<KEW8146 >
<KEW8147 >
<KEW8148 >
AC 30Arms (42.4Apeak)
AC 70Arms (99.0Apeak)
AC 100Arms (141.4Apeak)
AC0 - 1500mV(AC50mV/A)
AC0 - 3500mV(AC50mV/A)
AC0 - 5000mV(AC50mV/A)
AC0 - 30Arms
0 - 15A
±1.0%rdg±0.1mV (50/60Hz)
±2.0%rdg±0.2mV (40Hz - 1kHz)
15 - 30A
±5.0%rdg (50/60Hz)
±10.0%rdg (45 - 1kHz)
AC0 - 70Arms
0 - 40A
±1.0%rdg±0.1mV (50/60Hz)
±2.0%rdg±0.2mV (40Hz - 1kHz)
40 - 70A
±5.0%rdg (50/60Hz)
±10.0%rdg (45 - 1kHz)
AC0 - 100Arms
0 - 80A
±1.0%rdg±0.1mV (50/60Hz)
±2.0%rdg±0.2mV (40Hz - 1kHz)
80 - 100A
±5.0%rdg (50/60Hz)
±10.0%rdg (45 - 1kHz)
------------23±5ºC, relative humidity 85% or less (no condensation)
0 - 50ºC, relative humidity 85% or less (no condensation)
-20 to 60ºC, relative humidity 85% or less (no condensation)
AC30Arms (50/60Hz)
AC70Arms (50/60Hz)
AC100Arms (50/60Hz)
Approx. 90Ω
Approx. 100Ω
Approx. 60Ω
In-door use, altitude 2000m or less
IEC 61010-1,IEC 61010-2-032
Meas. CAT. III (300V) Pollution degree 2
IEC61326
AC3540V/5 sec
Between Jaws – Enclosure,
Enclosure – Output terminal, and
Jaws – Output terminal
50MΩ or more/ 1000V
Between Jaws – Enclosure, Enclosure – Output terminal, and Jaws – Output terminal
Approx. ø24mm (max)
Approx. ø40mm (max)
Approx. ø68mm (max)
100(L)×60(W)×26(D)mm
128(L)×81(W)×36(D)mm
186(L)×129(W)×53(D)mm
Approx. 150g
KEW6315
Approx. 2m
MINI DIN 6PIN
Approx. 240g
Instruction manual
Cable marker
7146 (Banana ø 4 Adjuster plug)
7185(Extension cable)
- 156 -
Approx. 510g
11.1 General troubleshooting
11.
KEW6315
Troubleshooting
11.1 General troubleshooting
When defect or breakdown of the instrument is suspected, check the following points first. If your problem
is not listed in this section, contact your local Kyoritsu distributor.
Symptom
Check
Instrument cannot be powered on.
When operating with an AC power supply:
(Nothing is displayed on the LCD.)
● Power cord is connected firmly and properly?
● No break in the Power cord?
● Supply voltage is within the allowable range?
When operating with batteries:
● Batteries are installed with observing correct polarity?
● Size AA Ni-HM batteries are full-charged?
● Size AA Alkaline batteries are not exhausted?
If the problem not solved yet:
● Disconnect the power cord from an AC power source, and
then remove all the batteries from the instrument. Insert the
batteries again, and connect the power cord to an AC power
source. Power on the instrument. If the instrument still does
not turn on, instrument failure may be suspected.
Any key doesn’t work.
● Key lock function is inactivated?
● Check the effective Keys on each Range.
Readings are not stable or
Inaccurate.
● Frequency at voltage ch1 is within the guaranteed accuracy
range? It should be between 40 and 70Hz.
● Voltage test leads and clamp sensors are connected properly?
● Setting of the instrument and the selected wiring configuration
are appropriate?
● Proper sensors are used with proper settings?
● There is no break in the voltage test leads?
● Input signal is not interfered?
● Strong electric magnetic field does not exist in close
proximity?
● Measurement environment meets the specification of this
instrument?
Incapable of saving data to the
● Check the number of files in the memory.
internal memory.
● If an SD card is inserted in the instrument, remove the card.
- 157 -
KEW6315
KEW6315
11.2 Error messages and actions
Symptom
Check
Data cannot be saved on the
● SD card is inserted correctly?
SD card.
● SD card has been formatted?
● Is there available free space in a SD card?
● Check the max number of files or capacity of SD card.
● Operation of the SD card has been verified?
● Verify the proper operation of SD card on other well-known
hardware.
Download and setting cannot be
● connection of the USB cable between the instrument and PC.
done via USB communication.
● Run the communication application software “KEW Windows
for KEW6315” and check the connected devices are
displayed or not. If the devices are not displayed, the USB
driver might not be installed correctly. Please refer to the
installation manual for “KEW Windows for KEW6315” and
re-install the USB driver.
At the self-diagnosis, “NG” judgment
If “NG” is given for “SD Card”, see the check points for “Data
is given frequently.
cannot be saved in the SD card.” in above column. If “NG” is
give for the other items, disconnect the power cord from an AC
power source, and then remove all the batteries from the
instrument. Insert the batteries again, and connect the power
cord to an AC power source, and carry out the self-diagnosis
again. If “NG” is still given, instrument failure may be suspected.
11.2 Error messages and actions
Error message may appear on the LCD while using the instrument. Please check the following table if any error
message appears, and take action.
Message
No SD card.
Check the amount of free space in
the SD card.
Check the amount of free space in
the SD card.
Failed to detect sensors.
Check the connection of the
sensor(s).
KEW6315
Detail & Action
● Check the SD card is inserted correctly. See “4.3 Placing/
removing SD card” (P. 33).
● Check the free space on the SD card. If the space is not enough,
delete unnecessary files, format the card or use another card.
The SD card should be formatted on KEW6315, not on the PC.
See “To delete, transfer or format the recorded data” (P. 82).
● Check the connection of current sensor.
● If any problem is suspected, please do the following checks.
Connect the current sensor, for which "NG" is given, to the CH
on which another sensor is properly detected. If the result "NG"
is given for the same CH, a defect of the instrument is suspected.
A defect of sensor is suspected if "NG" is given for the same
sensor connected to another CH. If NG result is given, stop using
- 158 -
11.2 Error messages and actions
KEW6315
the instrument or the sensor.
Message
Detail & Action
● Connect the instrument to an AC power source, or replace the
Battery level is low.
batteries with new ones. * Size AA Alkaline battery (LR6) or
Powering offa
fully-charged Size AA Ni-MH battery x 6pcs
See “How to install batteries” (P. 31).
Not having free space on the internal
memory. Format the memory or
delete unnecessary files.
Cannot read the setting file. The file
may be damaged.
Available memory is low.
Check the amount of free space in
the SD card and internal memory.
There is no available space in the
storage area.
Start time is set in the past.
Check the recording start method.
● Check the free space on the internal memory and the number of
the saved files. Max number of the file that can be saved on the
memory is: 3 for measurement data and 8 for the other data. If
the free space is not enough, delete unnecessary files, format
the memory. See “To delete, transfer or format the recorded data”
(P. 82).
● Try again. If still the setting files are not read;
* problems with SD card or KEW6315 are suspected, if the setting
files are on the SD card,
* problems with KEW6315 are suspected, if the setting files
are in the internal memory.
If the problem with KEW6315 is suspected, stop using the
instrument.
● Check the free space and the number of saved files on the SD
card and the internal memory. Max number of the file that can be
saved on the memory is: 3 for measurement data and 8 for the
other data. If the space is not enough, delete unnecessary files,
format the card or memory. When using another SD card, it
should be formatted on KEW6315, not on the PC. See “To delete,
transfer or format the recorded data” (P. 82).
● REC Start is either “Constant rec. / Time period rec.” and the time
set for REC End is set to the past. Check and modify the time and
date. See “(8)/ (9) Setting for recording method” (P. 45).
● Check the “Recording setting” at SET UP menu.
See “5.4 Recording setting” (P. 71).
● Try again. If still a record does not start, there may be a problem
Failed to start recording.
with either the SD card or the internal memory. Check which is set
as the destination to save the data. If the destination is internal
memory, a problem with KEW6315 is suspected. Stop using the
instrument in this case.
Cannot change the instrument
● Change of setting is not allowed during a record. To change the
settings during recording or in
settings, stop record and confirm “Recording stopped.” message
stand-by mode.
appears and then disappears.
- 159 -
KEW6315
KEW6315
11.2 Error messages and actions
Message
New sensor is detected.
Detail & Action
● The connected Clamp sensors are not the same ones used
Recheck the basic setting for SET
during the previous test. Modify the settings of clamp sensor
UP before measurements.
directly from the “Basic setting” or press the “Detect” key.
Sensor connection is not correct.
Check the connected sensor(s).
● Appropriate current sensor may not be connected to the measurement channels. Check the wiring configuration and the connected
sensor.
● First, stop the recording. Confirm “Recording stopped.” message
Out of SD card space.
Recording will be stopped.
appears, and then disappears. Backup the data file to PC or any
other medias, and then delete files or format. When using another
SD card, it should be formatted on KEW6315, not on the PC.
See “To delete, transfer or format the recorded data” (P. 82).
● First, stop the recording. Confirm “Recording stopped.” message
Out of internal memory space.
Recording will be stopped.
appears, and then disappears. Backup the data file to PC or SD
cards, and then delete files or format. See “To delete, transfer or
format the recorded data” (P. 82).
KEW6315
- 160 -
DISTORIBUTOR
Kyoritsu reserves the rights to change specifications or designs described in this manual without
notice and without obligations.
www.kew-ltd.co.jp
05-12
92-2161