1
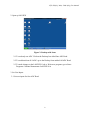
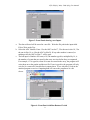
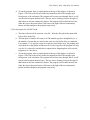
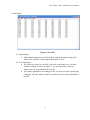
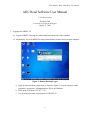
 UTA-HEP/LC 0024, VME DAQ User Manual ADC Read Software User Manual
UTA-HEP/LC 0024
Shashwat Udit
University of Texas at Arlington
August 25, 2008
1. Logging on to HEPPC 24
1-1. Log on to HEPPC 24 using user name and password on side of the computer.
1-2. Alternatively, log on to HEPPC24 using remote desktop feature from your own computer
Figure 1: Remote Desktop Logon
a. Open up remote desktop connection, as shown by Figure 1, on your computer, under
programs> accessories> communications. This is for Windows.
b. Enter in the IP Number 129.107.77.54
c. Log on using user name and password of HEP PC 24
1 UTA-HEP/LC 0024, VME DAQ User Manual 2. Open up LabVIEW
Figure 2: Desktop with Icons
2-1 To read only one ADC Click on the Desktop Icon titled One ADC Read.
2-2 To read data from all 4 ADCs go to the Desktop Icon entitled All ADC Read.
2-3 To make changes to the LabVIEW Code or. Write new programs, go to Start>
Programs> National Instruments>LabVIEW 8.0s
3. Set User Inputs
3-1 Set user inputs for One ADC Read.
2 UTA-HEP/LC 0024, VME DAQ User Manual Figure 3: Front Panel showing user Inputs
a. The data collected will be stored in a text file. Write the file path in the input titled
File to Write at the Top.
b. Select the ADC Number. Enter 1 for the ADC in slot 17, 2 for the one in slot 18, 3 for
the one in Slot 19, or 4 for the ADC in Slot 20. If any other number is entered, or
nothing at all, the ADC in Slot 17 will be read.
c. The last input is Number of Events (x16) The number typed in, multiplied by 16, is
the number of events that are stored in the array at a time before they are outputted.
For example, if 3 is typed in, when 48 events are stored in the array, the program will
write them out to the graphs and the text file. If one is typed in, the program will only
wait for 16 events to be stored before it outputs them. To see why this is, look in the
attached program overview. Outputing data will causes the program to be a bit
slower.
Figure 4: Front Panel with Run Buttons Circled
3 UTA-HEP/LC 0024, VME DAQ User Manual d. To run the program, there a couple buttons at the top of the display, as shown in
Figure 4. The four to the left are all that are normally needed. The straight, right
facing arrow is the run button. The program will execute once through, that is, it will
execute until it outputs data one time. The two arrows forming a loop to the right of
that button are the run continuously button. The program will run until the user hits
either the stop or the pause button, which are to the right of the run continuously
button, and stop and pause the program respectively.
3-2 Set user inputs for All ADC Read.
a. The data collected will be stored in a text file. Write the file path in the input titled
File to Write at the Top.
b. The last input is Number of Events (x16) The number typed in, multiplied by 16, is
the number of events that are stored in the array at a time before they are outputted.
For example, if 3 is typed in, when 48 events are stored in the array, the program will
write them out to the graphs and the text file. If one is typed in, the program will only
wait for 16 events to be stored before it outputs them. Outputing data will cause the
program to be a bit slower.
c. To run the program, there a couple buttons at the top of the display, as shown in
Figure 4. The four to the left are all that are normally needed. The straight, right
facing arrow is the run button. The program will execute once through, that is, it will
execute until it outputs data one time. The two arrows forming a loop to the right of
that button are the run continuously button. The program will run until the user hits
either the stop or the pause button, which are to the right of the run continuously
button, and stop and pause the program respectively.
4 UTA-HEP/LC 0024, VME DAQ User Manual 4. Data Output
Figure 5: Text File
4-1. Graph Output
a. Each channel outputs to a waverform chart, with event number being the XAXIS value, and ADC Counts represented on the Y-Axis.
4-2 Text File Output
a. The values are written to a text file, with each event being a row, and each
channel a column, as shown in Figure 5. As more and more events are
written, more rows are added to the text file.
b. Text can be appended to an existing text file. To create a text file, open up My
Computer, select the folder in which you wish for it to be stored, and add new
text file.
5