1
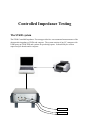
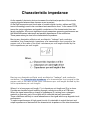
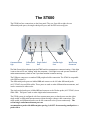
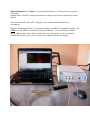
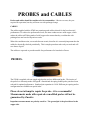
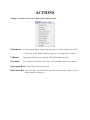
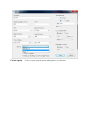
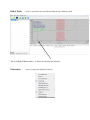
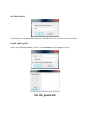
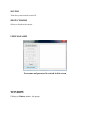
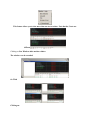
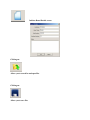
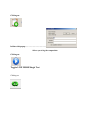
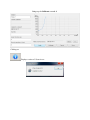
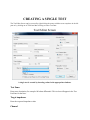
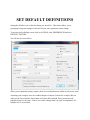
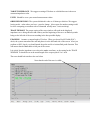
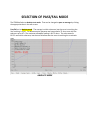
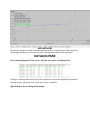
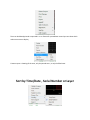
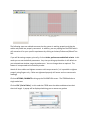
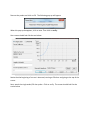
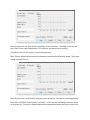
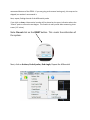
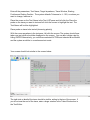
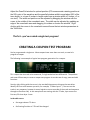
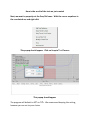
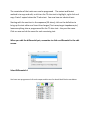
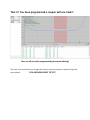
ST600 USER GUIDE Zmetrix 1195 Spring Creek Pl., Suite B, Springville, UT 84663 801-489-8708 www.zmetrix.com Copyright Copyright 2010 by Zmetrix, Inc. This manual and the hardware described in it are copyrighted, with all rights reserved. The manual may not be copied in whole or in part for any use without prior written consent of Zmetrix. Disclaimer The following paragraph does not apply in any state or country where such statements are not agreeable with local law: Even though Zmetrix has reviewed its documentation, Zmetrix provides this publication “as is” without warranty of any kind, express or implied, including but not limited to, the implied warranties of merchantability or fitness for a particular purpose. This documentation is subject to change without notice, and should not be construed as a commitment or representation by Zmetrix. This publication may contain inaccuracies or typographical errors. Zmetrix will periodically update the material for inclusion in new editions. Changes and improvements to the products and / or programs described in this manual may be made at any time. ST600 Warranty, Installation, Service, and Repair Policies Warranty: Zmetrix warrants the ST600 controlled impedance test system to be free from defects in material and workmanship for two years from the date of original purchase. During the warranty period, Zmetrix will repair, or at it’s option, replace any defective component(s) without charge for parts or labor. The Zmetrix warranty applies only to products manufactured by Zmetrix. Accessories and items not manufactured by Zmetrix are covered by the warranty of the original equipment manufacturer. Product defects caused by misuse, accidents, or user modification are not covered by this warranty. No other warranties are expressed or implied. Zmetrix is not responsible for consequential damages. Installation: Installation of ST600 systems is not a technical or time consuming process. The ST600 is a USB device, and installation is primarily a software function. The ST600 comes ready to take measurements. Training in the use of the ST600 system is generally done by phone and on-line (go to meeting.com). During on-line sessions, the user will be trained in defining tests, taking measurements, saving and reporting data, calibration, and ESD safe operation of the system. Help is always available via phone seven days/week Service: Service of ST600 systems is available directly from the factory in Utah. Typical time to repair is just a few days if the system is sent overnight. A Note on Repairs: The typical repair for a TDR system is due to an ESD event originating at one of the input/output connectors. As part of the ST600 design, these events are dramatically reduced when compared to our competitors. Additionally, those same design features dramatically reduce the cost of a repair due to ESD. These repairs typically cost less than $1,500 U.S. This is also dramatically different than our competitors. Controlled Impedance Measurements Signal integrity in electronic circuits is becoming more important to designers as clock speeds and data rates move ever upward. The continual trend towards higher speed circuits is finding its way into the full spectrum of electronic devices. They can now be found in everything from cell phones to space vehicles. One of the factors in designing quality signals in electronics is the impedance of the pc board/trace signal path. Most designers now use software modeling tools to predict the effects of trace width, pc board material, and signal path geometries in the pc board itself. A successful circuit design then requires that the pc board after manufacture complies closely with the design parameters used in the software tools. PC board manufacturers are being asked now by their customers to provide data as to their compliance with these design parameters. One method for testing compliance, is the use of a controlled impedance test system to measure the pc trace impedance for either a test trace on the board, or traces on a representative coupon located on the fabrication panel. The ST600 is designed to provide manufacturers with a complete application solution for controlled impedance measurements. The system is configured for both single ended and differential impedance measurements, and has everything the user needs to gather data, store, and report data to customers. Measurement integrity is assured through a NIST traceable calibration path. Controlled Impedance Testing The ST600 system The ST600 Controlled Impedance Test setup provides low cost automated measurements of the characteristic impedance of PCBs and coupons. The system consists of any PC computer with USB2 ports, an ST600 TDR and a printer for producing reports. It should only be used on unpowered pcb boards and/or coupons. S E probe Diff probe Characteristic impedance As the speed of electronic devices increases the electrical properties of the circuits carrying signals between them become more important. At the high frequencies and clock rates of modern digital circuitry, cables and PCB traces increasingly need to be considered as transmission lines. In the case of PCB traces the series resistance and parallel conductance of the transmission lines are largely negligible. √The most significant circuit parameters governing performance are the distributed series inductance and parallel capacitance of the conductors. These parameters give rise to the characteristic impedance Barring any dissipative effects such as dielectric “leakage” and conductor resistance, the characteristic impedance of a transmission line is equal to the square root of the ratio of the line's inductance per unit length divided by the line's capacitance per unit length: Barring any dissipative effects such as dielectric “leakage” and conductor resistance, the characteristic impedance of a transmission line is equal to the square root of the ratio of the line's inductance per unit length divided by the line's capacitance per unit length: . Where L is in henrys per unit length, C is in farads per unit length and Z o is in ohms. Consider an electrical signal travelling through a conductor such as a PCB trace. When the signal encounters a change of impedance (Zo) arising from a change in material or geometry, part of the signal will be reflected and part transmitted. These reflections are likely to cause aberrations on the signal which may degrade circuit performance. To optimize performance of high speed circuits it is desirable to match the input and output impedances of devices with the characteristic impedance of the interconnections. The ST600 The ST600 has four connections on the front panel. They are, from left to right, the two differential probe ports, the single ended probe port, and the ESD wrist strap port. Communication Ligh Differential Port Single ended Port Second single Port Wrist strap Connector The Red Comm light indicates that the ST600 and the computer are communicating. If this light is not on the unit is not “talking” with the computer. If this light is on and you are not able to make measurements, check to see if you have another instance running. The USB port connects to a standard USB peripheral cable connection. The ST600 is compatible with USB version 2.0 The differential probe ports are labeled ‘D’, and connect to the 100 ohm differential probe (ACCST-602) via two SMA cables. These ports are used to make differential measurements, and can be connected in either order. The single ended probe port is labled ‘S’, and connects to the 50 ohm probe (ACCST-601) via an SMA cable. This port is used to make single-ended measurements. The ST600 system is configured with four measurement ports so that the user can take either single ended or differential measurements without having to change cable connections. The single ended and differential probes can be left connected to the system continuously. The second single ended measurement port can accommodate a probe with different pins spacing, ie, 0.050” for measuring small pads or a probe with a different impedance, ie, 70 ohms. For typical measurements, a 70 ohm probe is not required, the 50 ohm standard probe can make 70 ohm measurements accurately unless the trace measured is shorter than 3”. The Zmetrix Zscan™ software™ is designed for use within the Microsoft Windows environment. Windows XP through Windows 7 is assumed, running on an IBM-PC compatible computer with USB2 ports. The ST600 is controlled by keyboard and mouse. A foot switch is provided for “hands off” operation. Note: When running with a top computer the system is completely portable and requires no A/C power as long as the computer batteries are charged. Complete portability The ST600 is powered from the computer via the USB. It does not plug in to AC. CONTROLS AND CONNECTORS SMA connectors The front panel SMA connectors should be connected to Zmetrix microstrip probes using Zmetrix cables. CAUTION: Tighten with care. Use a torque wrench set to 5 lbf inches It is nearly impossible to get the SMA connectors tight enough with the fingers. Connectors that are not tight combined with the stiffness of the test cables can create erratic readings. USB2 Interface to the PC The host computer must have available USB2 ports. Any newer computer will have them. Most older computers can have a USB2 card added Consult your IT person. IMPORTANT! Install Zscan and USB2 driver software prior to connecting ST600 to the host computer via the USB cable ANTI STATIC WRIST STRAP While the ST600 is not overly sensitive to ESD, but it is a good policy to wear the wrist strap when operating the system. The wrist strap is plugged into the only other connector on the front panel ST600 Accessories The ST600 comes with all the accessories the user will need to make either single ended or differential measurements. Here is what you should have: •1 - 50 ohm probe • 1 - 100 ohm differential probe • 3 - SMA cables • 2 - 50 ohm semi-rigid reference standards(2) NIST traceable • 1 - Footswitch • 1 - Anti-static wrist strap and cable • 1 - USB peripheral cable • Zscan™ Software Downloadable from www.zmetrix.com PROBES and CABLES Probes and cables should be considered to be consumables. Like tires on cars, they are required for operation, but they will wear out with prolonged usage. CABLES The cables supplied with the ST600 are premium grade cables selected for the best electrical performance. To achieve the performance levels, the inner conductors are solid copper, which makes the cables stiff. Being made of solid copper also means that they work harden with prolonged use and can develop micro cracks. When this condition exists, test results become erratic, therefore it is extremely important that the cables be electrically checked periodically. This is simple procedure takes only seconds and will save hours of grief. The cables are expected to provide trouble free performance for hundreds of hours. PROBES. The ST600 is supplied with one single ended probe and one differential probe. The interior of the probe Is a microstrip made of Rogers™ material and the spring loaded probe pins have been selected for optimal performance. Standard pin separation is 0.10”. Different pin spacing and/or configurations are available on special order Please do not attempt to repair the probe…it is a consumable! Measurements made with repaired or modified probes will not be guaranteed by Zmetrix. Impedance measurements are polarity sensitive. The ground pin is the pin soldered to the copper side. This is the Ground Side Installing the Zscan™ Software 2 To install the Zscan™ software: Go to www.zmetrix.com. Click on Software, then click on download. The Zscan software should load automatically . If you are loading the software from a CD : Step 1 Insert the Zscan™ CD into your CD drive. The autorun feature of the install software should automatically begin the installation procedure. Step 2 Click ‘Next’ until you come to the License agreement dialog. After accepting the license agreement, click ‘Next’. You should now be at the Destination Folder dialog. Here you choose a directory on your hard drive for the application. The default directory is C:|\Program Files|Zmetrix\Zscan\. Click ‘Next’ to accept the default directory. Step 3 Click ‘Install’ to install the files to the hard drive. You will see a message instructing you to attach the ST200 device after the installation finishes. Click ‘OK’ to continue. Click ‘Finish’. Step 4 Plug in footswitch to the PC. You should see a message asking where to find the driver for this device. Select the option that specifies a location, and browse to the rood directory of the installation Installing the Zscan™ Software CD. The drivers for both the footswitch and the ST200 are both located on the CD. Step 5 Plug in the ST600 and repeat step 4. Installation is now complete. 3 A GUIDE TO ZSCAN™ SCREENS, POPUPS and PULLDOWNS . The Zscan software is intuitive and easy to use when you have an idea of where to find things. Please take a few moments to familiarize yourself with the location of the various functions. The Tool Bar Clicking on FILE brings up this popup: VIEW Clicking on View brings up this popup allowing you to view status bar and tool bar ACTIONS Clicking on Actions on the tool bar displays this dropdown menu. Perform test is exactly what it implies. Depress the footswitch or left click with the cursor in the Test screen. In “live” mode nothing is required. It is in continuous test mode. Calibrate The system calibration can be checked. EOC (End of cable) can be set. Live mode. In live mode the ST600 tests continuously. Recommended mode for faster testing. Log coupon data Insert trace def Logs the data of the current coupon Opens test editor Test editor can be opened d by right clicking with the cursor in the test list pane, or hitting F4 Create report Creates a report using the present datalog data in a .pdf format End of Probe Creates a vertical blue line at the “electrical” probe tip or “launch point” This is the End Of Probe marker It shows the electrical end of probe. Preferences Opens a popup with additional functions Set Next Serial # Serial numbers are automatically sequenced. This allows the user to set the next serial number Log In and Log Out Allows user to “password” the system. Go to Preferences, User Manager to set up Set the password PREFERENCES Company Info Information entered in this window will appear in reports Colors Allows the user to set the screen colors Auto Advance Provides three choices, None, After Test and After Pass Recommended setting is After Pass. This provides the opportunity to retest if necessary before advancing. The test sequence will be advanced to the next test upon datalogging. AUTOLOG When Autolog is checked the system will automatically log the data and advance to the next coupon. SET DIRECTORIES This popup allows the user to select the directories, for datalogging and reports DEFAULT TEST DEF This utility brings up the edit screen and allows the user to select the default criteria. This can result in time savings when creating test programs. This will be discussed in another section. SET OUTPUT files FILE This allows the user to select the file location in which files will be saved START X-AXIS FROM End of Probe should be selected when testing with a probe. End of Cable should be selected when measuring the reverence standards SOUNDS Turns the system sounds on and off SHOW CURSORS Selects or deselects the cursors USER MANAGER User name and password is entered in this screen WINDOW Clicking on Window initiates this popup: This feature allows you to view more than one test at a time. Note that the 2 tests are different Clicking on New Window adds another window. The windows can be cascaded Or Tiled Clicking on: Initiates Board Details screen Clicking on: Allows you to search for and open files Clicking on: Allows you to save files Clicking on: Initiates this popup……………………………… Allows you to log the coupon data Clicking on: Toggles LIVE MODE/Single Test Clicking on: Brings up the Calibrate screen…… Clicking on: Displays version of Zscan in use CREATING A SINGLE TEST The Test Editor Screen can be accessed by right clicking the mouse with the cursor anywhere in the left pane or by clicking on ACTION and then clicking on Insert Test Data Test Editor Screen A single test is created by inserting values in the appropriate windows . Test Name Enter trace description, for example 100 ohms differential. This is what will appear in the Test List Pane for the trace. Target impedance Enter the expected impedance value Channel Select Single -1, Single -2 or Differential or Differential -A LAYER Enter layer number if you want to show on test definition Pass on average Clicking on Pass on Average sets the ST600 to pass/fail readings based on average In the selected test zone Use Aggressive Deconvolution Sets the ST600 to test using the Aggressive deconvolution algorithm (see explanation) Measurement Region as a Percentage Range Sets the pass/fail window based on a percentage of waveform, ( for example, pass/fail window starts at 50% of the window and continues to 70 % of waveform) Starting Position and Ending Position These parameters define the location of the Pass/Fail window. Trace window defines the width and position on the pass/fail region on the displayed waveform. This allows the user to avoid testing in a region where the waveform may be ringing (typically, immediately after launch on the left side of the waveform). A typical pass/fail window would start at the 50% point of the waveform and end at the 70% point of the waveform. These setting are preliminary and can be adjusted in a later step. Allowable error (Test Tolerance) This sets the test tolerance about the nominal impedance The plus and minus tolerance may be locked, where both plus and minus have the same tolerance or unlocked where each value can be independently set. The tolerance must be set to a value in the range of 0.1% to 99.99%. The value can also be set in ohms. Trace Window This parameter defines the length of the measurement window. For the best resolution, this should be set to be just a little longer than the coupon, for example for a 5” coupon set the window to 6”. Trace Window must be set so that the entire impedance curve is displayed Pass on average Selecting Pass On Average will cause the test to fail only if the average impedance value in the pass/fail rectangle is out of tolerance. This method is used most often when large numbers of vias may disturb the waveform. Pass on absolute The system defaults to Pass on absolute. In this mode the test will fail if any portion of the waveform touches any part of the crosshatch region even if the average may be within set tolerance. This is covered on another page. Loss compensation Caution!! Using loss compensation improperly could result in an invalid test. A simple test is to test a trace from both ends. If the slope is the same testing from either end, series loss is present and loss compensation may be applied. For all other measurements, loss compensation should not be applied. Loss compensation is covered in another section. Propagation Velocity (Vp) For most applications leave the Vp setting at the default of.66 Vp is covered in another section USING EXISTING TEST FILES AS TEMPLATES You can create a new test file by opening an existing test file. Start by opening a saved file that is similar to the one you want to create. Go into test editor and make any changes you wish , ie, test names, target impedance, etc. Add or delete tracks then save under the new program name. TEST A test is initiated by left clicking with the cursor in the test screen or by pressing the outer most switch on the footswitch. If the track tests PASS, the corresponding test in the test pane will display a green pass button: A failed test will display a red “button” Right clicking the mouse with the cursor in the test area will save the test. the test description will also change in color to green for pass and red for fail. When you have sequenced through all the tests a popup will show the test results and ask for operator name, job number and starting serial number. Subsequent tests can be automatically saved if you choose. The serial numbers are automatically sequenced. SET DEFAULT DEFINITIONS Setting the defaults is one of the first things you should do. This feature allows you to preprogram a large percentage of each test because some parameters rarely change. To get into the Set Default screen, click on ACTIONS, then PREFERENCES and then DEFAULT TEST DEF You will see the screen below: When you are primarily testing coupons, there are several parameters which are always the same. Assuming your company uses one standard length of coupon (5 inches for example) We can safely set the Trace Window the location of the pass/fail window…These parameters will probably always be the same. If there is a need to change them it is easily accomplished. All defaults can be overwritten. TARGET IMPEDANCE We suggest a setting of 50 ohms as a default because is the most common impedance value. UNITS Should be set to your normal measurement values OHMS PER DIVISION The system defaults this value to 10 ohms per division. We suggest leaving at this value unless you have a need to change. (One reason for another setting would be when comparing screenshots with a Tektronix…usually more Y axis sensitivity) TRACE WINDOW The proper setting of the trace window will result in the displayed impedance curve being shown in it’s entirety and the beginning of the curve or “launch point” being on the left side of the screen resulting in the best possible display. EXAMPLE: Assume a coupon length of 5 inches. When you do an End Of Cable (EOC) check, the system remembers the end and places it at the left hand side of the screen. After you perform an EOC check, you should attach the probe and do a Actions/find probe function This will ensure that the “launch” is on left part of the screen. It is critical that the impedance curve show the entire waveform, so the setting for the TRACE WINDOW To should be set at the actual length of the coupon plus 0.5 to 1 inch. The trace should look similar to the one below Note that the end of the trace is visible SELECTION OF PASS/FAIL MODE The ST600 defaults to absolute test mode. That can be changed to pass on average by clicking the appropriate box in the edit screen. Pass/fail set in absolute mode. The average is within tolerance, but the curve is touching the line resulting in a fail. For demonstration purposes we have tested a 75 ohm trace with the tolerance set at 9%. The maximum allowable reading is 81.75 ohms. The value tested is 80.76…well within tolerance, but the test failed because the trace is touching the crosshatch area ABSOLUTE MODE AVERAGE MODE The identical waveform tested in the average mode results in a pass because PASS is based on the average impedance value in the test zone. A rectangle has replaced the crosshatch. DATALOG PANE This is the datalog portion of the screen. All of the test results are displayed here. Clicking on a datalog Result will bring up the saved test on the screen displaying the results of the original test. Either the most recent test or from a saved file. Right clicking on any test brings up this popup Tests can be deleted,printed or exported in a .csv format for spreadsheet use and you can select which columns we want to display Create a report s showing all the tests, only the passed tests , or only the failed tests. Sort by Time/Date , Serial Number or Layer How much data do you wish to display? Click on the columns you wish to display in the datalog pane Clicking on EDIT COUPON brings up this screen..operator and job number can be entered Preparing the system Open the Z scan program, the screen should look similar to the screen below The following steps are advised to ensure that the system is working properly and that the cables and probes are properly connected. In addition, you can preprogram the ST600 which will customize it for your specific requirement by clicking on Actions/Preference/Default Test Def. If you will be testing coupons, primarily, click on Action, preferences and default criteria. In this mode you can set the default parameters. Any time you bring up the editor it will default to your selected test window, target impedance etc. You can change them as required. This feature is incorporated to minimize key strokes. Attach all three cables and tighten connector with torque wrench ( it is impossible to tighten properly using fingers only. Cables not tightened properly will loosen and can cause erratic readings) Click on ACTIONS, CALIBRATE to bring up the CALIBRATION screen. The ST600 defaults to single ended test. Click on EOC (End of Cable). In this mode the ST600 tests the cables and determines their electrical length. A popup will be displayed advising you to remove any probes Remove the probes and click on OK. The following pop-up will appear When this pop-up dissappears, click on save. Then click on verify. Your screen should look like the one below: Notice that the beginning of a trace is observed, starting at 50 ohms and going to the top of the screen. Next, attach the single ended, 50 ohm probe. Click on verify. The screen should look like the screen below Note that the trace now goes almost completely across the screen. The longer trace that you see is the 50 ohm single ended probe. This indicates that everything is working. If you do not see this, the system is not working properly. Next, Click on differential and repeat the sequence, attaching the differential probe. The screen should now look like this: Note that the trace is at 100 ohms and goes across the screen. The system is working properly. Next click on ACTIONS, End of probe, Find single. In this step we are finding the electrical end of the probe tip. This step is important because the measurements will be used in some of the automated features of the ST600. If you are going to do manual testing only, this step can be skipped, but we don’t recommend it. Next, repeat, finding the end of the differential probe. If you click on show, a blue vertical marker will be placed on the trace, indication where the “launch” point or where the test begins. This feature is really useful when measuring short traces (1-2 inches). Note: Do not click on the RESET button. This resets the calibration of the system. Next, click on Actions, End of probe, find single, Repeat for differential SETTING the X- AXIS Click on ACTIONS, PREFERENCES, START X AXIS FROM… In most cases you will want the trace to start at the left side of the screen, so the selection is: End of Probe If you want to measure the provided standards, select End of Cable. The screen below shows the start of the test beginning near the center of the screen: Now that the cables and probes have been checked and setup click on Actions/Insert Trace Def The screen should look similar to the screen below Notice that there is nothing in the testlist pane or the datalog pane. The main screen has the default test parameters and there is a pass/fail zone with white cursors at each side of the zone.. Next click on Actions/Insert Trace def The Test Editor screen will appear. Fill in test data. A good start would be a 50 ohm test. Once you have all the data filled in click on Save. If you click on the newly created test you will notice a more complete description of the test at the bottom of the test pane. You will also notice that the test is now highlighted. SETTING DIRECTORIES Now would be a good time to select where you want to store your files. Click on ACTIONS, PREFERENCES, SET DIRECTORIES to see this popup: CREATING A SINGLE TEST PROGRAM This assumes that you have already performed an EOC check for both single ended and differential and have the proper probes attached and you have also executed Actions/find the end of probe for both single ended and differential Click on Actions/preferences/set X-axis to and select probe Right click the mouse with the cursor in the test list pane and click on Insert or click on ACTIONS and click on Insert Trace Def or hit INS to bring up the Test Editor: Enter all the parameters; Test Name, Target Impedance, Trace W indow, Starting Position and Ending Position. The system defaults Tolerance to +/- 10%, so unless you want to change, leave as is. Place the cursor on the Test Name in the Test LIST pane and left click the Place the probe on the trace you want to test and left click the mouse to highlight the test. The Test Name will be blue highlighted. Place probe on trace to be tested (observing polarity) With the cursor anywhere in the test pane, left click the mouse. The system should have taken one test which should be displayed on the screen. You can also initiate a test by hitting ENTER Alternatively, you could have selected ACTION and selected “Live Mode” and the system would be in a continuous test mode. Your screen should look similar to the screen below The right side or “end” of the trace should be visible, exiting to the top of the screen. If you do not see the end of the trace, enter a larger number in the Trace W indow box in the Test Editor. Adjust the Pass/Fail window for optimal position (IPC recommends a starting position at the 50% point of the waveform and the pass/fail window width to equal about 20% of the trace length, ie, a trace 5 inches in length would have a window width of 5 inches x .2 or one inch). The width and position can be adjusted by “dragging the window with the cursor in the middle of the crosshatch area. The width can be adjusted by grabbing an edge of the crosshatch area and dragging it to widen or shorten the window. Right clicking with the cursor in the crosshatch area will save the test window parameters to the Test Editor. That’s it…you’ve created a single test program! CREATING A COUPON TEST PROGRAM You’ve programmed a single test. Most coupons have more than one track, so now let’s program a coupon. The following is an example of typical test program generation for a coupon. This coupon has six tracks to be measured, 5 single ended and one differential. The quickest and most efficient way to create a coupon test program is to make use of copy, paste and edit functions. Start by right clicking with the cursor in the test definition pane to bring up the test editor. Identify the first track however you wish, for example, 75 ohms layer 1. ( You can test the tracks in any sequence, however it seems logical to start at one side of the tracks and sequence through to the other side) In this example we are starting with the 75 ohm, layer one as the first test, 50 ohms layer 1 next. In the edit screen: · Set target value at 75 ohms. · Set Starting Position at 2 This will be changed · Set ending position at 3 ( This will be changed · Set Trace window at 5 (because the track lengths are 4 ½ “) · The system defaults to absolute Pass/Fail…leave it there for now · The Tolerance defaults to ±10%. If you want to change it, now is the time. · Leave Loss Compensation and Vp in the default value Click on Save The first test is now programmed. Notice that it appears at the top of the test definition Pane Next step is to validate this test and make any adjustments, so probe the appropriate pads and test. IMPORTANT: You must highlight the test by clicking on it before you can copy, edit, delete, etc When you click on the test it will be highlighted with blue Here is the result of the test we just created Next, we want to properly set the Pass/Fail zone. With the cursor anywhere in the crosshatch are and right click This popup should appear. Click on Snap to % of Cursors This popup should appear The program will default to 50% to 70%. We recommend keeping this setting, however you can set to your choice. The remainder of the tracks can now be programed . The easiest and fastest method is to copy and edit, so click on the 75 ohm test to highlight, right click and copy. Paste 5 copies below the 75 ohm test. You now have six identical tests Starting with the next test in the sequence (50 ohms), click on the definition to bring up the test editor and insert the changes (Test name,target impedance,etc) leave everything else as programmed for the 75 ohm test….they are the same. Click on save and do the same for each remaining test. When you edit the differential pair, remember to click on differential in the edit screen. Select Differential-A You have now programmed a 6 track coupon and the test list should look like the one below. That it! You have programmed a coupon with six tracks! Here are all six tracks programmed (plus some datalog) Test each track and edit for any changes that may be necessary (maybe a repositioning of the test window) . YOU ARE NOW READY TO TEST Testing printed circuit boards Prior to testing boards please ensure that the appropriate anti-static methods are observed A test is initiated by highlighting the trace definition of the trace then left clicking the mouse or by pressing the outermost portion of the footswitch. To save the test right click the mouse or press in the innermost portion of the footswitch. A test can also be initiated by hitting ENTER. A test can also be saved by hitting SHIFT/Enter Note: When operating in LIVE MODE the ST600 tests continuously. Place the Microstrip probe tips on the coupon pads to be tested (be sure you have observed the correct polarity of signal and ground connect) and initiate a test. The impedance waveform will be displayed Execute the test by left clicking the mouse or use the foot switch for “hands-free” operation . Right click to save the data and automatically advance to the next test (assuming auto advance is selected) The trace definition will turn to green on pass, red on fail. Right clicking the mouse saves the test to datalog and places a red or green pip to the right of the trace definition. Pressing the innermost portion of the footswitch will do the same. Auto advance will sequence through the coupons as you test making the test process very fast. As you test and save, data will accumulate in the datalog pane. Saving the program will create a .tds file which you can send to your customer or archive. Testing Hints If you get this message, you probably have another instance of Zscan running If you are trying to test a differential trace and the test is failing badly, make sure you have clicked on differential in the screen editor Be sure you are observing probe polarity DATALOG This is the datalog pane Passed tests are printed in green Failed tests are printed in red A click on any test will display the results of that test A right click anywhere in the datalog pane will result in this popup