1
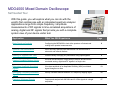
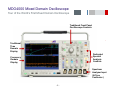
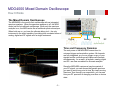
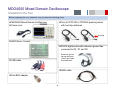
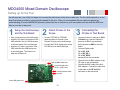
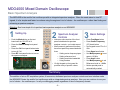
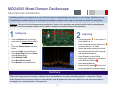
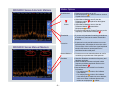
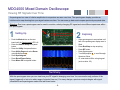
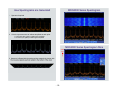
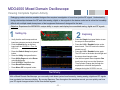
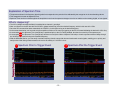
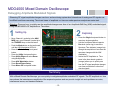
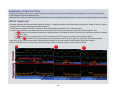
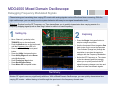
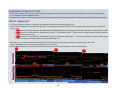
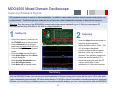
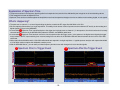
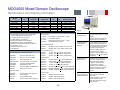
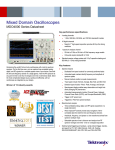
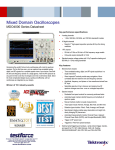
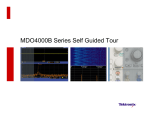
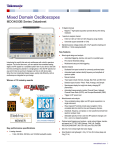
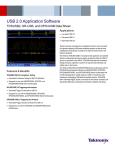
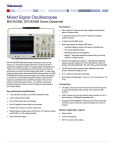
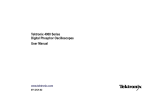
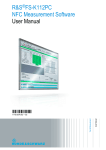
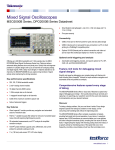
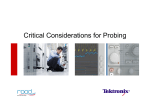
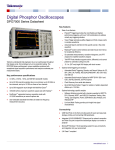
MDO4000 Series Self Guided Tour MDO4000 Mixed Domain Oscilloscope Self Guided Tour With this guide, you will explore what you can do with the world’s first oscilloscope with an integrated spectrum analyzer. Applications range from simple frequency / amplitude measurements of RF signals to time-correlated acquisitions of analog, digital and RF signals that provide you with a complete system view of your device under test. Application What You Will Experience Basic Spectrum Analysis Configuring the MDO4000 to look at the spectrum of interest and making basic spectral measurements 6 Spectral Peak Identification Quick and easy spectral peak identification via the MDO4000’s automatic and manual markers 7 Viewing RF Signals Over Time Visualize slowly changing RF phenomena using Spectrograms 9 Viewing Complete System Activity Discover the MDO4000’s unique ability to acquire and show time correlated analog, digital and RF signals in a single view 11 Debugging Amplitude Modulated Signals View how amplitude of an Amplitude Shift Key (ASK) modulated signal changes over time 13 Debugging Frequency Modulated Signals Quickly visualize transient behavior of a frequency hopping signal 15 Capturing Wideband Signals Capture and analyze both 900 MHz and 2.4 GHz signals in a single acquisition 17 -1- Page MDO4000 Mixed Domain Oscilloscope Tour of the World’s First Mixed Domain Oscilloscope Traditional Front Panel Oscilloscope Controls Traditional Time Domain Display Dedicated Spectral Analysis Controls Frequency Domain Display Spectrum Analyzer Input (N-Type Connector ) -2- MDO4000 Mixed Domain Oscilloscope How It Works The Mixed Domain Oscilloscope The MDO4000 is the world’s first oscilloscope with an integrated spectrum analyzer. When the spectrum analyzer is off, the MDO works just like a traditional oscilloscope. When only the spectrum analyzer is on, the MDO works like a traditional spectrum analyzer. When both are on, you have the ultimate debug tool – the only instrument in the world capable of providing time correlated views of analog, digital and RF signals all in a single instrument. Digital Analog RF Time and Frequency Domains The real power of the MDO4000 comes from its universal trigger and acquisition system. All channels are fully integrated, so you can trigger on any of your signals and the oscilloscope will capture all channels simultaneously. As a result, all signals—analog, digital and RF—are time-correlated for accurate analysis. Since the MDO4000 captures a long time period of your RF signal, you can choose the precise spectrum you want to see at any point in time. By simply moving Spectrum Time through your acquisition, you can see how your RF spectrum is changing over time or device state. -3- MDO4000 Mixed Domain Oscilloscope Checklist for the Tour Before beginning the tour, please be sure you have the following items: MDO4000 Mixed Domain Oscilloscope Power cord Two (2) TPP1000 or TPP0500 passive probes with hook tips attached Hook tip MDO Demo 1 board P6616 digital probe with extension ground tips connected to D0, D1 and D2 Extension ground tips can be found in the Logic Probe Accessories Kit USB cable BNC cable N-to-BNC adapter -4- MDO4000 Mixed Domain Oscilloscope Setting up for the Tour As with any test, one of the first steps is to connect the instrument to the device under test. For the initial exploration, a test board has been provided to output signals needed for the tour. After you’ve completed the tour and have gained an understanding of how the MDO4000 operates, please feel free to connect to your own system and see how the MDO can help in your day-to-day work. 1 Setup the Oscilloscope and the Test Board Plug in and power on the oscilloscope. Insert the (2) male B connectors of the USB cable into the (2) USB host ports on the rear panel of the oscilloscope. Insert the (1) male A connector of the USB cable into the USB device port on the test board. The board is on when the LEDs are lit. 2 Attach Probes to the Scope Connect TPP1000 or TPP0500 passive probes to Channel 1 and Channel 2 inputs on the oscilloscope. Connect the P6616 digital probe to the D15-D0 input on the oscilloscope. Connect BNC cable here Connect digital probe D0, D1, and D2 here Connect passive probe tips here Insert USB cable here -5- 3 Connecting the Probes to Test Board Connect Channel 1 probe tip to VCO1 Enable loop, connect Channel 2 probe tip to PLL-1 loop and both probe grounds to GND on the test board. Connect Digital probe: D0 to SPI_CLK, D1 to SPI_SS-1, D2 to SPI_MOSI square pins on the test board. Connect the N-to-BNC adapter to the RF input on the oscilloscope. Connect the BNC cable to the N-toBNC adapter. Connect the other end of the cable to the RF Out BNC connector on the test board. MDO4000 Mixed Domain Oscilloscope Basic Spectrum Analysis The MDO4000 is the world’s first oscilloscope with an integrated spectrum analyzer. When the need arises to view RF signals, it is far simpler and faster to continue using the engineer’s tool of choice – the oscilloscope – rather than finding and relearning a spectrum analyzer. Objective: See how simple it is to perform basic spectrum analysis on an MDO4000 1 Setting Up Push the Mode button on the test board until the CW LED is lit. Press the Default Setup front-panel button. Press the Ch1 front-panel button twice to turn off Ch1 Press RF front-panel button to turn on the spectrum analyzer 2 Spectrum Analyzer Controls Notice an entire section of the front panel is dedicated to spectrum analyzer controls – no buried menus! Most commonly performed functions have front panel keys associated with them Setting center frequency/span Setting reference level Setting resolution bandwidth Using markers 10 digit keypad on front panel for precision entry of specific values 3 Basic Settings Press Freq/Span button Press Center Frequency (CF) bezel button Use keypad to set CF to 2.4 GHz Press Span bezel button Use Multipurpose b to set span to 10 MHz Press Ampl button Use Multipurpose a to set Reference Level to -10dBm Notice spectral peak is automatically marked Summary The addition of a true RF acquisition system, N-connector, dedicated spectrum analyzer controls and user interface make the MDO4000 Series the world’s first oscilloscope with an integrated spectrum analyzer. Now you can continue to use your tool of choice – the oscilloscope – for all your debugging needs, regardless of time or frequency domain. -6- MDO4000 Mixed Domain Oscilloscope Spectral Peak Identification Identifying peaks in your spectrum is one of the first steps to understanding the behavior of your design. Whether you are using the basic marker functions or analyzing noise density or phase noise, easy-to-use tools are critical for saving time. Objective: Discover how the frequency and amplitude of peaks in the spectrum are quickly identified with automated peak markers. Learn how manual markers can be used to measure non-peak portions of the spectrum. 1 2 Setting Up Exploring Use Multipurpose a to set number of Peak Markers to 11 Press Threshold and use Multipurpose b to set threshold to -70.0 dBm Notice that peaks meeting the criteria are indicated with Absolute Frequency and Amplitude Readouts Press Readout to select Delta Notice peak readouts are now relative to the Reference Marker R Press Manual Markers Notice the Ref. Marker R can now be moved anywhere via manual markers Push the Mode button on the test board until the Multiple Peaks LED is lit. Press the Default Setup front-panel button. Press the Utility front panel-button. Press Utility Page and select Demo using Multipurpose a . Press Multiple Peaks. Press Recall Demo Setup. Press Markers front-panel button. Summary While performing spectrum analysis, markers are an invaluable tool for easily quantifying peaks in a spectrum. Simply define threshold and excursion values to automatically mark all peaks that meet your criteria. Or user manual markers to investigate any non-peak areas of the spectrum. -7- Marker Options MDO4000 Series Automatic Markers Peak Markers R To Center When Manual Markers are off, then the Reference marker R is placed on the highest amplitude peak. When Manual Markers are on, then the Reference Marker R is attached to Multipurpose a control. Press to quickly set the Center Frequency to the frequency of the Reference Marker R . Thresholds If you are only interested in marking peaks above a certain level, then set the marker threshold to that level. Excursion If spectrum is noisy and all markers are on nonessential peaks, then adjust the excursion value. The excursion value is how far a signal amplitude needs to fall between marked peaks to be considered another valid peak. Manual Markers Press to turn on two manual markers to use for measuring non-peak areas of the spectrum. Readouts Absolute: Readouts are absolute frequency and absolute amplitude. Delta: Readouts indicates each peak’s delta frequency and delta amplitude relative to the Reference Marker R . Manual Markers have a third line of readout information – For multipurpose a marker, this indicates noise density – For multipurpose b marker, this indicates noise density when readout is set to absolute; when set to delta, it indicates phase noise relative to multipurpose a marker. MDO4000 Series Manual Markers -8- Press to turn markers on or off. Use Multipurpose a to select maximum number of peak to be marked. MDO4000 Mixed Domain Oscilloscope Viewing RF Signals Over Time A spectrogram is a view of relative amplitudes in a spectrum as seen over time. The spectrogram display provides an intuitive color map showing how your signal varies over time. You can even go back and compare previously acquired data. Objective: See how a spectrogram can be used to monitor a slowly changing RF signal and view different spectrums within the spectrogram. 1 2 Setting Up Exploring Allow spectrogram to accumulate until half of the spectrogram display area is filled. Press Run/Stop to stop acquiring. Press RF button. Press Spectrogram. Turn Multipurpose a to scroll through Spectrum Slices. Or, enter desired Slice using keypad (such as slice -55). Push the Mode button on the test board until the Spectrogram LED is lit. Press the Default Setup front-panel button. Press the Utility front panel-button. Press Utility Page and select Demo using Multipurpose a . Press Spectrogram. Press Recall Demo Setup. Press Menu Off front-panel button. Summary With the spectrogram view you can view how your RF signal is changing over time. You can monitor only portions of the signal (triggered) or look at a wider range of signals (free run). For many designs, spectrum analysis begins with signal visualization and spectrogram makes this task even easier. -9- MDO4000 Series Spectrogram How Spectrograms are Generated 1. Spectrum Acquired 2. Color the spectrum trace to indicate amplitude at each point Cold colors (blue, green) indicate lower amplitude Hot colors (red, yellow) indicate higher amplitude MDO4000 Series Spectrogram Slice Oldest Slice 3. Spectrum is flipped with the peaks pointing towards the viewer with the newest acquired spectrum added to the bottom of the stack - 10 - MDO4000 Mixed Domain Oscilloscope Viewing Complete System Activity Debugging modern wireless-enabled designs often requires investigation of more than just the RF signal. Understanding timing relationships between the RF and other analog, digital, or bus signals in the device under test is critical but incredibly difficult with multiple stand alone pieces of test equipment that weren’t designed for the task.. Objective: Experience the MDO4000’s unique ability to acquire and display time correlated analog, digital and RF signals. 1 2 Setting Up Exploring Press the Single front-panel button to arm the scope for an acquisition. Press the VCO-1 Enabled button on the demo board. The LED next to the button should turn off. Press the VCO-1 Enabled button again. The LED next to the button should light and the scope should acquire data. Use the front-panel Wave Inspector Pan knob (outer ring) to move the Spectrum Time indicator (orange bar) through the acquisition to see how the spectrum changes during the VCO/PLL turn on. Verify that the oscilloscope and test board are setup as previously directed. Push the Mode button on the test board until the VCO/PLL-1 Turn On LED is lit. Press the Default Setup front-panel button. Press the Utility front panel-button. Press Utility Page and select Demo using Multipurpose . Press VCO/PLL Turn On button. Press Recall Demo Setup. Press Menu Off front-panel button. Summary With a Mixed Domain Oscilloscope, you can easily track down system-level issues by viewing analog, digital and RF signals time-correlated on the same display. By moving Spectrum Time throughout the waveform record, you can quickly see how your RF signal changes relative to the time-domain signals. - 11 - Explanation of Spectrum Time The spectrum shown in the frequency domain graticule corresponds to the period of time indicated by the orange bar in the time domain graticule This orange bar is known as Spectrum Time. Spectrum Time can be moved throughout the acquisition to see how the spectrum changes over time or relative to other analog, digital, or bus signals. What’s Happening? The VCO (voltage controlled oscillator) is enabled when channel 1 goes high. Next a command on the SPI bus tells the VCO/PLL (phase-locked loop) circuit the desired frequency, which in this case is 2.4 GHz. Once the SPI command has been transmitted, the VCO/PLL circuit begins tuning to the desired frequency. In the screenshots below, we’ve made a single acquisition of this turn-on event by triggering on the SPI command indicating the desired 2.4 GHz freq. In screenshot 1 , the Spectrum Time (orange bar) is positioned prior to the VCO being enabled, thus there is no activity in the spectrum yet. In screenshot 2 , the Spectrum Time (orange bar) has been moved (via the Wave Inspector Pan knob) to view the spectrum about midway through the VCO/PLL’s process of tuning to the desired frequency. With the MDO4000 Series, you can easily correlate frequency domain events with relevant time domain control signals, enabling you to quickly and easily make critical timing measurements such as time to stability of a VCO/PLL circuit. 1 Spectrum Prior to Trigger Event 2 - 12 - Spectrum After the Trigger Event MDO4000 Mixed Domain Oscilloscope Debugging Amplitude Modulated Signals Observing RF signal amplitude changes over time and monitoring system-level interactions of analog and RF signals can be difficult and time-consuming. Time trend views of amplitude vs. time can make spectrum analysis an easier task. Objective: Discover how to quickly see the amplitude changes over time of an Amplitude Shift Key (ASK) modulated signal using the MDO4000’s RF Amplitude vs. Time trace. 1 2 Setting Up Exploring Press the Single front-panel button to acquire a single acquisition. Use the front-panel Wave Inspector Pan knob (outer ring) to move the Spectrum Time indicator (orange bar) through the acquisition to see how the spectrum changes with the ASK modulation. Notice the RF Amplitude vs. Time trace in the time domain graticule (orange) allows you to quickly see how the RF signal amplitude changes over time and relative to other time domain signals Move Channel 1 probe tip to the ASKMOD loop, move Channel 2 probe tip to the TRIGGER loop on the test board. Push the Mode button on the test board until the ASK Modulation LED is lit. Press the Default Setup front-panel button. Press the Utility front panel-button. Press Utility Page and select Demo using Multipurpose . Press ASK Modulation button. Press Recall Demo Setup. Press Menu Off front-panel button. Summary With a Mixed Domain Oscilloscope, you can quickly investigate amplitude modulated RF signals. The RF amplitude vs. time trace shows the instantaneous amplitude of the acquired spectrum and can provide insight into such problems as noise, interference issues, and transient behavior. - 13 - Explanation of Spectrum Time The spectrum shown in the frequency domain graticule corresponds to the period of time indicated by the orange bar in the time domain graticule This orange bar is known as Spectrum Time. Spectrum Time can be moved throughout the acquisition to see how the spectrum changes over time or relative to other analog, digital, or bus signals. What’s Happening? The ASK (Amplitude Shift Key) Modulation signal on Channel 1 is a digital modulation control signal that is turning the RF output on and off in order to transmit a 3 bit counter progressing through the numbers 0-7. The Bit Reference signal on Channel 2 is shown to aid in understanding the bit pattern on the modulation signal. In each of the screenshots, the position of Spectrum Time (orange bar) has been moved to view the spectrum at various points in time. In 1 Spectrum Time is positioned where the RF output has been on and stable for a while, thus the view in the frequency domain is a stable signal at 2.4 GHz. In 2 Spectrum Time is positioned at an off-to-on transition in the RF, thus we see ‘smearing’ in the frequency domain. Similarly, in 3 Spectrum Time is positioned at an on-to-off transition in the RF, thus we again see ‘smearing’ in the frequency domain. Note how you can quickly see how the RF signal amplitude changes over time and relative to other analog or digital control signals. With the MDO4000 Series, you can easily correlate frequency domain events with changes in the time domain signals. 1 2 - 14 - 3 MDO4000 Mixed Domain Oscilloscope Debugging Frequency Modulated Signals Characterizing and correlating time varying RF events with analog signals can be difficult and time-consuming. With the right oscilloscope, you can easily monitor system behavior with easy-to-use signal visualization tools. Objective: Explore how the RF Frequency vs. Time trace allows you to quickly characterize time varying events of a frequency hopping signal (such as how long it takes to settle to a new frequency). 1 2 Setting Up Move Channel 1 probe tip to the TRIGGER loop on the test board. Push the Mode button on the test board until the Frequency Hop LED is lit. Press the Default Setup front-panel button. Press the Utility front panel-button. Press Utility Page and select Demo using Multipurpose . Press Frequency Hop button. Press Recall Demo Setup. Press Menu Off front-panel button. Exploring Press the Single front-panel button to acquire a single acquisition. Use the front-panel Wave Inspector Pan knob (outer ring) to move the Spectrum Time indicator (orange bar) through the acquisition to see how the spectrum changes with the Frequency Modulation. Notice the RF Frequency vs. Time trace in the time domain graticule (orange) allows you to quickly see how the RF signal frequency changes over time and relative to other time domain signals. Summary Modern RF signals can vary significantly with time. With a Mixed Domain Oscilloscope, you can quickly characterize time varying RF events – without having to look through the spectrum in the frequency domain view. - 15 - Explanation of Spectrum Time The spectrum shown in the frequency domain graticule corresponds to the period of time indicated by the orange bar in the time domain graticule This orange bar is known as Spectrum Time. Spectrum Time can be moved throughout the acquisition to see how the spectrum changes over time or relative to other analog, digital, or bus signals. What’s Happening? The Trigger signal on Channel 1 is a digital control signal that initiates the frequency hopping cycle. In each of the screenshots, the position of the Spectrum Time (orange bar) has been moved to view the spectrum at various points in time after the trigger event. In 1 Spectrum Time is positioned in the middle of the second hop frequency, thus the frequency domain view shows a single peak at 2.4 GHz In 2 Spectrum Time is positioned in the transition from the 2nd hop frequency to the 3rd, thus we see RF energy smeared across the spectrum in the frequency domain view. In 3 Spectrum Time is positioned in the transition from the 3rd hop frequency back to the 1st. This is a wider transition, thus we see RF energy smeared across more of the spectrum in the frequency domain view. Note that you can quickly characterize time varying RF events (such as how long it takes to settle to a new frequency or how much overshoot/undershoot there is during a transition) with RF vs. time traces. With the MDO4000 Series, you can easily correlate frequency domain events with changes in the time domain signals. 1 2 - 16 - 3 MDO4000 Mixed Domain Oscilloscope Capturing Wideband Signals RF standards continue to evolve to wider bandwidths. In addition, many modern wireless devices transmit and receive over multiple bands. Traditional spectrum analyzers do not have the capture bandwidth necessary to debug these systems. Objective: See the power of the MDO4000’s exceptionally wide capture bandwidth (up to 3 GHz) by capturing an RF device’s transition from 900 MHz to 2.4 GHz in a single acquisition. 1 2 Setting Up Ensure the Channel 1 probe tip is on the TRIGGER loop on the test board. Push the Mode button on the test board until the Capture BW LED is lit. Press the Default Setup front-panel button. Press the Utility front panel-button. Press Utility Page and select Demo using Multipurpose . Press Capture Bandwidth button. Press Recall Demo Setup. Press Menu Off front-panel button. Exploring Press the Single front-panel button to acquire a single acquisition. Notice the Span is set to 3 GHz. This is 3 GHz capture bandwidth. Use the front-panel Wave Inspector Pan knob (outer ring) to move the Spectrum Time indicator (orange bar) before and after the pulse on Ch 1 Notice that before the pulse, the RF output is at 900 MHz, it then transitions to 2.4 GHz after the pulse. Summary With the MDO4000 Series, you can see your whole spectrum of interest at any point in time with the up to 3 GHz ultra-wide capture bandwidth (approximately 100 times wider than the 10-40 MHz capture bandwidths of traditional spectrum analyzers). Whether you’re looking at multiband systems or ultra-wide bandwidth designs, you won’t miss any details with the MDO4000. - 17 - Explanation of Spectrum Time The spectrum shown in the frequency domain graticule corresponds to the period of time indicated by the orange bar in the time domain graticule This orange bar is known as Spectrum Time. Spectrum Time can be moved throughout the acquisition to see how the spectrum changes over time or relative to other analog, digital, or bus signals. What’s Happening? The pulse see on channel 1 is a control signal telling the device to switch the RF output from 900 MHz to 2.4 GHz. We are capturing this transition in a single acquisition! This ability to look across 3 GHz of spectrum and correlate the RF activity to other analog and digital signals is unique to the MDO4000. In screenshot 1 , Spectrum Time is positioned prior to the trigger event (single pulse on channel 1). In the spectrum, the device under test is currently communicating to a device in the 900 MHz ISM (Industrial, Scientific, and Medical) radio band. In screenshot 2 , Spectrum Time has been moved to view the spectrum after the trigger event. In the spectrum, the digital control signal (the trigger event) results in the RF output switching from communicating from one device in the 900 MHz ISM radio band to another device in the 2.4 GHz ISM radio band. Notice that both the 900 MHz and 2.4 GHz ISM radios bands are captured in a single acquisition. A typical spectrum analyzer with capture bandwidth of 10-40 MHz could not capture this wideband, transitory event. With the MDO4000 Series , you can easily correlate frequency domain events with changes in the time domain signals. 1 Spectrum Prior to Trigger Event 2 - 18 - Spectrum After the Trigger Event MDO4000 Mixed Domain Oscilloscope Specifications and Ordering Information Models Analog Ch. Analog Bandwidth Analog Sample Rate Digital Ch. Input MDO4014-3 MDO4034-3 MDO4054-3 MDO4054-6 MDO4104-3 MDO4104-6 4 4 4 4 4 4 100 MHz 350 MHz 500 MHz 500 MHz 1 GHz 1 GHz 2.5 GS/s 2.5 GS/s 2.5 GS/s 2.5 GS/s 5 GS/s 5 GS/s 16 16 16 16 16 16 1 1 1 1 1 1 Standard Probes and Accessories Four TPP0500 (≤500 MHz models) or TPP1000 (1 GHz models) Passive Voltage Probes One P6616 16 Channel Logic Probe N-to-BNC Adapter (103-0045-00) OpenChoice® Desktop and NI LabVIEW SignalExpress™ TE (LE version) Software Calibration Certificate, Quick Reference Manual & Documentation on CD Front Panel Cover, Power Cord 3-year Warranty Application Modules Serial Bus Triggering and Protocol Analysis: DPO4AERO DPO4AUDIO DPO4AUTO DPO4AUTOMAX Aerospace (MIL-STD 1553) Audio (I2S, LJ, RJ and TDM) Automotive (CAN, LIN) Automotive (CAN, LIN, FlexRay) DPO4COMP DPO4EMBD DPO4ENET Computer (RS-232/422/485) Embedded (I2C, SPI) Ethernet (10BASE-T,100BASE-TX) DPO4USB USB 2.0 (LS, FS, HS) Additional Analysis: MDO4TRIG Adv. RF Power Level Triggering DPO4PWR DPO4LMT DPO4VID Power Analysis Limit and Mask Testing HDTV & Custom Video Triggering Spectrum Analyzer Frequency Range 50 kHz – 3 GHz 50 kHz – 3 GHz 50 kHz – 3 GHz 50 kHz – 6 GHz 50 kHz – 3 GHz 50 kHz – 6 GHz Recommended Probes and Accessories RF Accessories: TPA-N-PRE TPA-N-VPI 119-4146-00 119-6609-00 Preamplifier, 12 dB gain, 9kHz – 6 GHz N-to-TekVPI Adapter Near Field Probe Set, 100 kHz – 1 GHz Flexible Monopole Antenna Passive Voltage Probes: TPP0502 TPP0850 500 MHz, 2X, 300V TekVPI Low C (12.7 pF) 800 MHz, 50X, 2.5 kV TekVPI, Single-ended Key Applications Benefits System-level Troubleshooting • See your time-correlated analog, digital and RF signals on a single display • Analyze the time and frequency domains with one instrument. Troubleshooting of Embedded RF Modules • Time-correlate events (such as timing relationship between RF module and serial control signal) to understand the root cause of improper system behavior • Monitor multiple radio bands simultaneously to observe harmonic content and intra-radio interference with >1 GHz capture bandwidth Troubleshooting of EMI Problems • Quickly determine amplitude and how often a signal is present with Spectrogram display • Trigger on the known EMI suspects (such as power supplies, clocks, serial bus) to directly measure and correlate frequency and time domain events Troubleshooting of Power Distribution in Embedded Systems • Isolate and correlate unintended power supply events to RF emissions • Monitor variations in switching power supplies and RF emissions caused by changing load conditions Active Voltage Probes: TAP1500 TAP2500 TAP3500 1.5 GHz, 10X, +8V TekVPI, Single-ended 2.5 GHz, 10X, +4V TekVPI, Single-ended 3.5 GHz, 10X, + xxx TekVPI, Single-ended Voltage Probes: TDP0500 500 MHz, 50X/5X, +42V TekVPI Differential TDP1000 TDP1500 TDP3500 THDP0100 THDP0200 TMDP0200 1 GHz, 50X/5X, +42V TekVPI Differential 1.5 GHz, 10X/1X, +8V TekVPI, Differential 3.5 GHz, 5X, +2V TekVPI, Differential 100 MHz, 1000X/100X, +6kV TekVPI, Differential 200 MHz, 500X/50X, +1.5kV TekVPI, Differential 200 MHz, 250X/25X, +750V TekVPI, Differential Current Probes: TCP0020 50 MHz, 20A AC/DC TekVPI TCP0030 120 MHz, 30A AC/DC TekVPI TCP0150 20 MHz, 150A AC/DC TekVPI - 19 - MDO4000 Mixed Domain Oscilloscope Summary This concludes the MDO tour. You have just experienced the world’s first oscilloscope with an integrated spectrum analyzer. This enables you to continue to use your tool of choice – the oscilloscope – to debug your designs regardless of whether you’re tracking down time or frequency domain issues. In addition, the MDO4000’s unique capability of acquiring and displaying time correlated analog, digital, and RF in a single instrument makes it the ultimate debug tool for the modern design engineer. Complete system visibility like this hasn’t existed before now. Are you ready to try this on your own design? To learn more, visit www.tektronix.com/mdo4000 for detailed application notes, videos and other materials. For further product demonstrations or to request a quote, please contact your local Tektronix authorized distributor. © 2013 Tektronix 48W-26883-2 - 20 -