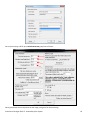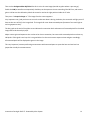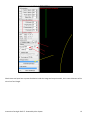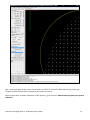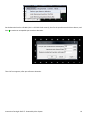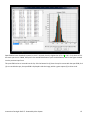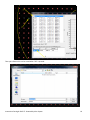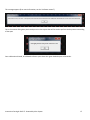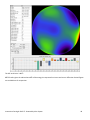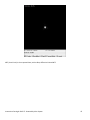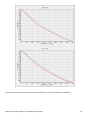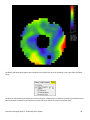
1
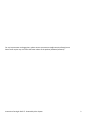
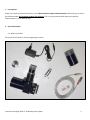
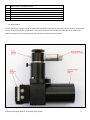
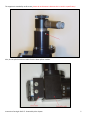
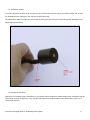
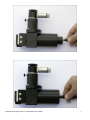
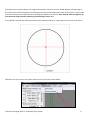
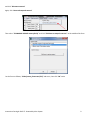
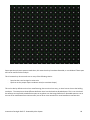
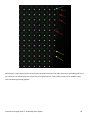
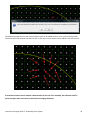
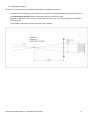
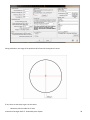
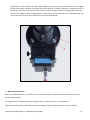
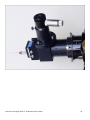
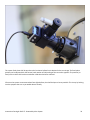
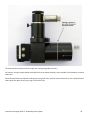
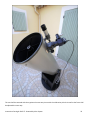
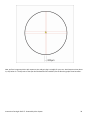
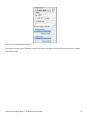
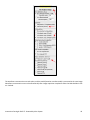
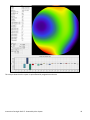
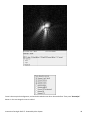
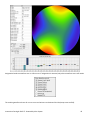
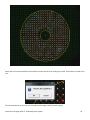
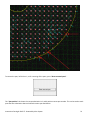
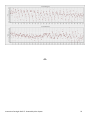
Reference and User Manual
May, 2015 revision - 3
Innovations Foresight 2015 © - Powered by Alcor System
1
For any improvement and suggestions, please contact [email protected]
Some screen copies may not reflect the latest release of the product (hardware/software)
Innovations Foresight 2015 © - Powered by Alcor System
2
1. Prerequisites
Please, first install the software and refers to the “Shack Hartmann software documentation” before starting, so that to
get familiarized with the simulation mode of the software. This is very important and will allow you to perform
measurements in a more efficient way.
2. System description
2.1. What’s in the box
This picture shows what’s in the box regarding this system
Innovations Foresight 2015 © - Powered by Alcor System
3
1
2
3
4
5
6
7
Main module + collimator module
Power supply (for different countries, plug can be changed)
Additional collimator module
Illuminated pinhole
Reticule eyepiece illuminator (red)
USB cable
Software and documentation
2.2. Main module
The Star Waves pro II system is made of several sub-assemblies. Please do not remove the shack Hartmann module from
the rest of the assembly, this can add dusts to the sensor and micro-lens and discard usable spot to be used for the
wavefront analysis. The 2 inches telescope input contains the collimator of the system.
Innovations Foresight 2015 © - Powered by Alcor System
4
The eyepiece is attached by small screws; please do not dismount it because this is tuned in a specific way!
Also, do not split the camera module from the beam splitter module.
Innovations Foresight 2015 © - Powered by Alcor System
5
2.3. Calibration module
To run the calibration module, attach the jack wire to it, and connect the other side of the cable to either USB, or main
AC, depending on the cable type. Then the 5µm pinhole illuminates.
The calibration module is a fragile part, do not touch, press, pinch, pin where the pinhole illuminates. Damaging it can
jeopardize its performance.
2.4. Calibration procedure
Calibration is a mandatory step, and without it, your device cannot produce any valid measurements. Calibration shall be
achieved for each set of collimator, if any. Introduce the calibration module inside the Star Waves pro II, push it till it
cannot slide anymore.
Innovations Foresight 2015 © - Powered by Alcor System
6
Innovations Foresight 2015 © - Powered by Alcor System
7
By looking into the reticle eyepiece, the image of the pinhole can be seen, and this should appear as a bright image in
the center of the reticle. The adjustment of the position of the pinhole image at the center of the reticle is factory made.
If not well focused, you can adjust the focus by sliding the eyepiece into the tube. Once focused, with the eyepiece, do
not remove the eyepiece when measuring at the telescope, leave it as it.
If not perfectly centered, the calibration pinhole can be rotated inside the 2” tube to get into the center of the reticle.
Calibration can start; connect the camera USB link to a PC, then launch the software
Innovations Foresight 2015 © - Powered by Alcor System
8
and click “Disconnect camera”
Again, click “Camera Setup and connect”
Then select “TIS IMAGING SOURCE camera family” and click “Click here to setup the camera !” at the middle of the form.
Set the form as follows, “Video format, frame rate (FPS)” and so on, then click “OK” twice.
Innovations Foresight 2015 © - Powered by Alcor System
9
Go to system setup, and fill up the Shack Hartmann group box as follows:
Other group boxes are not important at that stage; just ignore for the time being.
Innovations Foresight 2015 © - Powered by Alcor System
10
Then set the background box definition like this is set in the next image (outside any place where a spot can go).
Enable the NW (no wavefront computation) checkbox, set the exposure time to something like 0.007 sec, and camera
gain to 10. Be sure the calibration pinhole be turned on and at the right position inside the 2” tube.
Then press “>> Acquire image <<” .The image from the camera appears.
Very important now, (and you have not so much to take care about it during simulation, but now with real light you will
have to take care of this) is the image level. The image shall never show saturated spots (because of too much light or
too long exposure time).
The bar graph at the end of the yellow arrow indicates the saturation level and amount of saturated pixels for the whole
image and inside the analysis pupil.
Adjust camera gain and exposure time so that to be close to saturation, but never with saturated pixels more than say
100 pixels. If the signal is too low, this is not good either! In that case increase exposure time and gain accordingly.
All saturated pixels will be displayed as green in the image.
This very important, because performing measurement with saturated spots or spots that have too low level can
jeopardize critically the measurements.
Innovations Foresight 2015 © - Powered by Alcor System
11
Shack-Hartmann Spots have a sparse distribution inside the image and are quite smalls, this is normal because of the
micro-lens focal length.
Innovations Foresight 2015 © - Powered by Alcor System
12
Note : incoming image from the camera can be saved as a FITS file or CPA file for offline reprocessing, allowing to
compute wavefront without been connected to the system to measure.
When the spots level are within expectations (>50% dynamic) , go to the menu “Measurements/perform spot reference
calibration”
Innovations Foresight 2015 © - Powered by Alcor System
13
Set the detection level to 150 ADU (this is a 256 ADU level camera), then for the spot distance click Auto button, and
leave 8 as maximum acceptable spot roundness deviation.
Then this form appears, after spot reference detection.
Innovations Foresight 2015 © - Powered by Alcor System
14
Spot #768 has been discarded, because its size is 5.14 pixels, that this higher than 4.72 + 8 * 0.05 = 5.12 where 4.72 is
the mean spot size or FWHM, 0.05 pixel is the standard deviation of spot size distribution, and 8 is the figure entered
into the previous input form.
This spot #768 can be re-inserted into the list, click the bottom list (1) then the top list comes with the spot #768, click
(2) to re-enable the spot, the spot #768 is displayed inside the image, within a green square (3) or white circle.
Innovations Foresight 2015 © - Powered by Alcor System
15
Then spot reference list can be saved when “OK” is pressed:
Innovations Foresight 2015 © - Powered by Alcor System
16
This message appears (from more information, see the “software manual”)
This is the amount of brightest pixels used per micro-lens square that will be used to perform the barycenter centroiding
of the spots
Once calibration achieved, all validated reference spots have their green dashed square of excursion.
Innovations Foresight 2015 © - Powered by Alcor System
17
Some spots do not have a square around them, this means that they have been discarded, or not validated. Those spots
will not be used for further analysis.
This is because they do not match one or many of the following criteria:
-
Spot that has a too low signal to noise ratio
Spot has not the proper aspect roundness ratio (not consistent shape)
This can be due by defective micro-lens manufacturing, dust on micro-lens array, or micro-lens to close to the holding
mechanics. The next picture shows different defective micro-lens that leads to discarded spots. This is not critical and
the software can cope with some defective spots at any places over the image. Defective or discarded spots are not an
issue at all for modal wavefront reconstruction, but can be an issue sometime for zonal wavefront reconstruction.
Innovations Foresight 2015 © - Powered by Alcor System
18
Nevertheless, a new reference spot can be forced to be written into the list by right mouse click and holding shift key at
the same time, the mouse being over a spot that has no green square. A new reference spot can be added this way.
Then the following message appears:
Innovations Foresight 2015 © - Powered by Alcor System
19
The software prompts the user that a new reference spot can be added to the list to be saved to the hard disk;
otherwise spot will be used but not saved to disk. In this way a cluster of spots can be added to the reference list.
If the Shack-Hartmann camera module is dismounted from the rest of the assembly, the calibration shall be
performed again when remounted, as well when exchanging collimators.
Innovations Foresight 2015 © - Powered by Alcor System
20
2.5. Exchanging collimators
This system can accommodate with different focal length of a collimators in order to
-
Optimize the spot sampling rate with respect to the size of the analyzed telescope/system pupil: the idea is to
get as much spot as possible, without cropping the pupil by the detector’s edge.
Benefit from parallel (or “afocal”) beam to reach the micro-lens array, and not working with a lot of defocus
within the pupil.
The principle is achieved by a simple achromatic lens as follows :
Innovations Foresight 2015 © - Powered by Alcor System
21
The Star Wave Pro II Shack Hartmann analyzer comes with one collimator, a calibration pin hole, and the
necessary software for acquisition and analysis.
Nine collimators are available to cover telescopes with F-numbers stretching from F/3 to F/20:
Collimator
F/3
F/3.5
F/4.1
F/4.7
F/5.9
F/6.9
F/9.5
F/11.5
F/14
Minimum F-Number
F/3
F/3.5
F/4.1
F/4.7
F/5.9
F/6.9
F/9.5
F/11.5
F/14
Maximum F-Number
F/4
F/5
F/5.8
F/6.5
F/8
F/10
F/13
F/16.5
F/20
At the minimum F-Number the collimator images the star across 100% of the sensor chip area, at the maximum Fnumber the image occupies 50% of the sensor area. We recommend to aim for a 80% of coverage.
The next image shows a good sampling, the pupil diameter is well inside the image frame, not too large, and not too
small. This is a good match. A good amount of spots can be used; the pupil is very well sampled. The Pupil radius is 913
pixels in this case
Innovations Foresight 2015 © - Powered by Alcor System
22
The next image shows another sampling case, this is a bit small, but can be used for measurement. The amount of
usable spots is decreased by 50% compared to the case discussed above. This could be considered as the lower limit.
The F/ ration is too large for this collimator.
Innovations Foresight 2015 © - Powered by Alcor System
23
The next case shows a bad sampled pupil, F/ ratio is too low, pupil radius is 500 pixels, which is really too low, and
collimator focal length is too short. Collimator shall be exchanged!
Innovations Foresight 2015 © - Powered by Alcor System
24
The next image displays a pupil that is too large with respect to the image frame (top and bottom). It will lead to missing
surfaces to be measured. The F/ ratio is too small, and thus collimator focal length is too large. Also in this case
collimator shall be exchanged to get the whole pupil to be sampled!
Innovations Foresight 2015 © - Powered by Alcor System
25
Each collimator has a label indicating the F/ ratio range to be used, in the next picture; this is from F/7 to F/9.4
Innovations Foresight 2015 © - Powered by Alcor System
26
To exchange collimator simply unscrew it from the main module (this is M42x0.75 thread) and remove the collimator
module. The red arrow is showing the motion needed to screw the collimator to the main module, the green screw to
remove the collimator.
Innovations Foresight 2015 © - Powered by Alcor System
27
Then screw the module you plan to use for the given F/ ratio from the system to measure.
Innovations Foresight 2015 © - Powered by Alcor System
28
When such a change is performed, do not forget, this extremely important:
-
Either to use a previous grid reference file that is attached to this collimator
Or perform collimator calibration (see above) for accurate process description
The collimator are tuned to be parafocal, which means that the focus is the same whatever the collimator and eyepiece
focus position shall not be changed.
The next image shows where the grid reference file can be set.
Innovations Foresight 2015 © - Powered by Alcor System
29
During calibration, the image of the pinhole shall be found in the eyepiece’s center:
If not, there are two ways to get it at the center:
-
Rotate the pinhole inside the 2” tube
Innovations Foresight 2015 © - Powered by Alcor System
30
-
Change the tilt of the eyepiece: this can be achieved by using the three push-pull screws located at the edges of
the eyepiece support. Screw #1 is pushing (1.5 mm Allen wrench), screw #2 is pulling (2.5 mm Allen wrench). To
be able to move them, at least unscrew one of those (counter clockwise rotation). By playing with the screws,
the tilt of the eyepiece can be changed and better centering can be achieved. This is not a mandatory step, and
most of the case, the centering is achieved by rotating the pinhole body.
3. Measurement procedure
Now with a calibrated system, the Star Waves Pro II can be installed to a telescope (or other equivalent system) to
perform measurements.
The system can be inserted into telescope eyepiece holder, or focuser that has 2” input diameter.
Manual or electric focuser is a mandatory feature, focusing by sliding the tube manually is not recommended.
Innovations Foresight 2015 © - Powered by Alcor System
31
Innovations Foresight 2015 © - Powered by Alcor System
32
The system focal plane shall be put where the horizontal yellow line is depicted in the next image. The focal plane
position can be adjusted with the focuser knob rotation and by looking at the star at the eyepiece. The position (or
focus) of the reticle shall not be moved after calibration has been achieved.
Of course the system can accommodate from slight defocus, but shall be kept as low as possible. This is easy by looking
into the eyepiece the star as you would observe usually.
Innovations Foresight 2015 © - Powered by Alcor System
33
The telescope shall now be aimed at a bright star, having magnitude less than 1.
For instance, testing a simple Dobson telescope that has no sidereal tracking is even possible if the telescope is aimed at
Polaris star.
Other telescope shall have sidereal tracking when using other stars, because the Star Waves Pro II has a limited field of
view and the star does not stay very long in the field of view.
Innovations Foresight 2015 © - Powered by Alcor System
34
The star shall be centered with the eyepiece the same way it was with the calibration pinhole. As well as the focus shall
be adjusted the same way.
Innovations Foresight 2015 © - Powered by Alcor System
35
Now, perform image acquisition with exposure time and gain that is suitable for your star. Avoid exposure time above
1s, stay below 3s. The dynamic of the spot shall be between 50% and 90%, like the blue bar graphs show hereafter:
Innovations Foresight 2015 © - Powered by Alcor System
36
Or instance a 0.3 sec exposure produce
The image of the star looks as following, a large donut, this is the image of the entrance telescope pupil, including
central obscuration.
Innovations Foresight 2015 © - Powered by Alcor System
37
The next image shows that the exposure time or the gain, or both are too high: 27346 pixels are saturated, and the
saturated pixels are displayed as green:
Innovations Foresight 2015 © - Powered by Alcor System
38
Exposure or gain time shall be reduced
In the next image, the exposure time is too low, the blue bar graph is too close to the left (ie too low level) and this can
be dangerous to use such a pattern for measurements!
Innovations Foresight 2015 © - Powered by Alcor System
39
For minimizing the effect of the atmospheric turbulence, it is strongly advised to Stack incoming images, so that the
effect of the turbulence can be nulled, or decreased. Stacking 10 images is a good figure.
Analysis will be achieved only when all the required images have been recorded.
The yellow circle shape defines the pupil to be analyzed. The pupil center must be adjusted to the image center (using
mouse), the pupil diameter (Radius (pixels)). If central obscuration is present, its radius (Radius Obsc.) can be increased
Innovations Foresight 2015 © - Powered by Alcor System
40
The inner and outer diameter shall be adjusted so that to border bright spots.
In the “Analysis properties” tab, the image can be analyzed, i.e. spot position extracted and wavefront computed. Use
enhanced centroiding, enable modal and zonal wavefront computation and enable PSF computing.
Basic and non-pertinent aberration such as tilts X/Y and defocus shall be disabled.
Innovations Foresight 2015 © - Powered by Alcor System
41
The wavefront reconstruction can take place, and the modal (based on zernikes mode) is presented in the next image.
Wavefront reconstruction occurs also automatically after image acquisition completion when the NW checkbox is left
un- checked.
Innovations Foresight 2015 © - Powered by Alcor System
42
This analysis shows that this system is quite affected by astigmatism and coma.
Innovations Foresight 2015 © - Powered by Alcor System
43
Coma is due to optical misalignment, and can be discarded to see other relevant defects. Then press “Re-analyze”
button. In the next image the coma is nulled.
Innovations Foresight 2015 © - Powered by Alcor System
44
Astigmatism leads to wavefront error or 120 nm rms. If astigmatism is removed, only other wavefront errors will remain
The resulting wavefront shows 31 nm rms error and various non-dominant Zernike (except some trefoid).
Innovations Foresight 2015 © - Powered by Alcor System
45
The PSF strehl ratio is 88 %
80% EE radius gives the radius where 80% of the energy sits expressed in microns and arcsec. Diffraction limited figures
are recalled here for comparison.
Innovations Foresight 2015 © - Powered by Alcor System
46
MTF (X and Y axis) is also reported here, with as blue, diffraction limited MTF
Innovations Foresight 2015 © - Powered by Alcor System
47
This software also features zonal wavefront reconstruction. This is like a 3D model of the wavefront.
Innovations Foresight 2015 © - Powered by Alcor System
48
The display tab allows playing with spot elongation from reference that can by scaled by a user input factor for better
clarity.
The blue line indicates the spot deviation from the reference, scaled by 50x. Tilt, defocus and comas contributions have
been eliminated, to show the spot deviation from the reference (that is the center of the green box)
Innovations Foresight 2015 © - Powered by Alcor System
49
Some spots can be eliminated from the wavefront reconstruction by left clicking the mouse. Confirmation is asked to the
user :
The removed spot has a red cross over it and will not be longer used for further analysis.
Innovations Foresight 2015 © - Powered by Alcor System
50
To restore the spot, left click on it, or for restoring all the spots, press “Reset removed spots” :
The “Spot position” tab shows the raw spot deviation in Y and X position versus spot number. This can be used to track
spot that have a deviation above or below the main spot distribution.
Innovations Foresight 2015 © - Powered by Alcor System
51
0
-0 0-
Innovations Foresight 2015 © - Powered by Alcor System
52