1
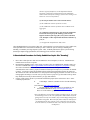
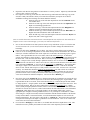
Using Geographic Information Systems to Scout a Onsite
Wastewater Disposal Site
The advent of computers and the dropping price of geographic information systems makes it possible to
"scout" a site right from one's own computer. This is useful for Engineer's, and developers, and even
potential land buyers.
Soils GIS Information and Location
The USDA's Natural Resources Conservation Service (Formerly USDA Soil Conservation Service is in the
process of digitizing all the soils maps in New York State.
These Maps are referred to as "SSURGO" maps and many counties have them posted at the Cornell
University Geospatial Information Repository (CUGIR) at
http://cugir.mannlib.cornell.edu/browse_map/browse_map.html). One just needs to click on the county in
question, and look down the list of data until one finds a listing for "Soils (SSURGO)". The Oneida
County data is in an Arc Export format ( that is the file name as an extension which reads like
"<filename>.eeo"). This file, along with the metadata file (metadata contains information such as who
digitized the information, information source, projection etc.). Both of these files should be downloaded
and placed in the same folder in the same directory with a name one could use to identify its contents (such
as "OneidaCountySoils'". Now all one needs is the ability to look at the data.
Free GIS Information Viewer:
Environmental Services Research Institute (ESRI) and leading force in geographic information systems.
The have a free GIS information Viewer called ArcExplorer. ArcExplorer can be down loaded for free at
the following website:
(http://www.esri.com/software/arcexplorer/)
As with all things in life that are free, using ArcExplorer has its limitations:
♦ It can not change the projection of a map
♦ It can not be used to make new coverage's
But that said, it can be very useful in determining what, in general, soil scientist say about the site, and the
price is right.
Information on where to by Full GIS Software Products
For those interested in doing a bit more detailed GIS work, or who wish to project GIS information, the
following are some GIS resources for commercial grade products:
♦ Manifold GIS ( http://www.manifold.net/) Cost $245.00 (2004) A full Service GIS
with the power of ArcView with its Spatial Analysis Extension
♦ Arcview (http://www.esri.com/index.html produced by ESRI. An industry standard.
Has 2 versions (3.3 and 8.3) at the time of this writing. Cost about $1300.00
♦ MapInfo (http://www.mapinfo.com/location/integration) produced by MapInfo of
New York. A professional quality GIS produced here in New York State Cost:
About $1300.00
How to Use the Data and Software
The key to making GIS work for you instead of you working for it is knowing how to manipulate the data
kept in the GIS mapping to tell you what you want to know. In an effort to better standardize the meanings,
the following methodology has been established so we all get consistent results. This has the added benefit
of saving you folks a lot of time figuring out how to manipulate and massage the GIS data making it
available to anyone.
Septic System Scouting
The following steps need to be undertaken to use GIS for "scouting" a location and the type of onsite
wastewater diposal system which may be built these in accordance with Appendix 75-A of 10 New York
Codes Rules and Regulations. This analysis is based upon groundwater elevation, which in much of
upstate New York is a deciding factor due to the effects of the glaciers on the soil disposition and
morphology.
To put it simply the glaciers made a lot of clay through compression, ground out a lot of silt via movement,
but also deposited sands in piles called drumlins where they melted. The preceding factors have left it that
high groundwater usually is more of a factor than the underlying soils when it comes to septic system
selection, at least in much of Oneida County.
A Standardized Procedure for Individual Septic Site "Scouting"
1.
2.
3.
Have either a GIS System or GIS Viewer Installed on Your Computer (see
above). Download user manuals and review how to operate.
Download the SSURGO" map of the county you want (if they are published
like Oneida County's is) from the CUGIR Website
http://cugir.mannlib.cornell.edu/browse_map/browse_map.html You may also wish to
download other useful data (such as roads, railroads, municipal boundaries, DEC
wetlands,and in some counties, property boundaries based upon tax maps (not yet
available for Oneida County)). You need to check the metadata on these and keep the
information together for future use. We will need to look at the metadata to see what
projection the mapping was done in so that we are not mixing apples and oranges. In
some cases you may need to re-project to get the roads to line up where they should, this
can only be done with true (you pay) GIS software.
If using a GIS System, decide if you want the information projected, this is the
time to do it. Some common projections are:
♦
USGS Maps - NAD-27 (available for free from the following
site:
Geocommunity (http://data.geocomm.com)
♦
Mr Sid's Images (aerial photographs) are available for free
from NYSGIS Warehouse at http://www.nysgis.state.ny.us/
These are in the NAD-83 projection
(Note, the difference in projections of these two data sources, since they
are both image sources, not even a full feature GIS would be useful in
getting them to overlay one-another, they need an image management
system which is big $$$. But with a full feature GIS you could project
the information into two separate views so that they show the same
4.
5.
areas the same way to about the same scale, that you can not do with
ArcExplorer)
Import the soils data file using whatever GIS Software or Viewer you have.
Import any other data that you need, now you have a base map.
Next import a second copy of the soils file, then a third copy and fourth and a
fifth copy copy of the soils data. Many GIS softwares allow you to name the information
you import. In an effort to standardize meanings, the following convention should be
followed:
♦ Name the first copy of the soils data imported into the GIS "SoilNam'"for the
soils USDA name,
♦ Name the second copy of the soils data imported into the GIS "DpthTGW" for
Depth to seasonal high ground water.
♦ Name the third copy of the soils data imported into the GIS "HiBgnMn" for
"Highest Seasonal Groundwater Begins in the Month of…
♦ Name the Fourth copy of the soils data imported into the GIS "HiEndMn" for
Highest Seasonal Groundwater Ends in the Month of…
♦ Name the fifth copy of the soils data imported into the GIS named "Hydric" for
Hydric soils (that is water logged soils).
(Note we used the short name convention because some GIS Systems can only have the short name due to
computer science issues in their design, if you want you could use the full titles… )
6.
7.
8.
Now that we have all the data in our GIS system, we need to set up each theme
or layer to tell us the data we need to assess a site (or a set of sites) and use the power of
GIS to change this information into knowledge.
First let us click on the "SoilNam" layer or theme. We wish to view the
different soils in different colors so we can see changes and patterns of soils which can
help us better understand a site. We look at the layer or themes and double click on the
square next to the name, this will bring up the "Legend Editor." The Legend Editor has
the view's name, and a field called legend type. In most GIS systems this defaults to
"Single Symbol". "Single Symbol" means that each of the soils shapes will be the same
color. This does not tell us much. But we can easily change this by changing the Legend
Type to "Unique Value" (usually through a pulldown window). Now we need to tell the
GIS software what field of the soils data we want to color code it to, a little research
shows the soils USDA name. is in a field named "Munamc_c." We now set the Values
Field to "Muname_c." The software then will assign a unique color to each of the
USDA soil types found in the file. Thus all the ADAMS Series of soils with the same
slopes in a county will have the same colors. We have now color coded our map. You
should also check the Theme or Layer Properties. You want to check to see that the
software will use the correct field ( in our Case "Muname_c" to label or identify the soils
type at a particular location. This is usually located in the Theme or Layers Property (see
your GIS or GIS viewer user's manual for detail and examples). You need to chose
"Muname_c."
Next let us click on the "DpthTGW" layer to determine the depth to
groundwater. We look at the layer or themes and double click on the square next to the
name, this will bring up the "Legend Editor". The Legend Editor has the view's name,
and a field called legend type. In most GIS systems this defaults to "Single Symbol". "
Single Symbol" means that each of the soils shapes will be the same color. This does not
tell us much. But we can easily change this by changing the Legend Type to "Unique
Value" (usually through a pulldown window). Now we need to tell the GIS software what
field of the soils data we want to color code it to, a little research shows the soils USDA
name, is in a field named "Wtdeph_h" which abbreviates "water depth, highest." In
determining which septic system is appropriate just on highest seasonal groundwater,
this is a very useful piece of information. USDA soils testing is to a depth of 60 inches,
and after consultation with Ms JoAnne Faulkner of the Oneida County Soil and Water
♦
♦
♦
♦
♦
♦
Conservation District, it was determined that these depths are in feet below the natural
ground surface. We now set the Values Field to " Wtdeph_h." The software then will
assign a unique color based upon each depth to groundwater recorded in the file. Now
we can "cheat" and set the colors to tell us useful information.
For soils where "Wtdeph_h" is 0.5 or less, we should make all of these depths show as red. This
means these sites are probably not suitable for onsite waste water disposals systems. Based upon
groundwater considerations only.
For soils where "Wtdeph_h" is greater than 0.5 and less than 1.0, we should make all of these depths
appear as maroon. This means these sites are not suitable for onsite waste water disposals systems
other than built up sandfilters with following mounds based upon groundwater considerations only.
For soils where "Wtdeph_h" is greater than or equal to 1.0 and less than 2.0, we should make all of
these depths appear as yellow. This means these sites can be expected to need sandfilters, raised
systems or mounds based upon groundwater considerations only.
For soils where "Wtdeph_h" is greater than or equal to 2.0 and less than 3.0, we should make all of
these depths appear as purple. This means these sites can utilize shallow absorption trenches based
upon groundwater considerations only.
For soils where "Wtdeph_h" is greater than or equal to 3.0 and less than 4.0, we should make all of
these depths appear as tan. This means these sites can utilize cut and fill or shallow absorption
trenches based upon groundwater considerations only.
For soils where "Wtdeph_h" is greater than or equal to 4.0 we should make all of these depths appear
as green. This means these sites can utilize absorption beds, gravelless absoption and absorption fields
(trenches) groundwater considerations only.
The above criteria were calculated using Table 3A "Site Requirements for Design of Individual Wastewater
Treatment Systems" from Individual Residential Wastewater Treatment Systems Design Book 1996"
Published by the New York State Department of Health. Note: In sand filters, mounds, and raised systems,
the minimum usable percolatable soil depth becomes the deciding factor over depth to groundwater.
9.
Let us now click on the " HiBgnMn " layer or theme. We wish to view when,
according to the USDA, the highest seasonal groundwater begins so that if we are doing a
soil and site evaluation we can better understand what we are seeing. We want to see the
different time frames in different colors so we can see changes and patterns of highest
groundwater in the area. We look at the layer or themes and double click on the square
next to the name, this will bring up the "Legend Editor." The Legend Editor has the
view's name, and a field called legend type. In most GIS systems this defaults to "Single
Symbol." "Single Symbol" means that each of the soils shapes will be the same color.
This does not tell us much. But we can easily change this by changing the Legend Type
to "Unique Value" (usually through a pulldown window). Now we need to tell the GIS
software what field of the soils data do we want to color code it to, a little research shows
the soils USDA name. is in a field named "Wtbeg_c." We now set the Values Field to "
Wtbeg_c." The software then will assign a unique color to each month of when the
highest seasonal groundwater level begins according to USDA. Thus, all the soils with
the beginning highest groundwater level, let's say in December are the same color on our
map.
10.
Let us now click on the " HiEndMn " layer or theme. We wish to view when,
according to the USDA, the highest seasonal groundwater ends so that if we are doing a
soil and site evaluation we can better understand what we are seeing. We want to see the
different time frames in different colors so we can see changes and patterns of highest
groundwater in the area. We look at the layer or themes and double click on the square
next to the name, this will bring up the "Legend Editor." The Legend Editor have the
view's name, and a field called legend type. In most GIS systems this defaults to "Single
Symbol". "Single Symbol" means that each of the soils shapes will be the same color.
This does not tell us much. But we can easily change this by changing the Legend Type
to "Unique Value" (usually through a pulldown window). Now we need to tell the GIS
software what field of the soils data do we want to color code it to, a little research shows
the soils USDA name is in a field named "Wtend_c." We now set the Values Field to "
Wtend_c ". The software then will assign a unique color to each month of when the
highest seasonal groundwater level begins according to USDA. Thus all the soils with
the ending highest groundwater level, let's say in July are the same color on our map.
11.
Let us now click on the " Hydric" layer or theme. We wish to view, according
to the USDA, which soils are saturated soils (that is they are usually waterlogged soils). We
want to see if the soils on (or adjacent) to our site are hydric in that it my effect our site. We
now can query the soils information by clicking the layer or theme's property and you will see
a box come up. Inside of this box, you will find usually a query editor. A query editor allows
you to sort for only the information you want. Regarding hydric soils, we want to know if a
soil is considered hydric in that hydric soils are bad for septic systems and usually are
associated with wetlands. Now we have to enter the query expression by clicking on the
hammer and question mark symbol and opening the query builder. We then choose the field
[Hydric_c] and choose the = symbol and then type "Y" (Note:The Y needs the quotes around
it to work). This will show only the hydric soils. We will color code hydric soils baby blue.
At this point we have basically, in a few minutes, made a county wide standardized map. Every County in
New York, where SSURGO maps are available online can be mapped the same way, and have the same
meaning, allowing you to look across local boundaries and look at the bigger picture.
You can learn more about the soil identified as being on a site by clicking the following link:
http://ortho.ftw.nrcs.usda.gov/cgi-bin/osd/osdname.cgi . This is the Official USDA soils website. Just
enter in the name of the soil as identified on the GIS (i.e ADAMS, CASANOVIA, etc.), and it will give
you a 1- 2 page detailed scientific report on the characteristics of these soils. To an experienced engineer
or soils scientist, this information can really assist in having some idea of what type of septic system can be
installed on a site. But remember: This does not substitute for a soil and site evaluation and percolation
test.
GIS Scouting for Septic Systems at Realty Subdivision Sites
Unbeknownst to most people septic system requirements are considerably stricter in New York State
Department of Health Regulated Subdivision that the general provisions of Appendix 75-A.
What is a New York State Regulated Subdivision is fully described in Public Health Law (Articles 11,
Title II of New York State Public Health Law, subsections1115 to 1120).
If your proposed development meets the thresholds established under this law, then you are subject to Part
74 of 10 New York Codes Rules and Regulations "Approval of Realty Subdivisions".
(available online at http://www.health.state.ny.us/nysdoh/phforum/nycrr10.htm then type in "Part 74")
A portion of the code dealing with septic systems in realty subdivisions:
74.4 Sewerage facilities.
(a) A community sewerage system is required when:
(1) a subdivision is located in an existing sewer district or service
area;
(2) a subdivision is reasonably accessible to an existing sewer
district or service area. This requirement shall apply in the
absence of proof satisfactory to the department that the
developer cannot effect arrangements for the installation
and/or connection of the sewerage system to the existing sewer
district or service area facilities;
(3) the soil percolation rate is lower than 60 min/in.;
(4) the subdivision consists of 50 lots or more;
(5) the subdivision consists of 200 or more residents in the
aggregate;
(6) a minimum separation of two feet cannot be maintained
between the lowest part of the leaching system and the
highest elevation of the top of the zone of water saturation,
rock, hardpan or other impermeable material at all times of
year; or
(7) an approved comprehensive study exists.
I have highlighted the key provisions of this code. This means that you need at least two feet of usable soil,
with a percolation rate of less than 60 minutes per inch. Otherwise you are looking at building and
installing a community sewerage disposal system. Thus, for Realty Subdivision septic system scouting
(based upon depth to high groundwater) the following process would be followed:
A Standardized Procedure for Realty Subdivision Septic Site "Scouting"
1.
2.
3.
Have either a GIS System or GIS Viewer Installed on Your Computer (see above). Download user
manuals and review how to operate.
Download the SSURGO" map of the county you want (if they are published like Oneida County's is)
from the CUGIR Website http://cugir.mannlib.cornell.edu/browse_map/browse_map.html You may
also wish to download other useful data (such as roads, railroads, municipal boundaries, DEC
wetlands,and in some counties, property boundaries based upon tax maps (not yet available for Oneida
County)). You need to check the metadata on these and keep the information together for future use.
We will need to look at the metadata to see what projection the mapping was done in so that we are not
mixing apples and oranges. In some cases you may need to re-project to get the roads to line up where
they should, this can only be done with true (you pay) GIS software.
If using a GIS System, decide if you want the information projected, this is the time to do it. Some
common projections are:
♦
USGS Maps - NAD-27 (available for free from the following
site:
Geocommunity (http://data.geocomm.com)
♦
Mr Sid's Images (aerial photographs) are available for free
from NYSGIS Warehouse at http://www.nysgis.state.ny.us/
These are in the NAD-83 projection
(Note, the difference in projections of these two data sources, since they
are both image sources, not even a full feature GIS would be useful in
getting them to overlay one-another, they need an image management
system which is big $$$. But with a full feature GIS you could project
the information into two separate views so that they show the same
areas the same way to about the same scale, that you can not do with
ArcExplorer)
4.
5.
Import the soils data file using whatever GIS Software or Viewer you have. Import any other data that
you need, now you have a base map.
Next import a second copy of the soils file, then a third copy and fourth and a fifth copy copy of the
soils data. Many GIS softwares allow you to name the information you import. In an effort to
standardize meanings, the following convention should be followed:
♦ Name the first copy of the soils data imported into the GIS "SoilNam'"for the
soils USDA name.
♦ Name the second copy of the soils data imported into the GIS "DpthTGW" for
Depth to seasonal high ground water.
♦ Name the third copy of the soils data imported into the GIS "HiBgnMn" for
"Highest Seasonal Groundwater Begins in the Month of…
♦ Name the Fourth copy of the soils data imported into the GIS "HiEndMn" for
Highest Seasonal Groundwater Ends in the Month of…
♦ Name the fifth copy of the soils data imported into the GIS named "Hydric" for
Hydric soils (that is water logged soils).
(Note we used the short name convention because some GIS Systems can only have the short name due to
computer science issues in their design, if you want you could use the full titles… )
6.
7.
8.
♦
Now we have all the data in our GIS system we need to set up each theme or layer to tell us the data
we need to assess a site (or a set of sites) and use the power of GIS to change this information into
knowledge.
First let us click on the "SoilNam" layer or theme. We wish to view the different soils in different
colors so we can see changes and patterns of soils which can help us better understand a site. We look
at the layer or themes and double click on the square next to the name, this will bring up the "Legend
Editor." The Legend Editor have the view's name, and a field called legend type. In most GIS
systems, this defaults to "Single Symbol." "Single Symbol" means that each of the soils shapes will be
the same color. This does not tell us much. But we can easily change this by changing the Legend
Type to "Unique Value" (usually through a pulldown window). Now we need to tell the GIS software
what field of the soils data do we want to color code it to, a little research shows the soils USDA name.
is in a field named "Munamc_c." We now set the Values Field to "Muname_c." The software then
will assign a unique color to each of the USDA soil types found in the file. Thus all the ADAMS
Series of soils with the same slopes in a county will have the same colors. We have now color coded
our map. You should also check the Theme or Layer Properties. You want to check to see that the
software will use the correct field ( in our Case "Muname_c" to label or identify the soils type at a
particular location. This is usually located in the Theme or Layers Property (see your GIS or GIS
viewer user's manual for detail and examples). You need to chose "Muname_c."
Next let us click on the "DpthTGW" layer to determine the depth to groundwater. We look at the layer
or themes and double click on the square next to the name, this will bring up the "Legend Editor." The
Legend Editor has the view's name, and a field called legend type. In most GIS systems this defaults
to "Single Symbol." " Single Symbol" means that each of the soils shapes will be the same color. This
does not tells us much. But we can easily change this by changing the Legend Type to "Unique
Value" (usually through a pulldown window). Now we need to tell the GIS software what field of the
soils data we want to color code it to, a little research shows the soils USDA name is in a field named
"Wtdeph_h" which abbreviates "water depth, highest." In determining which septic system is
appropriate just on highest seasonal groundwater, this is a very useful piece of information. USDA
soils testing is to a depth of 60 inches, and after consultation with Ms JoAnne Faulkner of the Oneida
County Soil and Water Conservation District, it was determined these depths are in feet below the
natural ground surface. We now set the Values Field to " Wtdeph_h." The software then will assign
a unique color based upon each depth to groundwater recorded in the file. Now we can "cheat" and
set the colors to tell us useful information.
For soils where "Wtdeph_h" is less than 2.0, we should make all of these depths show as red. This
means these sites are probably not suitable for onsite waste water disposals systems in realty
♦
♦
♦
9.
subdivisions under 74.4 of 10 New York Code Rules and Regulations. That is based upon
groundwater considerations only.
For soils where "Wtdeph_h" is greater than or equal to 2.0 and less than 3.0, we should make all of
these depths appear as purple. This means these sites can utilize shallow absorption trenches based
upon groundwater considerations only.
For soils where "Wtdeph_h" is greater than or equal to 3.0 and less than 4.0, we should make all of
these depths appear as tan. This means these sites can utilize cut and fill or shallow absorption
trenches based upon groundwater considerations only.
For soils where "Wtdeph_h" is greater than or equal to 4.0 we should make all of these depths appear
as green. This means these sites can utilize absorption beds, gravelless absoption and absorption fields
(trenches) groundwater considerations only.
Let us now click on the " HiBgnMn " layer or theme. We wish to view when, according to the USDA
the highest seasonal groundwater begins so that if we are doing a soil and site evaluation we can better
understand what we are seeing. We want to see the different time frames in different colors so we can
see changes and patterns of highest groundwater in the area. We look at the layer or themes and double
click on the square next to the name, this will bring up the "Legend Editor." The Legend Editor has
the view's name, and a field called legend type. In most GIS systems this defaults to "Single Symbol.".
"Single Symbol" means that each of the soils shapes will be the same color. This does not tell us
much. But we can easily change this by changing the Legend Type to "Unique Value" (usually
through a pulldown window). Now we need to tell the GIS software what field of the soils data we
want to color code it to, a little research shows the soils USDA name. is in a field named "Wtbeg_c."
We now set the Values Field to " Wtbeg_c." The software then will assign a unique color to each
month of when the highest seasonal groundwater level begins according to USDA. Thus all the soils
with the beginning highest groundwater level, let's say in December are the same color on our map.
10. Let us now click on the " HiEndMn " layer or theme. We wish to view when, according to the USDA,
the highest seasonal groundwater ends so that if we are doing a soil and site evaluation we can better
understand what we are seeing. We want to see the different time frames in different colors so we can
see changes and patterns of highest groundwater in the area. We look at the layer or themes and double
click on the square next to the name, this will bring up the "Legend Editor." The Legend Editor has
the view's name, and a field called legend type. In most GIS systems this defaults to "Single Symbol."
"Single Symbol" means that each of the soils shapes will be the same color. This does not tell us
much. But we can easily change this by changing the Legend Type to "Unique Value" (usually
through a pulldown window). Now we need to tell the GIS software what field of the soils data we
want to color code it to, a little research shows the soils USDA name. is in a field named "Wtend_c."
We now set the Values Field to " Wtend_c." The software then will assign a unique color to each
month of when the highest seasonal groundwater level begins according to USDA. Thus all the soils
with the ending highest groundwater level, lets say in July are the same color on our map.
11. Let us now click on the " Hydric" layer or theme. We wish to view, according to the USDA, which
soils are saturated soils (waterlogged soils). We want to see if the soils on (or adjacent) to our site are
hydric in that it may effect our site. We now can query the soils information by clicking the layer or
theme's property and you will see a box come up. Inside of this box you will usually find a query
editor. A query editor allow you to sort for only the information you want. Regarding hydric soils we
want to know if a soil is considered hydric in that hydric soils are bad for septic systems and usually
are associated with wetlands. Now we have to enter the query expression by clicking on the hammer
and question mark symbol and opening the query builder. We then choose the field [Hydric_c] and
choose the = symbol and then type "Y" (Note:The Y needs the quotes around it to work). This will
show only the hydric soils. We will color code hydric soils baby blue.
At this point we have basically, in a few minutes, made a county wide standardized map showing areas
where we can have realty subdivisions with onsite waste water disposal systems (based only upon
groundwater depth).
We also have developed knowledge of those areas where some form of Community Sewerage Disposal
system is needed.
Every County in New York where SSURGO maps are available online can be mapped the same way, and
have the same meaning, allowing you to look across local boundaries and look at the bigger picture.
You can learn more about the soil identified as being on a site by clicking the following link:
http://ortho.ftw.nrcs.usda.gov/cgi-bin/osd/osdname.cgi . This is the Official USDA soils website. Just
enter in the name of the soil as identified on the GIS (i.e ADAMS, CASANOVIA, etc), and it will give
you a 1- 2 page detailed scientific report on the characteristics of these soils. To an experienced engineer
or soils scientist, this information can really assist in having some idea of what type of septic system can be
installed on a site. But remember: This does not substitute for a soil and site evaluation and percolation
test.