1
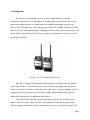
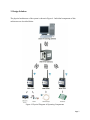
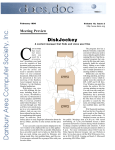
 Wireless Sensor Network with LabView Michael Bizub & An Nguyen Final Draft 12/16/2013 CNT 4104 Software Project in Computer Networks Instructor: Dr. Janusz Zalewski Computer Science & Software Engineering Programs Florida Gulf Coast University Ft. Myers, FL 33965 Page 1 1. Introduction The wireless sensor network is an array of devices manufactured by National
Instruments, designed to receive information from analog sensors (such as ultraviolet sensors,
ping sensors, thermocouples, etc.), and transmit this information through a wireless device
(Figure 1) to a central gateway. This central gateway allows users, whether on local LAN or the
Internet, to access information about the configuration of these sensors and wireless devices, and
also to utilize a program created in LabView to control how information is sent or received by
the sensors in real time. Figure 1. NI-3212 Wireless Hub/Node [2] LabView is a graphics based programming language used to control how this wireless
sensor network behaves. This means that instead of traditional programing languages that use
textual expressions for variables, if-then statements, while loops, etc., the programmer creates a
program by using visual objects to represent the variables, and links between the objects to
instruct the program on how to manipulate these objects. The wireless sensor network is an asset to modern society because it allows users to
interact with remote nodes which can convey measurement data from analog sensors about
physical quantities and stimuli or instruct digital sensors to carry out a specific command. For
Page 2 example, a person with access to the wireless network could instruct a wireless node to activate
either a local warning message or a remote alarm speaker if a motion detector attached to a
specific node detects motion within its parameters. With this system, anyone can remotely access
virtually any information and use that information to interact with the environment in a multitude
of ways, similar to how one would access the weather, view the security of their home and car,
etc. On a personal level this project is important because it introduces the student to
networking devices both locally and on the Internet. Since one of the requirements of of this
project is the ability to interact with wireless nodes via programs created in LabView, this
teaches the student how to properly configure wireless networks, but also teaches the importance
of networking security. In addition, this project teaches the student involved the importance of
being able to diagnose problems with devices that we are not familiar with and how to program
in a language that we have no practical experience with. Most important, this project also teaches
the importance of creating detailed reports in order to maintain professional communication and
records for future use. Page 3 2. Definition of the Problem The previous project group had made great progress by making the ultrasonic sensor,
PIR, and thermocouple to work with the sensor network. Near the end of the previous group’s
work, they have tried to introduce the use of a newer version of the NI 9792 wireless gateway
(Figure 2) with some minor problems. They had listed some of their potential resolutions at the
end of their previous report which we plan to use to troubleshoot. Figure 2. NI 9792 Wireless Gateway [3] This semester, it is our plan to fix the minor issues with the sensor array, and then
possibly seek additional functionality to improve upon its uses. In order to repair the sensor
array, a plan has been created to introduce the newer NI 9792 gateway and get it functioning
again with the NI 3212 wireless nodes with analog sensors. The detailed plan of work lists as
follows: 1. Connect the WSN nodes to the NI 9792 gateway. This will be done according to the
manufacturer's manual or contacting National Instruments directly to seek
troubleshooting help to reset the nonfunctional wireless nodes.
Page 4 2. Attempt to introduce the newer NI 9792 wireless gateway with National Instruments
MAX program (Figure 3). Once the NI 9792 is configured properly with the MAX
program, LabView should once again be able to detect all NI 3212 wireless nodes
connected to the gateway.
3. After LabView can detect all wireless gateways and nodes, one can start the
familiarization with coding to LabView and the operation of analog sensor circuitry in
order to write programs for data acquisition.
4. After the data from analog sensors can be acquired work on creating additional
functionality for the sensor network can begin.
Figure 3. National Instrument’s Measurement & Automation Explorer For additional functionality, one could create an alarm system by using the PING)))
device to trigger a local warning message or instruct LabView to send a message back to the
triggering node instructing it to enable an ultrasonic alarm device. One could also create an
activity monitoring program that would theoretically be able to count the number of people
entering or exiting a building or keep track of the number of available parking spaces within a
parking garage through the use of the PIR sensor. It appears that the device may have problems
performing complex tasks such as changing the color of an LED designed for Arduino boards,
Page 5 but it should excel at simple data acquisition (such as temperature) and keeping track of a
massive amount of repetitive events. Page 6 3. Design Solution The physical architecture of the system is shown in Figure 4. Individual components of this
architecture are described below. Figure 4. Physical Diagram of Operating Components Page 7 ● WSN 9792 Gateway is both a wireless and wired device which manages the connection
between the client PC and the wireless nodes. In order to manage the wireless nodes, the
device must be accessed through its web-page (available by connecting to its IP address
via a browser with Silverlight). Once setup, it will then allow the client PC to send
commands via LabView 2011 which assists with data acquisition or delivering
instructions from/to the wireless nodes.
● WSN 3202 Wireless Node is responsible for direct interaction with the analog and digital
sensors. The WSN gateway forwards commands issued by the client PC’s LabView
program to this node which then instructs it to send/receive information to/from the
devices connected to it.
● WSN 3212 Wireless Node is similar to the WSN 3202 wireless node, however, it is only
functional when acquiring data from a thermocouple.
● Thermocouple is a sensing device used to measure temperature. It works by using two
different conductors intertwined with each other which creates a measurable voltage
representing the surrounding temperature. The thermocouple is connected to a WSN 3212
wireless node.
● Buzzer is a simple device that emits a high pitch buzzing sound when it receives a “high”
signal on the I/O lead and is off when it receives a “low” signal on the I/O lead. The
buzzer is connected to a WSN 3202 wireless node.
● PIR Sensor is a sensor that allows for the detection of motion. It takes a quick snapshot of
the room, and if anything moves, it will trigger a high signal on the alarm pin. The PIR
sensor is connected to a WSN 3202 wireless node.
Page 8 ● Ping))) Ultrasonic Distance Sensor (Figure 5) detects an object’s range by emitting a
sound that bounces off the object and returns (similar to echolocation). This device is
connected to a WSN 3202 wireless node.
Figure 5. PING))) Ultrasonic Distance Sensor [4] There are two system software packages used in this project: ● NI MAX Program is used to initially setup the WSN 9792 gateway. Basic device settings
such as network settings, node connectivity, etc, are editable as long as the devices are on
the same subnet. Once the WSN gateway’s settings are finalized, MAX is no longer
needed for device functionality.
● NI LabView 2011 is a graphical programming language developed by National
Instrument for data acquisition and control. In this project its networking feature is use to
allow a client PC to interact with a WSN gateway. LabView is utilized to create a visual
instruction set which is then executed in real time to either acquire data from sensors
connected to wireless nodes or trigger events such as arming a buzzer or create a local
warning message if appropriate conditions are met.
To summarize in the system outlined in Figure 4, a user on the client PC runs a LabView
program which connects to the WSN Gateway. The LabView program utilizes the protocols
included in the high-level language to access the wireless nodes which then communicate with
the attached sensors and devices. Once connected, LabView then either display the acquired data
or executes a specified task. If the LabView program that is currently being executed is
instructed to display information to the user, it will be shown on the project window. For
Page 9 example, if the program was designed to display the voltage transmitted by an analog device, it
could be displayed in a waveform graph within the program (see Figure 6). Figure 6. Waveform Chart Showing Data Retrieval in LabView Page 10 4. Implementation Due to the non-traditional format of LabView programming, creating programs to operate
the wireless sensor network in LabView is done in a single window rather than a document style
seen in C++ and Java. A sample program in LabView for the wireless sensor network may
operate as follows: (1) retrieve information from a sensor attached to a wireless node, (2) analyze
that information and do some arithmetic comparisons, (3) use that information to instruct the
program to trigger an event, such as setting off an alarm or displaying a message to the user.
Creating this program remotely and uploading to the sensor nodes via gateway is also done. In this project there are two main uses for the sensor network. The first is retrieving
information from a node. Even though it may seem elementary, retrieving information remotely
about environmental stimuli is the main function of the sensor network. In order to retrieve
information from a node, two things must be created in a LabView VI project. The first is the
project window. This is a window in which information retrieved from the wireless node can be
displayed. For example, a project window with a waveform chart displays the voltage retrieved
from a range sensor (Figure 7). As the distance between the object and the Ping))) sensor Figure 7. Project Window decreases, a corresponding voltage between 5V and 0V is retrieved by LabView which then is
displayed on a graph. In order for the graph to operate correctly, the block diagram must be
setup. A block diagram is the underlying program which makes the program function. In the
Page 11 block diagram example in Fig.8, one can see that the AI0 output is connected to the input of the
waveform chart. This instructs the program to feed information retrieved from the analog input
#1 on the currently selected node to feed its information to the waveform chart. Figure 8. Block Diagram for Data Retrieval Another more complicated program that can be created in LabView is an example of a
sort of alarm system. Due to the functionality of the PING))) sensor, it can be used to detect if an
object moves in front of it because of its range sensing functionality. This can be utilized in a
LabView program to trigger a buzzer attached to the same sensor. For example (see Figure 9),
instead of connecting the output of AI0 to a waveform chart, it is connected to a comparison
operator that compares the output of AI0 to another value, in this case, a constant, 5. This
essentially will compare the voltage of the PING))) sensor, and if an object moves in front of the
sensor causing the voltage to drop from 5V to a lower voltage, the output of the comparison
operator will be true. This Boolean value will be sent to the Digital I/O #1 which will then arm
the buzzer. Page 12 Figure 9. Block Diagram for Alarm System Ultimately, the wireless sensor network has an unlimited number of uses, but it is purely
restricted to receiving numerical values on the analog inputs, numerical values on the digital
inputs, and sending Boolean true/false to digital devices. These two examples are just some of
the many possible uses of the wireless sensor network. Page 13 5. Experiments In order to test the functionality of the sensor network following all of our new
implementations, we devised the following tests:
1) Connecting to the WSN gateway in NI’s Measurement and Automation Explorer using
(MAX)
2) Adding/Removing nodes from the gateway using MAX
3) Creating a new LabView project
4) Creating a remotely executed startup application for the wireless sensor network
5) Future projects for WSN using LabView, UDP, and GUIs
5.1)
First, load up the NI Max program. If the device is connected on the same subnet, MAX will
auto-identify the WSN 9792 gateway. If the device is connected to a different subnet, you will
need to specify the device via IP address (Figures 10 & 11).
Page 14 Figure 10. Adding a remote device on a different subnet
Figure 11. MAX Target via IP Address
After the target device has been identified in max, you can change several different settings such
as specifying a static IP, adding/removing nodes, formatting the device’s HDD to update the
LabView software, etc.
5.2)
In order to add nodes to the device, you need to expand the Devices & Interfaces section under
the gateway (Figure 11).
Figure 11. Adding/Removing nodes using MAX
Page 15 Once on this page, you can use the “Add Node” button to add a node, the “Remove Node” button
to remove a node, or the “Configure Node” to change the state of the node to either routing or
end-point. For most scenarios, you will want the nodes running in an end-node state to conserve
power.
5.3)
Once the gateway and nodes are configured using MAX, it is time to create a new project in
LabView which will let you interact with the devices and retrieve real-time data. First, open
LabView and create a new project file (Figure 12).
Figure 12. Creating a new project in LabView
Once the new project is created, you will be greeted by a new project screen. On this screen, you
will want to right-click the project > new > targets and devices > existing devices by IP address
(if the gateway is on a different subnet) or right-click the project > new > targets and devices >
discover an existing device (if it is on the same subnet) to add the 9792 gateway to the project
(Figure 13 & 14).
Page 16 Figure 13. Adding the 9792 gateway to the project
Figure 14. Specifying the gateway by IP address
Page 17 Once the gateway has been added to the project, you will then be able to adjust settings for the
individual nodes and sensors connected to the gateway. In order to edit the sample rate, voltages,
and power-on times for the sensors, you will need to expand the “wireless sensor network” tree
under the device, right click a node connected to the gateway, and click properties. From here,
you will see a screen which a couple of tabs that will allow you to change these settings (Figure
15 & 16).
Figure 15. Changing the sampling rate and power-on time for the node
Page 18 Figure 16. Changing the voltages for the connect sensors
Once the voltages are set to the correct values, and the sampling rates are calibrated to the
appropriate levels, it is now possible to create the VI files which will extract the information
from the nodes.
First, navigate back to the project explorer window. From there, you need to right-click the
project > new > VI. You will now be introduced to the LabView VI windows (Figure 17).
Page 19 Figure 17. VI creation page
Once on the VI creation page, you can drag a drop sensor inputs on the white page, introduce
objects such as histograms, data analysis tools, etc. On the checkerboard screen, you can create
real-time monitoring windows to examine data as it is being pulled from the nodes. In this small
example, you can see that the data from the first analog channel on Node 1 is being channeled
into the chart to display the information.
Once your VI file has been created, you can click on the circular arrows to deploy the project
onto the gateway, which will then remotely execute the LabView code and consequently send
the information to the locations specified in the LabView project (Figure 18).
Page 20 Figure 18. Deploying a VI file to the WSN Gateway
Once you have deployed your VI, you can either let the program run and collect data, or you can
create an application consisting of your VI files that will be executed on the gateway whenever it
boots up, in order to always keep the wireless sensor network retrieving sensor information.
5.4)
Once you have created and deployed your VI, you can now build an application that will be
executed by the gateway every time it boots without the need for a computer to be connected. To
do this, right click the “Build Specifications” tree in the project explorer and click New > Realtime application. The new real-time application builder will be launched (Figure 19). Page 21 Figure 19. Building a real-time application Once the real-time application builder has been launched, add the VI to the startup VI by
clicking the .vi file and clicking the arrow to add it to the “startup VIs”. Once added, click the
build button. Once the build has been completed, you will now need to deploy the built
application to the wireless gateway. To do this, navigate to the project explorer, right-click on
build specifications and click deploy. LabView will then attempt to upload the real-time
application to the gateway. Once uploaded, you will need to set the application to run when the
device starts up. To do this, click the “set as startup” option when right-clicking the build
specification (Figure 20). Page 22 Figure 20. Setting the application to run on device start Once the application has been set to launch at startup, the VI file will be stored on the device and
executed when the device turns on. This enables you to create a long-term application that will
allow you to monitor several things such as temperature, CO2 levels, etc. over a long period of
time and even develop GUIs to display the information on clean, friendly user interfaces.
5.5)
In addition to what we have tested in LabView for monitoring analog and digital nodes
connected to the WSN nodes. We have found additional uses for the NI sensor networks.
LabView has built in UDP functionality that allows LabView to export data to other computers
via the internet or local area network. Future students or researchers working on these devices
Page 23 could use the UDP portion of LabView, and the fact that the NI 9792 gateway has the ability to
run onboard real-time applications, to create a truly wireless network of sensors. By utilizing this
UDP functionality and real-time application, developers can use GUIs built in Java or C++ and
datagram packets to create virtual maps that host information collected from the WSN devices to
monitor things such as parking garages, green houses, outdoor environments, etc.
Page 24 6. Conclusion The best part about the WSN is the deployable VI programs, and how they let developers
uploaded them directly to the gateway through LabView. The gateway doesn’t need a computer
to be directly connected once a project build has been deployed to the device and set to execute
on start up. This allows a long-term monitor program to be developed and migrate the collected
information into a friendly, clean looking GUI. WSN can also be a great tool for long-term
monitoring solutions because of its low-power consumption devices. WSN boasts that their
devices can run on 4 AA batteries for 3 or more years which beats their competitors by more
than 1000%. The most challenging portion of this project is the applications for the device, and the
device network setup. The WSN Gateway requires many ports to be open in order for the device
to be properly recognized and to transfer data to associated computers. Also, a lot of the sensors
that we connected to the device seemed as if they didn’t collect data accurately enough to be
reliable. For future projects, it would be best to order additional nodes, such as the thermocouple
node and possibly one other working WSN 3212 node along with some official NI analog
sensors. Once these devices are hooked up to the gateway, deploying these devices in a field
situation to collect information such as temperature, CO2 levels, etc. would make the most out of
this technology. Some of these sensors include thermal couple measurement devices for
measuring temperature (http://sine.ni.com/nips/cds/view/p/lang/en/nid/208177). Differential
pressure sensors for measuring pressure from water lines
(http://www.sensirion.com/en/products/differential-pressure-sensors/differential-pressure-sensorsdp1000-series/). Barometric pressure sensors that measure the pressure of the environmental air
(http://www.servoflo.com/pressure-sensors/suppliers/amsys/item/389-ams5812.html).
Also, LabView allows for data exportation via UDP which would allow developers to
create better looking GUIs to host data on a map-like outline of a specific area or in friendlier
looking graphs/charts. Ultimately, WSN creates an opportunity for a medium-distance
monitoring system that not only lasts a long time, but allows for better data management and
custom GUI incorporation. Page 25 7. Reference [1] National Instrument. Labview User Manual. April 2003 http://www.ni.com/pdf/manuals/320999e.pdf [2] National Instruments. NI WSN-3212 User Guide and Specification. October 10th, 2013.
http://www.ni.com/pdf/manuals/372776d.pdf [3] National Instruments. NI 9792 WSN Real-Time Gateway User Guide and Specification.
October 10th, 2013. http://www.ni.com/pdf/manuals/372998b.pdf [4] Parallax Inc. Ping))) Ultrasonic Distance Sensor. October 10th, 2013. http://wwwrobotics.cs.umass.edu/~grupen/503/Projects/28015-PING-v1.5.pdf [5] C. Ruskai, Remote Data Acquisition with NI WSN Ethernet Gateway. May 28th, 2013.
http://itech.fgcu.edu/faculty/zalewski/projects/files/RuskaiLabviewWireless.pdf [6] C. Ruskai, M. Hannaford, & G. Colas. Remote Data Acquisition with NI Wireless Sensor
Network. December 15th, 2011.
http://itech.fgcu.edu/faculty/zalewski/projects/files/Wireless_Sensor_Network.pdf [7] T. Jeffrey, & J.Kring, LabVIEW For Everyone Third Edition. New York: Prentice Hall,
January 2007. Page 26