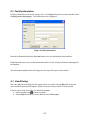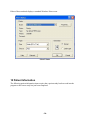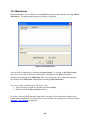
1
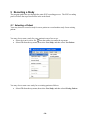
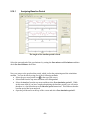
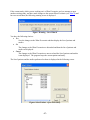
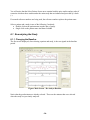
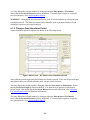
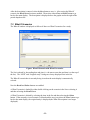
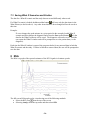
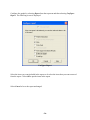
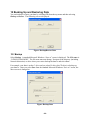
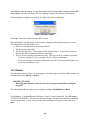
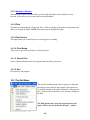
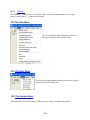
The 3CPM Comaany
Electrogastrogram
your scope of diagnoses
in today's wor1d of gustrointestinu1 disorders
Version 2.08
AND USER GUIDE
b t t / d u ~ f l \I O H f 3 CUp1: 03 UGd&fIUJW
in tody 's wrla Ofgd~trointests'ndI
disorders
A
3CPM EGGSAS© Research User Manual
1
2
3
4
5
6
7
8
Introduction and Overview ..................................................................................................... 3
Equipment Setup..................................................................................................................... 4
2.1
Human Interface Module ................................................................................................ 5
2.1.1
Human Interface Module Indicator Light ............................................................... 6
2.1.2
When Indicator Light Is Flashing ........................................................................... 7
Preparation for Recording....................................................................................................... 7
3.1
General............................................................................................................................ 7
3.2
Preparing the Patient ....................................................................................................... 8
Program Operation.................................................................................................................. 9
4.1
Starting the Program ....................................................................................................... 9
Recording a Study................................................................................................................. 10
5.1
Selecting a Patient......................................................................................................... 10
5.2
Resuming a Study ......................................................................................................... 11
5.3
Entering Patient Demographics .................................................................................... 12
5.4
Pre-study Information ................................................................................................... 13
5.5
Equipment Test ............................................................................................................. 14
5.5.1
Equipment Test Failure/Error ............................................................................... 15
5.6
Baseline Recording ....................................................................................................... 16
5.7
Post Baseline Options ................................................................................................... 17
5.8
Post Stimulation Recording .......................................................................................... 18
5.9
Recording Events During Study ................................................................................... 19
5.10 Study Completed........................................................................................................... 20
5.10.1
Analyzing Baseline Period.................................................................................... 21
5.10.2
Analyzing Post stimulation Periods ...................................................................... 22
5.10.3
Diagnosis............................................................................................................... 23
5.10.4
Recommendations................................................................................................. 24
5.10.5
Respiration Rate.................................................................................................... 25
Opening a Prior Study........................................................................................................... 26
6.1
Re-analyzing the Study ................................................................................................. 28
6.1.1
Changing the Baseline .......................................................................................... 28
6.1.2
Change a Post Stimulation Period......................................................................... 29
6.1.3
Changing Events ................................................................................................... 30
6.1.4
Adding Events....................................................................................................... 30
6.2
Changing the Diagnosis ................................................................................................ 30
6.3
Changing the Recommendation.................................................................................... 31
6.4
Changing the Pre-study Information............................................................................. 31
6.5
Stimulation medium...................................................................................................... 31
6.6
Change number of minutes per graph........................................................................... 31
What If Scenario Option ....................................................................................................... 32
7.1
No Prior What If Scenarios........................................................................................... 32
7.2
What If Scenarios.......................................................................................................... 33
7.3
Saving What If Scenarios and Studies .......................................................................... 34
RSA....................................................................................................................................... 34
-1-
9
Reports .................................................................................................................................. 35
9.1
Configuring ................................................................................................................... 35
9.2
Facility Information ...................................................................................................... 37
9.3
View/Printing................................................................................................................ 37
10
Patient Information ........................................................................................................... 38
10.1 Demographics ............................................................................................................... 39
10.2 Medications................................................................................................................... 40
10.3 Diagnostic History ........................................................................................................ 41
11
Navigating the Baseline and Post Stimulation Periods..................................................... 43
12
Backing Up and Restoring Data ....................................................................................... 44
12.1 Backup .......................................................................................................................... 44
12.2 Restore .......................................................................................................................... 45
13
Closing the Program ......................................................................................................... 47
14
EGGSAS Research Version Menu Overview................................................................... 48
14.1 The File Menu............................................................................................................... 48
14.1.1
New Study............................................................................................................. 48
14.1.2
New Patient........................................................................................................ 48
14.1.3
Existing Patient ..................................................................................................... 48
14.1.4
Open Prior Study................................................................................................... 48
14.1.5
Save Patient........................................................................................................... 48
14.1.6
Resume Study ....................................................................................................... 48
14.1.7
Backup or Restore................................................................................................. 49
14.1.8
Print....................................................................................................................... 49
14.1.9
Print Preview......................................................................................................... 49
14.1.10
Print Setup......................................................................................................... 49
14.1.11
Recent Files....................................................................................................... 49
14.1.12
Exit.................................................................................................................... 49
14.2 The Edit Menu .............................................................................................................. 49
14.2.1
What If… .............................................................................................................. 50
14.3 The View Menu ............................................................................................................ 50
14.4 The Goto Menu ............................................................................................................. 50
14.5 The Analyze Menu........................................................................................................ 50
14.5.1
Prior To Setting Baseline and Post Procedure Time............................................. 51
14.5.2
After Baseline and All Periods are Set ................................................................. 51
14.6 The Reports Menu......................................................................................................... 51
14.6.1
View Report .......................................................................................................... 51
14.6.2
Print Report........................................................................................................... 52
14.6.3
Create Spreadsheet of Data Sheet ......................................................................... 52
14.6.4
Configure Report .................................................................................................. 52
14.6.5
Faculty/practice information................................................................................. 52
-2-
3CPM EGGSAS© Research User Manual
1 Introduction and Overview
The 3CPM Company’s Electrogastrogram (EGG) Machine is an EGG analysis system that
records, stores, displays and prints the myoelectric signals from the stomach as an aid to
diagnosis of various gastric motility disorders.
Optimum use of this device requires a basic familiarity with the published literature which
describes typical EGG patterns commonly encountered in clinical practice with specific patient
groups and related interpretative techniques. An appendix is provided at the end of this manual,
however, which illustrates the data and printed displays produced by this device. The setting up
of the equipment is described in the section on equipment setup.
The filter characteristics of the amplifier allow those biological signals with approximate
frequency ranges from 1 to 15 cycles per minute (cpm) to pass through for recording and
digitization. Two channels of data are recorded during the session. One of these is the EGG
signal itself; the other channel records respiratory rates. This respiratory recording channel is
used to help identify artifact in the EGG signal caused by movement, deep breathing, etc.
The analog signals recorded from the EGG skin electrodes and the respiratory belt are amplified,
filtered and fed into four cables. The cables are connected to a computer which has been
equipped with an analog to digital (A/D) converter for digitization of the EGG signal.
The data file that is created during the A/D conversion of the EGG signal undergoes Fourier
transform (FT), an analysis of the frequencies contained in the EGG signal and a running spectral
analysis (RSA). A plot of the RSA and calculation of the percentage of power in selected
frequency bands are reports produced by the EGG analysis system.
These EGG data are presented in four major frequency ranges:
• normal (2.5 to 3.75 cpm)
• bradygastria (1.0 - 2.5 cpm)
• tachygastria (3.75 - 10.0 cpm)
• duodenal-respiratory (10.0 - 15 cpm)
The data in these ranges are described in four ways:
1. the raw power (log μV2)
2. the percentage distribution of the power in the specific ranges described above
3. the ratio of power based on postprandial to preprandial power
4. the RSA of the EGG recording presented in a pseudo-3-D format
-3-
As will be explained in more detail in the following sections, the basic technique for recording
an electrogastrogram involves the following steps:
1. Proper placement of electrodes and adjustment of equipment.
2. Management of the patient, in a subdued environment, so as to minimize movement or
other artifact causing events.
3. Recording of up to a one hour baseline (preprandial) period.
4. Administration of a stimulation medium test in which the patient drinks or ingests a
stimulation medium as per individual protocol.
5. Completion of the session by recording up to an additional 3 hours of data following the
ingestion of the stimulation medium (postprandial period)
2 Equipment Setup
The Human Interface Device is powered by the USB connection to the computer. Refer to the
diagram and follow the instructions below:
-4-
1. Connect the respiration belt to the Human Interface Module at the location marked,
“Resp”
2. Connect each of the EGG lead wires to the Human Interface Module, according to the
color of the lead wire and the port plug-in color designated on the label.
a. a. Red to red, green to green, and black to black
3. Connect the larger “U” shaped end of the USB Cable to the plug-in on the end of the
Human Interface Module, marked “USB”.
4. Connect the other end of the USB Cable to the computer. USB 2.0 ports will read faster
than the older ports. The system may give you this warning when you connect. It does not
mean the module will not work. NOTE: USB cable must be no longer than six feet in
length.
2.1 Human Interface Module
The Human Interface Module is the small device that interfaces the signals from the patient to
the EGGSAS software.
Human Interface Module
-5-
This is an example of the Human Interface Device when properly connected.
Connected Device
2.1.1 Human Interface Module Indicator Light
The module has an indicator light on the same side as the connections for the leads. This light
displays that the device is being accessed by the program. Attaching the connectors to the patient
and attaching the USB cable to the computer will not turn this light on. Starting a study does not
immediately turn this light on. Only after you select the Begin Study button at the bottom of the
Pre Study Information box does the indicator light appear.
Indicator Light On – Begin Test
-6-
2.1.2 When Indicator Light Is Flashing
Once the recording of a study is ended and you have selected “Finish”, the light will begin to
flash notifying you that it is no longer collecting data. It will remain flashing until disconnected.
However, if you choose to move directly to a new study you can ignore the flashing light and it
will turn to a solid light as soon as you select Begin Study on the Pre Study Information box.
Also, because it is a USB device, it can be unplugged and plugged back in between studies with
the program open.
3 Preparation for Recording
3.1 General
The subject should consume 4 ounces of apple juice and one piece of dry toast two hours prior to
the start of the EGG recording session. The subject must then fast for the two hours immediately
preceding the session.
If consistent with patient well being, drugs which produce myoelectrical or contractile activity
(e.g., narcotics, prokinetic agents) should be discontinued for 48 hours prior to the recording.
The patient’s own physician must determine whether this interruption in drug therapy is
appropriate.
The following practical points will help to ensure a quality EGG recording
1.
2.
3.
4.
Record the EGG in a quiet room with subdued light
Avoid all loud noises or distracting voices
Position the patient in a comfortable chair or recliner.
Instruct the subject to keep arms and legs still and to avoid, in particular, any quick body
movements.
5. Talking should be avoided during the recording.
-7-
3.2 Preparing the Patient
1. Prepare to position the EGG electrodes as shown.
a) The RED EGG lead wire and
electrode is positioned in the midclavicular line (left side)
approximately two inches below the
left costochondral margin.
b) The BLACK EGG lead wire and
electrode is positioned at the midpoint between the xiphoid and
umbilicus.
c) The GREEN EGG lead wire and
electrode is positioned in the midclavicular line on the right side, two
inches below the right costochondral
margin. The GREEN EGG lead is
the reference or "ground" electrode.
2. Preparing the skin
a) Shave off abdominal hair that is present in these locations for electrodes 1, 2, and
3.
b) Gently abrade the skin in the areas of these electrode positions using a "BuffPuff” or a coarse cloth.
3. Positioning the electrodes on the skin:
a) Connect the color-coded EGG lead wires to the Human Interface Module, by
matching the lead wire color to the corresponding color-coded plug-in as
designated on the Module label.
b) Attach the pre-jelled electrodes to the snap-on ends of the EGG lead wires.
c) Remove the plastic covers from the adhesive side of the electrode, and place on
the skin according to the instructions in #1 above.
4. Positioning and connecting the belt for recording respiration rate:
• With the subject in a sitting position, attach the belt across the upper chest with
belt placed under the arm pits and the entire belt pulled snugly.
5. Recording of EGG and respiratory signals:
• Once the EGG and respiratory signals are stable, the baseline (preprandial) EGG
recording period can begin.
-8-
4 Program Operation
The 3CPM EGGSAS© program allows you to perform the following operations:
• Record a new study for either a new patient or open a prior study.
• Analyze the study to arrive at a diagnosis.
• Create and print reports for a study.
4.1 Starting the Program
The program may be started in one of 2 ways:
•
•
.
Double click on the desktop icon for the 3CPM EGGSAS© program,
Select the Start button, then All Programs, select 3CPM Company, and then 3CPM
EGGSAS.
Once the program is started, the main screen is displayed:
Figure: Opening Screen
-9-
5 Recording a Study
The program guides the user through the entire EGG recording process. The EGG recording
process follows the steps listed below in the order listed.
5.1 Selecting a Patient
Your may choose to record a study for a new patient or record another study for an existing
patient.
.
You may elect to start a study for a new patient in one of two ways:
• Select the icon for a new file, from the toolbar just under the top menu.
• Select File from the top menu, then select New Study, and then select New Patient.
You may elect to start a new study for an existing patient as follows:
• Select File from the top menu, then select New Study, and then select Existing Patient.
- 10 -
•
Then a screen is displayed that allows you to select the patient for the study.
Figure: Select Patient for Study
You select the patient in one of two ways:
• Double click on the patient name.
• Single click on the patient name and then select OK.
Cancel stops the study.
Once you have started a study, the demographics screen is displayed allowing you to enter (or
change) the patient demographics.
5.2 Resuming a Study
You may resume a study that has been previously paused as follows:
• Select File from the top menu, then selecting Resume Study.
• Then the same screen used in Selecting a Patient for a study is displayed that allows you
to select the patient whose study is to be resumed. This screen only shows those patients
whose study has been paused (see Baseline Recording).
• Once you select a patient, you will automatically be positioned to start the study (see Post
Stimulation Recording)
- 11 -
5.3 Entering Patient Demographics
Patient demographics are entered through the following screen.
Figure: Patient Demographics
In order to Continue the study, either a patient’s first and last name or a research reference
number is needed.
To enter a name, just type the first and last names in the appropriate field.
To enter a research reference number, click on box to the left of the Research reference number.
This enables the field to the right, and places the cursor in that field so that it is ready to accept
keyboard input. Then type in the number. NOTE - If you use a reference number the program
views it as a blind study and will blank out the patient’s name. The name is still saved in the
database, but will not be visible until the check box next to the Research reference number is
unchecked again. Any time that the Research reference number box is checked, only the
Research reference number will print on reports.
Once the demographics have been entered, click on Continue to continue with the study. If you
don’t want to enter all the demographics at this time, they may be entered later (see the section
on patient demographics).
- 12 -
Cancel stops the study without saving any information.
Save and Close saves the patient demographics and ends the study. The patient won’t be
available if you try to select a patient study as there is no study yet. However, if at a later date,
you start a study again with this patient, the program allows you to use the previously entered
patient demographics.
When Continue is selected, you may then enter pre-study information.
5.4 Pre-study Information
Pre-study information is entered through the following screen.
Figure: Pre-study Information
The time of the pre-test meal is entered as follows:
• Highlight the hours and either click on the up and down arrows to change the hours or
type in the hours. If you use the up and down arrows the AM/PM will automatically
change when appropriate.
• Press the Right Arrow key to highlight the minutes and either click on the up and down
arrows to change the minutes or type in the minutes.
• Press the Right Arrow key to highlight the AM/PM and either click on the up and down
arrows to change the AM/PM or type in the AM/PM.
- 13 -
Select any of the Indication for procedure items that apply and/or enter any Additional
Indications.
Enter the Attending physician, the Referring physician, and the Technician actually performing
the study.
This screen does not have to be filled in now. It may be filled in later by selecting Edit from the
top menu, then selecting Pre-study Information.
Select Cancel to stop the study.
When you select Begin Study, the screen for running the equipment test is displayed.
5.5 Equipment Test
This section of the study makes sure that the signals (EGG and Respiration) are stable. Both
signals must be stable for 2 minutes. The initial screen, shown below, shows the Respiratory
sensor and Gastric electrodes in large red dots. When these turn green, the system is ready to
start the baseline.
The EGG signal, shown in red is in the top graph. The Respiration signal, shown in black is in
the bottom graph.
To start the equipment test, select the Start Equipment Test button. When both the Respiratory
sensor and the Gastric electrodes turn green, the Begin Baseline button gets enabled. Then to
start the Baseline, select this button.
Equipment Test
Select Cancel to stop the study.
- 14 -
5.5.1 Equipment Test Failure/Error
After a given period of time, if the signals do not stabilize, you will see the following warning:
Signal Not Stabilized
If you select to continue in manual mode it is likely that you will not be able to analyze the data.
It is recommended that you cancel the test, check the proper attachment of connections both to
the device and the patient, then restart the test.
- 15 -
5.6 Baseline Recording
Select the Start Baseline button (see screen below) to start the baseline part of the study. The
baseline may last for up to 1 hour. Once there are enough minutes to analyze (4 minutes) the
baseline may be stopped. The count down clock in the upper left corner of the screen shows the
time remaining in the baseline period.
Figure: Baseline
When you select Stop Baseline to stop the baseline, the following warning is displayed. Select
Yes to stop the baseline and No to continue with the baseline. The baseline will continue to be
recorded until either Yes or No is selected.
If you select Cancel, it will stop the study.
- 16 -
5.7 Post Baseline Options
At the end of the baseline, there are 3 options:
1. Select Pause Study to pause the study. The following warning screen is displayed.
Select Yes to pause the study and No to continue with the study. It can then be resumed
later (Resuming a Study).
a. This feature is only used in the event that following the baseline recording, it is
necessary to pause the study in order to allow for patient repositioning.
2. Select Skip Stimulation Medium if there will be no stimulation medium given to the
patient prior to beginning the study. The program will take you immediately to Post
Stimulation Recording, where you may begin the study.
3. Select Stimulation Medium to give the patient some stimulation.
During this part of the study, the patient ingests some stimulation medium. When the patient is
finished, enter the description of the stimulation medium, the quantity, and units in the screen
shown below.
Figure: Stimulation Medium
Select Start study to begin recording the signals.
- 17 -
Select Cancel to stop the study. You will be asked if you are sure you want to cancel the study.
5.8 Post Stimulation Recording
Select Begin Study (from the screen shown below) to start recording the signals.
Figure: Study Phase
This lasts for up to 3 hours. The count down clock in the upper left corner of the screen shows
the time remaining in the study period.
If you select Cancel, it will stop the study without saving the data and all information will be
lost.
When you are finished with the study, select Finished to complete the study. The following
screen is displayed. While this screen is displayed, the study will continue.
Figure: Finish Study
If you have checked Finish the Study and selected OK the study will stop.
If you have not checked Finish the Study or selected Cancel, the study will continue.
- 18 -
5.9 Recording Events During Study
Events are such things as coughing, movement, nausea, etc. Events can be marked during both
the baseline and post-stimulation periods. To mark an event, move the mouse cursor over the
desired place on the EGG trace (the cursor will change shape to a pointer finger) and click the
left mouse button. The following screen is displayed.
Figure – Event Recorder
Check the event or events that occurred. You may also enter a description in the Description
box. Select OK to record the event or Cancel to cancel the event. Events are displayed as a blue
line along the axis of the graph of the data for the time period they are recorded in. Depending on
the reason for the event, these markers can help with the selection of good minutes during
analysis.
During the recording of an event, the system is still recording the signal.
- 19 -
5.10 Study Completed
Once the study is complete, it is generally a good idea to save it immediately. To save the study,
click on the icon for saving a file, . You can also select File from the top menu and then select
Save Patient.
When the study is complete, the raw EGG and respiration signals are displayed for the baseline
period. Any events that have been marked are also displayed.
Figure: Main Screen – Data Signal
Events may also be added at this time. Follow the same procedure as in recording events during
the study, Events.
- 20 -
5.10.1
Analyzing Baseline Period
The length of the baseline period is fixed.
Select the start and end of the good minutes by setting the Start minute and End minute and then
check Set Good Minutes check box.
Now you can go to the post baseline period, which is after the patient ingested the stimulation
medium. You can do this by using one of the 4 following methods.
• Select the go to next period icon, at the top of the screen.
• Select Goto from the top menu and then select Next period.
• Select the Analyze from the top menu and then select Post stimulation period 1. While
in this menu item (if you have completed analyzing the baseline period), you will notice
that there is a check mark next to the Baseline period menu item. This indicates that the
baseline period has been analyzed.
• Open the pull-down list at the top of the screen and select Post stimulation period 1.
- 21 -
5.10.2
Analyzing Post stimulation Periods
The post stimulations periods are displayed as follows.
Select the length of the initial period for analysis, by setting the Start minute and End minute.
Notice that, prior to selecting the initial period; the first post stimulation period includes all the
minutes of the study. When you select the length of the period, the remaining minutes (after the
last minute in the period) create the second post stimulation period. Check the Set Period
Length check box to set the length of the period.
Select the good minutes within the period just created by setting the Start minute and End
minute and then check Set Good Minutes check box.
This same procedure is used for selecting the period length and the good minutes to analyze for
any more post stimulation periods you wish to add.
- 22 -
5.10.2.1 Creating Periods
The program automatically creates one period after the baseline. At this point the period “Post
Stimulation Period 1” is not set as an actual period capable of analysis. It is simply the record of
the entire post stimulation period.
The rules for creating each period are:
• The previous period must have been created by selecting the start and end minute for that
period and from those minutes a start and end minute must be selected from the minutes
in that specific period.
• There must be at least 4 minutes available for analysis between the current period and the
previous period or baseline.
• The current period must be analyzed.
• There cannot be more than 46 periods (including the baseline).
• A period cannot be inserted before the baseline.
The act of creating a period by setting the length and good minutes creates the next period
automatically. That next period will contain all the remaining minutes of the recording.
5.10.2.2 Deleting a period
The program measures reactions over linear time. Therefore you can not delete a period. You
may reassign the minutes to create fewer periods where the minutes are distributed differently.
The most effective way to accomplish this is to use the “Reset Periods” button, allowing you to
start over. However, it is possible to reassign period and good minute lengths using the Set
Minutes toolbox on the right. **NOTE: If you had an initial reason to set periods and then
discovered that a different set of periods may lead to a different conclusion, using the “What If”
option is the recommended method.
5.10.3
Diagnosis
Once all the periods (baseline and post stimulation periods) have been analyzed, you may enter
your own diagnosis. In this Research Version, the program will only allow free text entry of a
diagnosis. You can display the Diagnosis screen by using one of the following methods.
• Select the recommendation icon,
from the top of the screen.
• Select Edit from the top menu and then select Diagnosis.
- 23 -
The following screen is displayed.
Figure: Diagnosis
When you are finished writing a diagnosis, select OK to cause the program to accept the
diagnosis.
5.10.4
Recommendations
Once a diagnosis has been entered, you will be able to enter recommendations. You can display
the recommendation screen by using one of the following methods.
• Select the recommendation icon, from the top of the screen.
• Select Edit from the top menu and then select Recommendations.
- 24 -
The following screen is displayed.
Figure: Patient Recommendations
Enter your recommendations and select OK to cause the program to accept the recommendations.
5.10.5
Respiration Rate
You can either enter the respiratory rates or modify them using this screen. You can display the
screen using the following method
.
Figure: Edit Respiration Rate
•
Select Edit from the top menu and then select Respiration.
- 25 -
Select the period in the list by clicking the left button of the mouse. Then enter the respiration
rate in the Change Respiration field. Finally to record the respiration rate, select the Set
Respiration button.
Select OK to cause the system to accept the rates.
6 Opening a Prior Study
To select a prior study, first display a list of patients and their studies by using one of the
following 2 methods.
• Select the icon to open an existing file, .
• Select File from the top menu and then select Open Prior Study.
If there is currently a study open, and you attempt to open another existing study, and have made
changes to the current patient information or study and have not saved them, the following
warning screen is displayed.
Figure: Warning – Save Patient
You have the following choices:
• Yes
Save the changes to the patient and/or the study and then display the list of patients
and studies.
• No
The changes to the patient and/or the study are discarded and then the list of patients
and studies are displayed.
• Cancel
The changes to the patient and/or the study are not saved and the list of patients and
studies is not displayed. The program keeps the current patient and study.
- 26 -
If the current study which you are working on is a What If scenario, and you attempt to open
another existing study, and have made changes to the current What If scenario (see What If) and
have not saved them, the following warning screen is displayed.
Figure: Warning – Save What If
You have the following choices:
• Yes
Save the changes to the What If scenario and then display the list of patients and
studies.
• No
The changes to the What If scenario are discarded and then the list of patients and
studies are displayed.
• Cancel
The changes to the What If scenario are not saved and the list of patients and studies
is not displayed. The program keeps the current patient and study.
The list of patients and the studies performed on them is displayed in the following screen.
Figure: Select Patient – Open Prior Study
- 27 -
You will notice that the Select Patient Screen now contains both the prior studies and any what if
scenarios which are those studies under the main study that are indented and preceded by a dash
(-).
If research reference numbers are being used, the reference number replaces the patient name.
Select a patient and a study in one of the following 2 methods.
• Double click on the patient name (not the date of study).
• Single click on the patient name and then click OK.
6.1 Re-analyzing the Study
6.1.1 Changing the Baseline
The first screen displayed, after selecting a patient and study, is the raw signals in the baseline
period.
Figure: Main Screen – Re-Analyze Baseline
Notice that the good minutes are already selected. These are the minutes that were selected
when the study was previously analyzed.
- 28 -
You may change the selected minutes by changing either the Start minute or End minute.
Notice that the Set Good Minutes becomes unchecked. You must check it again to accept the
new good minutes. (See Analyzing Base Period).
WARNING – Changing the baseline minutes will erase all selected minutes or subsequent post
stimulation periods. The What If scenario option should be used to perform reanalysis if you
would like to preserve the original analysis.
6.1.2 Change a Post Stimulation Period
A post stimulation period is displayed as shown in the following screen.
Figure: Main Screen – Re-Analyze Post Stimulation Period
Notice that the period length and good minutes are already selected. These are the period length
and minutes that were selected when the study was previously analyzed.
You may change the period length by changing either the Start minute or End minute. Notice
that the Set Period Length becomes unchecked. You must check it again to accept the new
period length. Also notice that the Set Good Minutes has become unchecked. See Analyzing
Post stimulation Periods for additional information.
You may change the selected minutes by changing either the Start minute or End minute.
Notice that the Set Good Minutes becomes unchecked. You must check it again to accept the
new good minutes. (See Analyzing Base Period).
- 29 -
WARNING - Changing the post stimulation periods or minutes will erase all prior selected
minutes or subsequent post stimulation periods, if the newly selected periods or minutes are
saved. The What If scenario option should be used to perform reanalysis if you would like to
preserve the original analysis information. Use the Reset Periods Button and then set the proper
periods you wanted
6.1.3 Changing Events
The events for the current period may be changed using the Events area in the lower right corner
of the screen.
Select an event from the list. The description is displayed below it.
Select Edit to change the event. You may change the event in the same manner as mentioned in
the section on Events. You cannot change the time of the event.
Select Delete to delete the event. The following warning is displayed.
Select Yes to delete the event and No to if you don’t want to delete the event.
6.1.4 Adding Events
New event may be added in the same manner as described during recording a study (see Events).
6.2 Changing the Diagnosis
Select Edit from the top menu, and then select Suggested diagnosis. This displays a window
that allows you to change the diagnosis in the same manner as mentioned in the section on
Diagnosis
If you have previously entered a diagnosis, you may also change it by selecting Edit from the top
menu and then selecting Suggested diagnosis.
- 30 -
6.3 Changing the Recommendation
Select Edit from the top menu, and then select Recommendations. This displays a window that
allows you to change the recommendations in the same manner as mentioned in the section on
Recommendations.
6.4 Changing the Pre-study Information
Select Edit from the top menu, and then select Pre-Study Information. This displays a window
that allows you to change the pre-study information in the same manner as mentioned in the
section on Pre-study Information.
6.5 Stimulation medium
Select Edit from the top menu, and then select Stimulation medium and quantity. This displays
a window that allows you to change the stimulation medium in the same manner as mentioned in
the section on Stimulation Medium.
6.6 Change number of minutes per graph
The number of minutes, as they are viewed, per graph is initially set to 4 minutes. This may be
changed by selecting View from the top menu and then selecting Change number of minutes per
graph. The following window is displayed.
Figure: Change number of minutes per graph
Enter the number of minutes you want to see displayed on each graph and then select OK to save
the number of minutes per graph. The graphs will change according to the number of minute
entered.
- 31 -
7 What If Scenario Option
This option allows the user to perform reanalysis of a prior analyzed study, while keeping the
original study data analysis intact. There is no limit to the number of What If analyses that can
be performed based on an original study. You can also use the symbol.
The original study must be analyzed and saved before the What If window is available.
The data in a What If scenario is as follows:
• Period start minutes
• Period lengths
• Selected good minutes
• Respiration rates
7.1 No Prior What If Scenarios
The What If window is displayed as follows if there are no prior What If scenarios.
Figure: What If Scenario – No What If scenarios
The “NEW” item is automatically selected. Enter a description in the Description field. The
choice: “NEW” or “Original study” is not allowed as What If descriptions.
- 32 -
After the description is entered, select the Save button to save it. After saving the What If
scenario, the Recall button becomes enabled. Then select either Close or Recall button to go
back to the main display. The description is displayed above the graphs and to the right of the
period dropdown list.
7.2 What If Scenarios
The What If window is displayed as follows if there are What If scenarios for a study.
Figure: What If Scenario with What If scenarios
The list is ordered by descending date and time (i.e. the most recent date and time is at the top of
the list). The “NEW” and “Original study” listings are always displayed first in the list.
The What If scenario that is currently being viewed on the main display is automatically
selected.
Now the Recall and Delete buttons are enabled.
A What If scenario is loaded by either double clicking on the scenario in the list or selecting it
and then selecting the Recall button.
A What If scenario is deleted by selecting the item in the list and then selecting the Delete
button. If the currently viewed scenario is deleted and the user just selects the Close button to go
back to the main display, the original study is displayed (the What If description is no longer
displayed).
- 33 -
7.3 Saving What If Scenarios and Studies
The data for a What If scenario and the study data are treated differently when saved.
If a What If scenario is loaded, the Save toolbar button, will save only the data items in the
What If data (see the list above). Any other items that have been changed will not be saved at
this time.
Example:
If a user changes the good minutes in a given period in the currently loaded What If
scenario and also changes the diagnosis and selects the Save toolbar button, only the
data for the What If scenario will be saved. The diagnosis will not be saved. Then the
user opens the What If window and will be prompted to save the patient data (i.e. the
diagnosis).
Each time the What If window is opened, the program checks for any unsaved data in both the
What If scenario and the study. If either or both have unsaved data, the user will be prompted to
save the data.
8 RSA
The RSA is a graph of the spectral estimates of the EGG signals in 4-minute epochs.
The full screen RSA graph can be viewed using one of the following methods:
• Select the RSA icon, from the top of the screen.
• Selecting Analyze from the top menu and then select RSA.
- 34 -
The graph is also included in the second page of the report if included in the report (see
Configuring Reports).
9 Reports
Reports are only available after the entire study has been analyzed.
The default or standard report consists of 2+ pages organized as follows:
• Page 1
− Facility information at top of page
− Patient information
o Patient name
o Date of study
o Attending physician
o Referring physician
o Technician
o Indications
o Stimulation medium
o Diagnosis
o Recommendations
o Signature and date
• Page 2
− RSA
• Page 3 plus required additional pages
− Raw data graphs of the selected minutes. One graph per period.
9.1 Configuring
Reports can be configured to include/exclude the following items.
• Patient information
• RSA
• Data Sheet
• Raw data graphs of the selected minutes. One graph per period.
• Graphs of the entire raw signal starting on the next available page until all graphs are
printed.
• Event log
- 35 -
Configure the graphs by selecting Report from the top menu and then selecting Configure
Report. The following screen is displayed.
Configure Report
Select the items you want included in the report or de-select the items that you want removed
from the report. Select OK to put the items in the report.
Select Cancel to leave the report unchanged.
- 36 -
9.2 Facility Information
Facility information can be entered at any time. Select Report from the top menu and then select
Facility/practice information. The following screen is displayed.
Figure: Facility Information
Enter the information and select Save and close to save the information in the database.
Cancel discards any newly entered information and leaves the facility information unchanged in
the database.
The information initially entered will appear at the top of all reports, unless edited.
9.3 View/Printing
Once the study has been analyzed, the report can be viewed by selecting Report from the top
menu and then selecting View report. While the report is being viewed, it can be printed.
Print the report using one of the two following methods.
• Select the print icon, from the top menu.
• Select Report from the top menu and then select Print report.
- 37 -
Either of these methods displays a standard Windows Print screen.
Select Printer
10 Patient Information
The following patient information items require that a patient study has been read into the
program or that a new study has just been completed.
- 38 -
10.1 Demographics
Patient demographics can be edited by selecting Edit from the top menu and then selecting
Patient demographics. The patient demographics screen below is displayed.
Figure: Edit Patient Demographics
When you have entered and/or changed the desired items, click OK to have the system accept the
changes and close the screen.
Cancel closes the screen and discards all changes.
You may also view the patient demographics by selecting View from the top menu and then
selecting Patient demographics. The patient demographics screen above is displayed. You
cannot change anything.
- 39 -
10.2 Medications
Patient medications can be edited by selecting Edit from the top menu and then selecting Patient
Medications. The patient medications screen below is displayed.
Figure: Edit Medications
You can select a medication by selecting the Date of study (i.e. clicking on the Date of study).
Once you select a date of study, the selected date is displayed in the Date field and the
medication is displayed in the Medication field. The medication can be changed by typing in
any changes in the Medication field and then selecting Update Medication.
You can go to the selected study in one of two ways:
• Select the study from the list and then select Go to Study.
• Double click on the Date of study in the list.
If you have selected a different study than what is currently selected and made changes to the
current patient information or study and have not saved them, the warning screen shown in figure
Warning – Save Patient is displayed.
- 40 -
If you have selected a different study than what is currently selected and made changes to the
current patient What If scenario and have not saved them, the warning screen shown in figure
Warning – Save What If is displayed.
You have the following choices:
• Yes
Save the changes to the patient and/or the study and then display the selected study.
• No
The changes to the patient and/or the study are discarded and then the selected study
is displayed.
• Cancel
The changes to the patient and/or the study are not saved. The selected study is not
displayed.
You may also view the patient medications by selecting View from the top menu and then
selecting Patient Medications. The patient medications screen above is displayed except that
you cannot select Update Medication and you will not be able to change a medication. From
this screen you may only select a study and go to it. This is done in the same manner as
described above.
10.3 Diagnostic History
Diagnostic history can be edited by selecting Edit from the top menu and then selecting Patient
diagnostic History. The patient diagnostic history screen below is displayed.
Figure: Diagnostic History
- 41 -
You select a diagnosis by selecting the Date of study (i.e. clicking on the Date of study). Once
you select a date of study, the selected date is displayed in the Date field and the diagnosis is
displayed in the Diagnosis field and Go to study is enabled. The diagnosis cannot be changed
here. You must go to the study to change the diagnosis.
You can go to the selected study in one of two ways:
•
•
Select the study from the list and then select Go to study.
Double click on the Date of study in the list.
If you have selected a different study than what is currently selected and made changes to the
current patient information or study and have not saved them, the warning screen shown in figure
Warning – Save Patient is displayed.
If you have selected a different study than what is currently selected and made changes to the
current patient What If scenario and have not saved them, the warning screen shown in figure
Warning – Save What If is displayed.
You have the following choices:
•
Yes
Save the changes to the patient and/or the study and then display the selected study.
•
No
The changes to the patient and/or the study are discarded and then the selected study
is displayed.
•
Cancel
The changes to the patient and/or the study are not saved. The selected study is not
displayed.
You may also view the diagnostic history by selecting View from the top menu and then
selecting Patient diagnostic History. The patient diagnostic history screen above is displayed.
The same operations are available as described above.
- 42 -
11 Navigating the Baseline and Post Stimulation Periods
Navigating between the baseline period and the post stimulation periods can be accomplished in
several ways:
•
•
•
Use the View menu at the top of the screen.
Select from the first section of menu items to go to the specified period.
Use the Goto menu at the top of the screen.
Select from the menu items to go to the start of the study (baseline), the previous
period, the current period, the next period or the end of the study (last period).
Use the Analyze menu at the top of the screen.
Select from the first section of menu items to go to the specified period.
Also note that if the period has been analyzed there is a check mark next to the
menu item. This is an easy way of telling if a period has been analyzed.
•
•
Use the dropdown list next to the patient name and date of study.
Select the dropdown list and then select the period to go to that period.
Use the Goto icons at the top of the screen just below the menu items.
Uses the icons as follows:
This displays the baseline period.
This displays the previous period. This has no effect if the baseline period is
being displayed.
This displays the current period. This is useful if viewing the report or RSA and
you wish to go back and look at the period you were previously viewing.
This displays the next period. This has no effect if the last post stimulation period
is being displayed.
This displays the last post stimulation period.
- 43 -
12 Backing Up and Restoring Data
You can backup or restore your data by selecting File from the top menu and then selecting
Backup or Restore. The following screen is displayed.
Figure: Backup/Restore Data
12.1 Backup
Select Backup. A standard Microsoft Windows “Save as” screen is displayed. The File name is
“3CPM EGGSAS.MDB”. The file name must not change. Navigate to the directory (including
Network directories) or drive where you want to backup the data to and select Save.
For example, your data is on the C: drive and you select D: drive (the CD drive) to backup up
your data to. Once you select Save from the standard Microsoft Windows “Save as” screen, the
above screen is changed to:
Figure: Backup Data
- 44 -
Select Start to start the backup. During the backup, the file being copied is displayed under File
being copied. Also the field next to the text “Backup” displays the progress of the backup.
If the backup has completed successfully, the following screen is displayed.
Figure: Backup Complete
Select OK. Then select Close from the above screen.
If the backup fails, an appropriate error message is displayed indicating what may be wrong.
The following is a list of possible errors.
• There is no destination disk in the selected drive.
• The destination disk is full.
• The file already exists. This message is only displayed once. If you elect to overwrite
the first file, then all additional files are overwritten.
• There is an error writing to the directory/disk. This may occur for a number of reasons.
− If you are writing to a CD, try another CD, the CD may be damaged.
− If you are writing to a directory (either on the local PC or on the network) make sure
you have permission to write.
12.2 Restore
To restore data from a backup, exit the program, restart the program and select File from the top
menu and then select Backup or Restore.
IMPORTANT NOTE:
Restoring data will only work if it is the first action performed after starting the
program.
The initial Backup/Restore data screen is displayed (Figure: Backup/Restore Data).
Select Restore. A standard Microsoft Windows “Open” screen is displayed. The File name is
“3CPM EGGSAS.MDB”. The file name must not change. Navigate to the directory (including
Network directories) or drive where you have the backup data you want to restore and select
Open.
- 45 -
For example, your backup data is on the D: drive in the directory “EGGSAS data 13-14 Feb 04”.
Once you select Open from the standard Microsoft Windows “Open” screen, the screen shown in
Figure Backup/Restore Data is changed to:
Figure: Restore Data
Select Start to start the restore. During the restore, the file being copied is displayed under File
being copied. Also the field next to the text “Restore” displays the progress of the restore.
If you are restoring over an existing database, you will get the following message.
Figure: Overwrite
If you want to overwrite the existing database and data files, select Yes and the restore operation
will continue. If you don’t want to overwrite the existing database and data files, select No and
the restore will stop.
- 46 -
If the restore completes successfully, the following screen is displayed.
Figure: Restore Complete
Select OK. Then select Close from the above screen (Figure: Restore Data).
If the restore fails, an appropriate error message is displayed indicating what may be wrong. The
following is a list of possible errors.
• There is no source disk in the selected drive.
• The destination disk is full.
• The file already exists. This message is only displayed once. If you elect to overwrite
the first file, then all additional files are overwritten.
• There is an error writing to the directory/disk. This may occur for a number of reasons.
− If you are writing to a directory (either on the local PC or on the network) make sure
you have permission to write.
− If you have performed any other action with the program, close the program and
restart it.
13 Closing the Program
The program can be closed in the following ways:
• Click on the X in the upper right corner of the main program screen.
• Select File from the top menu and then select Exit.
If you made changes to the current patient information or study and have not saved them, the
warning screen shown in figure Warning – Save Patient is displayed.
If you made changes to the current patient What If scenario and have not saved them, the
warning screen shown in figure Warning – Save What If is displayed.
You have the following choices:
• Yes
Save the changes to the patient and/or the study or the What If scenario and then close
the program.
• No
The changes to the patient and/or the study or the What If scenario are discarded and
then the program is closed.
• Cancel
The changes are not saved and the program is not closed.
- 47 -
14 EGGSAS Research Version Menu Overview
This is a step by step overview of each menu item in the menu bar and their related submenus.
This written to give a basic understanding of what each choice does. Why and when to use each
is defined throughout the users manual.
14.1 The File Menu
The best way to look at what choices you will find here is that each choice made is a choice
related to an entire study.
14.1.1 New Study
Start a new study. It gives you two choices:
14.1.2 New Patient
Starts with the last opened database and brings up
the Patient Demographics screen to start collecting
study information.
14.1.3 Existing Patient
This option brings up the Select Patient screen in
the last opened database.
14.1.4 Open Prior Study
This also brings up the Select Patient Screen, but
you will now see any “What If” scenarios for the
patient as choices that are indented below the initial study. Once a study is selected, this option
takes you straight to the baseline page, skipping the data entry screens.
14.1.5 Save Patient
When not grayed out it allows you to save the present study
14.1.6 Resume Study
This allows you to resume a study that you had previously paused.
- 48 -
14.1.7 Backup or Restore
This takes you to the screen that allows you to backup a database and all studies to a new
location. It also allows you to restore the backed up database.
14.1.8 Print
This does the same thing the “Print Icon” does, which is to bring up the printer selection box and
allow you to print the report. NOTE: The report must be displayed to print
14.1.9 Print Preview
This option takes you to the Report for reviewing prior to printing
14.1.10 Print Setup
Allows you to pre-select a printer to use for the report.
14.1.11 Recent Files
This is a future enhancement to the program and is therefore grayed out.
14.1.12 Exit
Exit and close the program
14.2 The Edit Menu
This and all remaining menu choices apply to a study that
has already been opened in the program. Edit options are
for making changes in the study information. Most options
take you to the section defined so you can make changes to
the data.
The Edit options take you to the screen noted by the
option. This is true for all but the What If… option
- 49 -
14.2.1 What If…
The “What If…” option opens a screen that allows you to run multiple analyses on a single
study. See the What If… section of the manual
14.3 The View Menu
This is a navigation menu allowing you to move
through each aspect of the current study.
14.4 The Goto Menu
This is also a navigation menu allowing you to move quickly
to parts of the current study data.
14.5 The Analyze Menu
This menu shows the current status of what part of the study is available for analysis.
- 50 -
14.5.1
Prior To Setting Baseline and Post Procedure Time
The Analyze Menu starts with the last two options
grayed out. This is because the menu is dependant
on your setting the baseline and period’s length
and good time. As you set each, a check mark
appears beside it in the menu.
14.5.2
After Baseline and All Periods are Set
Once all the periods are set for analysis and the
checkmarks are visible, you can input your
diagnosis. Also once the periods are set the
analysis engine is able to create the RSA for the
study.
14.6 The Reports Menu
This menu allows you to view the report generated by the analysis data selected and includes
supporting analysis data.
14.6.1 View Report
This choice generates the report
and presents it on the screen in
the format it will print.
- 51 -
14.6.2 Print Report
The Print Report option brings up the printer selection screen for printing the report.
14.6.3 Create Spreadsheet of Data Sheet
This selection will export the data in the data sheet that is used in the report into a Comma
Separated Value (.csv) file that can be opened by most spreadsheets. This allows the collection
of report data in spreadsheet form in one workbook for multiple studies.
14.6.4 Configure Report
This option brings up the report configuration screen.
14.6.5 Faculty/practice information
This brings up the screen to enter information on your faculty/practice.
NOTES:
- 52 -