1
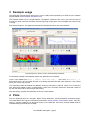
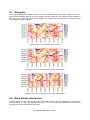
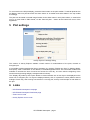
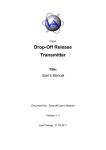
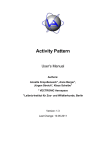
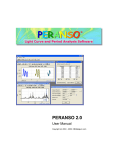
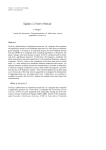
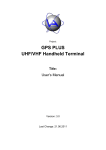
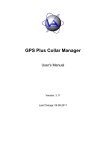
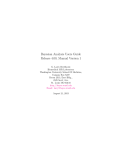
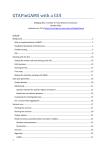
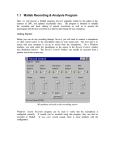
Activity Explorer
User's Manual
Author:
Anne Ghisla,
VECTRONIC Aerospace
Version: 0.0.1 PREVIEW
Last Change: 15.09.2014
Activity Explorer Tutorial
1 Introduction
Activity Explorer is a software application that analyses and displays time series of activity data from
VECTRONIC Aerospace collars.
The current release is 0.0.1, a preview version.
The application is available for Windows (Vista, Seven and 8), Linux and Mac OSX. It is available both as
MSI (Microsoft installer) and as source code. The application is free software, licensed under GPL
(General Public License) v3.
Activity Explorer's startup screen, with loaded test dataset.
2 Installation
2.1 Windows
If you are using Windows Vista, Seven or 8, download the MSI installer, save it on your computer and run
it. You are able to install the software in the folder of your choice. The default is the Programs folder. The
installer provides a 32bit version of the software, that works on both 32bit and 64bit systems. As final step,
the installer will add a shortcut on the desktop.
You can cleanly uninstall the software by using the Installed applications tool that is part of System
settings, or re-running Activity Explorer installer. The uninstallation procedure could not be able to remove
the shortcut on the desktop. In that case, you will need to remove it manually.
2.2 Linux
The application is available as a Python package, in source format. It is recommended to use pip, that will
install all dependencies and is capable of cleanly uninstall the application.
Please download from VECTRONIC Aerospace website the following packages:
• Timbre 1.1.0
• Activity Explorer 0.0.1
VECTRONIC Aerospace - page 1
Activity Explorer requires Python 2.7. It is the stable branch of Python and is usually already available on
Linux distributions.
Two Python packages need to be installed first: wxPython and Timbre.
• Please install wxPython according to your distribution's guidelines: usually, it means installing it from
package manager (version 2.8.12 or higher, but not version 3).
• Afterwards, install Timbre with pip.
Finally, it is possible to install Activity Explorer from source package, as usual with pip. The installation
procedure will install other Python dependencies automatically.
Installation can also be performed in a virtualenv. If you already installed wxPython system-wide, you can
link it in the virtualenv instead of installing it again.
After installation, start the program with the command:
activityexplorer
To make a shortcut on your desktop, simply add it manually, specifying the command's location and the
icon, or follow the guides of your desktop manager to add a new application to the system menu. For
example, KDE procedure is explained here .
2.3 Mac OSX
There is currently no installer for Mac OSX, but it is possible to install Activity Explorer from source.
Installation instructions are the same as for Linux.
2.4 Support
For any issue with installation or execution of the program, please send a mail to
[email protected] with a few details on the computer, operating system version and
text of the error message, or a description of what is happening. If the problem is caused by a
programming error, a new version of the application that includes its solution will be provided as soon as
possible.
VECTRONIC Aerospace - page 2
3 Example usage
The application imports data in GDX format. This is a XML format exported by our GPS PLUS X software
(downloadable at VECTRONIC-Aerospace.com).
This example makes use of a sample dataset. The dataset, related to collar 1234, covers a time frame of
around one month, between mid March and the beginning of April 2013, and is sampled with activity mode
1 setting.
Start Activity Explorer. The application will load this test data and show the main interface:
Activity Explorer's startup screen, with loaded test dataset.
It is therefore possible to immediately explore the application's functionality.
Load a new dataset from Data > Import from GDX file... menu item, or Control - O
keyboard shortcut. The command will open a file dialog that filters files with GDX extension. Pick a GDX
file of your choice and click OK.
The application loads the dataset and displays summary information (collar ID, mode, list of continuous
time series with related number of observations). Check if the summary reflects the expected content of
the file, then press OK to start analysis and plotting.
After processing, all plots are updated to show the current dataset.
4 Plots
The four displayed plots are: Actogram, Mean activity distribution, Activity distribution and Spectrogram.
The interpretation of the plots is extensively presented in Activity Pattern documentation (PDF). Part Two,
page 77 onwards, explains how biological cycles can be detected, and which potential pitfalls shall be
considered during the analysis of results.
VECTRONIC Aerospace - page 3
4.1 Actogram
The actogram displays the dataset contents as a two-dimensional map, with dates increasing from top to
bottom and the daytime from left to right. Optionally, the times when the sun reached certain altitudes on
each day in the chart’s time range can be added as an overlay. See Plot settings for instructions about
how to adjust actogram settings.
Actogram, each row corresponds to one day
Actogram, each row corresponds to one day, with sunlines
Actogram, each row corresponds to two days, with sunlines
4.2 Mean activity distribution
This plot shows how the mean activity varies in time. Each point in the plot represents the average raw
value of activity of a day, with standard error bars. It is an overview of the overall activity over a long
period of time, easier to read than other plots.
VECTRONIC Aerospace - page 4
Mean activity distribution of test data.
4.3 Activity distribution
This function plots the distribution of values in the raw data. Each vertical bar represents the cumulative
distribution of raw values of a particular day. The absolute value of a point is its y coordinate and the
associated density is coded by color.
Unlike activity plot, this plot does not show activity values ordered by time, rather it groups them in blocks
of the same value.
Activity distribution of test data.
4.4 Spectrogram
The spectrogram identifies periodicities in the dataset.
This function calculates and plots a Lomb-Scargle spectrogram of the data. Each line is a separate
spectrum of a window 7 days long. From one line to another the window is shifted by one day, i.e. one day
is removed from the beginning and another one is appended at the end.
The x axis is labeled with plain numbers representing the frequencies relative to the chosen window
length of 7 days. Frequency number 1 has a period length of 7 days, frequency number 7 of (7 days / 7) =
1 day, frequency number 14 of (7 days / 14) = 12 hours, etc. The current window length does not detect
any periodicity longer than a week, but is able to show cycles of 2 hours (x=84). The colors of the graph
show how strongly a given periodicity is detected in the dataset, on a scale of blue (not detected) to red
(strong match).
The test dataset shows a noticeable 6-hour periodicity in the first weeks, marked by a red bar in the plot
over value 28, then a time period with no relevant periodicity, then finally noticeable cycles around 28 (6
hours), 21 (8 hours) and 14 (12 hours). Most of the plot area with values above 28 does not show
periodicity.
VECTRONIC Aerospace - page 5
Please refer to Activity Pattern manual - section 7: Rhythm analysis, Harmonic Part and Degree of
Functional Coupling for a more detailed treatise on the subject.
Spectrogram of test data.
4.5 Zoom and activity channel selection
By default the application displays the first activity channel (x) and the whole dataset. If the dataset is too
big to fit the plots, or is too densely displayed, you can zoom on a smaller area of the plot by using the
Zoom buttons of each plot. To zoom all plots on the same time interval, select start and end dates on the
top toolbar, then press the "Refresh plots" button.
Test data, zoomed on narrower date range.
Note that altering the zoom from the toolbar below the plot does not change the dates displayed on top.
VECTRONIC Aerospace - page 6
To come back on the full plot display, press the Home button on the plot's toolbar. To take all plots back to
full display, take one plot back with the Home button of its toolbar and select dates in the top toolbar
accordingly.
The plots can be saved in several image formats via the Save button in each plot's toobar, or saved all at
once in a given folder in PNG format, via the "Save all plots..." button at the bottom left corner of the
application.
5 Plot settings
Activity Explorer's Settings dialog.
This version of Activity Explorer enables a small number of customisations of the plots, focused on
Actogram plot.
It is possible to add sunset/sunrise lines to actogram, by checking "Display sun lines" in Settings dialog,
and specify mean coordinates of the dataset, in latitude/longitude format. This information enables the
software to calculate the time of sunrise and sunset for each day, one hour after the beginning of the
nautical morning/evening twilight (12 degrees above horizon).
The "Display days side by side" option allows to choose between one or two days to be displayed on the
same row of Actogram plot. If 2 days are displayed side by side, it is possible to notice patterns around
midnight of each day, that would go unnoticed on a one-day plot, as they would be split on both sides of
the plot.
6 Links
• VECTRONIC Aerospace homepage
• VECTRONIC Aerospace Downloads page
• Timbre source code
• Activity Explorer source code
VECTRONIC Aerospace - page 7