1
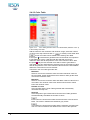
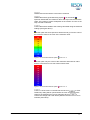
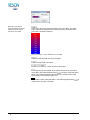
User Manual PDS2000 LiteView Version 1.0.2 October 2011 RESON B.V. Stuttgartstraat 42- 44 3047 AS Rotterdam The Netherlands Tel.: +31 (0)10 245 15 00 www.reson.nl Amendment Record Sheet Rev. Date Reason for Modifications 1.0.2 27/10/2011 Manual updated to PDS2000 LiteView version 3.7.0.13 1.0.1 10/06/2010 New RESON logo added. 1.0.0 25/09/2009 First version of the PDS2000 LiteView Manual. Contents 1 Introduction 1 1.1 PDS2000 LiteView.................................................................................................. 1 2 PDS2000 LiteView 3 2.1 Introduction ............................................................................................................. 3 2.2 Tree View................................................................................................................ 4 2.2.1 Add Data ....................................................................................................... 4 2.2.2 Remove Data ................................................................................................ 4 2.2.3 Full Path Name ............................................................................................. 5 2.3 Parameters ............................................................................................................. 5 2.3.1 Grid Model..................................................................................................... 5 2.3.2 3D Design Model .......................................................................................... 6 2.4 Area Viewer ............................................................................................................ 6 2.4.1 Navigation in the Area Viewer....................................................................... 7 2.4.1.1 Rotate the Data ................................................................................... 7 2.4.1.2 Shift the Data ....................................................................................... 8 2.4.1.3 Zoom in/out in the Data ....................................................................... 8 2.4.1.4 Scale the Data ..................................................................................... 8 2.4.1.5 Center the Data ................................................................................... 8 2.4.2 Area Viewer Toolbar and Context Menu ....................................................... 8 2.4.2.1 Beam Color Mode.............................................................................. 11 2.4.2.2 Area Viewer Properties ..................................................................... 12 2.4.2.3 Color Table ........................................................................................ 14 PDS2000 LiteView - User Manual Contents • i Figures Figure 2-1 Figure 2-2 Figure 2-3 Figure 2-4 Figure 2-5 Figure 2-6 Figure 2-7 Figure 2-8 Figure 2-9 Figure 2-13 Figure 2-14 Figure 2-15 Figure 2-16 PDS2000 LiteView with multibeam data and a grid model opened .....................................3 Popup menu to add data to the view ...................................................................................4 Tree view with multibeam data and a grid model ................................................................4 Popup menu to add or remove data ....................................................................................5 Parameters for a grid model ................................................................................................5 Parameters for a 3D design model ......................................................................................6 Area Viewer with the cross and high-resolution data around the edit circle ........................7 Spotlight window ..................................................................................................................9 Area Viewer with a measure window with a distance, bearing and elevation between two points ..............................................................................................................9 Color Table in the Area Viewer ......................................................................................... 10 Properties of the Area Viewer ........................................................................................... 12 Color Table generator with a color table added (between 0 and -4) to the existing color table.......................................................................................................................... 14 Color table with the option from 0 to -4 ......................................................................... 15 Color table with the option from 0 to -4 ......................................................................... 15 Color Table Entry .............................................................................................................. 16 Value -1.90 is added to the color table ............................................................................. 16 ii • Figures PDS2000 LiteView - User Manual Figure 2-10 Figure 2-11 Figure 2-12 1 Introduction 1.1 PDS2000 LiteView The PDS2000 LiteView is a freeware viewer which can be used to view PDS2000 data files. The viewer will read the PDS2000 logdata files, grid models and 3D design models. The multibeam data will be extracted from the logdata files and will be visible in the viewer. No dongle is required to run PDS2000 LiteView. The Area Viewer is a true viewer; this means that the data cannot be adjusted in the viewer. For editing the data, the PDS2000 Editing module in PDS2000 has to be used. In the next chapter (see pagexxx) will be explained how to add data to the viewer and how the parameters and settings in the viewer can be modified. This manual is also available as a HTML Help file. Press F1 or select Help > Help Topics to open the PDS2000 LiteView help file. PDS2000 LiteView - User Manual Introduction • 1 2 PDS2000 LiteView 2.1 Introduction At the moment the PDS2000 LiteView can read the following data: Multibeam Data; extracted from the PDS2000 Logdata files Grid Models 3D Design Models The PDS2000 LiteView is a window that has an Area Viewer with on the left site a tree view with below the tree view the parameter view with the parameters of the selected file. Figure 2-1 PDS2000 LiteView - User Manual PDS2000 LiteView with multibeam data and a grid model opened PDS2000 LiteView • 3 2.2 Tree View Before the data can be shown in the Area Viewer of the PDS2000 LiteView the data has to be added in the tree view. In the tree view the three different data types are displayed. 2.2.1 Add Data There are several ways to add data to the tree view. First select the data type that has to be added, then three different methods can be used. Click with the right mouse button in the tree view and a popup menu will be opened. Figure 2-2 Popup menu to add data to the view Select the option Open… and the Open dialog is opened. Click on top of the tree view on and the Open dialog is opened. Select the menu option File > Open… and the Open dialog is opened. Select in the Open dialog one or more data files and the data will be shown in the Area Viewer. Next to these three methods the drag & drop option is available to add data to the tree view. Drag files to the tree view and automatically the data will be opened in the Area Viewer. In the tree view the selected data will be added to the tree (see below). Figure 2-3 Tree view with multibeam data and a grid model Only the data that is checked ( ) will be displayed in the Area Viewer. If only a part of the data is checked then the check is displayed as 2.2.2 Remove Data Added data files can be removed from the tree view. Select the data file or for the multibeam the Multibeam x (x is the number of the multibeam). If for one data file more multibeams are available then only the selected computation will be removed. After the selection of the data file or the multibeam three different methods can be used to remove the selected data. 4 • PDS2000 LiteView PDS2000 LiteView - User Manual Click with the right mouse button in the tree view and a popup menu will be opened. Figure 2-4 Popup menu to add or remove data Select the option Close to remove the selected data file. Click on top of the tree view on removed. and the selected data file is Select the menu option File > Close and the selected data file is removed. 2.2.3 Full Path Name The added files can be displayed with their full path name or just with the file name. Click on top of the tree view on and when the button is on the full path names for all the added files will be displayed. If the button is off only the file name is displayed. 2.3 Parameters Only for the grid model and 3D design model the parameters can be displayed. Select a grid model or 3D design model and the parameters, which are only valid for that selected file, will be displayed below the tree view. Select one of the items and below the parameter list the item can be modified. Click on Area Viewer. to apply the modifications to the data in the 2.3.1 Grid Model The displayed parameters are only valid for the selected grid model. Each grid model in the Area Viewer will have its own parameter settings. Figure 2-5 Parameters for a grid model The parameters for a grid model are: Transparency The grid model can be made transparent, the transparency is between 0 and 100; 0 is no transparency and 100 is complete transparent. Use the slider to adjust the transparency. Resolution The grid model can be drawn with different levels of detail (resolution). The level can be set in five steps from very low to very high. Show Data Boundaries If Enabled, the boundaries of the data blocks of the grid model will be displayed in the Area Viewer. PDS2000 LiteView - User Manual PDS2000 LiteView • 5 2.3.2 3D Design Model The displayed parameters are only valid for the selected 3D design model. Each 3D design model in the Area Viewer will have its own parameter settings. Figure 2-6 Parameters for a 3D design model The parameters for a 3D design model are: Model Display Mode The 3D design model can be displayed in three different modes in the Area Viewer; Solid, Wireframe and Vertex. Wireframe shows the outlines of the planes in the 3D design model. Vertex shows the points that build up the model. Color Mode The 3D design model can be displayed in the two different color modes, Fixed or Depth. Fixed is that the model is displayed with the color as specified in the option Color (see below). Depth is that the model is displayed with the colors of the depth color table as selected in the Properties of the Area Viewer (see page 12). Color Select the color for the 3D design model; only valid when the Color Mode is set on Fixed. Transparency The 3D design model can be made transparent, the transparency is between 0 and 100; 0 is no transparency and 100 is complete transparent. Use the slider to adjust the transparency. 2.4 Area Viewer The Area Viewer is only a viewer, it is not an editor. Next to the multibeam data, it can show grid models and 3D design models in 3D. The multibeam areas that are covered by the edit circle will be displayed in high-resolution, all other multibeam data is shown in low-resolution with the right colors. 6 • PDS2000 LiteView PDS2000 LiteView - User Manual Figure 2-7 edit circle Area Viewer with the cross and high-resolution data around the 2.4.1 Navigation in the Area Viewer Because the Area Viewer has three dimensions, which are shown on a two-dimensional screen, a special way to navigate in the viewer is created. Click with the mouse in the viewer to make the viewer active. Otherwise the keys used to navigate in the viewer will not work. 2.4.1.1 Rotate the Data The center of the rotation is always the center of the view. The left mouse button or the mouse wheel pressed and dragging the mouse around will rotate the data in the view. Rotate the data clockwise. Drag the mouse to the left or use the Shift + left arrow keys. Rotate the data counter-clockwise. Drag the mouse to the right or use the Shift + right arrow keys. Rotate the bottom of the screen (near the user) upwards. Drag the mouse to the top of the viewer or use the Shift + up arrow keys. Rotate the top of the screen (far from the user) upwards. Drag the mouse to the bottom of the viewer or use the Shift + down arrow keys. PDS2000 LiteView - User Manual PDS2000 LiteView • 7 2.4.1.2 Shift the Data With the Shift key + left mouse button or Shift key + mouse wheel pressed and dragging the mouse will shift the data only in a horizontal direction. Shift the data to the left. Drag the mouse to the left or use the left arrow key. Shift the data to the right. Drag the mouse to the right or use the right arrow key. Shift the data away from the user. Drag the mouse to the top of the viewer or use the up arrow key. Shift the data towards the user. Drag the mouse to the bottom of the viewer or use the down arrow key. With the Shift key + mouse wheel the data is shifted in a vertical direction. Shift the data down. Scroll the mouse wheel down or use the Shift + ‘numerical –’ keys. Shift the data up. Scroll the mouse wheel up or use the Shift + ‘numerical +’ keys. 2.4.1.3 Zoom in/out in the Data With the mouse wheel, the user can zoom in or out in the data. Zoom out. Scroll the mouse wheel up or use the ‘numerical –’ key. Zoom in. Scroll the mouse wheel down or use the ‘numerical +’ key. 2.4.1.4 Scale the Data With the Ctrl key + mouse wheel will modify the scale factor of the Z-axis of the data. If the scale factor > 1, the color of the vertical axis of the grid will change to red. Increase the scale factor. Scroll the mouse wheel down or use the Ctrl + ‘numerical +’ keys. Decrease the scale factor. Scroll the mouse wheel up or use the Ctrl + ‘numerical –’ keys with a minimum scale factor of one. The scale factor can also be modified in the Properties of the Area Viewer (see page 13). 2.4.1.5 Center the Data Double click with the left mouse button or the mouse wheel on a location with data and that location will move to the center of the view. 2.4.2 Area Viewer Toolbar and Context Menu The + and – key of the numerics keyboard can also be used for the Zoom In and Zoom Out. 8 • PDS2000 LiteView The context menu of the Area Viewer can be opened with a click of the right mouse button in the view. Next to the options in the toolbar some extra options are available in the context menu of the Area Viewer. Zoom Functions ( , , ) Zoom In, Zoom Out and Zoom Extents. PDS2000 LiteView - User Manual The light intension works only on the grid model data. Show Spotlight ( ) Toggles the spotlight window on/off. With the spotlight window, the light intension and light source location in the viewer can be modified. Figure 2-8 Spotlight window Click on the yellow ball and move it around in the circle. How further away from the center how less intense the light will be. The location of the yellow ball in the circle gives the location of the light source. Measure ( ) A distance can be measured in the view. Click on a point in the viewer and keep the left mouse button pressed while drawing the measure line to the second point. Release the left mouse button and the 3D distance between the two points is given. When the cursor comes close to the arrows of the measure line, the line is highlighted and the cursor is changes in a ‘hand’. Grab the arrow to move the end of the measure line. When the cursor is away from the arrows of the measure line, the line is dimmed and cannot be moved. Click on a new position and keep the left mouse button pressed to draw a new measure line. To stop the measure option, click on the right mouse button, click on the measure button again or use the Esc-key. Figure 2-9 Area Viewer with a measure window with a distance, bearing and elevation between two points In the measure window the button the coordinates of the two points can be displayed in different formats; Lat/Lon (°), Lat/Lon (° ‘), PDS2000 LiteView - User Manual PDS2000 LiteView • 9 Lat/Lon (° ‘ “) or X/Y grid. The units for the distance can be specified with . The options are International Feet, U.S. Survey Feet, Meters, Links (Clark’s ratio) and Nautical Miles. Save Snapshot The display of the Area Viewer can be saved as a JPG or BMP file. Grid Axis Layer ( ) Toggles the cross with the compass on/off. Show Color Table ( ) Toggles the display of the color table on/off. Beam Color Mode ( ) The multibeam data can be shown in different color modes to help to analyze the data. See page 11 for more information about the beam color mode. Show Color Table for Beam Color Mode This gives the user the possibility to view and modify the generated color table. Figure 2-10 Color Table in the Area Viewer The color table generator will also be opened when on the color table in the viewer is clicked. Click on to maximize the Color Table generator. Now it is possible to modify the color table (see page 14). This option is only available when the beam color mode is set on Depth or Statistics. Generate Color Table for Beam Color Mode The user can (re)generate a color table for the beam color mode Depth or Statistic. The generated color table files are called respectively default or statistics - x, where x is the type of statistics that is shown (see page 12). Only Show Edit Circle Beams ( ) Toggles between showing only the multibeam areas that are covered by the edit circle (on) and showing all the multibeam data (off). Increase/Decrease Edit Circle Size ( , ) The radius of the edit circle can be increased and decreased. 10 • PDS2000 LiteView PDS2000 LiteView - User Manual Connect Beams With Lines ( ) Toggles between beam points connected with lines (on) and only beam points (off). Increase/Decrease Point Size ( , ) The size of the beam points can be increased and decreased. Only Show Valid Beams ( ) Toggles between showing only the valid data (on) and showing all the data (off). Show Filtered Data ( ) The multibeam data that is rejected by one or more of the checked multibeam filters in the list will be displayed in the viewer. Therefore, it will be possible to see what the impact is of one or more multibeam filters on the data. This is best to see with the beam color mode set on Filter (see below). The filtered data is only shown when the option Only Show Valid Beams ( ) is off. Properties ( ) Opens the Properties window of the Area Viewer where the settings for the viewer can be changed. See page 12 for more information about the Properties. 2.4.2.1 Beam Color Mode The multibeam data in the Area Viewer can be shown in several color modes. Click on or select the option in the context menu and select one of the beam color modes. Depth This mode will show the multibeam depths in the colors of the color table. Filter This mode will show the high-resolution multibeam data in the colors which are used by the multibeam filters. So the multibeam data shows which filter affects which data. Low-resolution data is always shown in the color of non-filtered data (normally white). The different filters with their color are displayed on the left side in the viewer. Statistics This mode will show the data in colors which represent a level of a statistic value. The statistic values are valid for an area, not for separate sways or soundings. Therefore, both low and high-resolution areas are colored. Possible values are: Standard deviation. Minimum value. Maximum value. The percentage of the beams that is affected by the selected multibeam filter. The percentage of the beams that is affected by all the multibeam filters. The different color tables for the different statistics can be selected and generate in the Properties (see below). When the color mode is set to Depth or Statistics, the context menu of the view is extended with two options; Show Color Table for Beam Color Mode and Generate Color Table for Beam Color Model (see page 10). PDS2000 LiteView - User Manual PDS2000 LiteView • 11 2.4.2.2 Area Viewer Properties The Properties window of the Area Viewer can be opened with through the context menu. or In the Properties are items available that are also available in the toolbar and/or context menu of the Area Viewer. When a grid model and/or a 3D design model are displayed in the Area Viewer then the parameters as displayed below the tree view will be available (see page 5). Figure 2-11 Properties of the Area Viewer The View parameters: Background Color The background color of the Area Viewer. Beam Color Mode Beam Statistic Color Mode Select one of the statistics color modes; Standard Deviation, Minimum, Maximum, Filter Beam Reject, Filter Beam Quality, Filter Range, Filter Depth, Filter Slope, Filter Nadir, Filter Intersect, Filter Statistic and Filter Total. After a color mode is selected for the first time click on to apply this new selected color mode so a color table for this color mode is generated. Statistics Color Table Name Select the color table, related to the selected beam statistic color mode, that will be used in the Area Viewer when the beam color mode is set on Statistics. Color Table Name Select a color table that will be used in the Area Viewer. Connect Beams With Lines ( ) Shows beam points connected with lines (Enabled) or only beam points (Disabled). 12 • PDS2000 LiteView PDS2000 LiteView - User Manual Only Show Edit Circle Beams ( ) Shows only the multibeam areas that are covered by the edit circle (Enabled) or all the multibeam data (Disabled). Only Show Valid Beams ( ) Shows only the valid data (Enabled) or all the multibeam data (Disabled). Point Size The size of the beam points. Also possible to use the Ctrl key + mouse wheel to change the scale factor. Scale Factor The scale factor of the Z-axis. Scale factor > 1 will enlarge the data in the Z direction. See also page 8. Show Area Outlines If Enabled the multibeam area outlines will be visible. The outlines are only shown around the areas which are displayed in low-resolution. Area Outlines Color Select the color for the multibeam area outlines. Show Color Table ( ) If Enabled the color table will be displayed on the right side of the view. The radius of the circle can also be changed with and . Show Edit Circle If Enabled the edit circle will be displayed in the Area Viewer. Edit Circle Radius Enter the radius for the edit circle. Show Filtered Data ( ) The multibeam data that is rejected by one or more of the checked multibeam filters in the list will be displayed in the viewer. Therefore, it will be possible to see what the impact is of one or more multibeam filters on the data. The filtered data is only shown when the option Only Show Valid Beams ( ) is Disabled. Show Spotlight ( ) If Enabled the spotlight window will be displayed in the Area Viewer. The grid can be switch on/off with . The Grid Axis Layer parameters: Color Select the color of the grid as displayed in the centre of the view. Show N S E W If Enabled the NSEW circle will be displayed on top of the grid. Show Compass Rose If Enabled a north arrow will be displayed on top of the grid. PDS2000 LiteView - User Manual PDS2000 LiteView • 13 2.4.2.3 Color Table Figure 2-12 Color Table generator with a color table added (between 0 and -4) to the existing color table Add the values for the maximum and minimum range, select the number of colors or the step size and click on to modify a color table. With a new color table can be added to the existing color table. If the option is selected the generator will use the whole color spectrum to generates the colors. It will start with the selected color for the maximum value and will stop with the color of the minimum value. With the option only the two selected colors will be used to generate the color table. The color starts with the selected color for the maximum value and will stop with the color of the minimum value and for the intermediate values the colors will run into one another. The items in the color table generator are: Maximum Select a color for the maximum value and add a maximum value for the color table. All the values above the maximum value get the same color as the maximum value. Minimum Select a color for the minimum value and add a minimum value for the color table. The minimum value color will be used for all the values below the minimum value. Number of colors Add a number and the Color Table generator will automatically calculates the step size. Step size Add a step size to get a fixed interval and the Color Table generator will automatically calculates the number of colors. The maximum color becomes white and the minimum color becomes black. The colors in between are divided in grey scales. The maximum color becomes purple and the minimum color becomes red. The colors in between are divided in the colors of the spectrum. 14 • PDS2000 LiteView PDS2000 LiteView - User Manual The maximum and minimum colors will be reversed. A color table will be generated using a part ( ) or the whole ( ) spectrum started with the maximum value and stops with the minimum value. The number of colors will depend on the number of colors or the step size that is selected. A color table will be added to the existing color table using the selected settings (see figure above). With this option the whole spectrum will be used to go from the color of the maximum value to the color of the minimum value. Figure 2-13 Color table with the option from 0 to -4 With this option only the colors of the maximum and minimum value and the colors that run into one another will be used. Figure 2-14 Color table with the option from 0 to -4 Select one of the colors on the left side and click on . A Color Table Entry dialog will be opened where the color and the minimum value for the selected color can be changed. Click on to confirm the change and a star will be placed in the edited color as an indicator (see below). PDS2000 LiteView - User Manual PDS2000 LiteView • 15 Figure 2-15 Color Table Entry When the color table is generated again the edited values with a star will be kept in the color table. Add a new color and a minimum value to the color table. The same Color Table Entry dialog as above will be opened. The added color gets a star, the same as above. Figure 2-16 Value -1.90 is added to the color table Will delete the selected color from the table. Will delete the whole color table. , The colors in the table can be moved up and down. Will show only the color table, there will be no buttons to generate a color table. This button appears when is used or when the option Show Color Table for Beam Color Mode in the context menu of the Area Viewer is selected (see page 10). Will show the Color Table generator. This button appears when used to show only the color table. 16 • PDS2000 LiteView is PDS2000 LiteView - User Manual ─P─ Parameter - 5, 6 Properties - 6, 8, 11, 12 Index ─R─ Resolution - 5, 6, 11 ─S─ Scale Factor - 8, 13 Spotlight - 9, 13 Standard Deviation - 11 ─3─ ─T─ 3D Design Model - 1, 3, 5, 6 Transparency - 5, 6 Tree View - 3, 4, 5 ─A─ Area Viewer - 1, 4, 5, 6, 8, 12 ─B─ Beam Color Mode - 10, 11 BMP File - 10 ─V─ Vertex - 6 ─W─ Wireframe - 6 ─C─ Color Table - 6, 10, 11, 12, 14, 15, 16 Context Menu - 8, 11, 12 ─D─ Drag & Drop - 4 ─E─ Edit Circle - 6, 13 ─G─ Grid Model - 1, 3, 5, 6 ─J─ JPG File - 10 ─L─ Logdata File - 1, 3 ─M─ Measure - 9 Multibeam Area - 6, 10, 13 Multibeam Data - 1, 3, 6, 10, 11, 13 Multibeam Filter - 11, 13 PDS2000 LiteView - User Manual Index • 17