1
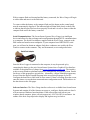
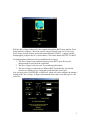
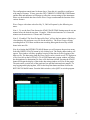
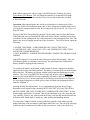
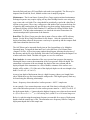
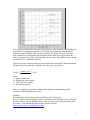
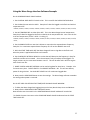
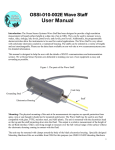
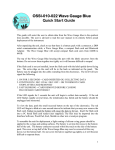
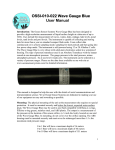
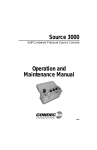
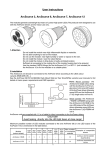
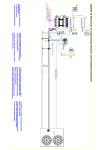
OSSI-010-003 Wave Gauge User Manual Introduction: The Ocean Sensor Systems Wave Gauge has been designed to provide a high-resolution measurement of liquid surface height at a data rate of up to 30Hz. Uses include the measurement of waves, wakes, tides, sinkage, lake levels, pond levels, tank levels, pool levels. The instrument is capable of collecting and storing data for more than a year on standard compact flash cards. It can collect data continuously or in a burst sampling mode; sampling for short periods and then going into low power sleep mode. The instrument is self powered using 12 Alkaline C cells. The Wave Gauge is very robust with solid-state electronics sealed in a waterproof housing. There are three types of pressure transducers, Absolute, Gauge and Differential. Our unit uses a Gauge transducer. The gauge pressure is the total pressure, minus atmospheric pressure. So at sea level it reads zero. The instrument can be ordered in a variety of pressure ranges. Please see the data sheet available on our web site at www.oceansensorsystems.com for detailed information. This manual is designed to help the user with the details of RS232 communications and instrumentation science. We at Ocean Sensor Systems are dedicated to making your use of our equipment as easy and rewarding as possible. Mounting: The physical mounting of the unit at the measurement site requires no special protection. It must be mounted securely and below the lowest, expected water surface level. The wave gauge may be used in any fluid compatible with Buna-n o-rings, Silicone o-ring grease, stainless steel, and ABS plastic. The output is a gauge measurement of the pressure at the location of the sensor orifice, (a small hole), located on one end of the wave gauge. In mounting do not cover over the orifice opening. The ABS housing must be mounted securely and must never be submerged more than 1.5 x the maximum rated pressure range. 0 to 1 Bar will have a maximum depth of 16 meters 0 to 3 Bars will have a maximum depth of 46 meters 0 to 10 Bars will have a maximum depth of 151 meters 1 Mounting can be to a vertical mooring cable, a bottom mounted base or a submerged piling. Mounting is accomplished by clamping to the ABS housing. Power Requirements: The Wave Gauge comes supplied with a battery pack of 12 alkaline C cells connected in series, parallel arrangement. This provides a nominal 6 VDC to the electronics. A newer version Wave Gauge uses an 18 volt battery pack. This pack has 12 alkaline C cells connected in Series. See the Wave Gauge Data sheet on the web for battery life for your specific configuration. Replacement alkaline battery packs are available from Ocean Sensor Systems. Alternately 12 individual, new, alkaline C cells may be connected in a Series, parallel or in series and the power connector transferred from the old battery pack. A special Wave Gauge with an extended case (Identified with the letter E at the end of the wave gauge part number) is supplied with a battery pack of 28 alkaline C cells. There are two groups of 14 cells connected in series. Replacement alkaline battery packs are available from Ocean Sensor Systems. Alternately 28 individual, new, alkaline C cells may be configured as shown below and the power connector transferred from the old battery pack to the new pack. 2 Control Panel: The Wave Gauge is opened by unscrewing the top of the black plastic housing from the base in a counter clockwise direction. When opening the unit, be careful not to let the battery drop by holding the Wave Gauge in an upright position or on its side lying on a table. Inside the unit is a control panel. The control panel has a slot for the Compact flash card, a button to allow removal of the compact flash card, an LED indicator light, a battery connector and a connector for the Programming RS232 adapter cable. The Wave Gauge is used by inserting a compact flash card (64M to 2000M) in the slot with the card label down in relation to the control panel text. The card should slide easily into the unit with a slight resistance for the last 1/16”. The card when installed correctly will be straight and flush with the top surface of the control panel. Next, connect the battery supplied with the unit by inserting the connector into the appropriate socket. The LED indicator light may blink once. If the LED light blinks rapidly at about 3 times a second, the unit cannot identify the compact flash card. This is due to one of the following: The wrong type or size of compact flash card is inserted The compact flash card is not formatted The card was not installed correctly If the problem persists please contact Ocean Sensor Systems. Note: Early versions of the Wave Gauge did not work with flash cards reformatted with Windows XP. To avoid this problem do not reformat the Flash Card. Use the delete file option when files are no longer needed on the Flash Card. Wave Gauges with a date code after July 31, 2009 will now work with flash cards reformatted with Windows XP. 3 With a compact flash card inserted and the battery connected, the Wave Gauge will begin to collect data and store it to the flash card. To remove either the battery or the compact flash card, the button on the control panel must be momentarily depressed. The indicator light will then blink slowly at about 1Hz to indicate that all open files have been properly closed and it is safe to remove either the compact flash card or the battery connector. Serial Communications: The Ocean Sensor Systems Wave Gauge is an intelligent device and allows for data exchange and reconfiguration through RS232 communications to a computer. The Serial Port Adapter, supplied with the Wave Gauge, connects to the DB9 connector found on most computers. If your computer has a DB25 RS232 serial port, you will need to obtain an adaptor. Only three conductors are used by the Wave Gauge to connect to the computer. They are the transmit, receive and ground wires. Once the Wave Logger is connected to the computer, it may be powered up by connecting the battery to the unit. Ocean Sensor Systems has a Graphical User Interface available to download free of charge from www.oceansensorsystems.com. The interface works on most Windows platforms and allows configuration, and display of data. Details for the use of this program are given below. Alternately, a HyperTerminal program may be used. Start the HyperTerminal Program in the accessories programs of your PC. Configure the baud rate to 9600 with no flow control. If data is scrolling down the screen, enter the letters s to stop the data steam and enter configuration mode. Full details are in the data sheets on the web pages. Software Interface: The Wave Gauge interface software is available from Ocean Sensor Systems and contains all of the features necessary to, configure, display and save data. It will run on most Windows based machines. If the software does not start on your windows based computer, please call tech support at 1-954-796-6583 for assistance. An outline of the basic steps required to display and log data are given below. 4 With the Wave Gauge connected to the computer through the RS232 port, start the Wave Gauge interface software. Choose the correct com port (usually com 1 or 2). Power up Wave Gauge and left click on (select) the button labeled CONNECT. A popup window should appear giving the device’s serial number. Click on the button RETURN TO MAIN. If communications failed one of four possibilities has occurred 1. The Wave Gauge is not connected properly to the RS232 port. Review the discussion above and check the connection. 2. The Wave Gauge is not powered. Try reconnecting the battery. 3. The Wave Gauge is connected to a different RS232 port than the one selected. Check to see which port it is connected to and select the correct port. Now you may select CONFIGURE, or DISPLAY which will either configure the internal settings of the Wave Gauge, or display measurement data to the screen and log it to a file on the PC. 5 The configuration control panel is shown above. From this it is possible to configure a wide range of features. To start, press the GET CURRENT CONFIGURATION button and the dials and indicators will change to reflect the current settings of the instrument. Please see the detailed data sheet for the Wave Gauge to understand the function of the various features. Wave Gauges with a date code after July 31, 2009 will operate by the following two notes: Note 1: To use the Start Time feature the START DATE/TIME Settings must be set one minute before the desired start time. Example: If the desired start time is 16 hours 00 minutes set the start time to 15 hours and 59 minutes. Note 2: If enabled “The New file Interval In Days” will use the last minute of the day to close that days file and open a new file for the next Day. The Wave Gauge will stop recording data at 2359 hours and then start recording data again the next day at 0000 hours in the new file. Now by selecting the RETURN TO MAIN button you will return to the previous menu. Select the DISPLAY DATA button by left clicking on it. The Display data window will appear. This window will allow graphical viewing of the data as well as logging of the data to a file. The data string from the Wave Gauge can be viewed as well. To log data to a file, first click on the LOG DATA TO A FILE button and a popup window will allow the designation of a destination file. Once a file has been selected, pressing the START button will begin the display of data in the data string window as well as on the graph. The units on the vertical axis of the graph are bars and the horizontal axis samples. To stop logging and displaying data, click on the Stop Data button and then click on the RETURN TO MAIN button. From the Main window, select QUIT to exit the program. 6 Note: When connected to a Wave Gauge with OSSI Interface Software, be sure to exit with the QUIT Button. This will return the unit back to its normal RUN mode. The battery power may also be turned off for a few seconds to return the unit back to the RUN mode. Operation: After unpacking the unit, check to see that there is a battery pack with a connector, a DB9 serial communication cable, a Wave Gauge and compact flash card. If you supply the compact flash card, the Wave Gauge will only accept 64, 128, 256 or 512 Meg size cards. The top of the Wave Gauge housing (the part with the label) unscrews from the bottom. If the flash card is not yet installed, the flash card inserts with the card label facing down as indicated by the writing on the top of the electronics in the bottom half of the case. The battery may now be plugged into the top of the electronics. The LED will now signal the following: 1. ON FOR 3 SECONDS = CARD INSERTED OK /COLLECTING DATA 2. CONTINUOUS 1 SEC. ON & 1 SEC. OFF = OK TO REMOVE CARD. STOPS AFTER THE CARDIS REMOVED 3. FAST BLINKING = CARD REMOVED BEFORE CLOSING FILE OR BAD CARD FORMAT. If the LED signals for 3 seconds the unit will begin to collect data normally. If the red LED flashes rapidly several times consecutively, the initialization has failed and the battery should be unplugged and reinserted. To assemble the unit for deployment, a light coating of silicon o-ring grease should be applied to the o-rings and sealing surfaces. The battery is set into the recess in the bottom half of the unit. The battery plug aligns with the notch in the heat shrink that is on the batteries. The cover or top half of the Wave Gauge may now be screwed all the way down over the bottom half but excessive tightening will make it difficult to separate them. So the key here is down completely so the surfaces touch but not over tightened. We also suggest using latex or rubber gloves which will help with gripping the unit to unscrew or tighten it. Opening the unit after deployment. A very important note about the Wave Gauge! Remember to tell anyone using it that they MUST NOT GET ANY SALTWATER or SWEAT INSIDE THE UNIT AS THIS WILL CORRODE THE CIRCUITRY! It must be thoroughly dried before it's opened. Then lay the unit down on its side. Open the unit very carefully, if there is any water around the 0 Ring it will not fall into the unit and can be further dried. Hands must be totally dry when opening and handling the unit. To remove the Compact card for viewing of the data, push the small white recessed button on the top of the electronics in the bottom half of the case. The red LED will begin to blink at a one second interval to indicate that you may now remove the flash card. 7 Insert the flash card into a PC based flash card reader (user supplied). The files may be imported into Word Pad, Excel, Matlab or other text or analysis program. Maintenance: The Ocean Sensor Systems Wave Gauge requires minimal maintenance. Prolonged exposure may require wiping off any slime buildup from the case using only soap, water and a soft cloth. The o-ring should be periodically wiped with a thin film of silicone o-ring grease. The o-ring, o-ring groove and inside of the case must be kept free of particles and scratches that may prevent the o-ring from sealing. Replacement o-ring are Buna-N O-Ring AS568A Dash Number 233 and Buna-N O-Ring AS568A Dash Number 042. The only other maintenance is to check the electrical connections for corrosion and periodic replacement of the batteries. Data Files: The Wave Gauge stores the data in units of bars as either ASCII or binary format. See the Wave Gauge Data Sheet for file format. After the system has been deployed and data collected, the pressure vessel may be opened up and the compact flash card removed and the data recovered. The ASCII data can be imported directly into an Excel spreadsheet or by Matlab as formatted input. To import the data into Excel, select the Data->Get External Data>Import Text File. A file select popup window should appear allowing the selection of the directory and the file to be imported. Select the Fixed width option on the Import Text window and select Finish. The data will appear as a row for each burst. Data Analysis: Accurate estimation of the wave spectra from pressure data requires filtering the data to remove the attenuation of the wave pressure field with depth. The attenuation is a function of the wavelength, the depth of the water column and the deployed depth of the instrument. As a rule of thumb, estimates of the surface wave heights will be within +-5% if the ratio of the deployed depth over the wavelength is less than 0.3 to 0.5 (z/L <0.3 to 0.5). At any given depth of deployment, there is a high frequency (short wave length) limit above which the waves are not measurable with pressure. This high frequency limit may be found using the following relationship: Fmax = frequency where subsurface /surface pressure = 0.025 * sample rate As an example, if we assume deepwater waves and if the data is collected at 2Hz, the ratio of the subsurface pressure over the surface pressure must be >= 0.025*2 or 0.05. If the deployment depth z = 5 meters then the highest frequency wave that can be measured is: (Psurface/Pinstrument= 1/ e –kz )<= 0.05 solving for k yields 15 or a 0.41 meter long wave. Below is a plot showing the maximum frequency measurable for a range of deployment depths when the sample rate is 2Hz. The maximum wave frequency limit for a range of deployment depths and a 2Hz sample rate. 8 The raw pressure data from each burst is converted to a wave spectra by first dividing the burst into 50% overlapping segments of 128 points. Each segment is then detrended, windowed with a Hanning window and zero filled to 256 points. The power spectra is then calculated for each segment and averaged with the other power spectra from the burst. Frequencies above the cutoff frequency are set to zero. The significant wave height is estimated by 4 * Standard Deviation. The power spectra computed in the previous step must be corrected for depth attenuation. The pressure power spectrum is related to the wave power spectrum by cosh k z h 2 S P ( ) S cosh kh where: z = depth of instrument h = depth of the water column k = 2*pi/L the wave number = the radial frequency 2 There are a number of programs available on the internet for making the spectral correction from the pressure time series. Example: Processing of wave data from pressure sensors by Dr. Urs Neumeier Below is a link to a research paper by Dr. Urs Neumeier on Processing of wave data from pressure sensors. He uses Matlab software with 3 routines for the post processing of the wave data. You can download the routines from his web site. http://neumeier.perso.ch/matlab/waves.html 9 Very Important Notes: When using the Interface software be sure to exit correct or the unit will be left in the configure mode. If the Wave Gauge was left in the Configure mode and power was not cycled off, the unit will not save a file to the flash card. In this case, when inserting the card, the LED will not light for 3 seconds. When the button is pressed later the LED will flash at the normal on off rate. The best way to be sure that the unit is not left in the configure mode, is to unplug the battery power before inserting the flash card. Then when the power is plugged back in the unit will start up in the normal Run Mode, recognize that a flash card is installed and light the LED for 3 seconds. This indicates the card is OK and the unit is logging data to a file on the card. If formatting the Flash Cards please be sure to use FAT (Default). This is FAT 16 and not FAT32. If formatted correctly the Wave Gauge LED will light for 3 seconds when the flash card is inserted. Remember to press the Close File Button before removing the Flash Card form the Wave Gauge. Also be sure the battery is good. 10 OSSI-010-003 Wave Gauge Zeroing the OSSI-010-003C at Sea Level From the Keller America web site download and install the Read 30 program. http://www.kelleramerica.com/index.html click on MANUALS & DOWNLOADS. Under software & Drivers select Read 30 SOFTWARE. Connect the Wave Gauge to you PC with the Serial Port Adapter and power up the unit. Run the Read 30 program. Select the correct serial port number and set the Baud rate to 9600. Leave Echo On. Hit OK! Select the PROG30 tab. The PROG30 window should now show the Pressure Sensor Actual Value in bars. Set the Zero Mode to Zero and click on the Execute zero function button. The Wave gauge output should now read zero pressure. 11 Using the Wave Gauge Interface Software Example: On the CONFIGURE WAVE GAUGE window: 1. Set the SERIAL DATA OUTPUT switch to ON. This is used for the DISPLAY DATA Window. 2. Set the Data Format switch to ASCII. Example of a data line logged on the flash card with air temperature OFF +0.0068,+0.0069,+0.0069,+0.0068,+0.0068,+0.0068,+0.0070,+0.0069,+0.0069,+0.0069,+0.0069,+0.0070, 3. Set AIR TEMPERATURE to either ON or OFF. This is the Wave Gauge internal temperature. Example of a data line logged on the flash card with the air temperature ON. Item 13 in the line is the Air Temperature (+0374 * .0625 = 23.4 Deg. C): +0.0068,+0.0069,+0.0069,+0.0068,+0.0068,+0.0068,+0.0070,+0.0069,+0.0069,+0.0069,+0.0069,+0.0070, +0374, 4. Set the SAMPLE RATE to a rate that is 8 times or more than the expected wave frequency. Example: For a maximum expected wave frequency of 1 HZ set the SAMPLE rate to 10. 5. With the START TIME switch OFF the Wave Gauge will start to log data no the flash card when the power is applied with a flash card inserted. 6. Set the NEW FILE INTERVAL IN DAYS to a value that will determine the frequency in days for new flash card files to be created. Set to 0 continuous if only a few days will be logged. For longer missions set it to some were between 1 and 7. This will be safer and it will time tag the start of each new file. 7. BURST LENGTH and BURST INTERVAL can be used to log data for short burst. Example: Like 5 minutes every hour. BURST LENGTH = 5 and BURST INTERVAL = 60. This will save battery power for long missions. Set the BURST LENGTH to 0 for continuous logged data. 8. Now press the CONFIGURE button to save the settings. The Wave Gauge will now remember the settings when power is removed. On the SET DATA COLLECTION START TIME/DATE ON WAVE GAUGE WINDOW: 1. To delay the Wave Gauge Start logging time set the Year, Month Date, Hours and Minutes. 2. Now press the CONFIGURE START TIME/DATE button. Note that the start time switch in the CONFIGURE WAVE GAUGE window will now be ON. To disable the start time return to the CONFIGURE WAVE GAUGE window and set the START TIME switch OFF. 12