1
User Manual
MTS400 Series
MPEG Test Systems
Volume 1 of 2
071-1507-01
Test Equipment Depot - 800.517.8431 - 99 Washington Street Melrose, MA 02176 - FAX 781.665.0780 - TestEquipmentDepot.com
Table of Contents - Volume 1
General Safety Summary
Service Safety Summary
Preface
xi
xiii
xv
Related Material
Manual Conventions
xv
xvi
Introduction
MTS400 Series Software Application . . . . . . . . . . . . . . . . . . . . . . . . .
1--1
Transport Stream Compliance Analyzer
Getting Started . . . . . . . . . . . . . . . . . . . . . . . . . . . . . . . . . . . . . . . . . . . .
2--1
TSCA Features . . . . . . . . . . . . . . . . . . . . . . . . . . . . . . . . . . . . . . . . . . . . . . . . . .
Deferred and Real-Time Modes . . . . . . . . . . . . . . . . . . . . . . . . . . . . . . . . . . . . .
Technical Background . . . . . . . . . . . . . . . . . . . . . . . . . . . . . . . . . . . . . . . . . . . .
User Interface . . . . . . . . . . . . . . . . . . . . . . . . . . . . . . . . . . . . . . . . . . . . . . . . . . .
Capture Vut Feature . . . . . . . . . . . . . . . . . . . . . . . . . . . . . . . . . . . . . . . . . . . . . .
Triggered Recording . . . . . . . . . . . . . . . . . . . . . . . . . . . . . . . . . . . . . . . . . . . . . .
Starting the TSCA Software . . . . . . . . . . . . . . . . . . . . . . . . . . . . . . . . . . . . . . . .
Setting Up the IP Interface . . . . . . . . . . . . . . . . . . . . . . . . . . . . . . . . . . . . . . . . .
Setting the Stream Content Font . . . . . . . . . . . . . . . . . . . . . . . . . . . . . . . . . . . .
2-- 2
2-- 2
2-- 3
2-- 3
2-- 5
2-- 5
2-- 6
2-- 12
2-- 15
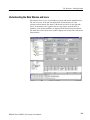
Understanding the Analyzer Window . . . . . . . . . . . . . . . . . . . . . . . . .
2--19
TSCA Window Components . . . . . . . . . . . . . . . . . . . . . . . . . . . . . . . . . . . . . . .
Error Status LEDs . . . . . . . . . . . . . . . . . . . . . . . . . . . . . . . . . . . . . . . . . . . . . . . .
Context Menus . . . . . . . . . . . . . . . . . . . . . . . . . . . . . . . . . . . . . . . . . . . . . . . . . .
2-- 20
2-- 24
2-- 25
Using the Program View . . . . . . . . . . . . . . . . . . . . . . . . . . . . . . . . . . . .
2--27
Program Navigation - Transport Stream Node . . . . . . . . . . . . . . . . . . . . . . . . .
Program Navigation - Program Nodes . . . . . . . . . . . . . . . . . . . . . . . . . . . . . . . .
Program Navigation - Elementary Stream Node . . . . . . . . . . . . . . . . . . . . . . . .
2-- 29
2-- 34
2-- 35
Using the Tests View . . . . . . . . . . . . . . . . . . . . . . . . . . . . . . . . . . . . . . .
2--39
Test Structure . . . . . . . . . . . . . . . . . . . . . . . . . . . . . . . . . . . . . . . . . . . . . . . . . . .
Tests Navigation - All Tests . . . . . . . . . . . . . . . . . . . . . . . . . . . . . . . . . . . . . . . .
Test Navigation - Test Nodes . . . . . . . . . . . . . . . . . . . . . . . . . . . . . . . . . . . . . . .
Test Navigation - PID Nodes . . . . . . . . . . . . . . . . . . . . . . . . . . . . . . . . . . . . . . .
2-- 41
2-- 43
2-- 43
2-- 44
Using the Tables View . . . . . . . . . . . . . . . . . . . . . . . . . . . . . . . . . . . . . .
2--45
Table Summary Pane . . . . . . . . . . . . . . . . . . . . . . . . . . . . . . . . . . . . . . . . . . . . .
Tables Detail View - Section View . . . . . . . . . . . . . . . . . . . . . . . . . . . . . . . . . . .
Tables Detail View - SI Repetition Graphs . . . . . . . . . . . . . . . . . . . . . . . . . . . .
2-- 46
2-- 47
2-- 49
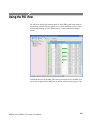
Using the PID View . . . . . . . . . . . . . . . . . . . . . . . . . . . . . . . . . . . . . . . .
2--51
PID View - All PIDs . . . . . . . . . . . . . . . . . . . . . . . . . . . . . . . . . . . . . . . . . . . . . .
PID View - Detail View (All PID and Group) . . . . . . . . . . . . . . . . . . . . . . . . . .
PID View - Detail View (PIDs) . . . . . . . . . . . . . . . . . . . . . . . . . . . . . . . . . . . . .
2-- 52
2-- 53
2-- 54
MTS400 Series MPEG Test System User Manual
i
Table of Contents -- Volume 1
Using the Packets View . . . . . . . . . . . . . . . . . . . . . . . . . . . . . . . . . . . . .
2--57
Packet Navigation Bar . . . . . . . . . . . . . . . . . . . . . . . . . . . . . . . . . . . . . . . . . . . .
Packet Navigation - PIDs node . . . . . . . . . . . . . . . . . . . . . . . . . . . . . . . . . . . . .
Packet Detail View . . . . . . . . . . . . . . . . . . . . . . . . . . . . . . . . . . . . . . . . . . . . . . .
2-- 58
2-- 59
2-- 59
Common User Interface Concepts . . . . . . . . . . . . . . . . . . . . . . . . . . . .
2--63
Windows Management . . . . . . . . . . . . . . . . . . . . . . . . . . . . . . . . . . . . . . . . . . . .
Icons . . . . . . . . . . . . . . . . . . . . . . . . . . . . . . . . . . . . . . . . . . . . . . . . . . . . . . . . . .
Graph Management . . . . . . . . . . . . . . . . . . . . . . . . . . . . . . . . . . . . . . . . . . . . . .
PCR Graphs . . . . . . . . . . . . . . . . . . . . . . . . . . . . . . . . . . . . . . . . . . . . . . . . . . . .
PTS Graphs . . . . . . . . . . . . . . . . . . . . . . . . . . . . . . . . . . . . . . . . . . . . . . . . . . . . .
Bit Rate Graphs . . . . . . . . . . . . . . . . . . . . . . . . . . . . . . . . . . . . . . . . . . . . . . . . .
Parameter Edit . . . . . . . . . . . . . . . . . . . . . . . . . . . . . . . . . . . . . . . . . . . . . . . . . .
Event Log . . . . . . . . . . . . . . . . . . . . . . . . . . . . . . . . . . . . . . . . . . . . . . . . . . . . . .
Bit Rates . . . . . . . . . . . . . . . . . . . . . . . . . . . . . . . . . . . . . . . . . . . . . . . . . . . . . . .
EPG View . . . . . . . . . . . . . . . . . . . . . . . . . . . . . . . . . . . . . . . . . . . . . . . . . . . . . .
MPE Views . . . . . . . . . . . . . . . . . . . . . . . . . . . . . . . . . . . . . . . . . . . . . . . . . . . . .
CaptureVut Feature . . . . . . . . . . . . . . . . . . . . . . . . . . . . . . . . . . . . . . . . . . . . . . .
Triggered Recording . . . . . . . . . . . . . . . . . . . . . . . . . . . . . . . . . . . . . . . . . . . . . .
Menu Bar and Options . . . . . . . . . . . . . . . . . . . . . . . . . . . . . . . . . . . . . . . . . . . .
Preferences . . . . . . . . . . . . . . . . . . . . . . . . . . . . . . . . . . . . . . . . . . . . . . . . . . . . .
Script Files . . . . . . . . . . . . . . . . . . . . . . . . . . . . . . . . . . . . . . . . . . . . . . . . . . . . .
2-- 63
2-- 65
2-- 68
2-- 74
2-- 78
2-- 80
2-- 81
2-- 84
2-- 89
2-- 93
2-- 98
2-- 99
2-- 105
2-- 109
2-- 112
2-- 114
Task Examples . . . . . . . . . . . . . . . . . . . . . . . . . . . . . . . . . . . . . . . . . . . .
2--119
Which Tests Have Failed in an Analyzed Stream? . . . . . . . . . . . . . . . . . . . . . .
How Many PIDs are in a Stream? How many PIDs are Referenced and
Unreferenced? . . . . . . . . . . . . . . . . . . . . . . . . . . . . . . . . . . . . . . . . . . . . . . .
Which Tests Have Been Applied to a Program PID? . . . . . . . . . . . . . . . . . . . .
What is the Stream Type of a PID? . . . . . . . . . . . . . . . . . . . . . . . . . . . . . . . . . .
How Many Programs are in the Stream? . . . . . . . . . . . . . . . . . . . . . . . . . . . . . .
What are the Contents of the Programs and What PIDs are They On? . . . . . . .
What is the Bit Rate of each PID in a Program? . . . . . . . . . . . . . . . . . . . . . . . .
What is the Latest Version Number of the Program Association Table (PAT)
in the SI? . . . . . . . . . . . . . . . . . . . . . . . . . . . . . . . . . . . . . . . . . . . . . . . . . . .
How do I Examine a Transport Packet? . . . . . . . . . . . . . . . . . . . . . . . . . . . . . . .
2-- 120
2-- 122
2-- 123
2-- 124
2-- 125
2-- 126
2-- 127
2-- 130
2-- 131
SI/PSI Nodes . . . . . . . . . . . . . . . . . . . . . . . . . . . . . . . . . . . . . . . . . . . . . .
2--133
Getting Started . . . . . . . . . . . . . . . . . . . . . . . . . . . . . . . . . . . . . . . . . . . .
3--1
Starting the Program . . . . . . . . . . . . . . . . . . . . . . . . . . . . . . . . . . . . . . . . . . . . . .
Options . . . . . . . . . . . . . . . . . . . . . . . . . . . . . . . . . . . . . . . . . . . . . . . . . . . . . . . .
Opening a File . . . . . . . . . . . . . . . . . . . . . . . . . . . . . . . . . . . . . . . . . . . . . . . . . .
3-- 2
3-- 5
3-- 8
Menus and Controls . . . . . . . . . . . . . . . . . . . . . . . . . . . . . . . . . . . . . . .
3--11
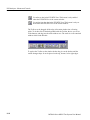
Toolbar . . . . . . . . . . . . . . . . . . . . . . . . . . . . . . . . . . . . . . . . . . . . . . . . . . . . . . . .
Status Bar . . . . . . . . . . . . . . . . . . . . . . . . . . . . . . . . . . . . . . . . . . . . . . . . . . . . . .
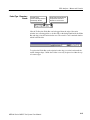
Slider Bar . . . . . . . . . . . . . . . . . . . . . . . . . . . . . . . . . . . . . . . . . . . . . . . . . . . . . .
Menus and Options . . . . . . . . . . . . . . . . . . . . . . . . . . . . . . . . . . . . . . . . . . . . . . .
3-- 11
3-- 13
3-- 14
3-- 17
Packet Hex View . . . . . . . . . . . . . . . . . . . . . . . . . . . . . . . . . . . . . . . . . .
3--21
Packet Header . . . . . . . . . . . . . . . . . . . . . . . . . . . . . . . . . . . . . . . . . . . . . . . . . . .
3-- 22
Event Log . . . . . . . . . . . . . . . . . . . . . . . . . . . . . . . . . . . . . . . . . . . . . . . .
3--25
Packet Selection . . . . . . . . . . . . . . . . . . . . . . . . . . . . . . . . . . . . . . . . . . . . . . . . .
3-- 25
PES Analyzer
ii
MTS400 Series MPEG Test System User Manual
Table of Contents -- Volume 1
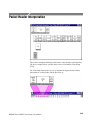
Packet Header Interpretation . . . . . . . . . . . . . . . . . . . . . . . . . . . . . . . .
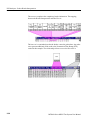
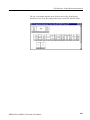
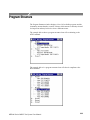
Program Structure . . . . . . . . . . . . . . . . . . . . . . . . . . . . . . . . . . . . . . . . .
3--29
3--33
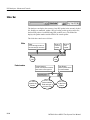
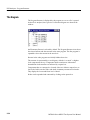
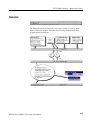
The Diagram . . . . . . . . . . . . . . . . . . . . . . . . . . . . . . . . . . . . . . . . . . . . . . . . . . . .
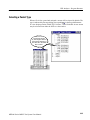
Selecting a Packet Type . . . . . . . . . . . . . . . . . . . . . . . . . . . . . . . . . . . . . . . . . . .
3-- 34
3-- 35
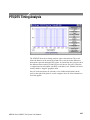
PTS/DTS Timing Analysis . . . . . . . . . . . . . . . . . . . . . . . . . . . . . . . . . .
3--37
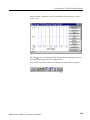
Access Unit Selection . . . . . . . . . . . . . . . . . . . . . . . . . . . . . . . . . . . . . . . . . . . . .
Scrolling the View . . . . . . . . . . . . . . . . . . . . . . . . . . . . . . . . . . . . . . . . . . . . . . .
Video Streams . . . . . . . . . . . . . . . . . . . . . . . . . . . . . . . . . . . . . . . . . . . . . . . . . . .
Audio Streams . . . . . . . . . . . . . . . . . . . . . . . . . . . . . . . . . . . . . . . . . . . . . . . . . .
AC-3 Audio Streams . . . . . . . . . . . . . . . . . . . . . . . . . . . . . . . . . . . . . . . . . . . . .
AAC Audio Streams . . . . . . . . . . . . . . . . . . . . . . . . . . . . . . . . . . . . . . . . . . . . . .
3-- 40
3-- 40
3-- 41
3-- 43
3-- 45
3-- 46
Getting Started . . . . . . . . . . . . . . . . . . . . . . . . . . . . . . . . . . . . . . . . . . . .
4--1
Suitable Streams . . . . . . . . . . . . . . . . . . . . . . . . . . . . . . . . . . . . . . . . . . . . . . . . .
Table Handling . . . . . . . . . . . . . . . . . . . . . . . . . . . . . . . . . . . . . . . . . . . . . . . . . .
Starting the Program . . . . . . . . . . . . . . . . . . . . . . . . . . . . . . . . . . . . . . . . . . . . . .
Settings . . . . . . . . . . . . . . . . . . . . . . . . . . . . . . . . . . . . . . . . . . . . . . . . . . . . . . . .
Opening an MPEG File . . . . . . . . . . . . . . . . . . . . . . . . . . . . . . . . . . . . . . . . . . .
Opening a BMR File . . . . . . . . . . . . . . . . . . . . . . . . . . . . . . . . . . . . . . . . . . . . .
Window Layout . . . . . . . . . . . . . . . . . . . . . . . . . . . . . . . . . . . . . . . . . . . . . . . . .
Initial Processing of MPEG Files . . . . . . . . . . . . . . . . . . . . . . . . . . . . . . . . . . . .
Initial Processing of BMR Files . . . . . . . . . . . . . . . . . . . . . . . . . . . . . . . . . . . . .
4-- 1
4-- 2
4-- 2
4-- 4
4-- 8
4-- 9
4-- 10
4-- 11
4-- 12
Menus and Controls . . . . . . . . . . . . . . . . . . . . . . . . . . . . . . . . . . . . . . .
4--13
Toolbar . . . . . . . . . . . . . . . . . . . . . . . . . . . . . . . . . . . . . . . . . . . . . . . . . . . . . . . .
Status Bar . . . . . . . . . . . . . . . . . . . . . . . . . . . . . . . . . . . . . . . . . . . . . . . . . . . . . .
Menu Options . . . . . . . . . . . . . . . . . . . . . . . . . . . . . . . . . . . . . . . . . . . . . . . . . . .
4-- 13
4-- 15
4-- 16
Stream List . . . . . . . . . . . . . . . . . . . . . . . . . . . . . . . . . . . . . . . . . . . . . . .
4--19
Selecting Streams . . . . . . . . . . . . . . . . . . . . . . . . . . . . . . . . . . . . . . . . . . . . . . . .
Processing Streams . . . . . . . . . . . . . . . . . . . . . . . . . . . . . . . . . . . . . . . . . . . . . . .
4-- 21
4-- 21
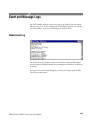
Event and Message Logs . . . . . . . . . . . . . . . . . . . . . . . . . . . . . . . . . . . .
4--23
Global Event Log . . . . . . . . . . . . . . . . . . . . . . . . . . . . . . . . . . . . . . . . . . . . . . . .
PID Event Log . . . . . . . . . . . . . . . . . . . . . . . . . . . . . . . . . . . . . . . . . . . . . . . . . .
Detail Message Logging . . . . . . . . . . . . . . . . . . . . . . . . . . . . . . . . . . . . . . . . . . .
4-- 23
4-- 24
4-- 25
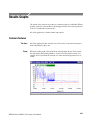
Results Graphs . . . . . . . . . . . . . . . . . . . . . . . . . . . . . . . . . . . . . . . . . . . .
4--27
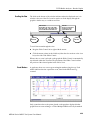
Common Features . . . . . . . . . . . . . . . . . . . . . . . . . . . . . . . . . . . . . . . . . . . . . . . .
Elementary Buffer Graph . . . . . . . . . . . . . . . . . . . . . . . . . . . . . . . . . . . . . . . . . .
Multiplex or Main Buffer Graph . . . . . . . . . . . . . . . . . . . . . . . . . . . . . . . . . . . .
Transport Buffer Graph . . . . . . . . . . . . . . . . . . . . . . . . . . . . . . . . . . . . . . . . . . .
Detail Message Logging . . . . . . . . . . . . . . . . . . . . . . . . . . . . . . . . . . . . . . . . . . .
4-- 27
4-- 36
4-- 37
4-- 38
4-- 39
T-STD Buffer Analyzer
Elementary Stream Analyzer
Getting Started . . . . . . . . . . . . . . . . . . . . . . . . . . . . . . . . . . . . . . . . . . . .
5--1
Starting the ES Analyzer . . . . . . . . . . . . . . . . . . . . . . . . . . . . . . . . . . . . . . . . . .
Opening an MPEG Stream . . . . . . . . . . . . . . . . . . . . . . . . . . . . . . . . . . . . . . . . .
Understanding the Main Window and Icons . . . . . . . . . . . . . . . . . . . . . . . . . . .
Tree View and Navigation . . . . . . . . . . . . . . . . . . . . . . . . . . . . . . . . . . . . . . . . .
Header, Extension and Hex Displays . . . . . . . . . . . . . . . . . . . . . . . . . . . . . . . . .
5-- 2
5-- 3
5-- 5
5-- 8
5-- 10
MTS400 Series MPEG Test System User Manual
iii
Table of Contents -- Volume 1
iv
Error Testing Methods and Outputs . . . . . . . . . . . . . . . . . . . . . . . . . .
5--15
Run Through Stream Test Mode . . . . . . . . . . . . . . . . . . . . . . . . . . . . . . . . . . . .
Error Filtering . . . . . . . . . . . . . . . . . . . . . . . . . . . . . . . . . . . . . . . . . . . . . . . . . . .
Status Bar . . . . . . . . . . . . . . . . . . . . . . . . . . . . . . . . . . . . . . . . . . . . . . . . . . . . . .
Regression Testing and Error Log Files . . . . . . . . . . . . . . . . . . . . . . . . . . . . . . .
Reports and Field Selection . . . . . . . . . . . . . . . . . . . . . . . . . . . . . . . . . . . . . . . .
Demultiplexing Transport Streams to PES or Elementary Output Files . . . . . .
5-- 16
5-- 17
5-- 23
5-- 24
5-- 27
5-- 30
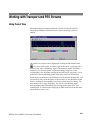
Working with Transport and PES Streams . . . . . . . . . . . . . . . . . . . .
5--31
Using Packet View . . . . . . . . . . . . . . . . . . . . . . . . . . . . . . . . . . . . . . . . . . . . . . .
Understanding PES . . . . . . . . . . . . . . . . . . . . . . . . . . . . . . . . . . . . . . . . . . . . . . .
5-- 31
5-- 32
Working with Video Streams . . . . . . . . . . . . . . . . . . . . . . . . . . . . . . . .
5--35
Viewing the Sequence Header . . . . . . . . . . . . . . . . . . . . . . . . . . . . . . . . . . . . . .
Viewing the GOP and Picture Header . . . . . . . . . . . . . . . . . . . . . . . . . . . . . . . .
Displaying the Slice and Macroblock . . . . . . . . . . . . . . . . . . . . . . . . . . . . . . . .
Analyzing Picture Quality . . . . . . . . . . . . . . . . . . . . . . . . . . . . . . . . . . . . . . . . .
Using the Video Viewer for Picture Analysis . . . . . . . . . . . . . . . . . . . . . . . . . .
5-- 36
5-- 37
5-- 42
5-- 44
5-- 57
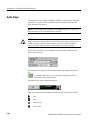
Working with Audio Streams . . . . . . . . . . . . . . . . . . . . . . . . . . . . . . . .
5--61
Understanding MPEG Audio Streams . . . . . . . . . . . . . . . . . . . . . . . . . . . . . . . .
Audio Player . . . . . . . . . . . . . . . . . . . . . . . . . . . . . . . . . . . . . . . . . . . . . . . . . . . .
Understanding Dolby Digital (AC-3) Audio Streams . . . . . . . . . . . . . . . . . . . .
5-- 61
5-- 62
5-- 68
Working with Program Streams . . . . . . . . . . . . . . . . . . . . . . . . . . . . . .
5--71
Viewing Pack and System Headers . . . . . . . . . . . . . . . . . . . . . . . . . . . . . . . . . .
Viewing the Program Stream Map . . . . . . . . . . . . . . . . . . . . . . . . . . . . . . . . . . .
5-- 72
5-- 73
Working with Teletext . . . . . . . . . . . . . . . . . . . . . . . . . . . . . . . . . . . . . .
5--75
VBI (Enhanced Teletext Support) . . . . . . . . . . . . . . . . . . . . . . . . . . . . . . . . . . .
5-- 76
Advanced Audio Compression . . . . . . . . . . . . . . . . . . . . . . . . . . . . . . .
5--79
ADIF Stream Forms . . . . . . . . . . . . . . . . . . . . . . . . . . . . . . . . . . . . . . . . . . . . . .
ADTS Stream Forms . . . . . . . . . . . . . . . . . . . . . . . . . . . . . . . . . . . . . . . . . . . . .
5-- 81
5-- 89
Closed Caption Analysis . . . . . . . . . . . . . . . . . . . . . . . . . . . . . . . . . . . .
5--91
Enabling Closed Caption Analysis . . . . . . . . . . . . . . . . . . . . . . . . . . . . . . . . . . .
Selecting Closed Caption Analysis Standard . . . . . . . . . . . . . . . . . . . . . . . . . . .
CC-EIA608 Support . . . . . . . . . . . . . . . . . . . . . . . . . . . . . . . . . . . . . . . . . . . . . .
CC-EIA708 Support . . . . . . . . . . . . . . . . . . . . . . . . . . . . . . . . . . . . . . . . . . . . . .
Dumping Closed Caption Statistics . . . . . . . . . . . . . . . . . . . . . . . . . . . . . . . . . .
5-- 91
5-- 92
5-- 93
5-- 94
5-- 98
DVB Subtitle Stream Analysis . . . . . . . . . . . . . . . . . . . . . . . . . . . . . . .
5--101
DVB Subtitle Data Tab . . . . . . . . . . . . . . . . . . . . . . . . . . . . . . . . . . . . . . . . . . . .
Page View Tab . . . . . . . . . . . . . . . . . . . . . . . . . . . . . . . . . . . . . . . . . . . . . . . . . .
5-- 103
5-- 106
MTS400 Series MPEG Test System User Manual
Table of Contents - Volume 2
General Safety Summary
Service Safety Summary
Preface
xi
xiii
xv
Related Material
Manual Conventions
xv
xvi
Carousel Analyzer
Getting Started . . . . . . . . . . . . . . . . . . . . . . . . . . . . . . . . . . . . . . . . . . . .
6--1
Data Broadcasting Overview . . . . . . . . . . . . . . . . . . . . . . . . . . . . . . . . . . . . . . .
Starting the Program . . . . . . . . . . . . . . . . . . . . . . . . . . . . . . . . . . . . . . . . . . . . . .
6-- 3
6-- 4
Menus and Controls . . . . . . . . . . . . . . . . . . . . . . . . . . . . . . . . . . . . . . .
6--13
Menu Options . . . . . . . . . . . . . . . . . . . . . . . . . . . . . . . . . . . . . . . . . . . . . . . . . . .
Toolbars . . . . . . . . . . . . . . . . . . . . . . . . . . . . . . . . . . . . . . . . . . . . . . . . . . . . . . .
Transport Packet Bar . . . . . . . . . . . . . . . . . . . . . . . . . . . . . . . . . . . . . . . . . . . . .
Status Bar . . . . . . . . . . . . . . . . . . . . . . . . . . . . . . . . . . . . . . . . . . . . . . . . . . . . . .
Workspace . . . . . . . . . . . . . . . . . . . . . . . . . . . . . . . . . . . . . . . . . . . . . . . . . . . . . .
6-- 13
6-- 17
6-- 19
6-- 20
6-- 21
Views . . . . . . . . . . . . . . . . . . . . . . . . . . . . . . . . . . . . . . . . . . . . . . . . . . . .
6--27
Programs/Services View . . . . . . . . . . . . . . . . . . . . . . . . . . . . . . . . . . . . . . . . . . .
Object Carousel View . . . . . . . . . . . . . . . . . . . . . . . . . . . . . . . . . . . . . . . . . . . . .
U-N-Download View . . . . . . . . . . . . . . . . . . . . . . . . . . . . . . . . . . . . . . . . . . . . .
Data Carousel (DVB) View . . . . . . . . . . . . . . . . . . . . . . . . . . . . . . . . . . . . . . . .
Data Carousel (ARIB) View . . . . . . . . . . . . . . . . . . . . . . . . . . . . . . . . . . . . . . . .
Resource View . . . . . . . . . . . . . . . . . . . . . . . . . . . . . . . . . . . . . . . . . . . . . . . . . .
Structure Views . . . . . . . . . . . . . . . . . . . . . . . . . . . . . . . . . . . . . . . . . . . . . . . . . .
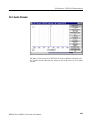
Bitrate View . . . . . . . . . . . . . . . . . . . . . . . . . . . . . . . . . . . . . . . . . . . . . . . . . . . .
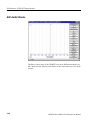
Repetition View . . . . . . . . . . . . . . . . . . . . . . . . . . . . . . . . . . . . . . . . . . . . . . . . .
PID View . . . . . . . . . . . . . . . . . . . . . . . . . . . . . . . . . . . . . . . . . . . . . . . . . . . . . . .
Log View . . . . . . . . . . . . . . . . . . . . . . . . . . . . . . . . . . . . . . . . . . . . . . . . . . . . . .
Cycle Times View . . . . . . . . . . . . . . . . . . . . . . . . . . . . . . . . . . . . . . . . . . . . . . .
6-- 30
6-- 34
6-- 41
6-- 45
6-- 46
6-- 50
6-- 52
6-- 55
6-- 58
6-- 61
6-- 64
6-- 67
Application Support . . . . . . . . . . . . . . . . . . . . . . . . . . . . . . . . . . . . . . .
6--71
Application Management . . . . . . . . . . . . . . . . . . . . . . . . . . . . . . . . . . . . . . . . . .
Application Definition . . . . . . . . . . . . . . . . . . . . . . . . . . . . . . . . . . . . . . . . . . . .
Application Timing . . . . . . . . . . . . . . . . . . . . . . . . . . . . . . . . . . . . . . . . . . . . . .
6-- 71
6-- 73
6-- 78
MHP Support . . . . . . . . . . . . . . . . . . . . . . . . . . . . . . . . . . . . . . . . . . . . .
6--91
Right-Click Menu Options . . . . . . . . . . . . . . . . . . . . . . . . . . . . . . . . . . . . . . . . .
Application Lifetimes . . . . . . . . . . . . . . . . . . . . . . . . . . . . . . . . . . . . . . . . . . . . .
6-- 92
6-- 93
Reference . . . . . . . . . . . . . . . . . . . . . . . . . . . . . . . . . . . . . . . . . . . . . . . . .
6--95
Script Files . . . . . . . . . . . . . . . . . . . . . . . . . . . . . . . . . . . . . . . . . . . . . . . . . . . . .
Error Checking . . . . . . . . . . . . . . . . . . . . . . . . . . . . . . . . . . . . . . . . . . . . . . . . . .
Acronyms and Abbreviations . . . . . . . . . . . . . . . . . . . . . . . . . . . . . . . . . . . . . . .
References . . . . . . . . . . . . . . . . . . . . . . . . . . . . . . . . . . . . . . . . . . . . . . . . . . . . .
6-- 95
6-- 96
6-- 97
6-- 98
MTS400 Series MPEG Test System User Manual
v
Table of Contents -- Volume 2
Carousel Generator
Getting Started . . . . . . . . . . . . . . . . . . . . . . . . . . . . . . . . . . . . . . . . . . . .
7--1
Data Broadcasting Overview . . . . . . . . . . . . . . . . . . . . . . . . . . . . . . . . . . . . . . .
Carousel Generator Overview . . . . . . . . . . . . . . . . . . . . . . . . . . . . . . . . . . . . . .
Starting the Application . . . . . . . . . . . . . . . . . . . . . . . . . . . . . . . . . . . . . . . . . . .
7-- 1
7-- 2
7-- 6
Carousel Wizard . . . . . . . . . . . . . . . . . . . . . . . . . . . . . . . . . . . . . . . . . .
7--9
Step 1: Select Carousel . . . . . . . . . . . . . . . . . . . . . . . . . . . . . . . . . . . . . . . . . . . .
Step 2: Carousel Properties . . . . . . . . . . . . . . . . . . . . . . . . . . . . . . . . . . . . . . . .
Step 3: Carousel Contents . . . . . . . . . . . . . . . . . . . . . . . . . . . . . . . . . . . . . . . . .
Step 4: Collection Contents . . . . . . . . . . . . . . . . . . . . . . . . . . . . . . . . . . . . . . . .
Step 5: Imported Elementary Streams . . . . . . . . . . . . . . . . . . . . . . . . . . . . . . . .
Step 6: Program Entry . . . . . . . . . . . . . . . . . . . . . . . . . . . . . . . . . . . . . . . . . . . .
Step 7: Output Stream Properties . . . . . . . . . . . . . . . . . . . . . . . . . . . . . . . . . . . .
Step 8: Congratulations . . . . . . . . . . . . . . . . . . . . . . . . . . . . . . . . . . . . . . . . . . .
7-- 11
7-- 12
7-- 13
7-- 15
7-- 18
7-- 20
7-- 21
7-- 22
Menus and Controls . . . . . . . . . . . . . . . . . . . . . . . . . . . . . . . . . . . . . . .
7--23
Menus Options . . . . . . . . . . . . . . . . . . . . . . . . . . . . . . . . . . . . . . . . . . . . . . . . . .
Toolbars . . . . . . . . . . . . . . . . . . . . . . . . . . . . . . . . . . . . . . . . . . . . . . . . . . . . . . .
Log Window . . . . . . . . . . . . . . . . . . . . . . . . . . . . . . . . . . . . . . . . . . . . . . . . . . . .
Status Bar . . . . . . . . . . . . . . . . . . . . . . . . . . . . . . . . . . . . . . . . . . . . . . . . . . . . . .
Properties Window (List Control) . . . . . . . . . . . . . . . . . . . . . . . . . . . . . . . . . . .
7-- 23
7-- 27
7-- 30
7-- 31
7-- 31
Carousel Generation . . . . . . . . . . . . . . . . . . . . . . . . . . . . . . . . . . . . . . .
7--33
Setting Overall Carousel Generator Properties . . . . . . . . . . . . . . . . . . . . . . . . .
Creating a Session . . . . . . . . . . . . . . . . . . . . . . . . . . . . . . . . . . . . . . . . . . . . . . .
Selecting the Carousel Type . . . . . . . . . . . . . . . . . . . . . . . . . . . . . . . . . . . . . . . .
Modifying the Carousel Properties . . . . . . . . . . . . . . . . . . . . . . . . . . . . . . . . . . .
Carousel Contents . . . . . . . . . . . . . . . . . . . . . . . . . . . . . . . . . . . . . . . . . . . . . . . .
Collections . . . . . . . . . . . . . . . . . . . . . . . . . . . . . . . . . . . . . . . . . . . . . . . . . . . . .
Programs . . . . . . . . . . . . . . . . . . . . . . . . . . . . . . . . . . . . . . . . . . . . . . . . . . . . . . .
Output Stream Generation . . . . . . . . . . . . . . . . . . . . . . . . . . . . . . . . . . . . . . . . .
Carousel Definition File . . . . . . . . . . . . . . . . . . . . . . . . . . . . . . . . . . . . . . . . . . .
7-- 33
7-- 39
7-- 41
7-- 42
7-- 51
7-- 66
7-- 70
7-- 79
7-- 79
PSI and SI in the Carousel Generator Output Stream . . . . . . . . . . .
7--81
PSI/SI Mode Settings . . . . . . . . . . . . . . . . . . . . . . . . . . . . . . . . . . . . . . . . . . . . .
MPEG PSI tables . . . . . . . . . . . . . . . . . . . . . . . . . . . . . . . . . . . . . . . . . . . . . . . .
DVB SI Tables . . . . . . . . . . . . . . . . . . . . . . . . . . . . . . . . . . . . . . . . . . . . . . . . . .
Summary . . . . . . . . . . . . . . . . . . . . . . . . . . . . . . . . . . . . . . . . . . . . . . . . . . . . . . .
7-- 81
7-- 82
7-- 89
7-- 103
Getting Started . . . . . . . . . . . . . . . . . . . . . . . . . . . . . . . . . . . . . . . . . . . .
8--1
Starting the Program . . . . . . . . . . . . . . . . . . . . . . . . . . . . . . . . . . . . . . . . . . . . . .
Scripts . . . . . . . . . . . . . . . . . . . . . . . . . . . . . . . . . . . . . . . . . . . . . . . . . . . . . . . . .
Opening a Stream . . . . . . . . . . . . . . . . . . . . . . . . . . . . . . . . . . . . . . . . . . . . . . . .
Closing Files . . . . . . . . . . . . . . . . . . . . . . . . . . . . . . . . . . . . . . . . . . . . . . . . . . . .
8-- 3
8-- 5
8-- 9
8-- 14
Menus and Controls . . . . . . . . . . . . . . . . . . . . . . . . . . . . . . . . . . . . . . .
8--15
Menu Options . . . . . . . . . . . . . . . . . . . . . . . . . . . . . . . . . . . . . . . . . . . . . . . . . . .
Toolbar . . . . . . . . . . . . . . . . . . . . . . . . . . . . . . . . . . . . . . . . . . . . . . . . . . . . . . . .
Status Bar . . . . . . . . . . . . . . . . . . . . . . . . . . . . . . . . . . . . . . . . . . . . . . . . . . . . . .
User Interface . . . . . . . . . . . . . . . . . . . . . . . . . . . . . . . . . . . . . . . . . . . . . . . . . . .
8-- 15
8-- 19
8-- 20
8-- 21
Multiplexer
vi
MTS400 Series MPEG Test System User Manual
Table of Contents -- Volume 2
Wizards . . . . . . . . . . . . . . . . . . . . . . . . . . . . . . . . . . . . . . . . . . . . . . . . . .
8--27
Transport Wizard . . . . . . . . . . . . . . . . . . . . . . . . . . . . . . . . . . . . . . . . . . . . . . . .
Program Wizard . . . . . . . . . . . . . . . . . . . . . . . . . . . . . . . . . . . . . . . . . . . . . . . . .
8-- 28
8-- 33
Views . . . . . . . . . . . . . . . . . . . . . . . . . . . . . . . . . . . . . . . . . . . . . . . . . . . .
8--43
Navigator Views . . . . . . . . . . . . . . . . . . . . . . . . . . . . . . . . . . . . . . . . . . . . . . . . .
Section View . . . . . . . . . . . . . . . . . . . . . . . . . . . . . . . . . . . . . . . . . . . . . . . . . . . .
Structure Diagram Manipulation . . . . . . . . . . . . . . . . . . . . . . . . . . . . . . . . . . . .
Event Log . . . . . . . . . . . . . . . . . . . . . . . . . . . . . . . . . . . . . . . . . . . . . . . . . . . . . .
Examine Transport Stream Window . . . . . . . . . . . . . . . . . . . . . . . . . . . . . . . . .
SI Filtering . . . . . . . . . . . . . . . . . . . . . . . . . . . . . . . . . . . . . . . . . . . . . . . . . . . . .
Component Views . . . . . . . . . . . . . . . . . . . . . . . . . . . . . . . . . . . . . . . . . . . . . . . .
Common Menu Options . . . . . . . . . . . . . . . . . . . . . . . . . . . . . . . . . . . . . . . . . . .
8-- 44
8-- 47
8-- 56
8-- 57
8-- 58
8-- 61
8-- 65
8-- 74
Editing in the Navigator Views . . . . . . . . . . . . . . . . . . . . . . . . . . . . . . .
8--75
Drag and Drop . . . . . . . . . . . . . . . . . . . . . . . . . . . . . . . . . . . . . . . . . . . . . . . . . .
Transport Stream . . . . . . . . . . . . . . . . . . . . . . . . . . . . . . . . . . . . . . . . . . . . . . . .
Programs . . . . . . . . . . . . . . . . . . . . . . . . . . . . . . . . . . . . . . . . . . . . . . . . . . . . . . .
Tables . . . . . . . . . . . . . . . . . . . . . . . . . . . . . . . . . . . . . . . . . . . . . . . . . . . . . . . . .
Sections . . . . . . . . . . . . . . . . . . . . . . . . . . . . . . . . . . . . . . . . . . . . . . . . . . . . . . . .
ES PIDs . . . . . . . . . . . . . . . . . . . . . . . . . . . . . . . . . . . . . . . . . . . . . . . . . . . . . . . .
DSM-CC . . . . . . . . . . . . . . . . . . . . . . . . . . . . . . . . . . . . . . . . . . . . . . . . . . . . . . .
8-- 75
8-- 76
8-- 77
8-- 79
8-- 82
8-- 91
8-- 100
Editing in Section View . . . . . . . . . . . . . . . . . . . . . . . . . . . . . . . . . . . . .
8--103
Editing Fields . . . . . . . . . . . . . . . . . . . . . . . . . . . . . . . . . . . . . . . . . . . . . . . . . . .
8-- 104
Multiplexing Transport Streams . . . . . . . . . . . . . . . . . . . . . . . . . . . . .
8--111
Start . . . . . . . . . . . . . . . . . . . . . . . . . . . . . . . . . . . . . . . . . . . . . . . . . . . . . . . . . . .
Errors and Reporting . . . . . . . . . . . . . . . . . . . . . . . . . . . . . . . . . . . . . . . . . . . . .
Stop . . . . . . . . . . . . . . . . . . . . . . . . . . . . . . . . . . . . . . . . . . . . . . . . . . . . . . . . . . .
Exporting the Multiplex Configuration File . . . . . . . . . . . . . . . . . . . . . . . . . . .
8-- 111
8-- 112
8-- 113
8-- 114
Make Seamless . . . . . . . . . . . . . . . . . . . . . . . . . . . . . . . . . . . . . . . . . . . .
8--117
Enabling the Seamless option . . . . . . . . . . . . . . . . . . . . . . . . . . . . . . . . . . . . . .
Seamless Settings . . . . . . . . . . . . . . . . . . . . . . . . . . . . . . . . . . . . . . . . . . . . . . . .
8-- 117
8-- 118
Reference . . . . . . . . . . . . . . . . . . . . . . . . . . . . . . . . . . . . . . . . . . . . . . . . .
8--119
Abbreviations . . . . . . . . . . . . . . . . . . . . . . . . . . . . . . . . . . . . . . . . . . . . . . . . . . .
8-- 119
Transport Stream Editor
Getting Started . . . . . . . . . . . . . . . . . . . . . . . . . . . . . . . . . . . . . . . . . . . .
9--1
Starting the Program . . . . . . . . . . . . . . . . . . . . . . . . . . . . . . . . . . . . . . . . . . . . . .
Options . . . . . . . . . . . . . . . . . . . . . . . . . . . . . . . . . . . . . . . . . . . . . . . . . . . . . . . .
Opening a File . . . . . . . . . . . . . . . . . . . . . . . . . . . . . . . . . . . . . . . . . . . . . . . . . .
9-- 2
9-- 3
9-- 4
Menus and Controls . . . . . . . . . . . . . . . . . . . . . . . . . . . . . . . . . . . . . . .
9--7
Toolbar . . . . . . . . . . . . . . . . . . . . . . . . . . . . . . . . . . . . . . . . . . . . . . . . . . . . . . . .
Status Bar . . . . . . . . . . . . . . . . . . . . . . . . . . . . . . . . . . . . . . . . . . . . . . . . . . . . . .
Slider Bar . . . . . . . . . . . . . . . . . . . . . . . . . . . . . . . . . . . . . . . . . . . . . . . . . . . . . .
Menu Options . . . . . . . . . . . . . . . . . . . . . . . . . . . . . . . . . . . . . . . . . . . . . . . . . . .
9-- 7
9-- 8
9-- 9
9-- 11
Hex Editor . . . . . . . . . . . . . . . . . . . . . . . . . . . . . . . . . . . . . . . . . . . . . . .
9--15
Color Coding . . . . . . . . . . . . . . . . . . . . . . . . . . . . . . . . . . . . . . . . . . . . . . . . . . .
Selecting & Editing . . . . . . . . . . . . . . . . . . . . . . . . . . . . . . . . . . . . . . . . . . . . . .
9-- 15
9-- 17
MTS400 Series MPEG Test System User Manual
vii
Table of Contents -- Volume 2
Header Editor . . . . . . . . . . . . . . . . . . . . . . . . . . . . . . . . . . . . . . . . . . . . .
9--21
Header Information Tab . . . . . . . . . . . . . . . . . . . . . . . . . . . . . . . . . . . . . . . . . . .
Adaptation Field Tab . . . . . . . . . . . . . . . . . . . . . . . . . . . . . . . . . . . . . . . . . . . . .
Adaptation Field Extension Tab . . . . . . . . . . . . . . . . . . . . . . . . . . . . . . . . . . . . .
9-- 21
9-- 23
9-- 26
PID Remapping . . . . . . . . . . . . . . . . . . . . . . . . . . . . . . . . . . . . . . . . . . .
PCR Recalculation . . . . . . . . . . . . . . . . . . . . . . . . . . . . . . . . . . . . . . . . .
9--29
9--33
Jitter Functions . . . . . . . . . . . . . . . . . . . . . . . . . . . . . . . . . . . . . . . . . . . . . . . . . .
9-- 38
Getting Started . . . . . . . . . . . . . . . . . . . . . . . . . . . . . . . . . . . . . . . . . . . .
10--1
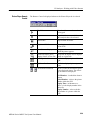
Display Elements . . . . . . . . . . . . . . . . . . . . . . . . . . . . . . . . . . . . . . . . . . . . . . . .
Hierarchical Display . . . . . . . . . . . . . . . . . . . . . . . . . . . . . . . . . . . . . . . . . . . . . .
10-- 1
10-- 7
Menus and Controls . . . . . . . . . . . . . . . . . . . . . . . . . . . . . . . . . . . . . . .
10--19
Menus in the Play Screen . . . . . . . . . . . . . . . . . . . . . . . . . . . . . . . . . . . . . . . . . .
Menus in the Record Screen . . . . . . . . . . . . . . . . . . . . . . . . . . . . . . . . . . . . . . . .
Toolbar Buttons . . . . . . . . . . . . . . . . . . . . . . . . . . . . . . . . . . . . . . . . . . . . . . . . .
10-- 19
10-- 37
10-- 42
Reference . . . . . . . . . . . . . . . . . . . . . . . . . . . . . . . . . . . . . . . . . . . . . . . . .
10--45
Interface Card (SPI/ASI/310M Option) . . . . . . . . . . . . . . . . . . . . . . . . . . . . . . .
Adding Jitter to PCRs . . . . . . . . . . . . . . . . . . . . . . . . . . . . . . . . . . . . . . . . . . . . .
Using Preset Files . . . . . . . . . . . . . . . . . . . . . . . . . . . . . . . . . . . . . . . . . . . . . . . .
Using the Continuous Recording Feature . . . . . . . . . . . . . . . . . . . . . . . . . . . . .
Performing Continuous Recording . . . . . . . . . . . . . . . . . . . . . . . . . . . . . . . . . . .
Remote Commands . . . . . . . . . . . . . . . . . . . . . . . . . . . . . . . . . . . . . . . . . . . . . .
10-- 45
10-- 46
10-- 49
10-- 50
10-- 52
10-- 54
Getting Started . . . . . . . . . . . . . . . . . . . . . . . . . . . . . . . . . . . . . . . . . . . .
11--1
Important Information about Tracer . . . . . . . . . . . . . . . . . . . . . . . . . . . . . . . . . .
Setting Up Tracer and Buffer Analyzer . . . . . . . . . . . . . . . . . . . . . . . . . . . . . . .
Starting Tracer . . . . . . . . . . . . . . . . . . . . . . . . . . . . . . . . . . . . . . . . . . . . . . . . . .
User Interface . . . . . . . . . . . . . . . . . . . . . . . . . . . . . . . . . . . . . . . . . . . . . . . . . . .
11-- 1
11-- 2
11-- 4
11-- 4
Menus and Controls . . . . . . . . . . . . . . . . . . . . . . . . . . . . . . . . . . . . . . .
11--11
File Menu Options . . . . . . . . . . . . . . . . . . . . . . . . . . . . . . . . . . . . . . . . . . . . . . .
Edit Menu Options . . . . . . . . . . . . . . . . . . . . . . . . . . . . . . . . . . . . . . . . . . . . . . .
Print Menu Options . . . . . . . . . . . . . . . . . . . . . . . . . . . . . . . . . . . . . . . . . . . . . .
View Menu Options . . . . . . . . . . . . . . . . . . . . . . . . . . . . . . . . . . . . . . . . . . . . . .
Show Menu Options . . . . . . . . . . . . . . . . . . . . . . . . . . . . . . . . . . . . . . . . . . . . . .
Help Menu Options . . . . . . . . . . . . . . . . . . . . . . . . . . . . . . . . . . . . . . . . . . . . . .
11-- 11
11-- 12
11-- 13
11-- 14
11-- 15
11-- 16
MPEG Player
Tracer
Make Seamless Wizard
viii
Make Seamless Wizard . . . . . . . . . . . . . . . . . . . . . . . . . . . . . . . . . . . . .
12--1
Starting the Wizard . . . . . . . . . . . . . . . . . . . . . . . . . . . . . . . . . . . . . . . . . . . . . . .
Selecting an Input File . . . . . . . . . . . . . . . . . . . . . . . . . . . . . . . . . . . . . . . . . . . .
Select a Program to Make Seamless . . . . . . . . . . . . . . . . . . . . . . . . . . . . . . . . .
Selecting a Multiplex Output File . . . . . . . . . . . . . . . . . . . . . . . . . . . . . . . . . . .
12-- 1
12-- 2
12-- 7
12-- 10
MTS400 Series MPEG Test System User Manual
Table of Contents -- Volume 2
Transport Stream Cutter
Transport Stream Cutter . . . . . . . . . . . . . . . . . . . . . . . . . . . . . . . . . . .
13--1
Starting the Wizard . . . . . . . . . . . . . . . . . . . . . . . . . . . . . . . . . . . . . . . . . . . . . . .
Cutting a File . . . . . . . . . . . . . . . . . . . . . . . . . . . . . . . . . . . . . . . . . . . . . . . . . . .
13-- 1
13-- 2
Getting Started . . . . . . . . . . . . . . . . . . . . . . . . . . . . . . . . . . . . . . . . . . . .
14--1
Setting Up . . . . . . . . . . . . . . . . . . . . . . . . . . . . . . . . . . . . . . . . . . . . . . . . . . . . . .
Starting the Program . . . . . . . . . . . . . . . . . . . . . . . . . . . . . . . . . . . . . . . . . . . . . .
Initial Appearance . . . . . . . . . . . . . . . . . . . . . . . . . . . . . . . . . . . . . . . . . . . . . . .
Initial Menu Options . . . . . . . . . . . . . . . . . . . . . . . . . . . . . . . . . . . . . . . . . . . . . .
Script File Appearance . . . . . . . . . . . . . . . . . . . . . . . . . . . . . . . . . . . . . . . . . . . .
Opening a File . . . . . . . . . . . . . . . . . . . . . . . . . . . . . . . . . . . . . . . . . . . . . . . . . .
14-- 1
14-- 1
14-- 2
14-- 3
14-- 3
14-- 4
Menu and Controls . . . . . . . . . . . . . . . . . . . . . . . . . . . . . . . . . . . . . . . .
14--7
Menu Bar . . . . . . . . . . . . . . . . . . . . . . . . . . . . . . . . . . . . . . . . . . . . . . . . . . . . . .
Toolbar . . . . . . . . . . . . . . . . . . . . . . . . . . . . . . . . . . . . . . . . . . . . . . . . . . . . . . . .
Status Bar . . . . . . . . . . . . . . . . . . . . . . . . . . . . . . . . . . . . . . . . . . . . . . . . . . . . . .
14-- 7
14-- 9
14-- 10
Script File Editing and Encryption . . . . . . . . . . . . . . . . . . . . . . . . . . .
14--11
Keyword Color-Coding . . . . . . . . . . . . . . . . . . . . . . . . . . . . . . . . . . . . . . . . . . .
Parsing . . . . . . . . . . . . . . . . . . . . . . . . . . . . . . . . . . . . . . . . . . . . . . . . . . . . . . . .
Encryption . . . . . . . . . . . . . . . . . . . . . . . . . . . . . . . . . . . . . . . . . . . . . . . . . . . . .
14-- 11
14-- 11
14-- 12
Script Pad
Glossary
MTS400 Series MPEG Test System User Manual
ix
General Safety Summary
Review the following safety precautions to avoid injury and prevent damage to
this product or any products connected to it.
To avoid potential hazards, use this product only as specified.
Only qualified personnel should perform service procedures.
To Avoid Fire or
Personal Injury
Use Proper Power Cord. Use only the power cord specified for this product and
certified for the country of use.
Ground the Product. This product is grounded through the grounding conductor
of the power cord. To avoid electric shock, the grounding conductor must be
connected to earth ground. Before making connections to the input or output
terminals of the product, ensure that the product is properly grounded.
Observe All Terminal Ratings. To avoid fire or shock hazard, observe all ratings
and markings on the product. Consult the product manual for further ratings
information before making connections to the product.
Power Disconnect. The power cord disconnects the product from the power
source. Do not block the power cord; it must remain accessible to the user at all
times.
Do Not Operate Without Covers. Do not operate this product with covers or panels
removed.
Do Not Operate With Suspected Failures. If you suspect there is damage to this
product, have it inspected by qualified service personnel.
Avoid Exposed Circuitry. Do not touch exposed connections and components
when power is present.
Use Proper Fuse. Use only the fuse type and rating specified for this product.
Do Not Operate in Wet/Damp Conditions.
Do Not Operate in an Explosive Atmosphere.
Keep Product Surfaces Clean and Dry.
Provide Proper Ventilation. Refer to the manual’s installation instructions for
details on installing the product so it has proper ventilation.
MTS400 Series MPEG Test System User Manual
xi
General Safety Summary
Terms in this Manual
These terms may appear in this manual:
WARNING. Warning statements identify conditions or practices that could result
in injury or loss of life.
CAUTION. Caution statements identify conditions or practices that could result in
damage to this product or other property.
Symbols and Terms
on the Product
These terms may appear on the product:
H
DANGER indicates an injury hazard immediately accessible as you read the
marking.
H
WARNING indicates an injury hazard not immediately accessible as you
read the marking.
H
CAUTION indicates a hazard to property including the product.
The following symbols may appear on the product:
CAUTION
Refer to Manual
xii
Protective Ground
(Earth) Terminal
MTS400 Series MPEG Test System User Manual
Service Safety Summary
Only qualified personnel should perform service procedures. Read this Service
Safety Summary and the General Safety Summary before performing any service
procedures.
Do Not Service Alone. Do not perform internal service or adjustments of this
product unless another person capable of rendering first aid and resuscitation is
present.
Disconnect Power. To avoid electric shock, switch off the instrument power, then
disconnect the power cord from the mains power.
Use Care When Servicing With Power On. Dangerous voltages or currents may
exist in this product. Disconnect power, remove battery (if applicable), and
disconnect test leads before removing protective panels, soldering, or replacing
components.
To avoid electric shock, do not touch exposed connections.
MTS400 Series MPEG Test System User Manual
xiii
Preface
This manual describes the functions and use of the MTS400 Series
MPEG Test System. After the introduction, each section of the manual describes
one of the software applications or tools that make up the MTS400 Series
system.
H
MTS400 Series MPEG Test System Getting Started Manual (071-1505-xx).
H
MTS400 Series MPEG Test System Programmer Manual (071-1725-xx).
This manual specifies the remote control and status monitoring interfaces
available to a management application.
Related Material
Additional documentation, such as Read Me files, may be included on the
installation disks.
The following URLs access the Web sites for the standards organizations listed
(the URLs listed were valid at the time of writing):
H
MPEG-2 standards (International Organization for Standards)
http://www.iso.ch/
H
DVB standards (European Technical Standards Institute)
http://www.etsi.org/
H
ATSC standards (Advanced Television Systems Committee)
http://www.atsc.org/
H
ISDB/ARIB standards (Association of Radio Industries and Businesses)
http://www.arib.or.jp/english/
H
SCTE Society of Cable Television Engineers
http://www.scte.org/
MTS400 Series MPEG Test System User Manual
xv
Preface
Manual Conventions
Naming conventions for the interface elements are based on standard Microsoft
Windows naming conventions. Naming conventions for MPEG--2, ATSC, and
DVB structures follow the conventions derived from the standards listed above.
In addition, the following formatting conventions apply to this manual:
H
Bold text refers to specific interface elements that you are instructed to
select, click, or clear.
Example: Select Settings from the Configuration menu.
H
Mono--spaced text can indicate the following:
H
Text you enter from a keyboard
Example: Enter the network identity (http://TSMonitor01)
H
Characters you press on your keyboard
Example: Press CTRL+C to copy the selected text.
H
Paths to components on your hard drive
Example: The program files are installed at the following location:
C:\Program Files\Tektronix\
xvi
MTS400 Series MPEG Test System User Manual
Introduction
MTS400 Series Software Applications
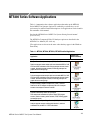
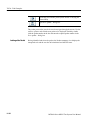
Table 1--1 summarizes the software applications that make up the MTS400
Series MPEG Test Systems. Options are enabled by a software key; not all
options may be enabled. Detailed descriptions of all applications can be found in
the remainder of this manual.
See also the MTS400 Series MPEG Test Systems Getting Started manual
(071-1507-xx).
The MTS4EA Compressed Video ES Analyzer options are described in the
MTS4EA User Manual (071-1641-xx).
(The applications are shown in the same order that they appear in the Windows
Start menu.)
Table 1- 1: MTS430 / MTS400 / MTS4SA / MTS4UP Installed Applications
Application
Desktop Icon
(where installaed)
Analyzers
Transport Stream Compliance Analyzer (TSCA) - Real Time
Real-time transport stream analysis with user-selectable MPEG-2, DVB,
ATSC and ISDB conformance tests. Shows transport structure, header
contents, hexadecimal packet contents, PCR timing /transport rate
graphs and error message logs.
Transport Stream Compliance Analyzer (TSCA) - Deferred
D.eferred transport stream analysis with user-selectable MPEG-2, DVB,
ATSC and ISDB conformance tests. Shows transport structure, header
contents, hexadecimal packet contents, PCR timing /transport rate
graphs and error message logs.
Transport Stream Compliance Analyzer Lite (TSCA) - Deferred
Same as for the TS Analyzer except that the file size of transport
streams to be analyzed is limited to 192 MB.
Packetized Elementary Stream (PES) Analyzer
PES analysis with selectable test options. Shows PES program
structure, header contents, packet contents, PTS/DTS timing graphs
and analysis reports.
Transport Stream - System Target Decoder (T-STD) Buffer Analyzer
Analyzes program streams modeling their behavior in, and their
conformance to, the MPEG 2 T STD Buffer Model.
MTS400 Series MPEG Test System User Manual
1- 1
MTS400 Series Software Applications
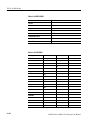
Table 1- 1: MTS430 / MTS400 / MTS4SA / MTS4UP Installed Applications (Cont.)
Desktop Icon
(where installaed)
Application
Elementary Stream Analyzer
Elementary Stream analysis at video picture and audio level. This
includes vector graphs and macroblock picture quality.
Carousel Analyzer
Data analysis showing structure, bit rate, repetition rate, syntax and
semantics of data items.
Generators
Carousel Generator
Provides in-depth off-line generation of MPEG-2, DVB transport
streams containing a range of data broadcast protocols.
Multiplexer
Multiplexes table information and packetized elementary streams
together to synthesize new transport streams. A fine level of control is
provided to allow non-conformances and test cases to be specified for
new transport streams.
TS Editor
Viewing and Editing of transport stream packets, using a hexadecimal
view of the packet contents and semantic interpretation of the header.
Provides facilities to remap PIDs, recalculate PCR values, and
introduce PCR inaccuracies.
Players
MPEG Player
Records and Plays out MPEG-2 streams.
Utilities
Tracer
Views the message log produced by T-STD Buffer Analyzer.
Make Seamless Wizard
Guides the user through the process of creating an MPEG-2 file for use
by Stream Player in continuously looped operation.
1- 2
MTS400 Series MPEG Test System User Manual
MTS400 Series Software Applications
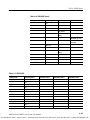
Table 1- 1: MTS430 / MTS400 / MTS4SA / MTS4UP Installed Applications (Cont.)
Application
Desktop Icon
(where installaed)
Stream Cutter
Extracts sections of MPEG-2 files to new files.
Script Pad
Enables users to create and modify System Information (SI) scripts.
MTS400 Series MPEG Test System User Manual
1- 3
Transport Stream Compliance Analyzer
Getting Started
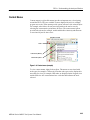
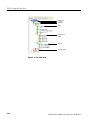
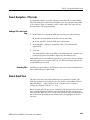
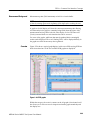
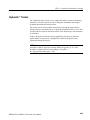
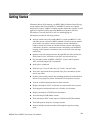
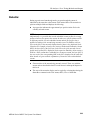
The MTS400 MPEG Transport Stream Compliance Analyzer (TSCA) enables
you to monitor and interpret the contents of real-time or previously recorded or
synthesized transport streams using the latest MPEG, DVB, ATSC, ISDB-T, and
ISDB-S standards.
The TSCA is specifically designed to enable you to quickly locate and identify
problems within a transport stream using a minimum number of mouse clicks.
By quickly identifying the problem areas, the TSCA software helps you save
time during the development and test of equipment, networks, and services. You
can configure the TSCA software to display stream information in user-selected
fonts. This feature enables you to view stream information in your local language
or to use custom fonts.
The TSCA software will run stand-alone on computers with Microsoft Windows
NT 4.0, Windows 2000, or Windows XP operating systems.
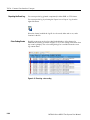
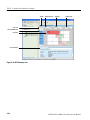
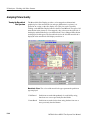
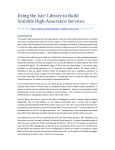
Figure 2- 1: TSCA Program View - Deferred Analysis
MTS400 Series MPEG Test System User Manual
2- 1
TSCA - Getting Started
TSCA Features
H
Easy “program centric” user interface quickly isolates information of interest
H
CaptureVut technology captures and analyzes system events in real or
deferred time
H
In-depth analysis of stored transport streams including support for MPEG,
ATSC, DVB, ISDB-T and ISDB-S table types
H
Data summaries and automated filters simplify the analysis of complex
transport streams
H
TR 101 290 Priority 1, 2 and 3 tests
(European Telecommunications Standards Institute (ETSI) TR 101 290:
Digital Video Broadcasting (DVB); Measurement Guidelines for DVB
Systems.)
H
Syntax analysis and display supported for TMCC and IIP data
H
Consistency checks performed between SI, TMCC, and IIP data
H
Proprietary PSI/SI syntax section rate error testing
H
Error logging
H
Suspension of all tests at program changeover based on PMT version change
H
DII and DDB error checking
Deferred and Real-Time Modes
The TSCA can be run in deferred or real-time mode. Deferred mode is available
on any recommended platform (including users’ own PCs). In deferred mode a
static stream can be analyzed and displayed; the content can then be inspected at
leisure. Real-time streams can be paused for detailed offline analysis and then
when the issue has been found, real-time analysis can be resumed. In real-time
mode, a “live” stream is analyzed and displayed and is available when the TSCA
is installed on a MTS400 series MPEG Test System with any
supported physical layer interface. Real-time monitoring of Video over IP
(internet protocol) is also available as a standalone application for running on a
user’s own PC.
2- 2
MTS400 Series MPEG Test System User Manual
TSCA - Getting Started
Technical Background
The analyzer has a client-server architecture. Each invocation of the analyzer
starts up two processes: tsca.exe, which is the client, and MpegCore.exe, which
is the MPEG analysis engine. Additionally, with the first invocation of the
analyzer, another single process, CoreManager.exe, is started. CoreManager.exe
forms an intermediary between TSCA clients and MPEG cores.
The tsca.exe, MpegCore.exe and CoreManager.exe processes use SNMP (Simple
Network Management Protocol) and HTTP (Hypertext Transfer Protocol) to
communicate. The port numbers used for communication are read from a
configuration file, CoreInfo.xml. In a default installation, this file can be found
in c:\program files\tektronix\mpeg\mts400\apps\tsca\xml\. The default port range
is 15700-15800. These values can be changed if they clash with other applications.
On the MTS400 platform, another process, mint.exe, runs from system startup.
This process controls shared access to the MTS400 Series hardware by the
analyzer and player.
You must have local administrator rights on the MTS400 unit or your PC to be
able to use IP analysis. If you need to change your rights on either the MTS400
or your PC, please consult your system administrator.
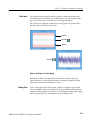
User Interface
The TSCA software uses a single main program summary window with different
context sensitive views contained within tabbed frames. This provides the
maximum amount of useful information while keeping the screen from appearing
cluttered. From the main window, you can access the following views:
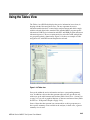
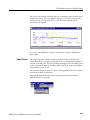
Program View
The Program view provides a fast overview of the transport stream contents in
terms of program content, bit rate use by each program, and TR 101 290 test
results. Red, amber and green LEDs highlight errors associated with each
program, or element of a program, within the transport stream. Red LEDs
indicate that there are current errors in the stream, amber LEDs indicate that
errors have occurred but are now clear, and green LEDs indicate that no errors
have been detected.
Errors that are detected at lower levels in the program stream hierarchy propagate
up to the highest level. This allows you to monitor all of the programs in the
stream at a high level and then quickly go to lower levels as necessary to locate a
problem.
MTS400 Series MPEG Test System User Manual
2- 3
TSCA - Getting Started
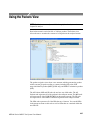
Tests View
SI/PSI (Tables) View
PID View
The Tests view enables you to isolate errors to the specific tests that have been
applied to the transport stream. The error log is automatically filtered by the
selected test, and can also be filtered by Packet Identifier (PID). In addition to
the standard first, second, and third priority tests included in TR 101 290
standard, tests are available for Program Clock Reference (PCR) jitter and
program/PID bit rate. A variability test enables you to test the changes in the bit
rate of a specific PID, and there are many tests that are specific to ISDB-T and
ISDB-S streams.
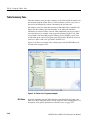
The SI/PSI (Tables) view displays the service information tables that have
occurred in the analyzed stream which comply with the selected digital video
standard. This includes MPEG specific program information, DVB service
information, and ATSC and ISDB program and system protocol information.
The tables are grouped together by function and hyperlinks enable you to quickly
access related information within other tables.
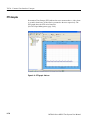
The PID view displays information about all of the PIDs found in the transport
stream. When you select a PID, the associated summary view provides a
PID-oriented overview of the transport stream, displaying the relative data rates
of all of the PIDs contained within the stream. The information can be displayed
as either a bar chart or as a pie chart. Pop up menus enable fast limit selection.
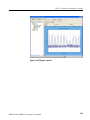
Each PID is associated with a number of tests. When one or more tests fail, each
failed test will be listed under the relevant PID. Select a specific PID to display a
summary of all the associated tests. Select a specific test to display the Event
Log and Parameters for that test only.
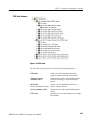
Packets View
The Packets view displays information about all of the packets found in the
transport stream grouped according to content. These groups include PID value,
SFN mega-initialization packets (MIPs) (DVB only), and ISDB-T information
packets (IIPs). When you select a specific PID or MIP, only packets carrying that
particular PID or MIP are displayed. A section view is also available.
The Packets view is not available in real-time mode. However, packets in a
real-time stream can be examined using the Capture-Vu feature.
2- 4
MTS400 Series MPEG Test System User Manual
TSCA - Getting Started
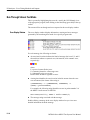
Capture Vut Feature
The CaptureVut feature captures a snapshot of system events in real and
deferred time and allows you to debug the intermittent and complex problems
that traditional analyzers miss. You can initiate CaptureVu either manually or
automatically by associating a CaptureVu Breakpoint with any test event. When
a breakpoint is detected, either manual or automatic, the stream is paused and an
in-depth deferred time analysis can be performed on stored data. This powerful
debug mode enables fast debugging of troublesome intermittent problems.
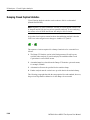
Triggered Recording
During real-time analysis, stream information can only be held for a finite time eventually it will be overwritten by more up-to-date information. Triggered
recording allows a portion of a stream to be recorded and subsequently analyzed
in detail.
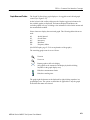
The following trigger sources and conditions apply:
H
Any test event
H
External input; (TTL) edge specifiable
H
Date and time
H
Recorded file size can be specified
H
Pretrigger buffer size can be specified as a percentage of the overall file size
range from 0 – 100%.
MTS400 Series MPEG Test System User Manual
2- 5
TSCA - Getting Started
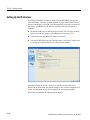
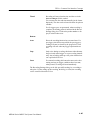
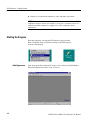
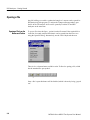
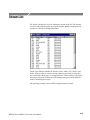
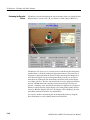
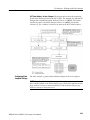
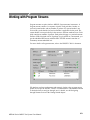
Starting the TSCA Software
The TSCA can analyze either transport streams in real-time or off-line (deferred)
mode.
Opening the TSCA
From the Windows Desktop, select Start > Programs > Tektronix MTS400 >
Analyzers > TS Compliance Analyzer.
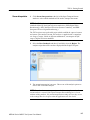
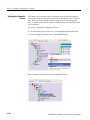
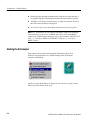
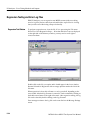
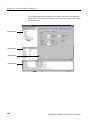
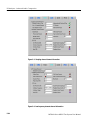
The TSCA is opened, initially overlaid with the Open Transport Stream...
dialog box.
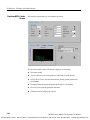
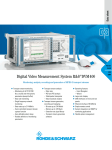
Click Analyze File to select the transport stream file to analyze and to select the method for calculating the
rate of the stream.
Click Real-time Analysis to select an
input source (IP or hardware interface) for real-time analysis.
Click Stream Interpretation to select
which standards will be used to interpret the stream file.
Figure 2- 2: TSCA Start-up
The Open Transport Stream... dialog box allows you to:
2- 6
H
Select the interpretation standard to be used for analysis.
(The stream interpretation should be checked and, if necessary, set first.)
H
Identify a stream file for off-line analysis.
H
Identify an MTS400 input (IP, ASI or SMPTE or DVB Parallel) receiving a
stream and start real-time analysis.
MTS400 Series MPEG Test System User Manual
TSCA - Getting Started
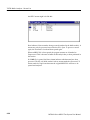
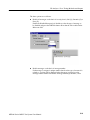
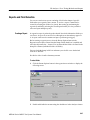
Stream Interpretation
1. Click Stream Interpretation at the left of the Open Transport Stream
window to select which standards will be used to interpret the stream.
NOTE. The TSCA software analyzes streams in strict accordance with the
standards defined by the digital television authorities: DVB (Digital Video
Broadcasting ), ATSC (Advanced Television Systems Committee), and ISDB
(Integrated Services Digital Broadcasting ).
The TSCA software uses preloaded scripts which establish the expected content
and syntax of the analyzed stream. The analyzer is supplied with a comprehensive range of scripts, which, in different combinations, can interpret the full
range of digital television standards.
2. Select the Base Standards and then (if available) select the Region. The
analysis scripts that will be used are displayed in the Script Files pane.
3. The stream interpretation is now set. Choose one of the analysis options to
select a file or real-time analysis.
NOTE. The selected stream interpretation standard is not implemented until
stream analysis is started. If the Open Transport Stream dialog box is closed
without starting analysis, the stream interpretation settings are lost; they revert
to the settings that were in effect when the application was last closed.
MTS400 Series MPEG Test System User Manual
2- 7
TSCA - Getting Started
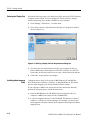
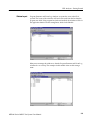
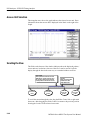
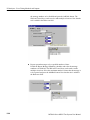
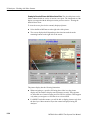
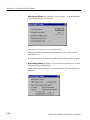
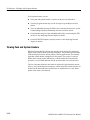
Off-Line (Deferred)
Analysis
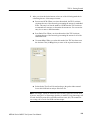
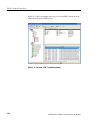
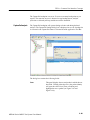
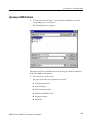
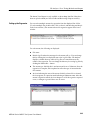
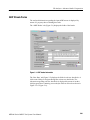
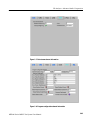
Perform the following steps to start analyzing a transport stream file:
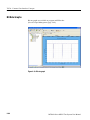
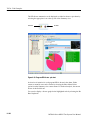
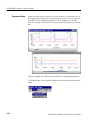
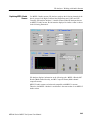
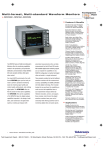
4. In the Open Transport Stream dialog box, with Analyze File selected, use the
drop-down box at the top of the window to browse to a transport stream file.
When you select a stream, the stream name appears in the field at the bottom
of the window.
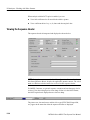
Figure 2- 3: TSCA File Analysis (Offline) dialog box
Calculating the Transport Rate. To analyze a transport stream correctly, you must
do one of the following:
H
Calculate the bit rate from PCRs (Program Clock Reference) carried in the
stream
NOTE. When the TSCA software analyzes a transport stream, it compares the bit
rate of the stream to the expected rate. Errors are reported based on the expected
rate of the stream. To analyze a stream correctly, it is necessary to know the
original bit rate of the stream or to calculate the bit rate from PCRs (Program
Clock Reference) carried in the stream. PCRs are generated as a stable clock
reference and are added to the stream during its generation. During analysis, the
PCRs are extracted and synchronized with a local clock reference.
2- 8
H
Know the original bit rate and enter it manually
H
Use timestamps included with the stream
MTS400 Series MPEG Test System User Manual
TSCA - Getting Started
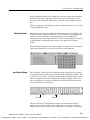
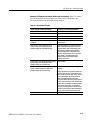
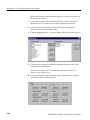
5. After you select the desired stream, select one of the following methods for
calculating the rate of the transport stream:
H
Prescan nnn PCRs. When you select this method, the TSCA software
calculates the rate of the stream by prescanning the stream for embedded
PCRs. The entry box lists the number of PCRs that the TSCA software
recommends are necessary to determine the stream rate. You can use the
entry box to enter a different number.
H
Scan Entire Files. When you select this method, the TSCA software
calculates the rate of the stream by prescanning the stream for all of the
embedded PCRs.
H
Use nnnn Mbps. When you select this method, the TSCA software uses
the absolute value (in Mbps) that you enter as the expected stream rate.
H
Packet Index. The file will be analyzed up to the packet index entered.
Leave this field blank to analyze the whole file.
NOTE. Timestamps, which are added when the stream is generated, will be used,
if present, and if the Use Timestamps checkbox is enabled. Using timestamps will
override the PCR options (Prescan PCRs and Scan entire file). The manual bit
rate setting will override both PCRs and timestamps.
MTS400 Series MPEG Test System User Manual
2- 9
TSCA - Getting Started
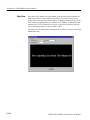
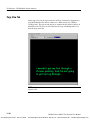
6. If the TSCA software cannot calculate the bit rate from the embedded PCRs,
or timestamps, a message box is displayed. You must enter an estimated bit
rate before the TSCA software can analyze the stream.
With a file selected and the transport rate calculation set up, you can start the
analysis (see page 2--11).
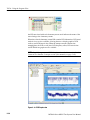
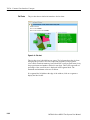
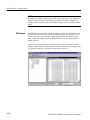
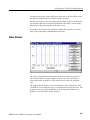
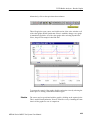
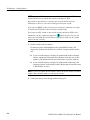
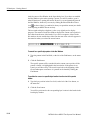
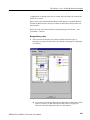
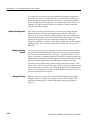
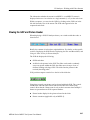
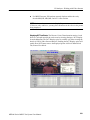
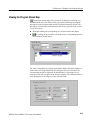
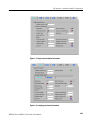
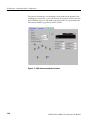
Real Time Analysis
Perform the following steps to start analyzing a transport stream received via IP
or a hardware interface.
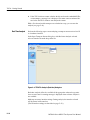
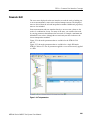
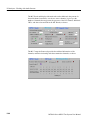
In the Open Transport Stream dialog box, with Real-time Analysis selected,
select an interface from the drop-down list.
Figure 2- 4: TSCA File Analysis (Real-time) dialog box
Real-time analysis will not be available if the appropriate software key permissions are not found. A warning message is displayed when real-time analysis is
not available.
Make any necessary interface settings. During analysis, the interface selected
will be shown in the status bar.
(The IP interface settings are described on page 2--12.)
2- 10
MTS400 Series MPEG Test System User Manual
TSCA - Getting Started
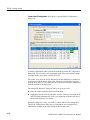
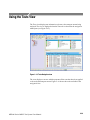
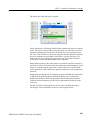
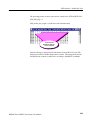
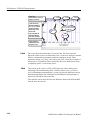
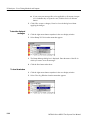
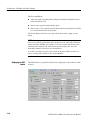
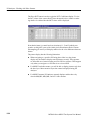
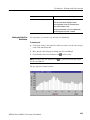
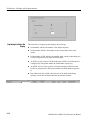
Start the Analysis
1. After you have selected the interpretation standard and the stream source,
click OK to continue.
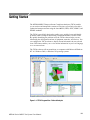
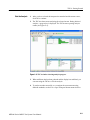
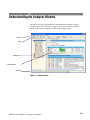
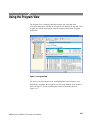
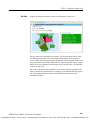
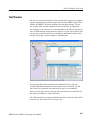
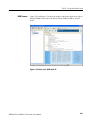
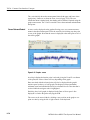
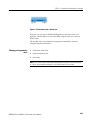
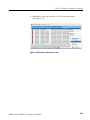
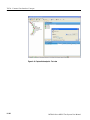
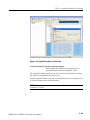
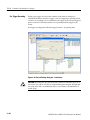
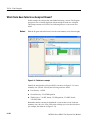
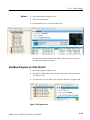
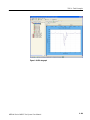
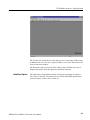
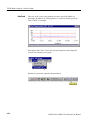
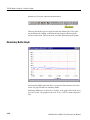
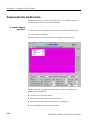
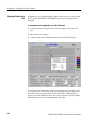
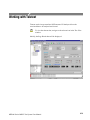
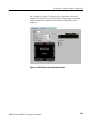
2. The TSCA software starts analyzing the selected stream. During deferred
analysis, a progress bar is displayed. The TSCA starts reporting analysis
results (see Figure 2--5).
Figure 2- 5: TSCA window showing analysis progress
3. When sufficient data has been gathered and the display has stabilized, you
can start using the TSCA to view the analysis.
4. To analyze another stream file or to reanalyze the current stream using
different standards, use the File > Open Transport Stream menu selection.
MTS400 Series MPEG Test System User Manual
2- 11
TSCA - Getting Started
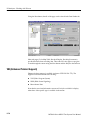
Setting Up the IP Interface
Two Ethernet interfaces are fitted as standard on the MTS400 Series systems
(one 10/100 Base T and one 10/100/1000 Base T GigE). These allow for basic
detection and display of all UDP (User Datagram Protocol) traffic on a network.
Extraction of an MPEG over IP stream is possible (if the licensed option is
enabled).
H
IP multicast addresses are indicated. Note that the TSCA will not automatically join a multicast group (see also Multijoin Utility, page 2--13).
H
UDP streams carrying MPEG TS traffic are indicated.
H
A selected UDP stream carrying TS traffic may be selected for analysis and
recording, in a similar manner to any other physical interface.
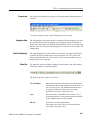
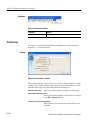
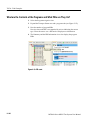
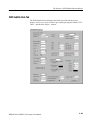
In the Open Transport Stream… dialog box with IP selected in the Select
Interface drop-down menu, the current settings for the selected configuration are
shown; the individual settings are described in the following paragraphs.
Select OK to confirm the IP setting and start analysis.
2- 12
MTS400 Series MPEG Test System User Manual
TSCA - Getting Started
Multijoin Utility
The real-time IP analysis capability can only analyze traffic that appears on the
link. To analyze a multicast that is not currently available on the link, a utility is
provided called multijoin. This joins the multicast, effectively causing the
multicast traffic to be broadcast to the host machine.
The multijoin utility can be found in the following directory:
“c\program files\tektronix\mpeg\mts400\utilities”.
To run the multijoin utility, open a command prompt window and change to the
directory in which multijoin is installed. Run multijoin.exe and provide the IP
address of the multicast you wish to join. For example, to join a multicast on
239.20.30.40 the command line would be: “multijoin 239.20.30.40”.
If the multicast can be joined successfully, the real-time IP analysis capability of
the TSCA will be able to analyze the multicast traffic. While multijoin is running
the mulicast traffic will be received; closing the program by typing Ctrl-C in the
command prompt will close the multijoin program and quit the multicast group.
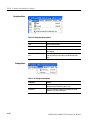
Interface Settings
Configurations
You can save individual IP settings configurations to disk; they can be recalled
when required. Up to 128 configurations can be specified.
The lower half of the Open Transport Stream… dialog box shows the settings
associated with the currently selected configuration. The current settings are
shown for information only; you cannot edit them in this dialog box. To change
the settings, either create a new IP configuration, edit the current IP configuration, or select another IP configuration.
MTS400 Series MPEG Test System User Manual
2- 13
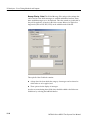
TSCA - Getting Started
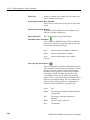
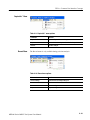
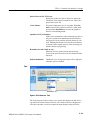
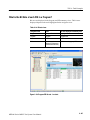
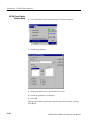
Create a New IP Configuration. Select New to open the Edit IP Configuration
dialog box.
A default configuration name is allocated and displayed in the IP Configuration
Name field. You can enter a more meaningful name. This name and the settings
associated with it will remain available for recall.
The names of any network devices installed in the unit (MTS400 or standalone)
are displayed in the IP Device Name field. Select the network device required
from the drop-down list. The traffic present on the selected interface is displayed
in the bottom half of the dialog box.
The settings (IP addresses, UDP port) can be set up in two ways.
H
Enter the values required in the IP and UDP fields.
H
Highlight a session in the current traffic area; the values are entered in the IP
and UDP fields automatically. Traffic carrying transport streams will have a
check mark in the Has TS column.
When the settings are correct, select OK to confirm and save the configuration.
The Edit IP Configuration dialog box is closed and the new configuration is
immediately available in the Open Transport Stream dialog box.
2- 14
MTS400 Series MPEG Test System User Manual
TSCA - Getting Started
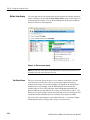
Edit an Existing IP Configuration. An existing IP configuration can be modified as
required.
Select Edit to open the Edit IP Configuration dialog box. Modify the individual
fields or select a new entry in the traffic area. Select OK to confirm and save the
changes and close the Edit IP Configuration dialog box. The new settings are
implemented immediately.
Select an Alternative IP Connection. Select a new configuration from the Interface
Settings drop-down list. Note the change in the Current Settings section of the
window.
Delete an IP Configuration. To delete an IP configuration, ensure that the
configuration to be deleted is displayed in the Open Transport Stream dialog box
and select Delete. The selected IP configuration is deleted and the next available
IP configuration is displayed.
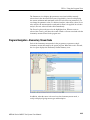
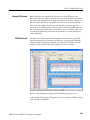
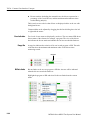
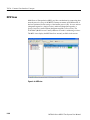
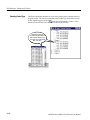
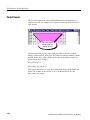
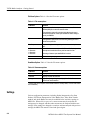
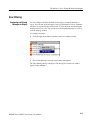
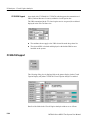
Setting the Stream Content Font
You can configure the TSCA software to display stream content information in a
user-defined font style or language, such as Japanese or Chinese.
NOTE. How the TSCA displays the text strings carried in the stream itself is
dictated by the TSCA font setting and by the interpretation standard used during
the analysis process.
How the TSCA displays entries in the Event Log is dictated by the TSCA font
setting and fonts used by a local computer. For example, if the default language
of the TSCA computer is Japanese, the event log will be displayed in Japanese
characters; you must choose a suitable font for the characters to display
correctly.
MTS400 Series MPEG Test System User Manual
2- 15
TSCA - Getting Started
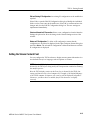
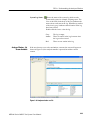
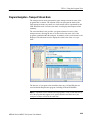
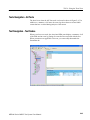
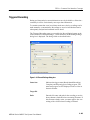
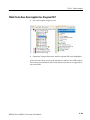
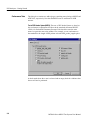
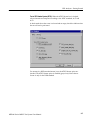
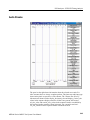
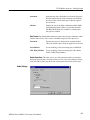
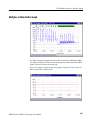
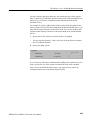
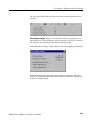
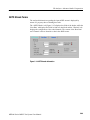
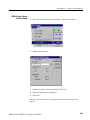
Selecting the Display Font
Perform the following steps to set which font will be used by the TSCA software
to display stream content. You can configure the TSCA software to display
stream content using any font that is installed on your computer.
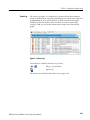
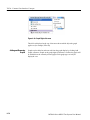
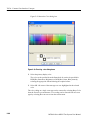
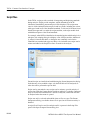
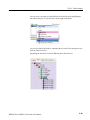
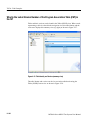
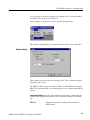
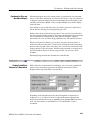
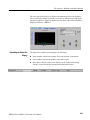
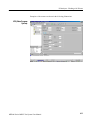
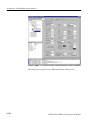
1. Select Settings > Preferences… from the menu.
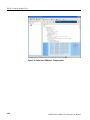
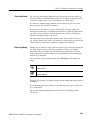
2. Select Font at the left of the Preferences dialog box to display the window
shown in Figure 2--6.
Figure 2- 6: Selecting a display font from the preferences dialog box
3. The dialog box lists the default font used by your computer for the Log
Entries and Stream Content displays on the TSCA software. Use the Font
Name and Font Size drop-down boxes to select a desired font style and size.
4. Click OK to accept and save any changes.
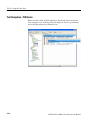
Installing Asian Language
Fonts
Computers that are using local versions of MS Windows NT and MS Windows 2000 (such as Japanese or Chinese), or using MS Windows XP, should
have the Asian language fonts already installed on their systems.
If your computer or MPEG test system does not have Asian fonts installed,
perform the following steps to install the Asian fonts:
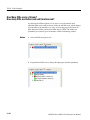
1. Insert the MS Windows OS CD-ROM, which was supplied with your
computer or MPEG test system, into the CD-ROM drive.
2. Locate the LangPack directory on the CD-ROM. This directory contains a
number of *.inf files for various languages. For example, you may want to
install japanese.inf and/or tchinese.inf, for Japanese and Traditional Chinese
language fonts.
2- 16
MTS400 Series MPEG Test System User Manual
TSCA - Getting Started
3. To install new fonts, right click on each desired font file in the LangPack
directory and select Install.
4. The new fonts you installed should now appear as possible font selections in
the Preferences dialog box. You must select the new font in the Preferences
dialog box before the new font will be used to display stream content.
Loading a Custom
Extension Font
The ARIB specifications for the ISDB standards make use of private extensions
to the standard Unicode character set [0xE000-0xF8FF]. These extensions allow
a user to add additional characters and non-standard proprietary characters to an
existing font. The extension sets are provided as TrueType Extension files (*.tte).
Any extension sets should be installed using the Private Character Editor which
is supplied as part of the standard MS Windows installation.
To install a font extension set on your computer:
1. Open the MS Windows Private Character Editor.
a. Select Run from the Start menu.
b. Enter eudcedit in the Run dialog box and click OK.
2. After the Private Character Editor opens, close the Select Code dialog box.
3. Select Font Links… from the File menu.
4. In the Font Links dialog box, select Link with Selected Fonts.
NOTE. If you select Link with All Fonts, the following actions will overwrite any
existing font extension sets.
5. In the Select Fonts box, find and highlight the font to which you are adding
the extension. This font should be the one you selected in the TSCA font
preferences dialog box.
6. After you select the font to which you are adding the extension, click on
Save As….
7. In the Modify Private Character Filename dialog box, browse to the
TrueType extension file you are adding (*.tte) and click Save.
8. In the Font Links dialog box, click OK.
9. Close the Private Character Editor window.
MTS400 Series MPEG Test System User Manual
2- 17
TSCA - Getting Started
10. To verify that the font extension has been successfully installed, open the
Character Map application.
a. Select Run from the Start menu.
b. Enter charmap in the Run dialog box and click OK.
11. Browse through the font list for the name of the font to which you added the
extension. The term “Private Characters” should follow the font name. When
you select the font name in the list, you can view the extended character set.
12. Close the Character Map application.
The new font extension you installed should now appear as a possible font
selection in the Preferences dialog box. You must select the new font in the
Preferences dialog box before the new font will be used to display stream
content.
2- 18
MTS400 Series MPEG Test System User Manual
Understanding the Analyzer Window
On start up, the user can immediately open and analyze a transport stream
(see Starting the TSCA Software on page 2--6). This will result in a display
similar to that shown in Figure 2--7; this is the working display.
Menu bar
Toolbar
Navigation view
Detail views/panes
Status bar
Figure 2- 7: Analyzer window
MTS400 Series MPEG Test System User Manual
2- 19
TSCA - Understanding the Analyzer Window
TSCA Window Components
The TSCA window contains the following components:
Menu Bar
Tool Bar
The Menu Bar provides access to a selection of system options using drop-down
menus (see Menu Bar and Options, page 2--109).
The buttons displayed on the tool bar provide shortcuts to often-used menu
options. Additional buttons displayed during real-time analysis are shown in
Table 2--1:
Table 2- 1: Tool bar icons
Deferred and Realtime Analysis
Opens the Open Transport Stream dialog box.
Restart analysis.
User actions are recorded during a session. The forward and back
buttons allow you to step through the actions in order to review or
repeat them.
Opens the Preferences dialog box from which you can set your
preferences.
CaptureVut
View CaptureVu status.
Resume file analysis.
Stop and capture analysis.
Realtime analysis
View record setting.
Arm record feature.
Start recording.
Stop recording.
2- 20
MTS400 Series MPEG Test System User Manual
TSCA - Understanding the Analyzer Window
Progress bar
The progress bar indicates the progress of processing during deferred analysis of
a stream.
To stop the analysis process, click the Stop button on the toolbar.
Navigation View
The left-hand pane in the main window is designated as the navigation view and
provides the main analysis information for the transport stream in a number of
forms: that is Programs, Tests, SI/PSI, PID and Packets. Views are selected using
the tabs at the top of the pane. The background of each view is color-coded to aid
identification.
Detail View/Panes(s)
The right-hand pane in the main window is the detail view and provides details
related to the selection made in the current navigation view. The overall view
may be subdivided into one or more panes; you can access individual views in
multiple pane views using tabs.
Status Bar
The status bar, when not hidden, is displayed at the bottom of the main window
and shows a summary of stream statistics.
The fields, from left to right, are as follows:
TS Availability:
Indicates that either the stream bit rate has fallen below
the minimum value or that synchronization has been lost
(see also Sync below). The minimum stream bit rate is
set using the “Min stream bit rate for processing”
parameter, see Parameter Edit, page 2--81.
Sync:
Shows the status of the MPEG sync loss test. Loss of
sync during analysis of a stream may mean that analysis
of the complete stream was not possible.
Bit rate:
Total bit rate of the transport stream.
The packet value (188 or 204) is set using the Preferences feature (see page 2--112).
MTS400 Series MPEG Test System User Manual
2- 21
TSCA - Understanding the Analyzer Window
Packet Size:
Packets in a stream can be either 188 or 204 bytes long.
This is detected automatically.
Stream Interpretation, Base Standard:
This is the set of tests that are being used to analyze the
stream.
Stream Interpretation, Region:
This subset of tests modifies the base standard; it may
add tests or modify existing ones.
Physical Interface:
The current interface for real-time analysis.
Partial Reception Availability:
Only available for ISDB-T streams. This icon indicates
the presence of partial reception data in the stream. The
colors indicate the status as follows:
Gray:
Partial reception availability is unknown.
Green:
Partial reception data is available.
Grey +
Partial reception data is not available.
red cross:
Processing Throttle Indicator:
This icon comprises two adjacent LED indicators which
show the status of the TSCA processing engine. The left
indicator shows the “strained” status; that is whether
throttling is being applied to cut down on the information being processed. The right indicator shows the
“overwhelmed” status; that is whether the processing
engine is able to cope with the amount of information in
the stream even after throttling. The colors indicate the
status as follows (The general color coding scheme is
described in Error Status LEDs, see page 2--24):
2- 22
Green:
OK
Amber:
Processing was strained/overwhelmed but is
currently OK
Red:
Processing is currently strained/overwhelmed
White:
Processor state is unknown
Gray:
Test disabled
MTS400 Series MPEG Test System User Manual
TSCA - Understanding the Analyzer Window
System Log Status :
Analyzer Window - No
Stream Available
Shows the status of the system log which records
system-wide events, for example, scripting errors. The
color of the LED (in the body of the icon) indicates the
most serious event state in the log. When the top surface
of the icon is gray, it indicates that all entries in the log
have been viewed.
Double-click the icon to view the log.
Gray:
The log is empty
Amber:
There are entries in the log, but none since
the log was last viewed
Red:
There are new entries in the log
If the user chooses not to select and analyze a stream, the screen will appear as
shown in Figure 2--8; the analysis structure is present, but with no stream
content.
Figure 2- 8: Analyzer window - no file
MTS400 Series MPEG Test System User Manual
2- 23
TSCA - Understanding the Analyzer Window
Error Status LEDs
A major feature used throughout the TSCA interface is error status LEDs that
represent the status of the tests applied to associated items: for example,
programs, tests and PIDs. Colors used are as follows:
(Red) Error; test failed
(Yellow) Transient error (error not currently being detected but has
been seen since last reset)
(Green) No error; test passed
(Gray): Test disabled
(White) Test not applicable or unknown state
(Red) PID referenced but not found in the stream
When an LED represents a parent node in a tree (for example, a program node is
the parent of elementary stream nodes), the color represents the worst case of all
of its tests and the worst case of all of the tests represented by its child nodes.
Similarly, when an LED representing a parent node in a tree is disabled or
enabled, all subsidiary (or child) nodes are also disabled or enabled to reflect the
state of the parent node. When an LED representing a parent node is reset, all the
child nodes are also reset.
NOTE. The color scheme described here is used throughout the TSCA interface.
For example, the bit rate bars in the navigation views.
Test Management Context
Menu Options
2- 24
Tests can be disabled and enabled as required using the context menu associated
with the LED icon. However, it is important to note that the extent of the action
depends on the hierarchical level of the icon chosen. For example, choosing
Disable from a program node context menu will disable all tests in the program
group.
MTS400 Series MPEG Test System User Manual
TSCA - Understanding the Analyzer Window
Context Menus
Context menus (or right-click menus) provide an important way of navigating
around the TSCA. They are available on most displayed objects, for example,
program tree nodes. These menus provide options relevant to the selected object.
For example, after failure, all tests associated with a node can be reset, by
selecting the context menu option Reset All Tests. The context menu options
provide both actions (for example, enable and disable a function) and shortcuts
to associated objects in other views.
Navigation view tabs
Nodes
Context menu (title bar)
Context menu options
Figure 2- 9: Context menu (example)
To view context menus, right-click an object. The menus are associated with
node types (for example, a PID node). Note that node types can be displayed in
more than one view; for example, PID nodes are displayed in the Program view
and the PID view. All context menus have a title bar that indicates the node
selected.
MTS400 Series MPEG Test System User Manual
2- 25
Using the Program View
The Program view is displayed when the Program tab is selected in the
navigation tabbed pane. Initially the navigation view displays the top node of the
program tree, which represents the analyzed transport stream from a program
perspective.
Figure 2- 10: Program View
The detail view shows details of the node highlighted in the navigation view.
With the tree expanded, the navigation view shows the makeup of the stream as
shown in Figure 2--10; the stream display consists of the nodes shown in
Figure 2--11:
MTS400 Series MPEG Test System User Manual
2- 27
TSCA - Using the Program View
Transport stream node
Program node
Elementary stream node
Figure 2- 11: Program View nodes
Table 2--2 shows which information is available for each node.
Table 2- 2: Program view tabs
Tabs /
Node
Summary
Now
Playing
MPE
Sessions
Associated
Tests
Graph Bit Rate
Graph PCR
Gra[ph PTS
Event
Log
Parameters
Transport
Stream
n
n
n
-
-
-
-
n
-
Program
n
n
-
n
n
-
-
n
n
-
-
-
n
n
n
n
n
n
Elementary
Stream
In DVB analysis mode, the MPE tab is always present; however, the MPE view
will only be populated when MPE data is present in the stream (see page 2--98).
Pressing the F3 key on the keyboard (or selecting Go to the next red LED in
current tree from one of the context menus) will highlight the next red LED in
the current view. Only the lowest level nodes will be considered and highlighted
in the search since the parent nodes simply reflect the state of the lowest level
nodes.
2- 28
MTS400 Series MPEG Test System User Manual
TSCA - Using the Program View
Program Navigation - Transport Stream Node
The transport stream node represents the entire transport stream in terms of the
programs that it contains. The adjacent LED icon represents the status of the
entire transport stream; any status error in the stream will be represented by this
LED. When this node is selected, the detail view displays the transport stream
summary.
The associated detail view provides a program-orientated overview of the
transport stream, allowing the user to see the relative data rates of all of the
programs contained within the transport. A summary of the overall stream is also
displayed. The information can be displayed as either a bar chart or as a pie
chart.
The data rate of a program is the cumulative data rate of all the PIDs that are
associated with that particular program, including PCR and ECM PIDs.
NOTE. Components can be shared between programs, so the overall data rate of
all of the programs may appear to be greater than the total data rate of the
transport stream as shown in the status bar.
MTS400 Series MPEG Test System User Manual
2- 29
TSCA - Using the Program View
Bar Chart
Display the transport stream bar chart by selecting the bar chart icon.
Each program identified in the stream is allocated one row of the table; related
information includes the overall program status (icon), the program name,
program number and the maximum, minimum and average bit rates. The Null
PID is not shown in this view.
In addition to the basic display, you can associate a maximum and minimum
threshold value with each program in the bar chart (see page 2--89). For deferred
analysis, where these values are set after analysis, the stream must be reanalyzed
for them to be applied. In real-time analysis, the new values will take effect
immediately. The color of the bit rate bar indicates that the program has stayed
within the bit rate limits (green) or exceeded the limits (red).
2- 30
MTS400 Series MPEG Test System User Manual
TSCA - Using the Program View
Pie Chart
Display the transport stream pie chart by selecting the pie chart icon.
The pie chart view is divided into two panes. The left pane shows the pie chart;
the right legend provides a list of the component programs. Each program is
color-coded; related information given includes the overall program status (icon),
the program name and number and the bit rate. The values given in the pie chart
labels are bit rates expressed as percentages of the overall bit rate. The Null PID
is shown in this view.
The color of the bit rate labels (and the bit rate values in the legend) reflects the
status of the bit rate measurement; for example, green indicates that the program
has stayed within the bit rate limits and red indicates that the bit rate has
exceeded the limits.
MTS400 Series MPEG Test System User Manual
2- 31
Test Equipment Depot - 800.517.8431 - 99 Washington Street Melrose, MA 02176 - FAX 781.665.0780 - TestEquipmentDepot.com
TSCA - Using the Program View
Bit Rate Value Display
You can toggle the bit rate displays between the mean bit rate and the current bit
rate by selecting or deselecting the Show Mean Values option on the detail view
context menus (see Figure 2--12). A checkmark adjacent to the option indicates
that mean values are to be displayed.
Figure 2- 12: Bit rate values display
NOTE. The bit rate value shown in the Status Bar is always the mean bit rate. It
is unaffected by the mean/current selection.
Test Status Panes
The lower view pane allows the user to see a summary of the states of all the
associated tests as well as the event log for the entire transport stream (an
un-filtered event log). The test tabs available will depend on the interpretation
standard chosen. For example, with the DVB interpretation standard, the
available tabs are TR 101 209 and Other. Other interpretation standards will
generate different tabs and different sets of tests (see SI/PSI Nodes, page 2--133).
When any test in the transport stream has failed (and has not been reset), the user
can identify which individual tests have failed by observing the red LEDs.
You can use the context menus to reset and disable tests, to set alarms, CaptureVu Breakpoints and record flags, and to jump to associated tests.
2- 32
MTS400 Series MPEG Test System User Manual
TSCA - Using the Program View
Event Log
The Event Log (Figure 2--13) displays the log entries for the whole transport
stream. In deferred mode, the packet generating the error report can be inspected
by highlighting the error and selecting Go to packet from the context menu.
Similarly, in real-time analysis mode, and where an event concerns a PID
carrying a PCR, you can use the context menu to jump to the relevant PCR
graph.
Figure 2- 13: Event Log
Two buttons are available in the Error Log toolbar:
/
Pin log / Log is Pinned.
Export Log.
The buttons are described in detail in Event Log, page 2--84.
MTS400 Series MPEG Test System User Manual
2- 33
TSCA - Using the Program View
Program Navigation - Program Nodes
Each of the program nodes in the transport stream represents a single program
referenced within the stream. When a program node is selected in the navigation
view, the detail pane displays the details of the program. The LED adjacent to
the program node represents the status of its child nodes (elementary streams)
and the related tests.
The program detail view provides the user with an overview of the selected
program, allowing the user to see the relative data rates and stream types of all of
the PIDs that are associated with the program (including PCR and ECM PIDs).
If the program contains an MPEG2 video stream, it is decoded to produce a
thumbnail picture of the content; this is updated during real time. Similarly,
where EPG information is associated with the program, a summary (Now and
Next program) is displayed. PID content is indicated using icons, which are
described on page 2--65. Bar chart and pie chart views are available.
PID related information is available under the Summary tab.
The Now Playing tab displays thumbnails for all programs (where available).
The Associated Test tab shows tests related to the program. Similarly, the Bit
rate Graphs tab displays the program bit rate in graph form.
2- 34
MTS400 Series MPEG Test System User Manual
TSCA - Using the Program View
The Parameters view displays the parameters associated with the currently
selected test in the Associated Tests pane (if applicable). As well as displaying
the current, minimum and maximum values for each of the test parameters, you
can change the parameter value. For deferred analysis, where these values are set
after analysis, the stream must be reanalyzed for them to be applied. In real-time
analysis, the new values will take effect immediately.
The Event Log shows the errors for the highlighted test. When no tests are
selected, the event log will show the events related to all tests associated with the
elementary stream selected in the program tree.
Program Navigation - Elementary Stream Node
Each of the elementary stream nodes in the program tree represents a single
elementary stream referenced by the parent program. When this node is selected,
the view pane displays the Elementary Stream summary view.
In addition, when the cursor is hovered over the elementary stream node, a
tooltip is displayed giving stream type and description.
MTS400 Series MPEG Test System User Manual
2- 35
TSCA - Using the Program View
An LED associated with each elementary stream node indicates the status of the
tests relating to the elementary stream.
When the selected elementary stream PID contains PCR information, PCR trend
analysis views are also available, allowing the user to display graphs of PCR
accuracy and PCR interval data. When the transport stream contains time
stamping data, the PCR overall jitter, PCR frequency offset, PCR arrival time
and PCR drift rate graphs are also available.
NOTE. Graph Management and PCR Graphs are described in more detail in the
Common User Interface Concepts section of this manual (see page 2--63).
Figure 2- 14: PCR Graphs view
2- 36
MTS400 Series MPEG Test System User Manual
TSCA - Using the Program View
The Associated Tests tab shows tests related to the elementary stream node.
The Parameters view displays all of the parameters for the currently selected test
in the Associated Tests pane (if applicable). As well as displaying the current,
minimum and maximum values for each of the test parameters, you can change
the parameter value. For deferred analysis, when values are changed, the stream
must be reanalyzed for them to be applied. In real time, the changes will take
effect immediately.
Similarly, the Event Log shows the errors for the highlighted test. When no tests
are selected, the event log will show the events related to all tests associated with
the elementary stream selected in the program tree.
MTS400 Series MPEG Test System User Manual
2- 37
Using the Tests View
The Tests view displays test information relevant to the transport stream being
analyzed. The view is displayed when the Tests tab is selected in the navigation
tabbed pane (see Figure 2--15).
Figure 2- 15: Tests Navigation view
The view displays a test tree which represents all the tests that have been applied
to the analyzed transport stream. Figure 2--16 shows the nodes available in the
navigation view.
MTS400 Series MPEG Test System User Manual
2- 39
TSCA - Using the Tests View
All Tests
Group
Priority
Test
Associated
PIDs
Subset
Group ’Other’
Figure 2- 16: Test View nodes
2- 40
MTS400 Series MPEG Test System User Manual
TSCA - Using the Tests View
Test Structure
The test tree structure represents all of the tests that can be applied to a transport
stream complying with a particular digital video standard: MPEG, DVB, ATSC,
ISDB--S and ISDB--T. Select the standard before beginning analysis. The test
tree contains nodes for each individual test that the analyzer can implement.
An example of a tree structure for a selected standard is the TR 101 290 group of
tests for DVB transport streams (shown in Figure 2--16). The Group node is split
into priority groups (First Priority, Second Priority and Third Priority). Each of
these priority groups contains a number of individual tests.
Test grouping differs between digital video standards; however, all of the
currently implemented standards contain a subset of the relevant TR 101 290
tests. Note that in standards other than DVB, the tests are not numbered.
Where relevant, PIDs will be associated with a test in the test tree when the test
has either been disabled or when it has failed.
The LED associated with each node indicates the status of the node and its child
node tests (see Error Status LEDs on page 2--24).
MTS400 Series MPEG Test System User Manual
2- 41
TSCA - Using the Tests View
Figure 2--17 shows an example of the test view for an ISDB-T stream. Note the
additional group node - ISDB-T Tests.
Figure 2- 17: Test view - ISDB- T standard (example)
2- 42
MTS400 Series MPEG Test System User Manual
TSCA - Using the Tests View
Tests Navigation - All Tests
The detail view when the All Tests node is selected is shown in Figure 2--15. In
addition to a summary of all tests, the event log shows the most recent 10000
events that have occurred during analysis of the stream.
Test Navigation - Test Nodes
When you select a test node, the Associated PIDs pane displays a summary of all
of the PIDs and an event log listing all events that are associated with the test.
Where parameters are applicable to the test, you can modify them under the
Parameters tab.
MTS400 Series MPEG Test System User Manual
2- 43
TSCA - Using the Tests View
Test Navigation - PID Nodes
Where tests have failed, the PIDs affected are listed under the test node in the
Tests navigation view. Selecting a PID will display the Event Log and Parameters for the PID and the test in the detail view.
2- 44
MTS400 Series MPEG Test System User Manual
Using the Tables View
The Tables view (SI/PSI tab) displays the service information in tree form, in
keeping with the other navigation views. The tree represents the service
information tables that have occurred in the analyzed stream and which comply
with the selected digital video standard. This includes MPEG program specific
information, DVB service information and ATSC and ISDB program and system
information protocol. The tree contains nodes for each table found; tables/nodes
are grouped together by functionality. Figure 2--18 shows an example of Table
navigation view with DVB stream interpretation selected.
Figure 2- 18: Tables view
Every node within the service information tree has a corresponding summary
view. In addition to this, nodes that represent tables will also provide the user
with access to the table structure and hex data (Tables Detail View - Section View
on page 2--47) as well as graphical displays of data rates and interval data (Tables
Detail View - SI Repetition Graphs on page 2--49).
Some of the nodes that represent less common tables or table groups may not
have specific summary views available in the analyzer; in these cases, a generic
summary view is used.
MTS400 Series MPEG Test System User Manual
2- 45
TSCA - Using the Tables View
Table Summary Pane
The table summary view provides a summary of the table related information for
the analyzed transport stream. There is a table summary view for every node of
the service information; the content is dictated by the selected node.
All summary views for nodes that represent an individual table or subtable will
display the table identity and version number of the table from which the
information is extracted. Where relevant, links (underlined text) are provided to
associated objects; for example, in the programs summary (Figure 2--19), links
are provided to the individual program summary views. Similarly, arrow icons
provide links to the electronic program guide (EPG) tables. Where the section is
carried on a PID, a link is also provided to the PID view.
Figure 2--19 shows an example of the summary pane with the PMT PIDs node
selected in the navigation view.
Figure 2- 19: Tables view - Programs (example)
EPG Views
2- 46
A specific departure from the Table Summary view described previously is the
EPG view; this is displayed when a section of the EPG table is highlighted. For a
description of the general presentation of the EPG view, see page 2--93.
MTS400 Series MPEG Test System User Manual
TSCA - Using the Tables View
Tables Detail View - Section View
The detailed section view is available when the selected node in the service
information tree represents a table or subtable in the transport stream. During
real-time analysis the view is continually updated.
The subtable identity, version and section are displayed at the top of the table
pane.
H
In deferred mode, where two or more subtables, versions or sections are
found in the stream, the relevant field is active and an alternative selection
can be made from the drop-down list.
H
In real-time mode, only the latest version and section can be viewed.
The table pane shows all fields that make up a section (for example, PMT). The
fields are arranged in a hierarchical order. The presence of subordinate fields is
indicated using a { } symbol adjacent to the container field. The container can be
expanded or collapsed by clicking the + or – icon.
Below the table pane, the data source is displayed. The data pane shows the data
bytes (in both hexadecimal number format and ASCII character format) for the
selected table, version and section. When a node is selected in the table pane the
bytes that make up the selected node (including the subordinate nodes) are
highlighted in the hex data pane (refer to Figure 2--20).
MTS400 Series MPEG Test System User Manual
2- 47
TSCA - Using the Tables View
Figure 2- 20: Section payload
If the section is corrupted or empty, the hex view background is red instead of
blue.
2- 48
MTS400 Series MPEG Test System User Manual
TSCA - Using the Tables View
Tables Detail View - SI Repetition Graphs
The section graph view will be available when the selected node in the service
information tree represents a table or subtable in the transport stream. You can
view graphs of the following data:
H
Section repetition interval.
This graph displays the interval between two sections of a table on a
particular PID.
H
Subtable intersection gap.
This graph displays the interval between sections in a particular subtable.
H
Subtable repetition interval.
This graph displays the time between receiving one complete subtable and
receiving the next complete subtable.
NOTE. Not all of the above graph types are relevant to all table types
Graph Management is described in more detail in the Common User Interface
Concepts section of this manual (see page 2--63).
MTS400 Series MPEG Test System User Manual
2- 49
Using the PID View
The PID view displays information about all of the PIDs found in the transport
stream being analyzed. The navigation view contains the PID tree; this is a tree
structure representing all of the PIDs that have occurred within the transport
stream.
In DVB analysis mode, the MPE tab is always present; however, the MPE view
will only be populated when MPE data is present in the stream (see page 2--98).
MTS400 Series MPEG Test System User Manual
2- 51
TSCA - Using the PID View
PID View - All PIDs
In the navigation view, PIDs are grouped under four subordinate nodes:
H
Reserved PIDs
H
Referenced PIDs
H
Unreferenced PIDs
H
User PIDs
H
Obsolete PIDs
The number of PIDs in each group is shown adjacent to the node. The root node
label shows the total number of PIDs found and the Network Name.
When highlighted, the All PIDs node displays in the detail pane all of the PIDs
found in the analyzed stream.
Each of these subordinate nodes contains PIDs belonging to that group. PIDs are
allocated during analysis; the number of PIDs is identified for each node. You
can also allocate PID numbers to the User PID node; user PIDs may not
necessarily have been found in the stream. This feature allows you to compare
the properties of one or more PIDs more easily.
The associated summary view provides a PID-oriented overview of the transport
stream, allowing you to see the relative data rates of all of the PIDs contained
within the transport stream. The information can be displayed as either a bar
chart or as a pie chart. Columns in the summary views can be sorted in ascending
or descending order by clicking on the column header. PID related information is
available under the PID Infromation tab.
Each PID is associated with a number of tests. If one or more tests fail, they will
be listed under the relevant PID node in the navigation view. Selecting the PID
node will display a summary, in the detail view, of all associated tests that have
been found. Selecting a specific test in the Associated Tests pane will display the
Event Log and Parameters for that test only.
2- 52
MTS400 Series MPEG Test System User Manual
TSCA - Using the PID View
PID View - Detail View (All PID and Group)
The All PID and PID Group detail view provides you with a PID oriented
overview of the transport stream. This view is displayed when any of the main
nodes is selected in the navigation pane: All PIDs, Referenced PIDs, Unreferenced PIDs or User PIDs.
The view shows the relative data rates of all of the PIDs contained within the
selected node; you can display the information in either a bar chart or a pie
format. The associated test states are shown in all views.
Figure 2- 21: PID Summary view
The PID Information view (see Figure 2--22) provides PID related information;
for example, PID type stream type, scrambled status and the presence of PCRs.
Layer information is also shown when analyzing ISDB streams.
In deferred mode (or during CaptureVu analysis) view the packets carrying a PID
by highlighting the PID and selecting Go To Packets view from the context
menu; the packet will be added to the PIDs list (in the Packets view).
MTS400 Series MPEG Test System User Manual
2- 53
TSCA - Using the PID View
Figure 2- 22: PID Information view
PID View - Detail View (PIDs)
The individual PID detail view provides you with information about the selected
PID. This view will be visible when you select an individual PID node in the
PID tree. Where a PID has failed a test, one or more test nodes are displayed as
child nodes of the PID.
The combination and detail of the views varies depending on the selected PID
type and node.
During deferred or captured analysis, the packets carrying the PID can be
examined in more detail by highlighting a PID and selecting Go to Packets view
from the context menu.
2- 54
MTS400 Series MPEG Test System User Manual
TSCA - Using the PID View
Ordinary PID Selected
When a PID does not contain PCRs, the main view in the PID pane is the
Associated Tests view. This view lists the tests associated with the selected PID;
the status of the individual tests is indicated with LED icons. Also available are
Bit rate Graphs which show in graphical form the bit rate of the selected PID.
Also on the Associated Tests tab is an event log and a parameters pane. The
event log shows all PID related events. If a test is selected in the PID pane, only
the events associated with that test on that PID are shown. Similarly, when a test
is selected, the Parameters pane shows the parameters associated with that test
(when applicable).
PCR PID Selected
When the selected PID contains PCR information, PCR inaccuracy and PCR
interval data graphs will be displayed in addition to a bit rate graph. When the
transport stream contains time stamping data, the PCR overall jitter, the PCR
frequency offset and the PCR drift rate graphs will also be available.
(Refer to Graph Management, page 2--68 and PCR Graphs, page 2--74.)
A Presentation Time Stamp (PTS) graph may also be available on PIDs carrying
audio and video information.
MTS400 Series MPEG Test System User Manual
2- 55
Using the Packets View
NOTE. The Packets view is only available during deferred analysis and
CaptureVu analysis.
Data in the stream is carried in 188- or 204-byte packets. The Packets view
allows the user to examine the contents of each packet in the analyzed stream.
The packet navigation view shows a tree structure which represents the packets
within a stream grouped according to content, including PID value, SFN
mega-initialization packets (MIPs) (DVB only) and ISDB-T information packets
(IIPs).
The All Packets, MIP and IIP nodes do not have any child nodes. The All
Packets node represents all of the packets in the transport stream. The MIP node
will represent all of the DVB SFN MIPs in the transport stream. The IIP node
will represent all of the ISDB-T information packets in the transport stream.
The PIDs node represents all of the PIDs that are of interest. You can add PIDs
in the transport stream to this node as well as PIDs that are contained within the
user PID list.
MTS400 Series MPEG Test System User Manual
2- 57
TSCA - Using the Packets View
Selecting any leaf node in the packet tree will apply a packet filter to the
associated packets. For example, selecting a PID node will only allow packets
carrying that particular PID to be displayed in the associated summary view;
similarly, selecting the MIP node will only allow MIP information to be
displayed in the associated summary view.
Packet Navigation Bar
In the packet summary view, you can use the top bar to navigate the packets in
the stream.
The packet position bar shows the position of the selected packet in the stream.
Current packet position
The navigation bar functionality depends on the selection in the packet navigation view. If you select All Packets, the controls will operate on all packets. If
you select a single PID, a filter is in operation and the controls will work only
for those packets carrying that PID.
Selects the first available packet (in the stream or carrying the selected PID).
Selects the previous available packet (in the stream or carrying the selected PID).
Selects the next available packet (in the stream or carrying the selected PID).
Selects the last available packet (in the stream or carrying the selected PID).
Opens the Go To Packet dialog box.
You can also use the packet position bar to navigate through the stream. Use the
cursor to point to and click the next packet to be displayed. Double-click the
packet number in the bar to open the Go To Packet dialog box; enter the required
packet number and select OK. For both methods, remember that the destination
packet is dependent on the node selected in the navigation view.
2- 58
MTS400 Series MPEG Test System User Manual
TSCA - Using the Packets View
Packet Navigation - PIDs node
To inspect the sequence of packets carrying a particular PID, you must add the
PID to the PIDs node in the Packet Navigation view. You can add as many PIDs
as are required. There are a number of ways to add a PID to the node; they are
described in the following paragraphs.
Adding a PID in the Packet
View
1. In the Packet view, expand the PIDs node by doing one of the following:
H
Double-click the child node (double-click to add a PID)
H
Select Add PID... from the PIDs node context menu
2. In the Add PID... dialog box, expand the nodes, locate and select the
required PID.
3. Click OK.
The selected PID is added to the PIDs node and that the first occurrence of a
packet carrying the selected PID is displayed in the summary view.
Added PIDs will be stored when the application is closed; they will be reinstated
when the application is reopened. However, if a different stream is analyzed, the
stored PIDs may not be used.
Removing PIDs
All PIDs previously added to the PID node can be removed by selecting Remove
All from the PIDs node context menu.
Packet Detail View
The detail view shows the fields and data that are contained in a packet. The
fields are arranged in a hierarchical order. The presence of subordinate fields is
indicated using a { } symbol adjacent to the container field. To expand or
collapse the container, click the + or - icon.
Below the table pane, the data source is displayed. The data pane shows the data
bytes (in both hexadecimal number format and ASCII character format) for the
selected packet. When you select a node in the table pane, the bytes that make up
the selected node (including the subordinate nodes) are highlighted in the hex
data pane.
MTS400 Series MPEG Test System User Manual
2- 59
TSCA - Using the Packets View
The packet transport header bytes are displayed in red. Similarly, bytes greater
than 188 are displayed in gray. The adaptation field, where present, is displayed
in blue.
If the section is corrupted or empty, the background of the hex view is red
instead of blue.
2- 60
MTS400 Series MPEG Test System User Manual
TSCA - Using the Packets View
ISDB Streams
Figure 2--23 and Figure 2--24 show an example of the packet detail view with an
analyzed ISDB-T stream. Note the IIP tab and the additional TMCC and IIP
nodes.
Figure 2- 23: Packet view - ISDB detail -IIP
MTS400 Series MPEG Test System User Manual
2- 61
TSCA - Using the Packets View
Figure 2- 24: Packet view - ISDB detail - Transport packet
2- 62
MTS400 Series MPEG Test System User Manual
Common User Interface Concepts
Many user interface concepts are used throughout the analyzer. The following
common elements are described in this section:
H
Windows Management
H
Icons
H
Graph Management
H
PCR Graphs
H
PTS Graphs
H
Bit Rate Graphs
H
Parameter Edit
H
Event Logs
H
Bit Rates
H
EPG View
H
MPE Views
H
CaptureVut Features
H
Triggered Recording
H
Menu Bar and Options
H
Preferences
H
Script Files
Windows Management
NOTE. For basic Windows operations such as minimizing windows or using the
scroll bars, refer to the MS Windows documentation.
In addition to the standard windows management methods, the following
controls are added which allow the windows panes to be resized.
MTS400 Series MPEG Test System User Manual
2- 63
TSCA - Common User Interface Concepts
Horizontal and Vertical
Controls
Horizontal and vertical control icons are placed between adjacent panes. Clicking
on an icon will expand the adjacent pane in the direction shown by the icon.
The size of panes can also be controlled by placing the cursor over the horizontal
or vertical dividing bar so that it changes to a bidirectional arrow. The dividing
bar can then be dragged to the required position; an example is shown in
Figure 2--25.
Figure 2- 25: Window size adjustments
Table Manipulation
2- 64
In views such as the PID summary view, which takes the form of a table, the
columns can be sorted in ascending or descending order by clicking the section
of the header bar on which the table is to be sorted. Similarly, column widths can
be adjusted by dragging the column divider bar to the required column width.
MTS400 Series MPEG Test System User Manual
TSCA - Common User Interface Concepts
Icons
Icons are used in the TSCA to convey information about a node or function.
Table 2--3 and Table 2--4 show the icons used in the TSCA with a brief description of each. Table 2--5 shows the icons used in the quick link section of context
(right-click) menus.
NOTE. The display of all icons is context dependent. Not all icons will be visible
in all views.
Table 2- 3: Object identification icons
Icon
Description
Application Information Table (MHP)
Audio
Conditional Access PID
Data stream
Packet
PCR
Program
Programs
SI table
SI table container
SI tables
Stream scrambled
Subtitles
Teletext
MTS400 Series MPEG Test System User Manual
2- 65
TSCA - Common User Interface Concepts
Table 2- 3: Object identification icons (Cont.)
Icon
Description
Video
Video + audio
Table 2- 4: Interface management icons
Icon
Description
Open transport stream
View CaptureVu settings
Capture analysis
Bar Chart
Pie chart
Link to
Preferences
Audible alarm
CaptureVu breakpoint
Graph management
Hide limits
Add graph
Remove graph
Zoom in
Zoom out
2- 66
MTS400 Series MPEG Test System User Manual
TSCA - Common User Interface Concepts
Table 2- 4: Interface management icons (Cont.)
Icon
Description
Packet management
Remove all PID packets
Remove PID packet
Add PID packet
PID packet group
PID packet placeholder
Go to first packet
Go to previous packet
Go to next packet
Go to last packet
Open Go To Packet dialog box
Action control
Go to previous view
Go to next view
Table 2- 5: Quick link icons
Icon
Description
Go to next red LED in current tree
View this PID in PID tree
View packets with this PID
View packets in Packet tree
View PCR graphs
MTS400 Series MPEG Test System User Manual
2- 67
TSCA - Common User Interface Concepts
Table 2- 5: Quick link icons (Cont.)
Icon
Description
View this program’s PMT in SI tree
View this test in Tests tree
Graph Management
A number of screens displaying graphs are available in the analyzer. The graphs
are described in the relevant sections of this manual. This section describes the
management of the graphs user interface.
A number of categories of graphs are available.
Four categories of graph exist: those relating to PCR measurements, section
timing, bit rates and PTS (Presentation Time Stamps).
The PCR measurement graphs include:
H
PCR Drift
H
PCR Inaccuracy
H
PCR Arrival Interval
H
PCR Frequency Offset
H
PCR Jitter
The section timing graphs include:
H
Section Repetition Interval
H
Subtable Inter Section Gap
H
Subtable Repetition Interval
The category of graph displayed depends on the selection made in the navigation
view. Categories include PCR Measurement, Section Timing, PTS (Presentation
Time Stamp) and Bit Rate. However, the menus and options for the graphs are
similar and as described in the following pages.
2- 68
MTS400 Series MPEG Test System User Manual
TSCA - Common User Interface Concepts
Measurement Background
Measurement points (2048 maximum) are held in a circular buffer.
NOTE. A circular buffer is an area of memory used to store a continuous stream
of data by starting again at the beginning of the buffer after reaching the end.
A graph set for full display will show the current measurement points. During
real-time analysis, the graph is constantly being filled (from the right to left);
measurements moving off the left side of the display are lost. The time scale
(Y-axis) is started from zero each time that the node is accessed.
For some of the graphs, sufficient data must be gathered before meaningful
results can be displayed. The word “Settling Time” will be displayed briefly in
the graph area while the necessary data is gathered.
Overview
Figure 2--26 shows a typical graph display; in this case a PID carrying PCR has
been selected and two of the five available PCR graphs are displayed.
Figure 2- 26: PCR graphs
Within the category, the x axis is common to the all graphs. A horizontal scroll
bar allows you to select an area for inspection when the graph extends beyond
the display area.
MTS400 Series MPEG Test System User Manual
2- 69
TSCA - Common User Interface Concepts
The y axis initially shows the measurement limits (both upper and lower where
appropriate). Limits are set from the Tests view (see page 2--39). The area
outside the limits is shaded (red); the shading can be hidden if required using the
graph context menu. The Y axis is rescaled to show the maximum and minimum
data points.
Cursor Data and Control
A cursor can be displayed on the graphs allowing you to see accurate measurements in the adjacent data panel. Place the cursor by left-clicking any data point
on one of the graphs. Note that the cursor is displayed at the same point on all of
the visible graphs.
Figure 2- 27: Graphs - cursor
A tooltip is displayed when the point is selected giving the X and Y coordinates
of the point; the values of these will vary depending on the graph.
Data associated with the selected point will also be displayed in the graph’s
statistics panel (at the top of each graph). The displayed values (maximum,
minimum, mean and standard deviation) are calculated for all of the data that is
received while the navigator node is highlighted.
Similarly, data for all graphs is displayed in the Data at Cursor panel. Also
displayed is a link to the packet carrying the PCR.
The cursor can be moved either by clicking a new position on the graph or one
point at a time by using the left or right controls on the keyboard.
2- 70
MTS400 Series MPEG Test System User Manual
TSCA - Common User Interface Concepts
Graph Menu and Toolbar
The Graph Toolbar allows graph displays to be toggled on and off and graph
controls (see Figure 2--27).
At the left end of the toolbar, adjacent to the Graphs: toggle-action buttons for
the available graphs are displayed. The buttons displayed (and hence, the
available graphs) will vary according to the information carried in the stream and
the measurements enabled.
Select a button to display the associated graph. The following abbreviations are
used:
AI
OJ
AC
DR
FO
Arrival Interval
Overall Jitter
Inaccuracy
Drift Rate
Frequency Offset
(See PCR Graphs, page 2--74 for an explanation of the graphs.)
The remaining graph controls are as follows:
Zoom in
Zoom out
Return graphs to full scale display
(All graphs can be returned to full display by double-clicking
anywhere in the graph display area.)
Hide/show measurement limits
Hide/show settling time
The graph right-click menu can be displayed by right-clicking anywhere in a
graph display area. The options on the menu are applicable to only the graph
from which the menu was selected.
MTS400 Series MPEG Test System User Manual
2- 71
TSCA - Common User Interface Concepts
Figure 2- 28: Graph Right-click menu
The title bar displayed at the top of the menu shows which object the graph
applies to (for example, PID 610).
Adding and Removing
Graphs
2- 72
Graphs can be added to and removed from the graph display by clicking Add
Graph or Remove Graph on the graph right-click menu or toolbar; the graph will
be added below the currently selected graph. Each graph type can only be
displayed once.
MTS400 Series MPEG Test System User Manual
TSCA - Common User Interface Concepts
Hide Limits
Each graphed measurement has limits set either by default (derived from the
stream interpretation standard) or as modified by the user (see Parameter Edit,
page 2--81). If the limit is exceeded, an error is flagged elsewhere.
The limits set are displayed as shaded areas on the graphs. The graph will be
initially scaled to include the limit values.
Upper limit
Show limits
Limit limit
Hide limits
Figure 2- 29: Figure 2-1: Limits display
Hide/show the limits by selecting Hide Limits/Show Limits on the graph
right-click menu or toolbar. When the limits are hidden, the graph is rescaled
between the maximum and minimum Y values.
Settling Time
Some of the graphs in the TSCA require a number of samples to be available
before meaningful results can be displayed. The period during which sufficient
samples are being gathered is referred to as the settling time. During this settling
time, the graph is grayed out and displays the word Settling Time.
MTS400 Series MPEG Test System User Manual
2- 73
TSCA - Common User Interface Concepts
Zoom Feature
You can zoom graphs in and out using the controls on the menu bar or from the
Graph Menu. An area of a graph can also be expanded by holding the right
mouse button and dragging a rectangle around the required area.
Zooming action (in or out) is centered on the center point of the graph, irrespective of the cursor position. Both axes are expanded/contracted to accommodate
the revised display. The graph is expanded or contracted by 25% of the displayed
area each time that the control is used. Double-clicking on a graph rescales the
axes to show the complete plotted data set.
If the shift key is held while the zoom control is clicked, the Y axis is locked,
while the X axis is expanded or contracted.
If the control key is held while the zoom control is clicked, the X axis locked,
while the Y axis is expanded or contracted.
During real-time analysis expanding (zooming in) on an area of a graph
generates a static snapshot of the graph. Because of the way that the measurements are stored in the circular buffer, the display will eventually clear; the only
way to redisplay the graph is to return to full-scale display.
PCR Graphs
Table 2--6 shows the measurement graphs that are available for PIDs carrying
PCRs. If a PCR PID is also carrying time stamp information, the full set of
graphs will be available.
The graphs available will depend whether the PID is carrying PCR and/or time
stamp (TS) information.
Table 2- 6: PCR measurement graphs
Graph Type
PCR Inaccuracy
PCR Arrival Interval
PCR Drift Rate
PCR Frequency Offset
PCR Overall Jitter
PID + PCR
n
n
-
PID + PCR + TS
n
n
n
n
n
Descriptions follow of each of the measurements. Adjustments can be made to
each of the measurement parameters.
If the interval exceeds the limits displayed on the screen, the scale is adjusted
automatically as necessary to include the maximum displayed values.
2- 74
MTS400 Series MPEG Test System User Manual
TSCA - Common User Interface Concepts
NOTE. As with other parameter value adjustments, it is important to note where
the adjustment is being made from. If the adjustment is made with a test node
highlighted, all PIDs will be measured against that value. If the adjustment is
made with a PID highlighted, only that PID will be measured against the
modified value.
PCR Inaccuracy
(PCR_AC)
The PCR Inaccuracy graph shows the difference between the actual and expected
values for each PCR on the y-axis. Expected PCR values are calculated from the
byte index of the PCR.
The default limits are set ±500 ns.
The Maximum PCR Accuracy Error limit can be adjusted by modifying the Max
PCR accuracy error.
PCR Arrival Interval
The PCR Arrival Interval graph provides a display of the time interval between
successive PCRs, during the last 256 PCRs. The interval is displayed on the
y-axis. The default limit (Maximum Repetition Period set in ETR 101 290 test
2.3) is 40 ms.
The PCR Maximum Repetition Interval limit can be adjusted by modifying the
PCR max repetition interval.
PCR Drift Rate (PCR_DR)
This Drift Rate graph shows the rate of change of PCR Frequency Offset, which
is often very small. It is calculated using PCR Frequency Offset measurements.
The maximum PCR Drift Rate limit can be adjusted by modifying the Max PCR
frequency drift rate parameter.
PCR Frequency Offset
(PCR_FO)
The Frequency Offset graph shows the difference between the program clock
frequency and the nominal clock frequency (measured against a reference that is
not PCR or transport stream derived).
PCR Frequency Offset is a measurement of the error in the PCR frequency from
the specified 27 MHz; the MPEG specification sets the limits at ±810 Hz.
The Maximum PCR Frequency Offset limit can be adjusted by modifying the
Max PCR frequency offset parameter.
PCR Overall Jitter
(PCR_OJ)
The PCR Overall Jitter graph shows the time interval between the actual value of
the PCR and its expected value based on its arrival time.
The Maximum PCR Accuracy Error limit can be adjusted by modifying the Max
PCR overall jitter parameter.
MTS400 Series MPEG Test System User Manual
2- 75
TSCA - Common User Interface Concepts
MTS400 PCR
Measurements and
Settling Time
Demarcation Frequency. The PCR measurements provided by the MTS400
Transport Stream Compliance Analyzer are defined by TR 101 290. Appendix I
of TR 101 290 describes the measurements in detail, and also introduces the
concept of the “demarcation frequency” at which PCR errors are separated into
drift errors or jitter errors. Errors below the demarcation frequency are measured
as drift, while errors above that frequency are measured as jitter.
TR 101 290 also defines three standard demarcation frequencies, MGF1
(10 MHz), MGF2 (100 MHz) and MGF3 (1 Hz) at which the PCR measurements
can be made, and provides for a user-definable demarcation frequency, MGF4.
The TSCA extends this concept slightly, by providing two editable parameters,
one controlling the frequency below which errors are measured as drift
(PCR_FO/DR low-pass filter cut-off frequency), and one for the frequency above
which errors are measured as jitter (PCR_OJ/AC high-pass filter cut-off
frequency). Both of these parameters can be set at any frequency between 1 MHz
and 10 Hz, which encompasses all of the standard MGF profiles.
To change these values, select Settings > Parameters... from the menu bar, scroll
to the appropriate parameters and make the required changes.
Figure 2- 30: PCR parameters - Filter settings
Please note that the TR 101 290 drift limit of ±75 MHz/s is only defined at a
demarcation frequency of 10 MHz. As the low-pass filter frequency is increased
above that value, more of the PCR jitter will be measured as drift, and so the
measured drift values will increase. If you are attempting to check that your
source PCR clock is compliant with the TR 101 290 limits, the low-pass filter
cut-off frequency should be set to 10 MHz.
Settling Time. All of the PCR measurements that depend on demarcation filters
(PCR_DR, PCR_FO, PCR_OJ, and PCR_AC) have a settling time. The
measurements will not give valid values before this time. The settling time is
indicated on the PCR graphs in the TSCA.
This settling time is inversely proportional to the cut-off frequency of the
demarcation filter; so there is a trade-off between reducing the filter frequency to
improve drift measurement accuracy and increasing the time it takes to obtain
any drift measurements at all.
2- 76
MTS400 Series MPEG Test System User Manual
TSCA - Common User Interface Concepts
Table 2- 7: PCR settling times
Filter cut-off
Settling
Time
TR101-290 Profile
Comments
10 MHz
500 s
MGF1
TSCA default for PCR_FO/
DR low-pass filter cut-off.
Drift limit of ±75 MHz/s is
only applicable at this level.
100 MHz
50 s
MGF2
TSCA default for PCR_FO/
DR low-pass filter cut-off.
Drift limit of ±75 MHz/s is
only applicable at this level.
1000 MHz (1Hz)
5s
MGF3
-
1 MHz - 10,000 MHz
5000 s –
0.5 s
MGF4
User-defined profile
MTS400 Series MPEG Test System User Manual
2- 77
TSCA - Common User Interface Concepts
PTS Graphs
Presentation Time Stamps (PTS) indicate the exact moment where a video frame
or an audio frame has to be decoded or presented to the user respectively. The
PTS graphs show the PTS arrival intervals.
(See also Graph Management, page 2--68.)
Figure 2- 31: PTS graph - limits on
2- 78
MTS400 Series MPEG Test System User Manual
TSCA - Common User Interface Concepts
Figure 2- 32: PTS graph - limits off
MTS400 Series MPEG Test System User Manual
2- 79
TSCA - Common User Interface Concepts
Bit Rate Graphs
Bit rate graphs are available on program and PID nodes.
(See also Graph Management, page 2--68.)
Figure 2- 33: Bit rate graph
2- 80
MTS400 Series MPEG Test System User Manual
TSCA - Common User Interface Concepts
Parameter Edit
The error states displayed on the user interface are each the result of making one
or more measurements or tests on the analyzed transport stream. The displayed
tests are derived from the selected interpretation standard. Additional proprietary
tests are also included.
Some measurements and tests translate directly to an error state; others are the
result of a combination of tests. For many of the tests, you can affect the result
by varying parameters that influence the test result, for example, maximum and
minimum bit rate values, although the test result may not then conform to the
chosen interpretation standard.
Figure 2--34 shows the parameters that are available for the ETR 101 290
test 2.5.
Figure 2--35 shows the parameters that are available for a single PID under
ETR 101 290 test 2.5. Not all parameters applied to a test are necessarily applied
to a PID.
Figure 2- 34: Test parameters
MTS400 Series MPEG Test System User Manual
2- 81
TSCA - Common User Interface Concepts
Figure 2- 35: PID test parameters
Each test parameter entry includes the following fields:
H
Description of parameter.
H
Value - the current setting. If the setting is the same as the nominal value, an
icon will also be displayed in this field.
H
Units in which the measurement is made.
H
Maximum and minimum values. These are the maximum and minimum
values recommended by the standard selected.
H
Nominal value. This is the value or setting recommended by the interpretation standard selected.
It is important to understand the difference between default and nominal values.
If a parameter value is set for a test, it becomes the default value for the test and
hence for all PIDs subject to that test. PIDs using the default value will have
bullet icon is displayed in the Value field (see Figure 2--36).
2- 82
MTS400 Series MPEG Test System User Manual
TSCA - Common User Interface Concepts
Figure 2- 36: Parameter value - default icon
However, you can also set individual PID parameter values; the value set is
applied to only that PID, not to the other PIDs using the same test or the test
default value.
The nominal value is provided by the interpretation standard; it cannot be
changed using the user interface.
Changing a test parameter
value
1. Click in the Value field.
2. Enter the required value.
3. Press Enter.
NOTE. For a new value to take effect during deferred analysis, the stream must
be closed. Select Restart Analysis to open and reanalyze the stream.
MTS400 Series MPEG Test System User Manual
2- 83
TSCA - Common User Interface Concepts
Access to all parameters
All parameters are accessible from the Parameters menu option (Settings >
Parameters…). Parameter values can be changed in the same way as individual
parameters. Changes made to values in this dialog box are also applied to the
individual PID parameters, since changes made here become the default value for
the parameter.
Select the Set All to Nominal button to return all parameter values to their
factory settings. During deferred analysis, the current stream will need to be
closed and reopened (reanalyzed) for the new parameter settings to take effect.
Event Log
The event log displays a history of events related to a selected item. When no log
is available, the message “No log entries were found” is displayed. In a log,
events are placed in chronological order (with the most recent at the top).
Event log displays are context dependent; the view and object that is currently
selected will dictate the content of the associated log. For example, with the
transport stream node selected in the Programs navigation view, the associated
event log displays all events. Similarly, with a single PID selected, the associated
event log only displays events relevant to that PID. Exported logs are similarly
context dependent; only currently displayed events will be exported.
2- 84
MTS400 Series MPEG Test System User Manual
Test Equipment Depot - 800.517.8431 - 99 Washington Street Melrose, MA 02176 - FAX 781.665.0780 - TestEquipmentDepot.com
TSCA - Common User Interface Concepts
Event Log Control
The event log will normally display the most recent event at the top of the log.
Past events will be scrolled down the screen; not all of these event entries can be
viewed on a single screen, even in a maximized Log View window.
If events are constantly being generated, an event entry may pass out of view
before you have had a chance to examine it.
However, if you scroll down to view a past event, the viewing window will
remain fixed on that entry, even though events entries are still being added at the
top of the log view. Evidence of this is shown by the scroll box continuing to
advance towards the bottom of the screen.
The event entry being viewed will eventually move to the bottom of the event
log. At this point the entry will be lost and the view will return to the most recent
entries at the top of the screen; automatic scrolling will recommence.
Event Log Pinning
Another way of viewing a single event in a stream of log events is by pinning the
log. By pinning the log, you are taking a snapshot of the log at a particular
moment in time; you can then move up and down the pinned log as required.
Newly generated events will continue to be generated but will not be displayed
until the log is unpinned.
You can pin the log by selecting the Pin icon or Pin Log from the right-click
menu.
Shows that log is not pinned.
Select to pin log.
Shows that the log is pinned.
Select to unpin log.
When the log is pinned it is displayed against a blue background and the pin icon
is changed.
Note that pinning the log may take a few seconds; the whole log is saved, that is,
up to 1000 entries.
The log will remain pinned until you select the Pin icon or display another
TSCA view.
MTS400 Series MPEG Test System User Manual
2- 85
TSCA - Common User Interface Concepts
Exporting the Event Log
You can export the log (pinned or unpinned) in either XML or CSV format.
You can export the log by selecting the Export icon or Export Log from the
right-click menu.
Select the format in which the log file is to be saved, either xml or csv, and a
location for the file.
Color-Coding Events
Specific event types can be color-coded in the display to allow them to be
identified more easily (as shown in Figure 2--37). Color-coding can be done from
any event log display. The color-coding dialog box is available from the event
log context menu.
Figure 2- 37: Event log - color coding
2- 86
MTS400 Series MPEG Test System User Manual
TSCA - Common User Interface Concepts
1. Highlight the event type and select Color from the context menu
(see Figure 2--38).
Figure 2- 38: Event log - context menu - color
MTS400 Series MPEG Test System User Manual
2- 87
TSCA - Common User Interface Concepts
Figure 2--39 shows the Color dialog box.
Figure 2- 39: Event log - color dialog boxes
2. Select the primary display color.
The color can be specified from the Swatch tab. It can also be specified in
HSB (Hue, Saturation, Brightness) or RGB (Red, Green, Blue) terms by
selecting the appropriate tab and entering the required values.
3. Select OK. All events of the same type are now highlighted in the selected
color.
The color-coding on a single event type can be removed by selecting Reset Color
from the Event Log context menu. Color-coding can be removed from all event
types by selecting Reset All Colors from the context menu.
2- 88
MTS400 Series MPEG Test System User Manual
TSCA - Common User Interface Concepts
Bit Rates
In a stream, bit rates are calculated and displayed for the following:
H
Transport stream
H
Programs
H
PIDs
The display choices (bar chart or pie chart) and management of the display are
similar for each type.
Select the appropriate icon to switch charts:
Bar chart
Pie chart
Bar Charts
Figure 2- 40: Bar chart
The following information is included with the bit rate bar charts:
H
Error status (LED)
H
Object name (Program or PID name)
H
Stream type (PIDs only)
H
Bit rate bar including change bars and limit markers, where relevant
MTS400 Series MPEG Test System User Manual
2- 89
TSCA - Common User Interface Concepts
H
Bit rate statistics (including the current bit rate, the bit rate expressed as a
percentage of the overall bit rate, and the maximum and minimum values
reached during analysis).
The bit rate bars are scaled so that all bars are displayed relative to the one with
the highest bit rate.
Column widths can be adjusted by dragging the title line dividing bar to the left
or right with the mouse.
Error Indication
Range Bar
Two levels of error status are displayed by each row. The error status LED shows
the test status of the element, for example, a program. The color of the bit rate
bar indicates the bit rate status and whether the rate has exceeded the limits set.
A range bar indicates the variation of bit rate in each program or PID. The ends
of the bar show the maximum and minimum values of the bit rate since
monitoring started.
Range bar
Bit Rate Limits
Bit rate limits can be set on a program or PID bar. An error will be indicated
when the bit rate exceeds the limits set.
Highlight the program or PID and select Set bit rate limits from the context
menu:
2- 90
MTS400 Series MPEG Test System User Manual
TSCA - Common User Interface Concepts
The Set bit rate limits dialog box is opened:
Enable the limits by selecting the Enable Limits checkbox and enter the required
values. The cursor in the bar indicates the current bit rate. The limits can also be
changed by dragging the limit icons in the dialog box to the required positions.
The color of the overall bar in the limits dialog box indicates whether the current
bit rate is within the proposed limits. Select OK to close the dialog box. The
limit icons will now be displayed on the bit rate bar. The scaling of all bars is
recalculated to ensure that the maximum limit is displayed.
During deferred analysis, the stream must be closed and reopened to reanalyze it
and view the effects of the limits. Real-time limits take effect immediately. Limit
values are retained when the application is closed; limits set for specific PIDs
will be applied (to a PID with the same number) irrespective of the stream being
analyzed.
Setting (and resetting) the bit rate limits for programs and PIDs will automatically update the Program Occupancy and PID Occupancy tests. To change the
transport stream bit rate limits, the parameters must be altered directly in the
Transport Stream Occupancy test; this can be found under the Other tab in the
Tests view.
The Bit rate Limits of all programs in a stream can be disabled and reset by
selecting the Clear Limits button at the top of the Programs screen.
MTS400 Series MPEG Test System User Manual
2- 91
TSCA - Common User Interface Concepts
Pie Charts
The pie chart shows similar information to the bar chart.
Figure 2- 41: Pie chart
The pie chart view is divided into two panes. The left pane shows the pie chart;
the right pane provides a list of the component programs. Each program is
color-coded; related information given includes the overall program status (icon),
the program name and number, and the bit rate (bps). The bit rate expressed as a
percentage of the overall bit rate is displayed in the segment labels. The
maximum and minimum values are not shown.
If a segment label is hidden at the edge of the window, click on a segment to
display the label in full.
2- 92
MTS400 Series MPEG Test System User Manual
TSCA - Common User Interface Concepts
EPG View
An electronic program guide (EPG) (where present) is a schedule of events
(programs) that are or will be available on each service; a short summary or
commentary for each event may also be included. Events for services which are
actually carried in the stream are referred to as “actual” and as “present” or
“following” (labeled as EIT actual p/f in the navigation view).
A transport stream may also carry EPG information for other network services,
referred to as “other” (labeled as EIT other p/f in the navigation view).
NOTE. The examples shown in the figures in this section are of DVB transport
streams. The construction of SI and node names in ATSC and ISDB streams
differ.
The EPG node in the navigation view contains and displays all of the program
information carried in the transport stream.
The content of the Detail view will depend on the EPG currently highlighted
table node. Nodes representing an individual table or subtable will offer the usual
Summary, Section, and SI Repetition graph detail views. However, the higher
nodes will display a graphical representation of the programming information as
shown in Figure 2--42.
MTS400 Series MPEG Test System User Manual
2- 93
TSCA - Common User Interface Concepts
Title bar
Display time zone
Start time
Display range
Time scale
Service/Subtable pane
Event pane
Event detail pane
Figure 2- 42: EPG Summary view
2- 94
MTS400 Series MPEG Test System User Manual
TSCA - Common User Interface Concepts
EPG Node Summary
Figure 2- 43: EPG nodes
For each node type, the detail view shows the following information:
EPG node
Links to the EPG information for all the
transport streams described in this stream.
Transport stream
summary nodes:
Graphical view of the events identified in the
service(s) belonging to a specific transport
stream.
SDT nodes:
(Service Description Table)
Links to services identified in the SI for a
specific transport stream.
Service summary nodes:
Graphical view of the events identified in the
service.
EIT nodes:
Detailed view of event information for a single
EIT subtable.
MTS400 Series MPEG Test System User Manual
2- 95
TSCA - Common User Interface Concepts
EPG Summary View
The screen elements highlighted in Figure 2--42 are described below:
Title bar:
Displays the title of the currently highlighted service or
transport stream.
Displayed Time Zone: Select the required time zone from the drop-down list.
The time scale will change accordingly. The time zone
may be derived either from the transport stream, UTC
(Co-coordinated Universal Time), or local time (as set
on the host computer).
Start Time:
Shows the event panel start time and date; other dates
can be selected from the drop-down calendar; the display will scroll to the selected date.
In deferred mode, the initial date and time will be dictated by the information found in the stream. If the selected date is beyond that held in the EPG information,
the date will be automatically set to the last date held in
the information.
Note that in real-time mode, this information is updated
regularly.
Display:
Shows the extent of the event panel; more detail can be
displayed by choosing a shorter time period. Select the
required range from the drop-down list.
Timescale:
Shows the start and end time of the current event panel.
The range is dictated by the Display field selection.
Service/Subtable panel:
When a transport stream EPG is selected, this panel
shows the names of the services currently displayed in
the event panel. The displayed services will vary depending on which node is selected in the navigation
view.
2- 96
MTS400 Series MPEG Test System User Manual
TSCA - Common User Interface Concepts
Event panel:
This panel shows the events for one or more services,
depending on the selected node. Individual events are
color-coded and shown as blocks; each block (and its
associated tooltip) displays event information that is extracted from the EIT. When a block is selected, the complete event information is shown in the event detail
panel, including a link to the section carrying the information.
Events are color-coded as follows:
Event detail panel:
MTS400 Series MPEG Test System User Manual
H
Red: Present event
H
Green: Following event
H
Blue: Schedule event
H
Yellow: (ISDB only) After event
Shows details of the selected event. The details are contained in the EIT (event information table).
2- 97
TSCA - Common User Interface Concepts
MPE Views
Multi-Protocol Encapsulation (MPE) provides a mechanism for transporting data
network protocols on top of the MPEG-2 transport streams in DVB networks; it
has been optimized for the carriage of the internet protocol (IP). It covers unicast
(datagrams targeted to a single receiver), multicast (datagrams targeted to a
group of receivers), and broadcast (datagrams targeted to all receivers). The
48 bit MAC (Media Access Control) addresses are used for addressing receivers.
The MPE views display the MPE data flow currently available in the stream.
Figure 2- 44: MPE view
2- 98
MTS400 Series MPEG Test System User Manual
TSCA - Common User Interface Concepts
CaptureVut Feature
The CaptureVu feature allows you to capture and analyze system events during
deferred or real-time analysis in order to debug the intermittent and complex
problems that traditional analyzers miss.
The feature can be activated either manually by selecting the capture button
during analysis or automatically by a CaptureVu breakpoint preset on a test. This
action freezes the analysis and allows details of the analysis up to that moment to
be examined.
Links to the packet and the test (where applicable) at the point at which the
capture button was pressed or a designated test failed are displayed in the
CaptureVu Settings dialog box.
NOTE. If a recurring test failure needs to be examined in its true context, it is
advisable to make a triggered recording. With pretriggering set, it is then
possible to examine the events surrounding a test failure.
See Triggered Recording, page 2--105.
MTS400 Series MPEG Test System User Manual
2- 99
TSCA - Common User Interface Concepts
Setting Up the CaptureVu
Feature
The feature can be activated when a test flagged with a CaptureVu breakpoint
does not fall within the parameters set for the test. Breakpoints can be set at any
time. They will activate during real-time analysis as soon as the flagged test
fails. To operate successfully in a deferred analysis stream, the stream may need
to be reanalyzed.
You can set a CaptureVu breakpoint as follows:
1. In either the Program or Tests view, locate and highlight the required test.
2. From the right-click menu, select CaptureVu Breakpoint.
Note the addition of the breakpoint icon beside the test entry.
2- 100
MTS400 Series MPEG Test System User Manual
TSCA - Common User Interface Concepts
The CaptureVu breakpoint is now set. You can set as many breakpoints as you
require. The next time an error is detected on any breakpoint test, analysis
(real-time or deferred) will stop and the test will be identified.
CaptureVu Analysis
The CaptureVu breakpoint will operate during real-time and during deferred
analysis. The CaptureVu Settings dialog box is displayed as soon as a breakpoint
is activated or the CaptureVu feature is activated from the application Tool Bar.
The dialog box contains the following fields:
State:
MTS400 Series MPEG Test System User Manual
This panel displays the test and packet in which the test
has failed. Clicking either the test or the packet identity
will open the related view (Tests or Packets) and
highlight the test or packet (see Figure 2--45 and
Figure 2--46).
2- 101
TSCA - Common User Interface Concepts
Figure 2- 45: CaptureVu breakpoint - Test view
2- 102
MTS400 Series MPEG Test System User Manual
TSCA - Common User Interface Concepts
Figure 2- 46: CaptureVu breakpoint - Packet view
Activate this dialog when the breakpoint triggers:
When enabled, the CaptureVu setting dialog box is
opened automatically when a breakpoint occurs.
The CaptureVu Settings dialog box can also be viewed at any time by selecting
the CaptureVu Settings button on the tool bar.
With the CaptureVu feature activated, all of the TSCA tools are available for you
to analyze and inspect the saved information.
NOTE. In Packets view, only the packets contained in the last 200 MB are
available for analysis.
MTS400 Series MPEG Test System User Manual
2- 103
TSCA - Common User Interface Concepts
Resuming Analysis
You can resume deferred analysis by selecting the Resume Analysis button from
the dialog box or the tool bar.
NOTE. When you select the Resume Analysis button, analysis will continue from
the point at which analysis was paused.
Similarly, you can resume real-time analysis by selecting the Restart Analysis
button from the dialog box or the tool bar.
NOTE. While real-time analysis is paused, further analysis is stopped. When the
Restart Analysis button is pressed, analysis is restarted at the current time.
2- 104
MTS400 Series MPEG Test System User Manual
TSCA - Common User Interface Concepts
Triggered Recording
During real-time analysis, stream information can only be held for a finite time eventually it will be overwritten by more up-to-date information.
To examine events that occur in real-time mode more closely, recordings can be
made manually or automatically. Recordings are saved to hard disk and can be
subsequently analyzed and examined in more detail.
The Triggered Recording setup is accessed by the Record Setting button on the
toolbar or Record > Record Settings... on the menu bar; the Recording Settings
dialog box is displayed. The dialog fields are described below:
Figure 2- 47: Record Settings dialog box
Status bar:
Indicates the trigger status (Ready/Armed/Recording/
Complete) and the pretrigger/recording progress. The
status and progress are also displayed on the tool bar in
the main window.
Target file
Path:
MTS400 Series MPEG Test System User Manual
Enter the file name and path for the recording or use the
browse button to find and select an existing file name. If
this file name already exists, you must approve the overwriting of the old file when recording is initiated.
2- 105
TSCA - Common User Interface Concepts
File Size:
Enter the file size (MB) required.
For example, for a stream at 30 Mbps, a file size of
600 MB would record approximately 160 seconds of
stream information.
Pre-Trigger:
A proportion of a stream can be recorded before a trigger
event occurs. (See Pre-Trigger Recording, page 2--108.)
Enter the pretrigger size (MB) that is to be recorded.
Trigger Type:
The event that triggers the recording can be one of five
types, selected from the drop-down list. In each case, the
trigger is set and pretrigger recording starts when Arm is
selected. Pre-trigger recording must be complete before
triggered recording will start.
Manual: Recording will start when the Start button is
pressed.
External: Recording will start when a rising / falling
signal edge is detected at the external trigger input
connector. (Refer to the MTS400 Series Technical
Reference, 071-1724-xx for specifications.)
Test Failure:
Recording will start when an error occurs on a flagged
test.
Tests are flagged by highlighting a test in the Program or
Tests view and selecting Record from the right-click
menu. The record icon is displayed next to the test.
You can set the Record flag on as many tests as you required; recording will be triggered by the first flagged
test that is encountered.
2- 106
MTS400 Series MPEG Test System User Manual
TSCA - Common User Interface Concepts
Timed:
Recording will start when the time and date set in the
Start recording at field is reached.
You can enter the date and time manually (in the format
displayed). The date can be selected from the drop-down
calendar.
For all trigger types, except manual, when recording is
complete, the starting packet is indicated in the Record
Settings dialog box. Click on the packet number to display it in the Packets view.
Buttons
Arm:
Places the recording function into an armed state. If a
pre-trigger value has been specified, the pre-trigger recording will start (as shown by the progress bar). Full
recording will start when any trigger requirements are
met.
Stop:
Only active during recording, this button either disarms
the previously armed trigger or stops recording immediately. Any recording made up to the point when the button is pressed will be lost.
Start:
For manual recording, this button becomes active after
arming and any pre-trigger conditions have been met;
when pressed, recording will start immediately.
The Recording Settings dialog can be left open while waiting for a recording to
take place. If, after setting up the recording, the dialog is closed, the recording
can be controlled from the tool bar.
MTS400 Series MPEG Test System User Manual
2- 107
TSCA - Common User Interface Concepts
Pre-Trigger Recording
Setting a pre-trigger size allows the condition of the final recording to be
examined both before and after a trigger event. Pre-triggering a recording allows
a section of a recording to be recorded before the trigger event. The pre-triggered
portion of the file is filled and written over repeatedly until the trigger event
occurs.
Pre-trigger recording starts when the trigger is armed – by pressing Arm.
Figure 2- 48: Record Settings dialog box - Armed state
CAUTION. Recording may fail if the hard disk is unable to match the data rate of
the stream. This can be caused by a fragmented hard disk. Regular defragmentation of the hard disk is recommended (refer to your Windows documentation or
on-line help).
2- 108
MTS400 Series MPEG Test System User Manual
TSCA - Common User Interface Concepts
Menu Bar and Options
The Menu Bar provides access to a selection of major system options using
drop-down menus.
The menus and their options are described in the following paragraphs.
File Menu
Table 2- 8: File menu options
Command
Function
Open Transport Stream…
Opens the Open Transport Stream dialog box from which a
stream source (file or real-time) and the interpretation standard
can be selected.
Restart Analysis
Stops file analysis (only active during initial analysis).
Save Captured Stream…
Saves the captured stream (200 MB maximum).
Recent Files
Lists the most recently analyzed files. Select a file name to
reanalyze the file.
Close
Stop and close the current analysis, leaving the TSCA open.
Exit
Exits the TSCA.
MTS400 Series MPEG Test System User Manual
2- 109
TSCA - Common User Interface Concepts
Navigation Menu
Table 2- 9: Navigation menu options
Command
Function
Back
Returns to previous view.
Forward
Goes to next view.
Select Tree
Allows selection of a navigation view (Programs, Tests, SI/PSI,
PIDs, Packets).
Go to next red LED in current
tree
Goes to and highlights the next errored leaf node. Parent
nodes are passed over since they only indicate lower level
errors.
Settings Menu
Table 2- 10: Settings menu options
2- 110
Command
Function
Preferences…
Opens the Preferences dialog box which enables interface
management (see Preferences, page 2-- 112).
Parameters…
Opens the Parameters dialog box which allows all stream
parameters to be viewed and edited.
MTS400 Series MPEG Test System User Manual
TSCA - Common User Interface Concepts
CaptureVut Menu
Table 2- 11: CaptureVut menu options
Record Menu
Command
Function
CaptureVu Status…
Opens the CaptureVu status dialog box.
Capture
Pauses the current analysis to allow detailed inspection.
Resume
Resumes analysis.
The Record menu is only available during real-time analysis.
Table 2- 12: Record menu options
Command
Function
Record Settings
Opens the Record Settings dialog box.
Arm
Arms the record function.
Start
Starts recording.
Stop
Stops recording.
MTS400 Series MPEG Test System User Manual
2- 111
TSCA - Common User Interface Concepts
Help Menu
Table 2- 13: Help menu options
Command
Function
About…
Displays application and system information.
Preferences
Two options are offered when the Preferences dialog box is opened (Settings >
Preferences...) - General and Font.
General
???
Figure 2- 49: Preferences - General
The General preferences option allows you to specify a default folder for loading
and saving files. Either enter the path required or use the browse button to locate
the folder. Select OK to save the setting and close the dialog box.
Default File Folder:
Specify the default folder for loading and saving files.
Maximum File History Size:
Specify the maximum number of file names to be shown
in the File > Recent Files list.
Timezone for timestamp display:
This selection is not currently used. Ensure that it is set
to Local.
2- 112
MTS400 Series MPEG Test System User Manual
TSCA - Common User Interface Concepts
Packet Size used for TS bit rate:
Specify the packet size (188 or 204) to be used in the
calculation of the transport stream bit rate. This is displayed in the status bar.
Color Scheme:
Select the background color for all graphs. When Default is selected, the graphs are based on a white background. When Instrument is selected, the graphs are
based on a black backgrounds.
Optimize for UI performance:
Under some circumstances when analyzing large files or
using low specification instruments, the user interface
may appear to freeze until the deferred analysis is complete. Enabling this feature will cause the user interface
to refresh at more regular intervals, thus reassuring you
that the analysis is progressing.
Remember last tab visited on exit:
When the TSCA is opened, the tab that was being
viewed in the previous session will be remembered and
displayed.
Enable thumbnails:
Thumbnail views of program content will be displayed
when this option is enabled.
Font
Figure 2- 50: Preferences - Font
The Font preferences option allows you to specify the display font and size for
log entries and stream content. Place the cursor in the field to be changed and
select the font name or font size required from the displayed drop-down list.
MTS400 Series MPEG Test System User Manual
2- 113
TSCA - Common User Interface Concepts
Script Files
In the TSCA, scripts provide a method of interpreting and displaying standards
during analysis. Scripts provide templates, which determine how the SI
information found during stream analysis will be displayed. The scripts must
cater for all the information that may be found in a stream, including the various
table types found in all of the identified standards. To this end, it has been found
that the best approach is to make the scripts modular; each script module deals
with different aspects of the SI and standards.
For example, when DVB is identified as the standard against which analysis is to
take place, the scripting dialog box displays a list of Script modules. Additionally, when it is known that tables or descriptors not commonly carried in the
identified base standard and region are likely to be included, extra scripts can be
written and added to the Script Files list to be used for the analysis.
Essential scripts are installed and enabled using the Stream Interpretation dialog.
In the absence of any enabled scripts, only the PAT table will be analyzed, all
other data will be presented as private data.
Scripts can be customized or new scripts can be written to provide analysis of
private data. With the Custom Scripts checkbox enabled, if a suitably configured
script is selected and enabled before a stream is analyzed, custom data will also
be analyzed when the stream is opened.
Scripts can only be selected and enabled when no files are open. The Stream
Interpretation dialog is available when a file is open, but all selection activity is
disabled.
A script file will not be used for analysis until it is present in the Script Files
panel of the Open Transport Stream dialog box.
2- 114
MTS400 Series MPEG Test System User Manual
TSCA - Common User Interface Concepts
Setting Stream
Interpretation
1. From the Base Standard drop-down list, select the required base standard.
The selected standard will dictate the availability of options that are available
in the Regions drop-down list.
2. From the Region drop-down list, select the required region.
The regions list allows country-specific extensions to be added to the base
standard scripts. If No Extensions is selected, only the standard scripts are
listed in the script list. The remaining country-specific extensions add extra
scripts to the current listing.
3. Note that the scripts that will be used are listed in the main pane.
Scripts listed by default are resident in the default installation directory
(program files\tektronix\mpeg\mts400\scripts). Other directory locations can
be specified in the custom script selection mode. All selections will be
retained between TSCA sessions.
4. Return to either the Analyze File or the Real-time Analysis window, ensure
that a stream is selected, and select OK for analysis to start.
Scripts are syntactically analyzed when the OK button is selected. A fault in the
syntax of a script will not necessarily prevent a stream from being analyzed, but
it may result in an incomplete analysis of the stream. Errors in the script syntax
will be noted in the stream log.
Custom Script Selection
When the Custom Scripts checkbox is enabled, the buttons beside the script
listing become active and custom scripts can be selected in addition to the
standard scripts. Some script names in the listing are dimmed; these are
considered to be essential and cannot be removed.
MTS400 Series MPEG Test System User Manual
2- 115
TSCA - Common User Interface Concepts
The buttons operate as follows:
Reset the script list to the default list for the standard and
region.
Opens the script selection dialog box. Highlight required
script and select OK. Note that the script name is added
to the Script Files list.
Removes any script name highlighted in the Script Files
list.
Scripts are applied to streams in the order that they are
listed in the Script Files list. Use these buttons to move a
highlighted script up and down in the list.
Opens the highlighted script in ScriptPad script editor
Verifies the syntax of the scripts listed in the Script Files
pane. A message window lists any errors found.
If the standard script list has been changed and you want to return to the default
list of scripts, highlight the Base Standard and Region required, and select the
default script button; the list will be overwritten with the default list.
(More information about ScriptPad can be found in the MTS400 MPEG Test
System User Manual.)
2- 116
MTS400 Series MPEG Test System User Manual
TSCA - Common User Interface Concepts
Scripts Directory
The Scripts Directory field indicates the root directory for scripts named in
Script Files list when analysis starts. If scripts are not present in the scripts
directory, the interpretation and validation of the SI will be incomplete.
NOTE. If the script list is modified in any way, always use the button to verify the
changes.
Scripts can be selected from any directory (using the button). If the directory is
not that identified in the Scripts Directory field, the path (either relative or
absolute) will be displayed with the script name in the Script Files list.
NOTE. The Scripts Directory browse button allows you to specify a default
directory for script selection. The browse window does not display the scripts
available. If you need to see the scripts available, use Windows Explorer.
If the standard script list has been customized and you want to return to the
default list of scripts, highlight the required Base Standard and Region and select
the default script button; the list will be overwritten with the default list.
NOTE. Each Base Standard and Region combination can be individually
customized.
Script Validation
Validating scripts checks the syntax of the listed scripts.
If the Enabled scripted section validations during analysis checkbox is
enabled, the scripts are checked during analysis to ensure that the data as defined
by the scripts is as expected (for example, values are within specified ranges). A
fault in the syntax of a script will not necessarily prevent a stream from being
analyzed, but it may result in incomplete analysis of the stream. Errors in script
validation will be logged in the stream error log. Enabling this checkbox may
have an impact on real-time analysis.
MTS400 Series MPEG Test System User Manual
2- 117
Task Examples
The examples in this section describe how to locate a fault or information using
the analyzer.
The examples assume a basic understanding of the analyzer user interface and
that you are familiar with the more important aspects of digital television
transport stream structure and interpretation standards.
The MPEG Test System is a tool which allows you to analyze a transport stream
and then examine it in detail. Errors in the content can be pinpointed and
examined down to the byte level.
Because of the comprehensive nature of the analyzer, there are a number of ways
of achieving your objective. In these examples, one or more ways are described
to achieve the objective.
Error Status
LED icons are used throughout the analyzer interface to represent the status of
the tests applied to associated items, for example, programs. Colors used are as
follows:
(Red)
Error; test failed
(Yellow)
Transient error (error not currently being detected but
has been seen since last reset)
(Green)
No error; test passed
(Gray)
Test disabled
(White)
Test not applicable
When an LED represents a parent node in a tree (for example, a program node is
the parent of elementary stream nodes) or a navigation tab, the color represents
the worst case of all of its tests and the worst case of all of the tests represented
by its child nodes.
Similarly, when an LED representing a parent node in a tree is disabled or
enabled, all subsidiary (or child) nodes are also disabled or enabled to reflect the
state of the parent node. When an LED representing a parent node is reset, all the
child nodes are also reset.
MTS400 Series MPEG Test System User Manual
2- 119
TSCA - Task Examples
Which Tests Have Failed in an Analyzed Stream?
In this example, the analyzer has just finished analyzing a stream. The Program
navigation view is initially displayed with the transport stream tree collapsed.
The transport stream error LED is red, indicating that one or more tests have
failed.
Method
With the Program tab still selected, view the tests summary view (bottom right).
Figure 2- 51: Failed tests - example
Identify the tests that have failed (red LED). As shown in Figure 2--51, in test
summary view (TR 101 290 tab), the following tests have failed:
H
First Priority: 1.6 PID
H
Second Priority: 2.3a PCR Repetition
H
Third Priority: 3.1a NIT Actual; 3.2 SI Repetition; 3.5a SDT Actual;
3.5b SDT Other
Remember that the tests may be distributed over more than one tab in the test
summary view; the color of the LED on the tab helps you locate the failed tests
(for example, the Other tab in Figure 2--51).
2- 120
MTS400 Series MPEG Test System User Manual
TSCA - Task Examples
You can view a test (and see other PIDs that it has failed on) by highlighting a
test and selecting Go to test from the context (right click) menu:
You can also display the fault by expanding the tree in the Tests navigation view
until the fault is revealed.
Expanding the test itself reveals the PIDs that have failed the test.
MTS400 Series MPEG Test System User Manual
2- 121
TSCA - Task Examples
How Many PIDs are in a Stream?
How many PIDs are Referenced and Unreferenced?
For this task, the PID navigation view is used to view information about
individual PIDs in the transport stream. Under the All PIDs node, which displays
all of the PIDs in the summary view, there are four subgroup nodes: Reserved
PIDs, Referenced PIDs, Unreferenced PIDs and User PIDs. The number (in
parenthesis) in each node gives the number of PIDs found during analysis.
Method
1. Select the PIDs navigation view.
2. Expand the All PIDs node to display the subgroups (and their quantities).
2- 122
MTS400 Series MPEG Test System User Manual
TSCA - Task Examples
Which Tests Have Been Applied to a Program PID?
1. Select the Program navigation view.
2. Expand the Transport Stream tree until the required PID can be highlighted.
In the Associated Tests view, note the tests that are enabled. Gray LEDs indicate
tests that have been disabled; white LEDs indicate tests that are not applicable to
the selected PID.
MTS400 Series MPEG Test System User Manual
2- 123
TSCA - Task Examples
What is the Stream Type of a PID?
Method 1
1. Select the Program navigation view.
2. Expand the Transport Stream tree until the required PID can be highlighted.
3. Keep the cursor over the PID. A tooltip will display the stream type.
The tooltip is available wherever the selected PID node is displayed (for
example, in the PID navigation view).
2- 124
MTS400 Series MPEG Test System User Manual
TSCA - Task Examples
Method 2
1. Select the Program navigation view.
2. Select the program node.
3. In the summary view, select the Summary tab.
Note the Stream Type column in the display. The stream type is given for
each PID in the selected program.
How Many Programs are in the Stream?
1. Select the Program navigation view.
2. Expand the Transport Stream tree and note the number of program nodes
(see Figure 2--52).
3. The Summary view (bar chart or pie chart) also displays a program count.
Figure 2- 52: Program count
MTS400 Series MPEG Test System User Manual
2- 125
TSCA - Task Examples
What are the Contents of the Programs and What PIDs are They On?
1. Select the Program navigation view.
2. Expand the Transport Stream tree and a program node (see Figure 2--53).
3. Note the number of program PIDs.
Note also that each PID is accompanied by an icon indicating the stream
type. Hover the cursor over a PID node to display more information.
4. The Summary and the PID Information views also display the program
PIDs.
Figure 2- 53: PID count
2- 126
MTS400 Series MPEG Test System User Manual
TSCA - Task Examples
What is the Bit Rate of each PID in a Program?
Bit rates are displayed in the Program and PID summary views. The bit rates
displayed depend on the node highlighted in the navigation view.
Table 2- 14: Bit rate views
Navigation View
Node
Bit rates displayed in Summary view
Program
Transport Stream
All programs
Program
Program
Program PIDs
PID
All PIDs
All PIDs
PID
Secondary nodes
(Reserved, Referenced,
Unreferenced and User)
PIDs in secondary groups PIDs
Figure 2- 54: Program PID bit rate - bar chart
MTS400 Series MPEG Test System User Manual
2- 127
TSCA - Task Examples
The PID bit rate summaries can be displayed as either bar charts or pie charts by
selecting the appropriate icon at the top left of the Summary view.
Bar chart
Pie chart
Figure 2- 55: Program PID bit rate - pie chart
A selection of statistics for each program/PID is shown in the charts. Either
current or mean bit rates can be shown by selecting the Show Mean Values
option from the Summary view context menu. For deferred analysis, the current
bit rate is the final bit rate.
You can also display a bit rate graph for the highlighted node by selecting the Bit
Rate Graphs tab.
2- 128
MTS400 Series MPEG Test System User Manual
TSCA - Task Examples
Figure 2- 56: Bit rate graph
MTS400 Series MPEG Test System User Manual
2- 129
TSCA - Task Examples
What is the Latest Version Number of the Program Association Table (PAT) in
the SI?
Tables and their versions can be found in the Tables (SI/PSI) view. When a node
representing a table is selected in the navigation view, the table identity and the
version are displayed in summary view (top right) as shown in Figure 2--57.
Figure 2- 57: Table Identity and Version (summary view)
The table identity and version can also be seen in the table header using the
Tables (SI/PSI) section view as shown in Figure 2--58.
2- 130
MTS400 Series MPEG Test System User Manual
TSCA - Task Examples
Table identity
Version number
Figure 2- 58: Table Identity and Version (section view)
How Do I Examine a Transport Packet?
A transport stream packet is a unit of data that contains a header and a payload.
The Packets view allows individual transport stream packets to be identified and
examined.
Navigating Around the
Packets
The navigation bar at the top of the Packet summary view is used to move
between packets. How the controls work depends on the selection in the Packets
navigation view. If All Packets is highlighted, the controls will operate on all
packets. If a PID has been identified, added to the PIDs node and highlighted,
the controls will operate only on packets carrying the selected PID.
Current packet position
The packet position bar shows the position of the selected packet in the stream.
The controls work as follows:
Selects the first available packet (in the stream or carrying the
selected PID).
Selects the previous available packet (in the stream or carrying
the selected PID).
Selects the next available packet (in the stream or carrying the
selected PID).
MTS400 Series MPEG Test System User Manual
2- 131
TSCA - Task Examples
Selects the last available packet (in the stream or carrying the
selected PID).
Open Go to packet... dialog box.
The packet position bar can also be used to navigate through the stream. Use the
cursor to point to and click the next packet to be displayed. Similarly, double
click the packet number in the bar and enter the required packet number in the
Go to packet... dialog box.
Looking at the Packet
2- 132
Having identified and selected a packet, the Packets summary view displays the
interpreted code and the raw data in hexadecimal and ASCII format.
MTS400 Series MPEG Test System User Manual
SI/PSI Nodes
The Tables view (SI/PSI tab) displays the service information in tree form. The
tree represents all of the service information tables found in the analyzed stream
that comply with the selected digital video standard (including MPEG program
specific information, DVB service information and ATSC and ISDB program
and system information protocol). The tree contains nodes for each table found;
tables/nodes are grouped together functionally.
This appendix identifies the nodes that may be present for each standard.
Figure 2--59 shows an example of Table navigation view with DVB stream
interpretation selected.
Tables 2--15 to 2--19 show the nodes that may be displayed in the SI/PSI
navigation view depending on the interpretation standard selected and the
content of the stream.
Primary nodes
Figure 2- 59: Primary SI/PSI nodes (DVB example)
MTS400 Series MPEG Test System User Manual
2- 133
TSCA - SI/PSI Nodes
Table 2- 15: MPEG SI/PSI
Primary node
Subsidiary node
TS info
TSDT
Programs
PAT
PMT PIDs
Conditional access
CAT
Other Tables
Table 2- 16: DVB SI/PSI
Primary node
Subsidiary node 1
Subsidiary node 2
Subsidiary node 3
TS Info
Partial TS
DIT
SIT
BIT
Programs
PAT
PMT PIDs
PMT PID +
SDT
Bouquets
BAT
Conditional access
CAT
Networks
NIT - This
NIT - Other
Time
TOT
2- 134
MTS400 Series MPEG Test System User Manual
TSCA - SI/PSI Nodes
Table 2- 16: DVB SI/PSI (Cont.)
Primary node
Subsidiary node 1
Subsidiary node 2
Subsidiary node 3
TDT
EPG
This TS
SDT Actual
Service (number,
name)
Now/Next (EIT P/F)
Schedule (EIT
schedule)
Other TS
SDT Other
Service (number,
name)
Now/Next (EIT P/F)
RST
MHP apps
Other tables
Table 2- 17: ATSC SI/PSI
Primary node
Subsidiary node 1
Subsidiary node 2
Subsidiary node 3
Subsidiary node 4
TS info
MGT
Programs
PAT
PMT PIDs
VCT C/T
ETT-V
Conditional Access
CAT
Ratings
RRT+
Time
MTS400 Series MPEG Test System User Manual
2- 135
Test Equipment Depot - 800.517.8431 - 99 Washington Street Melrose, MA 02176 - FAX 781.665.0780 - TestEquipmentDepot.com
TSCA - SI/PSI Nodes
Table 2- 17: ATSC SI/PSI (Cont.)
Primary node
Subsidiary node 1
Subsidiary node 2
Subsidiary node 3
Subsidiary node 4
Subsidiary node 3
Subsidiary node 4
STT
EPG
Source/Services
EIT0 > EIT127
Directed channel
change
DCCT id +
DCCSCT
Other tables
Table 2- 18: ISDB-S SI/PSI nodes
Primary node
Subsidiary node 1
Subsidiary node 2
TS info
Partial TS
DIT
SIT
BIT
Programs
PAT
PMT PIDs
SDT
Conditional access
CAT
Networks
NIT - This
NIT - Other
Time
TOT
EPG
This TS
SDT Actual
Service (number, name)
2- 136
MTS400 Series MPEG Test System User Manual
TSCA - SI/PSI Nodes
Table 2- 18: ISDB-S SI/PSI nodes (Cont.)
Primary node
Subsidiary node 1
Subsidiary node 2
Subsidiary node 3
Subsidiary node 4
Now/Next (EIT P/F)
Basic Schedule
(EIT schedule)
Extended Schedule
(EIT schedule)
Other TS
SDT Other
Service (number, name)
Now/Next (EIT P/F)
Basic Schedule
(EIT schedule)
Extended Schedule
(EIT schedule)
Maker id/model id +
Other tables
Table 2- 19: ISDB-T SI/PSI nodes
Primary node
Subsidiary node 1
Subsidiary node 2
Subsidiary node 3
Subsidiary node 4
TS info
Partial TS
DIT
SIT
BIT
Programs
PAT
PMT PIDs
SDT
Conditional access
CAT
Networks
NIT - This
NIT - Other
Time
MTS400 Series MPEG Test System User Manual
2- 137
TSCA - SI/PSI Nodes
Table 2- 19: ISDB-T SI/PSI nodes (Cont.)
Primary node
Subsidiary node 1
Subsidiary node 2
Subsidiary node 3
Subsidiary node 4
TOT
EPG
This TS
SDT Actual
H
Service (number, name)
Now/Next (EIT P/F)
Basic Schedule
(EIT schedule)
Extended Schedule
(EIT schedule)
M
Service (number, name)
Now/Next (EIT P/F)
Basic Schedule
(EIT schedule)
Extended Schedule
(EIT schedule)
L
Service (number, name)
Now/Next (EIT P/F)
Basic Schedule
(EIT schedule)
Extended Schedule
(EIT schedule)
SDTT
SDTT(H)
Maker id/model id +
SDTT(L)
Maker id/model id +
Other tables
2- 138
MTS400 Series MPEG Test System User Manual
Glossary
ARIB
Association of Radio Industries and Businesses
ASI
Asynchronous Serial Interface
ATSC
Advanced Television Systems Committee
BAT
Bouquet Association Table
CAT
Conditional Access Table
CRC
Cyclic Redundancy Check
CSV
Comma Separated Values
CVCT
Cable Virtual Channel Table
DVB
Digital Video Broadcasting
EIT
Event Information Table
EMM
Entitlement Management Message
ETT
Extended Text Table
IIP
ISDB--T Information Packet
ISDB
Integrated Services Digital Broadcasting
MGT
Master Guide Table
MPEG
Moving Picture Experts Group
MTS400 Series MPEG Test System User Manual
2- 139
TSCA - Glossary
NIT
Network Information Table
PAT
Program Association Table
PCI
Peripheral Component Interconnect
PCR
Program Clock Reference
PID
Packet Identifier
PMT
Program Map Table
PSIP
Program and System Information Protocol (ATSC)
PTS
Presentation Time Stamp
RRT
Rating Region Table
RTM
Real--Time Monitor
RUI
Remote User Interface
SDT
Service Description Table
SI
Service Information (DVB)
SMPTE
Society of Motion Picture and Television Engineers
SNMP
Simple Network Management Protocol
SSI
Synchronous Serial Interface
STT
System Time Table
2- 140
MTS400 Series MPEG Test System User Manual
TSCA - Glossary
TEF
Transport Error Flag
TMCC
Transmission and Multiplexing Configuration Control (ISDB--S)
TOT
Time Offset Table
TSDT
Transport Streams Description Table
TVCT
Terrestrial Virtual Channel Table
TVRO
Television Receive Only
UTC
Coordinated Universal Time
VCT
Virtual Channel Table
VSB
Vestigial sideband
XML
Extensible Markup Language
MTS400 Series MPEG Test System User Manual
2- 141
TSCA - Glossary
2- 142
MTS400 Series MPEG Test System User Manual
Packetized Elementary
Stream Analyzer
Getting Started
The Packetized Elementary Stream (PES) Analyzer performs a series of user
selectable conformance tests on a previously recorded file. Files can be
interpreted according to either the ATSC or DVB standards. Once the file is
analyzed analyzed users can view the results of the selected tests and browse
through the content of the PES packets.
Information can be viewed in graphical and textual formats. To analyze and view
the Transport Stream packets, use the companion program TS Analyzer, which
can be run at the same time as this PES Analyzer.
The functionality provided includes:
H
Display of program structure showing the programs contained within the
transport multiplex and the PES streams which make up each program.
H
Display an interpretation of PES packet for individual packets.
H
Hexadecimal representation of PES packet.
H
Extraction and display of Presentation Time Stamp (PTS) and Decoding
Time Stamp (DTS) information from the PES packet header.
MTS400 Series MPEG Test System User Manual
3- 1
PES Analyzer - Getting Started
H
Display of access unit information for video and audio access units.
NOTE. The examples shown in this chapter are taken from both ATSC and DVB
compliant transport streams. An example of each type is sometimes shown as a
reminder that both standards are supported or where a difference needs
explanation.
Starting the Program
Start the program by selecting the PES Analyzer option from the
Start > Programs menu or by double clicking on the PES Analyzer
shortcut on the desktop.
Initial Appearance
3- 2
Once the program has started and is ready for use it will open a Main Window.
When the program first starts it looks as follows:
MTS400 Series MPEG Test System User Manual
PES Analyzer - Getting Started
The Toolbar (row of buttons above the dark gray area of the empty window) may
be hidden from view, moved to a separate window or moved to either side or the
bottom of the main window.
The Status Line at the very bottom of the window may be hidden from view.
Because no file is open, it is displaying a message that the TS packet number is
Not Valid.
Above the Status line is the Slider Bar. This has three groups of controls for
selecting streams and packets within a file. This may be moved to the top of the
window.
Initial Menu Options
PES Analyzer presents different menus and options, depending on whether or not
a file is open for analysis. The menu options available when no file is open, are
as follows:
NOTE. A check mark next to an option indicates that the window or toolbar is
currently visible or enabled, no check mark means that it is hidden or disabled.
File Menu Options. The File menu contains the menu options listed in Table 3--1.
Table 3- 1: File menu options
Command
Function
Open...
Opens an MPEG file for analysis. The program opens the file
selection dialog allowing the user to choose the required file.
Print Setup ...
Opens a dialog for selecting which printer and associated
options to use.
1 <filename>
2 <filename>
3 <filename>
4 <filename>
A list of the four most recently analyzed files. If the program
has recently been installed the list may be empty or hold less
than four files.
Exit
Finishes running the program.
MTS400 Series MPEG Test System User Manual
Selecting a filename opens that file for analysis.
3- 3
PES Analyzer - Getting Started
View Menu Options. The View menu contains the menu options listed in Table
3--2.
Table 3- 2: View menu options
Command
Function
Toolbar
Displays or hides the toolbar.
Status Bar
Displays or hides the status bar.
Settings Menu Options. The Settings menu contains the menu options listed in
Table 3--3.
Table 3- 3: Settings menu options
Command
Function
Test Options
Opens a dialog for setting the Conformance Test Options for
analyzing and interpreting the PES information in stream files.
Options Menu Options. The Options menu contains the menu options listed in
Table 3--4.
Table 3- 4: Options menu options
3- 4
Command
Function
Limit Repeat Errors
Lists the first 20 occurrences of each error type in the event
log.
MTS400 Series MPEG Test System User Manual
PES Analyzer - Getting Started
Options
The MPEG and ATSC Conformance Test Options for MPEG and ATSC may not
be modified when a file is open. To change them, all files must be closed, the
test options modified, and the file opened again.
Select Test Options from the Settings menu to open the Conformance Tests
dialog.
NOTE. The Settings Menu is only available when there is no file open. It is
hidden when a file is opened and redisplayed when the file is closed.
MTS400 Series MPEG Test System User Manual
3- 5
PES Analyzer - Getting Started
Conformance Tests
The dialog box contains two tabbed pages containing tests relating to MPEG and
ATSC files, respectively. Note that the MPEG tests are sufficient for DVB
streams.
Test of PES Header Syntax (MPEG). The tests of PES header Syntax are based on
the conformance requirements laid down in the standards document ISO/IEC
13818-4 for Packetized Elementary Streams. Each check box uses the same
name for a particular test as the standard. For example, to test conformance to
the standard for the length of PES packets select the PES_packet_length option.
A check mark shows that a test is selected and an empty check box indicates that
the test will not be performed.
3- 6
MTS400 Series MPEG Test System User Manual
PES Analyzer - Getting Started
Test of PES Header Syntax (ATSC). When the ATSC Stream box is checked,
selected streams are interpreted according to the ATSC standards, A/52 and
A/53.
A check mark shows that a test is selected and an empty check box indicates that
the test will not be performed.
For streams in a DVB standard stream, leave the ATSC Stream option unchecked. The ATSC Stream option is disabled (grayed out) if the software
license is only for the DVB standard.
MTS400 Series MPEG Test System User Manual
3- 7
PES Analyzer - Getting Started
Opening a File
Any file holding a recorded or synthesized sample of a stream can be opened for
PES Analysis by this program. To analyze the Transport Stream packets, open
the file in the TS Analyzer. A file can be opened by both the TS and PES
Analyzers at the same time.
Opening a File from the
Menus and Toolbar
To open a file select the Open... option from the file menu. If the required file is
in the list of recently analyzed files then it can be opened from the list to save
using the Open file dialog. Alternatively, use the Ctrl+O keyboard shortcut.
There is also a shortcut button available on the Toolbar for opening a file, which
has the standard file open symbol:
Once a file is open this button will be disabled, which is shown by being “grayed
out”.
3- 8
MTS400 Series MPEG Test System User Manual
PES Analyzer - Getting Started
Window Layout
Program Structure and Event Log windows are opened as soon as the file is
opened. The layout of the windows will have been saved from the last time the
program was used. If the program has just been installed, the windows will be in
the application default Cascade arrangement, which looks like this:
Many users rearrange the windows so that the Program Structure and Event Log
windows do not overlap. The examples in this manual often use this arrangement:
MTS400 Series MPEG Test System User Manual
3- 9
PES Analyzer - Getting Started
NOTE. The above example is from a transport stream interpreted and labeled
according to the DVB standard. If the ATSC Stream option is set the elementary
streams will be interpreted and labeled according to the ATSC standard. For
example: audio streams would be labeled AC-3 Audio, instead of Audio or AAC
Audio.
PES Analysis
The PES Analyzer program now starts to analyze the file for conformance to the
selected tests. Due to the very efficient algorithms used by the program, it will
analyze large files in a few minutes. Other algorithms have been seen to take
much longer. The rightmost pane in the Status Bar shows a progress indicator
during Analysis.
As the file is analyzed messages are written in the Event Log and the structure
diagram is drawn in the Program Structure window. When the processing is done
an “Analysis Complete” message is written in the Event Log.
3- 10
MTS400 Series MPEG Test System User Manual
Menus and Controls
When a file is open the program presents a different set of menus and options.
They change as soon as the Program Structure and Event Log windows appear.
For example, the Open file commands are replaced by Close file commands.
Toolbar
The Toolbar provides a set of convenient shortcuts for the more frequently used
menu options. The available commands are:
Closes the current file. This button becomes enabled the moment a file
is opened and analysis starts. If the wrong file is being opened, or the
wrong options are selected, clicking on the button will abandon the
analysis and close the file.
Open a file. This button is disabled when a file is open.
Print the contents of the current window.
Opens a dialog which displays the program version number.
Toggles the Event Log window. When the button is in this state the
window is not visible and clicking on the button will open the Event
Log.
Toggles the Packet Hex View window. When the button is in this state
the window is not visible and clicking on the button will open the Hex
View.
Toggles the PTS/DTS View window. When the button is in this state
the window is not visible and clicking on the button will open the PTS/
DTS View.
Toggles the Header Interpretation window. When the button is in this
state the window is not visible and clicking on the button will open the
Header Interpretation.
MTS400 Series MPEG Test System User Manual
3- 11
PES Analyzer - Menus and Controls
Zoom In on data in the PTS/DTS View. This button is only enabled
when the PTS/DTS View is the current window.
Zoom Out from the data in the PTS/DTS View. This button is only enabled when the PTS/DTS View is the current window.
The Toolbar can be dragged off the edge of the main window into a floating
pallet. To do this click on the background inside the Toolbar, that is, not on one
of the buttons, and drag into the main window area. The result is a self-contained
window which looks like this:
To replace the Toolbar on the window border drag it over the border until the
outline changes shape. It can be placed on the top, bottom, left or right edges.
3- 12
MTS400 Series MPEG Test System User Manual
PES Analyzer - Menus and Controls
Status Bar
The Status Bar may be hidden from view, but if visible is always at the bottom
of the main window. It displays the following information about the program and
keyboard states:
MTS400 Series MPEG Test System User Manual
3- 13
PES Analyzer - Menus and Controls
Slider Bar
The Analyzer can display the contents of any PES packet in the currently loaded
file. Packets are numbered, within a PID, according to their position in the file;
the first PES packet of each PID being PES packet 0 (zero). The Slider Bar
displays the packet number and the PID for the current packet.
The slider bar controls are as follows:
Slider
Slider
Move to
previous
packet
Scrolls through packets of
the selected type in the file.
Start
of file
Packet number
End
of file
Packet Number
Goto Button
Shows current packet number.
New values can be typed in.
Selects packet shown
in Packet Number
To select
a packet by
number
3- 14
Move to
next
packet
click in the
Packet Number
Field and type in
the new value
then click
on the Goto
Button.
MTS400 Series MPEG Test System User Manual
PES Analyzer - Menus and Controls
Packet Type - Elementary
Stream
Packet Type
Drop Down Arrow Button
Shows currently selected
Elementary Stream.
”Drops down” the list of
Streams to choose from
Like the Toolbar the Slider Bar can be dragged from the edge of the main
window into a floating pallet; to do this click on the background inside the Slider
Bar and drag it into the main window area. The result is a self contained window
which looks like this:
To replace the Slider Bar on the window border drag it over the border until the
outline changes shape. Unlike the Toolbar it can only be placed on either the top
or bottom edges.
MTS400 Series MPEG Test System User Manual
3- 15
PES Analyzer - Menus and Controls
Selecting Packet Type
The Slider and Packet Number can only select packets in the currently selected
program stream. The stream is indicated in the Packet Type drop-down list and
by the magnifying glass symbol, , in the Program Structure window. A new
stream may be selected from either the list box or the window.
Choose an
Elementary Stream
by selecting the Name in
the Program Structure or
from the List in the Slider
Bar ”List Box”.
3- 16
MTS400 Series MPEG Test System User Manual
PES Analyzer - Menus and Controls
Menus and Options
NOTE. A check mark next to an option indicates that the window or toolbar is
currently visible or enabled, no check mark means that it is hidden or disabled.
File Menu options
The File menu contains the menu options listed in Table 3--5.
Table 3- 5: File menu options
Edit Menu options
Command
Function
Close
Closes the current file. This option is available as soon as analysis
starts. If the wrong file is being opened, or the wrong Conformance
Tests are being run, selecting this option will abandon the analysis
and close the file.
Print
Prints contents of the current window.
Print Setup
Selects printer and configuration.
Exit
Closes any file that is open and terminates execution the program.
The Edit menu contains the menu options listed in Table 3--6.
Table 3- 6: Edit menu options
Command
Function
Copy
Copies the contents of the current window to the MS Windows™
Clipboard, from which it can be pasted into a document in another
application.
Copy TS Packet
Allows the user to select an AU (access unit) within the PES
Analyzer, and then copy the TS packet number onto the Windows
clipboard. The Stream Analyzer may then be started and Paste TS
packet selected to go to the packet number retrieved from the
clipboard.
MTS400 Series MPEG Test System User Manual
3- 17
PES Analyzer - Menus and Controls
View Menu options
The View menu contains the menu options listed in Table 3--7.
Table 3- 7: View menu options
Options Menu options
Command
Function
Toolbar
Shows or hides the Toolbar, which provides a set of convenient
shortcuts for the more frequently used menu options.
Status Bar
Shows or hides the Status Bar.
Event Log
Shows or Hides the Event Log.
Hex
Shows or Hides the Hex View.
Interpretation
Shows or Hides the Packet Interpretation view.
PTS/DTS Timing
Shows or Hides the PTS/DTS Timing Analysis window.
The Options menu contains the menu options listed in Table 3--8.
Table 3- 8: Options menu options
Window Menu options
Command
Function
Limit Repeat Errors
Only lists the first 20 occurrences of each error type in the event
log.
The Window menu contains the menu options listed in Table 3--9.
Table 3- 9: Window menu options
3- 18
Command
Function
Cascade
Arranges all the windows so that they are neatly stacked; only the
title bars show behind the active window.
Tile
Reduces and moves windows so that they can all be seen at once.
Arrange Icons
Aligns icons of any minimized windows at the bottom of the
program’s main window.
1 <window title>
2 <window title>
3 ... etc.
Makes the named window active, putting it on top of any windows
which had been hiding all or part of it.
MTS400 Series MPEG Test System User Manual
PES Analyzer - Menus and Controls
Help Menu options
The Help menu contains the menu options listed in Table 3--10.
Table 3- 10: Help menu options
Command
Function
About PES Analyzer…
Opens a dialog that displays the program version number.
MTS400 Series MPEG Test System User Manual
3- 19
Packet Hex View
This is the lowest level view of the PES Packet data. It displays the contents of
every byte in hexadecimal. Each byte is represented as a pair of hexadecimal
digits. The window may be resized to display 16, 32, 48, … bytes of information
on each row.
The four digit numbers in the left most column are the addresses of the first (that
is, leftmost) byte in the row. The addresses are shown in hexadecimal.
Column of bytes addressed
Address Column
showing address
of byte immediately
to the right
MTS400 Series MPEG Test System User Manual
3- 21
PES Analyzer - Packet Hex View
Packet Header
The Hex View displays the bytes holding PES Packet header information in
magenta color text. For example here is a packet containing a PTS field, from a
video stream:
bytes carrying header
information displayed in
magenta colour text
The most significant two bits of the eighth byte (that is, the byte at address
0x0007) contain the PTS_DTS_flags. The ninth byte (address 0x0008) contains
the PES_header_data_length, which specifies how many additional bytes are
present. In the above example:
PTS_DTS_flag = 2
PES_header_data_length = 5
These specify that there is a 5 byte Presentation Time Stamp (PTS) field in the
header. The contents of the PTS are 21 0A 17 64 B3 and they follow the
PES_header_data_length.
3- 22
MTS400 Series MPEG Test System User Manual
PES Analyzer - Packet Hex View
The preceding packet, from the same stream, carried both a PTS and DTS field:
PTS_DTS_flag = 3
PES_header_data_length = 10 (shown as 0A in hexadecimal)
19 bytes of header
information including the
DTS and PTS fields
Instead of having to interpret header information from the Hex View, the PES
Analyzer provides the Header Interpretation window. This interprets the header
and displays the contents, in table form, according to the MPEG-2 standards.
MTS400 Series MPEG Test System User Manual
3- 23
Event Log
The program always opens the Event Log window when it starts to analyze a
file. As the file is analyzed the program writes the results to the window as they
are produced. When processing finishes an “Analysis Complete” message is
appended to the report.
Packet Selection
If a warning or error message gives a packet number, that packet may be
inspected by selecting the message. For example, here is an extract from a file
with PTS errors on two of the Audio streams:
Clicking on the message for Prog. 3 Audio (PID 106), PES Packet 78 selects
both the program stream and the packet. This is reflected by the Slider Bar, in the
Program Structure, Hex View, Header interpretation and PTS/DTS Views.
MTS400 Series MPEG Test System User Manual
3- 25
PES Analyzer - Event Log
The Slider bar will look like this:
In the program structure view, the magnifying glass icon,
selected stream:
, appears on the
If the Hex View and/or Header Interpretation windows are open they will be
updated to show the contents of the selected packet. If the PTS/DTS View
window is open the cursor is placed on the packet and the panel showing the
Data at Cursor is updated.
3- 26
MTS400 Series MPEG Test System User Manual
PES Analyzer - Event Log
Having selected the packet it can now be inspected with other tools. The
information in the Header Inspection and Hex View windows will look like this:
To look at the timing of all the PTS carrying packets, open the PTS/DTS View:
This shows all the PES packets for the selected PID. See the section on the
PTS/DTS View for more information on selecting a particular packet.
MTS400 Series MPEG Test System User Manual
3- 27
Packet Header Interpretation
This window interprets and displays the header of the currently selected packet.
The above example shows a packet which carries a Presentation Time Stamp
(PTS).
The relationship between the top row of information displayed in the Header
Interpretation, for this packet, and the Hex View is:
MTS400 Series MPEG Test System User Manual
3- 29
PES Analyzer - Packet Header Interpretation
The next row completes the compulsory header information. The mapping
between the Header Interpretation and Hex View is:
The last row is a reminder that after the header comes the packet data. Any other
rows represent additional fields, such as the Presentation Time Stamp (PTS)
carried in this example. The relationship of these rows to the Hex view is:
3- 30
MTS400 Series MPEG Test System User Manual
PES Analyzer - Packet Header Interpretation
The size of the header depends on the fields it carries. Here is the Header
Information view of the preceding packet which carries PTS and DTS fields:
MTS400 Series MPEG Test System User Manual
3- 31
Program Structure
The Program Structure window displays a list of all available programs and the
elementary streams that they contain. It shows which stream is currently selected
for inspection and may be used to select a different stream.
The example below shows a program structure from a file conforming to the
ATSC standard.
The example below is a program structure from a file that is compliant to the
DVB standard.
MTS400 Series MPEG Test System User Manual
3- 33
PES Analyzer - Program Structure
The Diagram
The Program Structure is displayed by the program as soon as a file is opened.
As the file is analyzed, the top levels of a structure diagram are drawn in the
window:
An Elementary Stream is selected by default. The Program Structure view shows
the selected stream and other streams in the same program. The first program is
expanded to show the streams in the next level.
Streams in the other programs are initially hidden from view.
The structure is represented by a tree diagram, with the “root node” or highest
level component at the top. Components which contain more information
beneath them in the structure are indicated by a square box.
Components that are connected to a branch of the tree without a square box are
leaf nodes. In this case the Video and Audio elementary streams are leaf nodes.
They display the lowest and finest level of detail.
Nodes can be expanded and contracted by clicking on the square box.
3- 34
MTS400 Series MPEG Test System User Manual
PES Analyzer - Program Structure
Selecting a Packet Type
When a file is first opened and analyzed a stream will be selected by default. The
type is indicated by the magnifying glass symbol, , in the Program Structure.
It is also displayed in the Packet Type “list Box” on the Slider Bar. A new stream
may be selected from either the list box or the window.
Choose an
Elementary Stream
by selecting the Name in
the Program Structure or
from the List in the Slider
Bar ”List Box”
MTS400 Series MPEG Test System User Manual
3- 35
PTS/DTS Timing Analysis
The PTS/DTS View shows timing analysis of the selected stream. The x-axis
shows the duration of the stream in seconds. The y-axis shows the differences
between the expected and actual DTS values. A vertical blue line is used to show
the difference between the PTS and DTS for each Access Unit (AU). Therefore,
a compliant stream will exhibit each DTS on the 0ms y-axis. Streams with errors
usually exhibit a “stepped” graphical effect.
Any AU in the stream may be selected to view additional information in the
panel on the right. If the panel is not tall enough to show all of the information a
scroll bar appears.
MTS400 Series MPEG Test System User Manual
3- 37
PES Analyzer - PTS/DTS Timing Analysis
When first opened the entire stream is shown. Even a small file may display data
points packed too closely together to be read; for example, here is just under 12
seconds of video:
A longer sample may appear as a solid band of blue.
To see the individual packets or access units click on the Zoom In button on the
Toolbar:
3- 38
MTS400 Series MPEG Test System User Manual
PES Analyzer - PTS/DTS Timing Analysis
In this example, clicking the on the Zoom In button four times gave a much
clearer view:
The blue crosses of Presentation Time Stamps and the magenta
Decoding Time Stamps can now be differentiated.
crosses of
To Zoom back out click on the Zoom Out button as many times as required:
MTS400 Series MPEG Test System User Manual
3- 39
PES Analyzer - PTS/DTS Timing Analysis
Access Unit Selection
The triangular cursor above the graph indicates the selected access unit. Extra
information about that access unit is displayed in the Panel on the right of the
Graph.
Scrolling the View
The Slider at the bottom of the window indicates where the displayed packets /
access units are in relation to the rest of the file. It can be used to scroll the
display through the data in the same way as a standard window scroll bar.
Slider Control
Shows position of selected access unit
within the file. Drag the control to move
the View Bar. When released it returns
to show position of selected access unit
First
Access unit
in File
Earliest
Access unit
in View
View Bar
Shows size and position
of visible area of the
graph within the file.
Latest
Access unit
in View
Last
Access unit
in File
To scroll the stream through the view drag the Slider Control left or right with
the mouse. After dragging the Slider Control it returns to the previous position
showing the location of the selected access unit.
3- 40
MTS400 Series MPEG Test System User Manual
PES Analyzer - PTS/DTS Timing Analysis
Click the mouse pointer on the white space either side of the View Bar to center
the displayed graph about the currently selected access unit.
When an access unit is selected on the graph, the Slider Control is automatically
repositioned within the View Bar. The placement of the Slider Control reflects
the position of the selected packet in the field of view.
Selecting an Access Unit on the graph also changes the selection for all of the
other views to the packet containing that Access Unit.
Video Streams
The panel on the right shows information about the selected access unit. For
video streams these are always complete packets. Some of the information
shown in the panel is specific to video streams, that is, frame rate and frame
type.
The graph shows the frames of video in transmission order analysis and, when
“Zoomed In” close enough, the type of each packet plotted along the x-axis. The
graph scale is drawn in gray dashed lines. It is the equivalent of the scale or
graticule on an oscilloscope or logic analyzer.
MTS400 Series MPEG Test System User Manual
3- 41
PES Analyzer - PTS/DTS Timing Analysis
Frame Type
Shown when there is space to
display the characters.
y-- axis shows any
differences between
the PTS / DTS times
and the calculated
arrival times of the
Access Unit.
It also indicates the
difference between
PTS and DTS times.
B -- Frame
P -- Frame
I -- Frame
Line colour and
cursor show selected
access unit
PTS
DTS
Frames plotted in
Transmission Order
along the x-- axis
X-Axis
The x-axis shows the nominal time of an access unit. The first access unit
displayed is taken to have a nominal time of zero. Each access unit has a nominal
duration, calculated from parameters within the elementary stream. These
parameters include “low_delay” and “repeat_first_field”, which allow analysis of
effects such as 3:2 pulldown. These effects alter the access unit duration, which
is nominally equal to a video frame period.
Y-Axis
The position on the y-axis of a PTS or DTS shows the relative timing of the
timestamps. The first timestamp (PTS, or DTS) is taken to have a y-value of
zero. Each Subsequent timestamp has a y-value given by the difference between
their timestamp and the first timestamp, less the difference in nominal time of
their access unit and the first access unit.
The solid blue vertical lines show the time difference between the PTS and DTS
from the same Access Unit.
3- 42
MTS400 Series MPEG Test System User Manual
PES Analyzer - PTS/DTS Timing Analysis
Audio Streams
The panel on the right shows information about the selected access unit. For
video streams, these are always complete packets. The frame rate and frame type
shown in the panel are specific to video streams. The “Picture Size (H x V)”
information is taken from the display_horizontal_size and display_vertical_size
values in the sequence display extension. If that is not present, the horizontal_size_value and vertical_size_values in the sequence header, as modified by
the sequence header extension values horizontal_size_extension and vertical_size_extension in the sequence header extension are used.
MTS400 Series MPEG Test System User Manual
3- 43
PES Analyzer - PTS/DTS Timing Analysis
Some of the information shown in the panel is specific to audio streams. AC-3
Audio streams will differ from Audio streams.
The graph shows timing analysis of the PTS. There are no DTS in an audio
stream. Select an access unit by clicking on it with the mouse. Clicking between
two PTS will select an access unit that does not carry a PTS.
Difference
between the
PTS and the
calculated
arrival time
of the
Access Unit.
Solid line and
cursor show selected
access unit
PTS
The graph scale is drawn in gray dashed lines for each value on the axis. In this
example there are only two values on the y-axis, at 0 ms and 24 ms.
3- 44
MTS400 Series MPEG Test System User Manual
PES Analyzer - PTS/DTS Timing Analysis
AC-3 Audio Streams
The Data at Cursor panel of the PTS/DTS View shows different information for
AC-3 Audio streams. Otherwise the window works in the same way as for Audio
streams.
MTS400 Series MPEG Test System User Manual
3- 45
PES Analyzer - PTS/DTS Timing Analysis
AAC Audio Streams
The Data at Cursor panel of the PTS/DTS View shows different information for
AAC Audio streams. Otherwise the window works in the same way as for Audio
streams.
3- 46
MTS400 Series MPEG Test System User Manual
T-STD Buffer Analyzer
Test Equipment Depot - 800.517.8431 - 99 Washington Street Melrose, MA 02176 - FAX 781.665.0780 - TestEquipmentDepot.com
Getting Started
The T_STD Buffer Analyzer models the behavior of the buffers in the hypothetical Transport Stream System Target Decoder, as specified in ISO/IEC 13818-1. It
will process video, audio, and system control streams. The results of the analysis
are displayed as graphs of the buffer capacity over time and a log of exceptions
and noteworthy events.
Suitable Streams
Any valid MPEG file, recorded or synthesized, can be processed by this
application. A valid file is one that starts on a transport stream (TS) packet
boundary (the first byte of the file must contain the first byte of a TS packet).
The Buffer Analyzer will process video, audio, and system control streams that
are compliant with the 1996 standard ISO/IEC 13818 parts 1-3.
It will handle transport streams that contain PCR and/or PTS/DTS discontinuities. The PTS/DTS and PCR in a stream must, however, use the same timebase.
Buffer Analyzer is unable to work on scrambled streams. If it fails to make sense
of a stream, use TS Analyzer to determine if the stream is scrambled.
MTS400 Series MPEG Test System User Manual
4- 1
T-STD Buffer Analyzer - Getting Started
Table Handling
Multiple PAT and PMT
Versions
Buffer Analyzer forms a list of which elementary streams are present in the
transport stream. This is called the Stream List. It creates the Stream List by
reading the first occurrence of the Program Association Table (PAT) and Program
Map Table (PMT).
If more than one version of the PAT and/or PMT are present TS Cutter may be
used to isolate a particular section for analysis.
MPEG-2, DVB and ATSC
Tables
Only PIDs carrying MPEG-2 PSI tables are included in the System model. Any
DVB or ATSC tables that are present in the Transport Stream are ignored.
Starting the Program
The program may be started by selecting the Buffer Analyzer option
from the Start > Programs menu or by double clicking on the Buffer Analyzer Shortcut on the desktop.
Initial Appearance
4- 2
Once the program has started and is ready for use, it will open a Main Window.
When the program starts, the main window looks like this:
MTS400 Series MPEG Test System User Manual
T-STD Buffer Analyzer - Getting Started
The Toolbar (row of buttons above the dark gray area of the empty window) may
be hidden from view, moved to a separate window, or moved to either side or the
bottom of the main window.
The Status line at the very bottom of the window may be hidden from view. It
displays information about the application and keyboard status.
Initial Menu Options
The application presents different menus and options, depending on whether a
file is open for analysis. The menu options available when Buffer Analyzer has
just been started, or after a file is closed, are:
MTS400 Series MPEG Test System User Manual
4- 3
T-STD Buffer Analyzer - Getting Started
File Menu Options. Table 4--1 lists the File menu options.
Table 4- 1: File menu options
Command
Function
New
Opens a stream file for analysis and opens or creates a Buffer Model
Results (BMR) file in which to store the results.
The application opens a file selection dialog allowing the user to
choose the stream file. It then opens another file selector dialog to
specify the BMR file.
Open...
Opens an existing BMR file to review results of a previous analysis.
The application opens the file selection dialog allowing the user to
choose the required file.
Print Setup...
Opens a dialog for selecting which printer and associated options to
use.
1 <filename>
2 <filename>
3 <filename>
4 <filename>
A list of the four most recently used BMR files. If Buffer Analyzer has
recently been installed the list may hold less than four files.
Exit
Finishes running the program.
Selecting a filename opens that BMR file for review.
View Menu Options. Table 4--2 lists the File menu options.
Table 4- 2: View menu options
Command
Function
Toolbar
Displays or hides the toolbar.
Status Bar
Displays or hides the status bar.
Settings…
Opens the Settings dialog for specifying Video Buffer Sizes and
Video Data Transfer method.
(a check mark next to an option shows that the toolbar is currently visible; no check mark means
that it is hidden.)
Settings
Various configuration parameters, including Packet Interpretation, Pre-Scan
Packets, PES Private Interpretation, Video Buffer Sizes, Video Data Transfer
method, and Audio Buffer sizes may be modified before and after opening an
MPEG file. When a file is open, one or more streams may be analyzed, the
settings may be changed, and then other streams may be analyzed with the new
settings. If the settings are changed, to reanalyze streams analyzed with previous
settings, the MPEG file must be closed and opened again.
4- 4
MTS400 Series MPEG Test System User Manual
T-STD Buffer Analyzer - Getting Started
It is a good idea to check the settings before opening a file to verify the method
with which video streams will be analyzed.
Select Settings... from the View menu to open the Settings dialog.
This opens the Settings dialog, which has three tabs: System, Video and Audio.
System Settings
These options can only be set before analyzing a file. They are disabled (grayed
out) while a file is open.
The MPEG2 / ATSC option is available on ATSC or ATSC/DVB dual standard
MPEG Test System products. It is disabled (grayed out) on single standard DVB
systems.
Packet Interpretation. Specifies which standards will be used for interpreting the
packets in the Transport Stream when a file is opened for analysis. The options
are:
MPEG2
MTS400 Series MPEG Test System User Manual
Interprets the packets according to the standards for
DVB streams.
4- 5
T-STD Buffer Analyzer - Getting Started
MPEG2 / ATSC
Interprets the packets according to the ATSC standards.
This option is required to allow AC-3 audio stream content to be analyzed.
Pre-Scan Packets. During the initial processing of an MPEG file, a number of
packets are prescanned for information that will result in a more accurate
analysis of the initial parts of the transport stream. The greater the number of
prescanned packets, the greater the chance of locating all of the information
required for accurate analysis. The drawback is increased processing time. By
default, 10000 packets are prescanned, which should be sufficient for most
streams, excluding High Definition Video.
All Packets
Select this checkbox to cause all packets to be prescanned. If this checkbox is selected, the packets field
will be disabled (grayed out).
Packets
If the All Packets checkbox is not selected, enter the
number of packets to be prescanned in this field.
PES Private Interpretation. This setting specifies the model type to use for streams
signaled as PES Private (stream_type = 6).
The selections available include the following: AC-3 Audio, AAC Audio,
MPEG-2 Audio and Video and System. The default setting is AC-3 Audio.
Video Settings
Buffer Sizes. Specifies the sizes that will be used for the Main and Elementary
Buffers, when interpreting the stream. The options are:
4- 6
MTS400 Series MPEG Test System User Manual
T-STD Buffer Analyzer - Getting Started
Automatic
Automatically detect the buffer sizes from the Sequence
Headers and Extensions in the elementary stream being
processed. This is the default option when the application is started.
Manual
Enables the size of the Main or Multiplex buffer (MB)
and Elementary Buffer (EB) to be specified manually.
The MB and EB fields are available for editing when
this option is enabled.
Data Transfer. By default Buffer Analyzer inspects the stream to determine which
transfer method to use. This can be overridden if required. The options are:
Automatic
Examine the stream to determine the transfer method.
This is the default option when the application is started.
Leak Method
Forces modeling of the stream using the Leak Method.
VBV Delay Method
Forces modeling of the stream using the Video Buffer
Verifier (VBV) Delay Method.
Default Frame Rate. The frame rate is one of the parameters that is searched for
during the prescan phase of analysis. However if it is not found, then the default
value selected from the drop-down list in the Default Frame Rate field is used.
Audio Settings
MTS400 Series MPEG Test System User Manual
4- 7
T-STD Buffer Analyzer - Getting Started
Buffer Size. Specifies the size that will be used for the audio buffer when
interpreting the stream. The options are as follows:
Automatic
Automatically detect the buffer sizes from the Sequence
Headers and Extensions in the elementary stream being
processed. This is the default option when the application is started.
Manual
Enables the size of the buffer (B) to be specified manually. The B field is available for editing when this option
is enabled.
AAC. Select the number of AAC channels required from the drop-down list.
Within the ADTS (Audio Data Transfer Stream) fixed header, the channel
configuration field is used to indicate the number of channels required by AAC.
If the number in this field is zero, then the value in the AAC Default channels
field is used.
Note that the associated ADIF (Audio Data Interchange Format) is unsupported.
Refer to Information technology –
Generic coding of moving pictures and associated information,
Part 7: Advanced Audio Coding (AAC) ISO/IEC 13818-7:1997
NOTE. Remember that if the settings are modified the new settings are used for
all video streams which are subsequently processed. The settings are reset to the
default option when the application is started.
Opening an MPEG File
Any file holding a recorded or synthesized sample of a Transport Stream that
carries video, audio, and/or system control streams canbe analyzed. These files
are referred to as MPEG files to distinguish them from Buffer Model Results
(BMR) files. The results of analysis are written to a BMR files.
Opening a File from the
Menus and Toolbar
4- 8
To open a file for analysis, select the New option from the File menu. Alternatively, use the Ctrl+N keyboard shortcut.
MTS400 Series MPEG Test System User Manual
T-STD Buffer Analyzer - Getting Started
NOTE. The list of previously used files shows BMR not MPEG files, as can be
seen by their .bmr extension.
There is a shortcut button, for the New command, on the Toolbar:
In response to the New command, the Buffer Analyzer opens a file selection
dialog to choose an MPEG file for processing. When the MPEG file has been
chosen, the MPEG file selector closes and another file selection dialog opens.
This is for choosing a Buffer Model Results File (BMR), which holds the results
of any analysis performed on the MPEG file.
Buffer Analyzer suggests an output file with the same name as the MPEG file
but a file extension of .bmr to hold the Buffer Model Results. Select OK to
accept the suggested filename. Otherwise select a different file or type in a
different name and then select OK.
NOTE. Choosing an existing BMR file will erase all results that had previously
been saved in that file.
Opening a BMR File
An existing Buffer Model Results (BMR) file can be opened to review the results
saved in it from previous Buffer Model Analysis.
MTS400 Series MPEG Test System User Manual
4- 9
T-STD Buffer Analyzer - Getting Started
Opening a File from the
Menus and Toolbar
To open a BMR file select the Open... option from the File menu. Alternatively
use the Ctrl+O keyboard shortcut.
If the required file is in the list of recently analyzed BMR files, it can be opened
from the list to save using the open file dialog.
There is a shortcut button available on the Toolbar for opening a file, which has
the standard file open symbol:
Window Layout
The Stream List window is opened as soon as either an MPEG or BMR file is
opened. The application inspects the file to find what program streams are
present according to the Packet Interpretation setting. For example:
4- 10
MTS400 Series MPEG Test System User Manual
T-STD Buffer Analyzer - Getting Started
Initial Processing of MPEG Files
If an MPEG file is opened, the program performs initial analysis to form the
Stream List and calculate the mean transport rate. All streams in the list are
marked as Unprocessed, because no analysis has been performed on them in this
session.
To build the Stream List the MPEG file is scanned for the PAT and PMT table
contents. It is assumed that the contents are constant, which is the general case.
If the program changes in a drastic way, such as streams disappearing between
PMTs, the model will give meaningless results.
Only the first occurrence of complete PAT and PMT are read when forming the
Stream List. Use TS Cutter to isolate a section when multiple versions of the
tables occur.
A number of packets in the file are scanned for the Sequence Header and
Extension start codes (containing profile and level) (see Settings, page 4--4). If
they are not found the Main Profile and Level setting are assumed together with
the maximum VBV buffer size.
MTS400 Series MPEG Test System User Manual
4- 11
T-STD Buffer Analyzer - Getting Started
Initial Processing of BMR Files
If a BMR file is opened, the State column indicates which streams had been
processed. The file only holds results for those streams marked as Processed. To
obtain results for unprocessed streams, the original MPEG file will have to be
opened again and analyzed.
4- 12
MTS400 Series MPEG Test System User Manual
Menus and Controls
When a file is open, the program presents a different set of menus and options.
They change as soon as the Stream List window appears. For example, the Open
file commands are replaced by Close file commands.
Toolbar
The Toolbar provides a set of convenient shortcuts for the more frequently used
menu options. The available commands are:
Opens dialogs to select an MPEG file for analysis and a BMR file for saving the
results. This button is disabled (grayed out) when a file is open.
Opens a dialog to select a BMR file to review the results of a previous analysis
session. This button is disabled (grayed out) when a file is open.
Closes the current file. This button becomes available the moment a file is opened. If
the wrong file is being opened, or the wrong options are selected, clicking on the
button will abandon the analysis and close the file.
Opens the Settings dialog.
Prints the contents of the current window.
Opens a dialog which displays the program version number.
Analyzes the stream(s) from the PID(s) which are currently selected in the
Stream List. This button is only enabled when one or more PIDs which are marked
as unprocessed are selected.
The next group of five buttons open Results Views for the selected streams.
Opens a graph of the Transport Buffer for the selected stream. This button is only
enabled when the PID of a Processed stream is selected in the Stream List window.
Opens a graph of the Multiplexing Buffer of a video stream; Main Buffer of an audio
stream or of a system information stream. The button is only enabled when the PID
of a Processed stream is selected in the Stream List.
MTS400 Series MPEG Test System User Manual
4- 13
T-STD Buffer Analyzer - Menus and Controls
Opens a graph of the Elementary Stream Buffer for the selected video stream. This
option is only available when a PID carrying a Processed Video stream is selected in
the Stream List.
Opens the Event Log for the selected stream. The button is only enabled when the
PID of a Processed stream is selected in the Stream List window.
Opens all of the relevant graphs and the event log for the selected stream. This
option is only available when a PID carrying a Processed Video stream is selected in
the Stream List.
The remaining buttons control display options for Graphs of buffer analysis
results.
Toggles the graph displays between having all points drawn and sampling the points
for drawing.
Synchronize Graphs toggles the graphs between using the same position and zoom
settings or operating independently.
Auto Scale toggles the selected graph between fixed and auto scaling of the y axis.
Zoom In increases the magnification along the x-axis (time scale) of the currently
selected graph. All graphs are affected if Synchronize Graphs is enabled.
Zoom Out reduces the magnification along the x-axis (time scale) of the currently
selected graph. All graphs are affected if Synchronize Graphs is enabled.
The Toolbar can be dragged off the edge of the main window into a floating
pallet. To do this, place the mouse pointer on the background inside the Toolbar,
(not on one of the buttons), hold the left button down, and drag into the main
window area. The result is a self-contained window that looks like this:
To replace the Toolbar on the window border drag it over the border, until the
outline changes shape, and release it. It can be placed on the top, bottom, left or
right hand edges.
4- 14
MTS400 Series MPEG Test System User Manual
T-STD Buffer Analyzer - Menus and Controls
Status Bar
The Status Bar may be hidden from view, but if is visible, it is always at the
bottom of the main window. It displays the following information about the
program and keyboard states:
MTS400 Series MPEG Test System User Manual
4- 15
T-STD Buffer Analyzer - Menus and Controls
Menu Options
Table 4--3 to Table 4--8 list the available menu options.
Table 4- 3: File menu options
Command
Function
Close
Closes the current file. This option is available as soon as analysis
starts. If the wrong file is being opened, or the wrong options are
selected, selecting this option will abandon the analysis and close
the file.
Print
Prints contents of the current window.
Print Preview
Prints contents of the current window.
Print Setup
Selects printer and configuration.
Exit
Closes any file that is open and terminates the program.
Table 4- 4: View menu options
4- 16
Command
Function
Toolbar
Shows or hides the Toolbar.
Status Bar
Shows or hides the Status Bar.
Settings…
Opens the Settings dialog.
Global Event Log
Shows or hides the Global Event Log window.
Transport Buffer
Opens a graph of the Transport Buffer for the selected PID.
Main Buffer
Opens a graph for the selected PID in the Stream List. The graph
shows results for the Main Buffer of audio and system streams or the
Multiplex Buffer for video streams.
Elementary Buffer
Opens a graph of the Elementary Buffer for the selected PID.
PID Event Log
Displays the Event Log for the selected PID.
All Buffers
Opens all graphs and the log for the selected PID.
MTS400 Series MPEG Test System User Manual
T-STD Buffer Analyzer - Menus and Controls
Table 4- 5: Options menu options
Command
Function
Draw All Points
Toggles between drawing all points on the graphs, drawing every nth
point. ‘n’ is calculated from the total number of data points and the
screen space for the graph.
Synchronize Views
Toggles the graphs between using the same position and zoom
settings and operating independently.
Auto Scale % Axis
Toggles the selected graph between fixed and auto scaling of the y
axis.
Table 4- 6: Process menu options
Command
Function
Process Streams
Applies the stream(s) from the PID(s) selected in the Stream List to
the System Target Decoder Buffer Model.
This option is only enabled when one or more unprocessed PIDs are
selected in the Stream List.
Table 4- 7: Window menu options
Command
Function
Cascade
Arranges the windows like this:
Cascade
Tile
Tiles the windows. For example, five windows would be tiled like
this:
Tile
MTS400 Series MPEG Test System User Manual
4- 17
T-STD Buffer Analyzer - Menus and Controls
Table 4- 7: Window menu options (Cont.)
Command
Function
Arrange Icons
Arranges any minimized windows along the bottom of the main
window. Aligns icons of any minimized windows at the bottom of the
program’s main window.
1 <window title>
Lists all of the available windows. A check mark indicates the active
window. Select an option to bring that window to the top.
Table 4- 8: Help menu options
Command
Function
About Buffer Analyzer… Opens a dialog that displays the program version number.
4- 18
MTS400 Series MPEG Test System User Manual
Stream List
The Stream List displays all of the elementary streams in the file. The streams
are sorted and grouped together by Program number. Within each program, the
streams are sorted in ascending PID number.
Stream Type indicates whether the stream is Video, Audio, AC-3 Audio, AAC
Audio, System or Private. Private streams cannot be processed, but may show
more information in the type, for example ISO/IEC 13818 Auxiliary. The Packet
Interpretation from the System tab of the Settings dialog sets which standard is
used for identifying these types.
The preceding example is from a DVB compliant transport stream.
MTS400 Series MPEG Test System User Manual
4- 19
T-STD Buffer Analyzer - Stream List
An ATSC stream might look like this:
State indicates if the stream has been processed (analyzed in the buffer model). A
stream may only be processed once while the file is open. To process a stream
again, the file must be closed and then opened again.
When an MPEG file is first opened, the program streams are all marked as
Unprocessed. This is because no buffer model analysis has yet been performed in
this session.
If a BMR file is opened, the State column indicates which streams have been
processed. The file only holds results for those streams marked as Processed. To
obtain results for Unprocessed streams the original MPEG file will have to be
opened and analyzed.
4- 20
MTS400 Series MPEG Test System User Manual
T-STD Buffer Analyzer - Stream List
Selecting Streams
To analyze or open the results views for a stream, or streams, they must first be
selected in the Stream List. To select a stream, click on the PID number.
For example, to select the Video stream carried in PID 289, click on the number
289.
To select a contiguous range of streams: click on the first streams PID, then hold
the Shift or Y key down and click on the last stream’s PID number. If the
required streams are not adjacent, hold the Ctrl key down and click on the PID
number for each stream.
All streams can be deselected by double-clicking the mouse pointer over any
item of data other than in the PID column. To deselect a particular stream while
leaving others selected, hold the Ctrl key down and click on the stream’s PID
number.
Processing Streams
Having selected one or more streams from the Stream List they can be analyzed
in the buffer model.
To start analysis, select the Process Streams option from the Process menu.
Alternatively, click on the Process button in the toolbar.
MTS400 Series MPEG Test System User Manual
4- 21
T-STD Buffer Analyzer - Stream List
Supported Profiles &
Levels
Buffer Analyzer supports the 6 Profiles: Simple, Main, SNR, Spatial, High and
4:2:2.
It supports the 4 Levels: High, High - 1440, Main and low.
Details of valid combinations of profile and level are given in standards
document ISO/IEC 13818 part 2 section 8.5.
Start-Up
The hypothetical T-STD specified in ISO/IEC 13818 part 1 section 2.4.2
assumes a processing steady state. To handle the start-up processing before
reaching the steady state Buffer Analyzer performs as follows:
H
The fraction of the first video frame leading up to the first picture start code
is not passed through the Buffer Analyzer. This is because it is not possible
to determine whether the Leak or VBV Delay method is being used. During
this period, the PES header, Sequence Header, and Extension information are
extracted. This information is used to determine the initial DTS, size of the
MB and EB buffers.
H
The Decoding Time Stamp (DTS) for the first frame is assumed to be
correct. It is used as a base for the timing of all subsequent frames. MB
underflow errors are suppressed during the first frame.
If the DTS of the first frame is not correct, use TS Cutter to remove the suspect
frame(s) from the file.
Approximations
4- 22
The application uses the following approximations to model the behavior of the
hypothetical T-STD:
H
Data is processed one packet (188 bytes) at a time. An underflow/overflow
condition that occurs and clears within the period of one packet will be
missed.
H
Processing one packet at a time causes the buffers to be emptied in block
fashion, thus giving a stepped graphical output.
H
Slight quantization effects occur because the model is processed at discrete
time intervals, corresponding to a single packet length. This may affect the
VBV Delay calculations. The timing intervals for transferring frames from
MB to EB are dynamically adjusted to compensate.
MTS400 Series MPEG Test System User Manual
Event and Message Logs
The T-STD Buffer Analyzer allows you access to the Global Event log and the
PID Event log. You can also configure the T-STD Buffer Analyzer to work with
the Tracer utility to create a log containing more analysis detail.
Global Event Log
The Global Event Log displays: reports from the initial analysis, PID independent information (Transport Stream errors) and high level details for each stream
processed.
For details of events detected during the processing of a stream, open the PID
Event Log for that stream.
MTS400 Series MPEG Test System User Manual
4- 23
T-STD Buffer Analyzer - Event and Message Logs
PID Event Log
An Event Log window may be opened for each PID that has been or is currently
being processed. Results are written to the log as they are produced.
All times and packet numbers are given relative to the start of the file.
Event Selection
4- 24
Selecting the time of an event from the Event Log will place a cursor at that time
in each of the Buffer results Graphs. To select an event, click on its Time in the
left column. For example, to select the B/MB Overflow Start for packet 83496,
click on the time 0:15.697.
MTS400 Series MPEG Test System User Manual
T-STD Buffer Analyzer - Event and Message Logs
To deselect an event, click the mouse pointer over any part of the data, other than
in the Time column. Alternatively, hold the Ctrl key down and click on the
selected event Time.
Detail Message Logging
The Buffer Analyzer may be used with the software developers utility Tracer to
reveal more detail. When executed with the -d command line option, the Buffer
Analyzer produces a detail message log, which may be read with the Tracer
program.
These messages may be useful for in-depth analysis of the internal processing,
particularly for the video stream type. Tracer has filtering capabilities that allow
the user to focus on message types of particular interest. Detail messages
generated by Buffer Analyzer while Tracer is not running may be lost.
Refer to Tracer (section 11) for details of how to set up and use Buffer Analyzer
and Tracer together.
MTS400 Series MPEG Test System User Manual
4- 25
Results Graphs
The results of the analysis are plotted on a separate graph for each buffer. When a
graph is opened for a stream that is still being processed, each result is plotted as
soon as it is produced from the model.
All of the graphs have a similar format and controls.
Common Features
The Axes
All of the graphs plot time from the start of file on the x-axis and current space
used in the buffer on the y-axis.
Zoom
When the results graph is first opened, the entire graph is shown. Even a small
file may display data points packed too closely to see the features clearly. For
example, here is just under 20 seconds of a video stream that generated a lot of
events:
MTS400 Series MPEG Test System User Manual
4- 27
T-STD Buffer Analyzer - Results Graphs
Even this small sample holds some solid bands of blue lines and green event
markers, from which only general trends can be determined. To change the time
scale (x-axis) to resolve finer detail, click on the Zoom In button on the Toolbar:
Zoom in as many times as required to achieve the desired magnification. The
magnification is doubled each time the button is clicked.
In this example, clicking on the Zoom In button three times gave a much clearer
view:
To Zoom back out, click on the Zoom Out button as many times as required:
Each time the Zoom Out button is clicked, the magnification is halved, until the
full graph is again displayed.
4- 28
MTS400 Series MPEG Test System User Manual
T-STD Buffer Analyzer - Results Graphs
Scrolling the View
The slider at the bottom of the window indicates where the displayed area is in
relation to the rest of the file. It can be used to scroll the display through the
graph in a similar way to a window scroll bar.
Slider Control
Shows either: the center of the visible
area of the graph, or the position of the
cursor in both the file and visible area.
Start of file
Earliest
time in
View
View Bar
Shows size and position
of visible area of the
graph within the file.
Latest
time in
View
End of file
To scroll the stream through the view:
H
Drag the Slider Control left or right with the mouse.
H
Click the mouse pointer in the slider bar (either the clear sections or the view
bar) to the side of the Slider Control.
When a time or event is selected on the graph, the Slider Control is automatically
repositioned within the View Bar. The placement of the Slider Control reflects
the position of the selected packet in the field of view.
Event Markers
A graph may show one or more green triangular markers along the top. Each
marker indicates the time a particular event, listed in the PID Event Log,
occurred.
Only events that relate to the points plotted on the graph are displayed in that
graph. Hence an event relating to a Video Multiplex Buffer will only be marked
MTS400 Series MPEG Test System User Manual
4- 29
T-STD Buffer Analyzer - Results Graphs
on the Video Multiplex graph and not on the Elementary or Transport Buffer
graphs.
Double-clicking on a marker will display a pop-up window. This shows the time
and a brief description of the event that is marked.
For example: selecting an event relating to the Elementary Buffer from the Event
Log of a video stream will place a cursor at the time of the event in the buffer
results graphs. Looking at the graphs, a marker of the event has been placed on
the Elementary Buffer graph, but not the Multiplex Buffer graph.
4- 30
MTS400 Series MPEG Test System User Manual
T-STD Buffer Analyzer - Results Graphs
MTS400 Series MPEG Test System User Manual
4- 31
T-STD Buffer Analyzer - Results Graphs
Synchronize Views
Graphs of results may be open for one or more streams. For each stream, one or
more graphs may be displayed. The graphs may have their zoom, cursor position
and visible section manipulated separately or all the graphs may be synchronized. For example, in unsynchronized operation, the open graphs may look like
this:
This pair of graphs show different periods in the file at different magnifications.
To synchronize the views, select the Synchronize Views option from the Options
menu.
4- 32
MTS400 Series MPEG Test System User Manual
T-STD Buffer Analyzer - Results Graphs
Alternatively, click on the equivalent shortcut button.
This will apply the zoom, cursor, and visible section of the active window to all
of the other graphs. While Synchronize Views is enabled a change to any graph
is immediately applied to all of the other graphs. After selecting Synchronize
Views, the previous example looked like this:
To separate the control of the graphs, disable synchronize views by selecting the
menu option or clicking on the shortcut button again.
Selection
The cursor may be repositioned within a graph by clicking on the required point.
This is useful when Synchronize Views is selected as a way of marking the same
time in all the graphs for ease of comparison.
MTS400 Series MPEG Test System User Manual
4- 33
T-STD Buffer Analyzer - Results Graphs
Auto Scale
The scale on the y-axis of the graphs shows space used in the buffer as a
percentage. By default, all of the graphs have a vertical scale that goes from
-50% to 200%. For example:
Selecting the Auto Scale % Axis option from the Options menu changes the
y-axis for the currently active graph.
Alternatively, select the equivalent shortcut button.
4- 34
MTS400 Series MPEG Test System User Manual
T-STD Buffer Analyzer - Results Graphs
The y-axis is now drawn so that the full scale contains the range of values in the
graph, to the nearest 25%. For example, if the range of values was from 30% to
64%, the y-axis would go from 25% to 75%. The earlier example will be
rescaled to look like this:
To revert to the default scale, select the menu option or click on the shortcut
button again.
Draw All Points
The graphs will often contain more data points than can be resolved on the
screen. By default, to avoid drawing points on top of each other, the application
will plot every nth point. This also speeds up drawing process. How many points
to plot is determined from the available width of the graph on the screen and the
total number of points to plot.
Use the Draw All Points option to look for outlying points and to resolve the fine
detail when zoomed in on the data.
Selecting the Draw All Points option from the Option menu will cause the
application to plot every point.
MTS400 Series MPEG Test System User Manual
4- 35
T-STD Buffer Analyzer - Results Graphs
Alternatively, select the equivalent shortcut button.
This may take much longer for larger files than the default option. The option
may be disabled by clicking on the shortcut button again or deselecting the
option from the menu. This can be done even while still redrawing the graphs.
Elementary Buffer Graph
An Elementary Buffer graph can only be opened for Video Streams, since these
are the only type that have an elementary buffer.
Elementary Buffers are not allowed to overflow, so the graph of the results never
goes above 100%. The graph uses the scale -50% to +250% to make comparison
easy.
4- 36
MTS400 Series MPEG Test System User Manual
T-STD Buffer Analyzer - Results Graphs
Multiplex or Main Buffer Graph
For Video streams this graph shows the results for modeling a Multiplex Buffer.
For Audio and System Control streams the graph shows the results for the Main
buffer. The title bar shows the stream type.
Here is an example to show the title for a graph of a System Control stream, on
PID 34, taken from a different file:
MTS400 Series MPEG Test System User Manual
4- 37
T-STD Buffer Analyzer - Results Graphs
Transport Buffer Graph
The Transport Buffer graph shows results of modeling the Transport Buffer for
Video, Audio, or System Control streams. The type of stream is shown in the
title bar. In the above example, the results plotted are for a Video stream carried
in PID 305.
Here is an example of an audio stream, on PID 306, from the same transport
stream:
4- 38
MTS400 Series MPEG Test System User Manual
T-STD Buffer Analyzer - Results Graphs
Detail Message Logging
The Buffer Analyzer may be used with the software developers utility Tracer to
reveal more detail. When executed with the -d command line option, the Buffer
Analyzer produces a detail message log, which may be read with the Tracer
program.
These messages may be useful for in-depth analysis of the internal processing,
particularly for the video stream type. Tracer has filtering capabilities that allow
the user to focus on message types of particular interest. Detail messages
generated by Buffer Analyzer while Tracer is not running may be lost.
Refer to the separate sub-section on Tracer, for details of how to set up and use
Buffer Analyzer and Tracer together.
MTS400 Series MPEG Test System User Manual
4- 39
Elementary Stream Analyzer
Getting Started
Elementary Stream (ES) Analyzer is an MPEG (Motion Pictures Expert Group)
stream analyzer that allows all MPEG-1 and MPEG-2 streams to be quickly
analyzed. Developers of MPEG compliant encoder and decoder systems, or field
application engineers (FAEs) supporting MPEG-based products will find
ES Analyzer a powerful and easy-to-use tool and debugging aid.
ES Analyzer provides the following facilities:
H
Analyze in detail and verify whether MPEG-1 system and MPEG-2, video,
and audio streams conform to MPEG standards. (A built-in stream demultiplexer makes it possible to analyze elementary streams embedded in a
transport stream. All streams are checked for both syntactic and semantic
conformance. Syntactic conformance means conformance with the MPEG
language, while semantic conformance relates to the field value and range
restrictions.)
H
Quickly zoom from transport streams, through PES and video streams into
GOP, pictures, slices, and all the way down to the macroblock layer.
H
Play out audio streams to MPEG-1, MPEG-2, Layers I and II, Japanese
AAC, and Dolby Digital (AC-3) standards.
H
Audio play to soundcard.
H
Analyze Layer I, Layer II audio data, AC-3 audio, and AAC audio.
H
View video output with the incorporated video player and analyze picture
data for any frame.
H
Produce picture quality analysis data including Quantizer Scale distribution,
motion vectors graph in a picture, and macroblock and picture size plots.
H
View the coded block patterns that have been extracted.
H
Display and analysis of DCT coefficients for each macroblock in a picture.
H
View interpreted and hexadecimal view of headers for all streams.
H
Display and analysis of DVB Teletext information.
H
View and analyze DVB subtitle content.
H
View and analyze ATSC closed caption to EIA608 and EIA708 standard.
H
View PID spectrum analysis for transport streams.
H
Analyze multiple streams in batch mode through the regression testing
mode.
MTS400 Series MPEG Test System User Manual
5- 1
ES Analyzer - Getting Started
H
Quickly navigate through stream hierarchy using the powerful and easy to
use graphical interface including the Stream Properties summary window.
H
‘Seekback’ at all levels, allowing users to go back in a stream at all levels,
thus allow more flexibility in navigation.
H
Set a level to report errors, filter them, and also store errors in log files.
NOTE. It is assumed that you are familiar with MPEG compression standards
and terminology. If you are new to MPEG and want to know about MPEG
compression standards and terminology, refer to the documents: ISO/IEC 11172
(Vol. 1, 2, 3 and 4) for MPEG-1 and ISO/IEC 13818 (Vol. 1, 2 and 3) for
MPEG-2 basics.
Starting the ES Analyzer
The program can be started by selecting the ES Analyzer option from
the Start > Programs menu or by double-clicking on the ES Analyzer
shortcut on the desktop.
Initially an empty shell window is displayed. It is necessary to open a stream
before any screen details can be seen.
5- 2
MTS400 Series MPEG Test System User Manual
ES Analyzer - Getting Started
Opening an MPEG Stream
1. To open a file, select the Open… option from the File Menu or select the
corresponding icon on the toolbar.
The following dialog box appears:
ES Analyzer displays a standard windows Open dialog box with two additional
fields: Hex Window and Open As.
2. Select the file you want to open.
The types of files that can be opened are as follows:
H
Transport stream files
H
PES stream files
H
Elementary stream files
H
MPEG-1 and MPEG-2 files
H
Regression scripts
H
Mask files
MTS400 Series MPEG Test System User Manual
5- 3
ES Analyzer - Getting Started
NOTE. If you want ES Analyzer to automatically detect the type of MPEG stream
the file contains, let the default Auto remain in the Open as field.
If you want to open the file as a specific type of stream and do not want
ES Analyzer to detect it, select the stream type in the Open as field.
If you open an MPEG stream as an incorrect stream type, numerous errors may
be reported and ES Analyzer may also behave unexpectedly.
If you open an ATSC stream as auto and the stream contains no PSIP service
and not decode. Close the file
information, the AC-3 audio may appear as
and reopen with ATSC Stream selected from the Open as field; the AC-3 audio
will now decode correctly.
3. Enable or disable the hex window.
ES Analyzer parses and demultiplexes the opened MPEG stream, and
displays the packet header fields in two formats—interpreted and hexadecimal.
H
If you want ES Analyzer to display the packet header fields in both the
formats, interpreted and hexadecimal, check the check box next to Hex
Window. (The hexadecimal format is displayed in a separate window.)
H
If you want ES Analyzer to display the packet header fields only in the
interpreted format, let the default remain. (By default, the check box next
to Hex Window is clear.)
NOTE. If you do not enable the Hex Window when you open a stream, you cannot
enable it later when ES Analyzer is parsing the stream.
4. Click Open when you are through with this dialog box.
5- 4
MTS400 Series MPEG Test System User Manual
ES Analyzer - Getting Started
Understanding the Main Window and Icons
ES Analyzer allows you to view multiple programs and streams simultaneously.
The tree view area on the left side displays the stream hierarchy. For the
currently selected stream, the details of the header are shown on the right side.
Errors, if encountered, are logged in the error log window at the bottom. A
summary of the stream parameters is displayed in the Stream Property window.
The status bar at the bottom of the window displays the current status and stream
characteristics.
MTS400 Series MPEG Test System User Manual
5- 5
ES Analyzer - Getting Started
Tool Bar
The tool bar provides a means of accessing frequently used menu bar commands
quickly; each icon represents a menu bar item. Icons will display a tooltip
description when the cursor is rested over it. The tool bar illustration below does
not show all of the buttons.
The table below lists the function of each icon and also indicates when the icon
is available. Availability refers to an icon being enabled or disabled with respect
to selected nodes in the left tree view window; disabled icons are ‘grayed out’.
You can toggle the tool bar display by selecting/deselecting the Toolbar
command on the View menu.
Table 5- 1: Tool Bar icons
Icon
5- 6
Availability
(Enabled/Disabled)
Menu Bar
equivalent
Opens an MPEG stream, a saved regression file (.REG file by default), or dumped
reports
Always enabled
File > Open…
Restarts analysis from the beginning of the
selected parent or child stream
Enabled for all nodes
Node > Intialize
Extracts a PES, Audio, or Video stream
from a multiplexed stream
Enabled for all the embedded
Node > Dump
stream nodes (PES, VES, AES) Stream
Allows navigation to the selected TPT
packets; used in conjunction with the Next
icon
Enabled for Transport and
Program
-
Enables navigation to the nth packet at
TPT node or the nth GOP at GOP node or
nth frame at AES node.
Used in conjunction with the adjacent
button
Always enabled; disabled only
for VES node
-
Allows navigation to the next/previous
packet of the selected node
Always enabled; disabled only
for VES node, or at end of file
Next/ Previous
Packet/ GOP
Toggles Start and Stop to run through Test
mode
Only enabled at GOP level
Start
Stop
Toggles between hexadecimal and decimal
display of data in fields
Always enabled
-
Shows or hides the error log window
Always enabled
-
Shows or hides the Hex Viewer, which
displays data in hexadecimal format
Enabled if Hex Window is
checked when opening a
stream, otherwise always
disabled
-
Function
MTS400 Series MPEG Test System User Manual
ES Analyzer - Getting Started
Table 5- 1: Tool Bar icons (Cont.)
Icon
Availability
(Enabled/Disabled)
Menu Bar
equivalent
Enables or disables packet view analysis
that displays the PID spectrum
Enabled only for PES
-
Allows zooming into any part of data being
displayed; useful when viewing Motion
Vector Display in the Slice And MB tab
Always enabled
-
Shows Frame Size Statistics for different
frames within a GOP
Enabled only for GOP node
(Disabled if the Picture Player
tab is selected)
Frame Sizes
Shows Slice Size Statistics, i.e., information about the sizes of the slices within a
Picture in a GOP
Enabled only for a GOP node
from within the Slice And MB
tab
Slice Sizes
Allows viewing the version and copyright
information
Always enabled
Help Topics
Function
(left icon)
(right icon)
Working with ES Analyzer
Commands
When using ES Analyzer, you can issue commands in one of three ways:
H
By clicking commands on the menu bar; this also includes the keyboard
shortcuts, which are shown next to the menu bar entries
H
By clicking icons on the toolbar
H
By clicking the right mouse button and selecting a command on the quick
menu
After you have invoked ES Analyzer, you need to select the bit stream file you
want to be analyzed by clicking Open on the File menu or by clicking the
appropriate icon on the toolbar. If the bit stream file is a valid MPEG file,
ES Analyzer displays the first packet of the top level stream. Now you can use
commands, described below, to navigate randomly to any part of the stream. You
can also run through a selected embedded stream using the Go command.
MTS400 Series MPEG Test System User Manual
5- 7
ES Analyzer - Getting Started
Tree View and Navigation
The tree view window displays the stream hierarchy of the currently opened bit
stream file. Each node in the tree view represents a level of hierarchy and is
displayed with:
H
An associated icon (the icon varies depending on the type of stream that the
node represents; these are displayed in the following table).
H
A tip that describes the kind of stream represented by the node.
H
The PID associated with the node, if applicable.
Table 5- 2: Navigation icons
Icon
Stream type representation
Transport stream.
Program stream.
System stream.
Packetized elementary stream (PES); PES containing a video or
audio stream, respectively.
Audio stream; an MPEG-1 and/or MPEG-2 audio stream.
Teletext.
Dolby AC-3 audio stream.
5- 8
MTS400 Series MPEG Test System User Manual
ES Analyzer - Getting Started
Table 5- 2: Navigation icons (Cont.)
Icon
Stream type representation
Video stream; an MPEG-1 and/or MPEG-2 video stream.
If Closed Caption data is detected during analysis, ‘CC’ is added to
the video icon.
User data stream.
Group of pictures (GOP).
DVB subtitle PES.
Suffix 1 and 2 in the Tree View icons (Video and Audio Elementary Streams)
refer to MPEG-1 or MPEG-2. Note that MPEG-2 streams can contain MPEG-1
audio information.
NOTE. If packets are scrambled or if stream analysis (AAC Audio) has been
excluded by dongle, ES Analyzer does not display them.
Navigating through
Streams
When an MPEG file is initially opened, ES Analyzer automatically determines
the kind of MPEG stream it is. For a valid MPEG bit stream, ES Analyzer opens
the tree view with a node for the top level stream contained in the file. By
default, the stream hierarchy is expanded to only one level. You can expand/collapse a node by clicking it. You can select the stream to be viewed at any level
displayed in the tree view window by simply clicking the left mouse button on
the specific node. Automatically, the window on the right is refreshed to display
the header and related information for the selected node.
ES Analyzer gives you full flexibility in viewing streams at any level. You can
navigate through the stream independently at each level of the stream. For
example, you may be viewing the first PES packet of a PES Stream, but in the
embedded VES stream, you may be viewing the last GOP that is not contained
in the first PES packet.
MTS400 Series MPEG Test System User Manual
5- 9
ES Analyzer - Getting Started
Using GoTo, Next and Previous Commands. These commands are applicable to all
types of streams and assume that you have opened a valid MPEG file. Each of
these commands can be executed for any node that is displayed in the stream
hierarchy tree where each node is either a GOP or a valid MPEG stream
(embedded or top level).
H
Step forward/backward to the Next/Previous packet or GOP in a video
stream for the selected node.
H
Position the file pointer to the nth packet or GOP in a video stream or frame
in an audio stream for the selected video/audio node.
H
Position the file pointer to the nth packet of the selected PID; this is
applicable to MPEG-1 system streams and MPEG-2 transport and program
streams.
H
Position the file pointer to the first packet of the selected node.
H
Save the embedded stream corresponding to the selected node in a separate
file.
H
Toggle between hexadecimal and decimal display.
H
Use the Transport Stream PID drop-down list to select a PID and navigate to
the selected PID using the Next button.
Header, Extension and Hex Displays
Header Display Window
The header display window shows the current header and related information for
the selected node in a read-only mode. The fields are interpreted and displayed.
The header is not displayed syntactically. Wherever field codes represent specific
values, the corresponding value is shown rather than the code itself. For
example, in a video sequence, although Chroma format is a two-bit code, it is
displayed with the interpreted value of 4:2:0 or 4:2:2 or 4:4:4.
You can view field values in decimal or hexadecimal format by clicking the
appropriate icon on the toolbar. One bit fields are displayed using one of three
icons:
Table 5- 3: Header icons
Icon
Field value representation
One-bit field was set to 1
One-bit field was set to 0
One-bit field is not applicable here
5- 10
MTS400 Series MPEG Test System User Manual
ES Analyzer - Getting Started
Almost all MPEG headers allow stuffing bytes and have marker and unused bits
defined in their syntax. Although all these are parsed and checked for correctness, they are not displayed since they do not provide any meaningful information.
Wherever appropriate, ES Analyzer provides visual feedback, by the use of color,
to represent different states.
Extension Displays
Besides this generic structure, individual headers may have special displays. For
example, the video sequence header has a lot of information to be displayed in a
small area. This is achieved by using tabbed folders for all the MPEG-2
extensions (see the following illustration). The tab corresponding to an extension
is disabled if the corresponding extension does not appear in the sequence
header.
When an extension appears in the video sequence, its presence is also communicated by the changed color of text (in red) on the corresponding tab.
Hex Display Window
The hex display window shows a hexadecimal dump of header bytes contained
in the header being currently displayed in the header fields display window. This
is useful if you are used to viewing the headers in the hexadecimal format rather
than the interpreted format that is displayed in the header display window. Also
able to be displayed are sequence information at VES level and frame information at GOP level (as shown below).
Go to field
Find field
The data collection for the hex display window can sometimes be memory
intensive and can affect ES Analyzer’s performance. You can turn on the hex
display or turn it off according to your requirements by checking or clearing the
MTS400 Series MPEG Test System User Manual
5- 11
Test Equipment Depot - 800.517.8431 - 99 Washington Street Melrose, MA 02176 - FAX 781.665.0780 - TestEquipmentDepot.com
ES Analyzer - Getting Started
check box next to Hex Window in the Open dialog box. If you have not enabled
the Hex Window option when opening a stream, you will be unable to open it
when ES Analyzer is parsing the stream. However, you can dynamically turn off
the Hex Window, whenever you want, by clicking the Show/Hide Hex Viewer
icon
on the toolbar if you enabled it when you opened the stream (see details
in the Opening an MPEG Stream section).
The hex window displays a hyphen (-) after every eight bytes for display
purposes. The status bar in the hex window displays the current cursor position’s
byte offset from the start of the header. If you select a sequence of bytes in the
hex window, the size and the byte offset from the start of the selection appears in
the status bar when you release the mouse button.
To search for a specific byte pattern in the Hex Window.
1. Type the pattern in the Find field, on the left of the Find button, on the status
bar.
2. Click the Find button.
The specific pattern will be searched from the current cursor position. If the
pattern is found, it is highlighted in the hex window. If the pattern is not
found, you will hear a beep. The search loops back to the beginning of the
file and subsequent occurrences of a pattern can be found by clicking the
Find button.
To position the cursor to a specific byte location from the start of the packet
header.
1. Type the byte position in the Goto field, on the left of the Goto button, on
the status bar.
2. Click the Goto button.
You will be positioned to the corresponding byte location in the header in the
hex display window.
5- 12
MTS400 Series MPEG Test System User Manual
ES Analyzer - Getting Started
Summary of Displayed Information (Header and Hex displays). Table 5--4 summarizes the information displayed in the hex window that corresponds to the
information displayed in the header display window.
Table 5- 4: Hex Headers Display
Header display window information
Hex dump in the hex display window
Transport packet header.
Header data of the current packet.
PES Header.
Header data of the current packet.
MPEG-2 Program stream - Pack Header.
Header data of the current packet.
MPEG-1 System Stream - Pack Header.
Header data of the current packet.
Video stream - Sequence header / sequence
extension.
All the video level information which is above
the GOP level.
Video stream - When viewing picture at
Picture or Slice level display (with video
analysis setting set to Macroblock level).
All the information for the currently selected
picture. When the first picture is selected in
the picture slider, data corresponding to the
GOP header (if available) along with first
picture data appears. For all pictures other
than the first picture in the GOP, only picture
data is shown. The subsequently read
sequence header and extension data is
updated in VES node.
Video stream - Hex data display when viewing
picture at Slice level display (with video
analysis setting set to Picture level).
Same as above.
Video stream - Hex data display when viewing
picture in Picture display form (with video
analysis setting set to Picture level).
Same as above, but with the following
exception.
Audio Stream
Both frame header and audio data is shown.
MTS400 Series MPEG Test System User Manual
Picture data includes only picture header and
extension data. No slice or macroblock level
data is shown. However, when you go down to
the slice level display by clicking the Slices
button, ES Analyzer appends slice and
macroblock data in the current picture data for
the hex viewer. When you return to the Picture
display dialog, ES Analyzer continues to show
the complete picture data. The pictures for
which you do not step down to the slice level,
you’ll still be shown picture data that includes
only the picture header and extension data.
5- 13
Error Testing Methods and Outputs
ES Analyzer can error check an entire stream in an automated manner (regression test). Part of a stream, triggered from a node for a specific program, can be
manually checked (run though mode).
Regardless of the stream type, testing is only possible at the compression layer;
it is the task of TS Analyzer and PES Analyzer to test at the systems
layer. However, you can still view the headers of the transport and PES packets,
but note that no tests are performed (either run-through or regression).
Both test modes will produce screen or file output error messages. Manual test is
also possible by examining the various block/slice/vector and picture display
menu screens.
Error filters can be applied to the tests, and fields selected to allow diagnostics
up to the error point to be dumped in a file for ‘pre error point’ analysis.
MTS400 Series MPEG Test System User Manual
5- 15
ES Analyzer - Error Testing Methods and Outputs
Run Through Stream Test Mode
This is operated by highlighting the test node - usually the GOP filmstrip icon of the appropriate program, then clicking on the Start/Stop (green ball) in the top
toolbar.
The stream will be run though and errors reported in the error display window.
Error Display Window
The error display window displays information, warning and error messages
generated by the run-through test mode for a specific program node.
For each message, the following are shown:
H
An associated icon that indicates the kind of message (the icons E, I, and S
shown below indicate a syntactic error, information, and a semantic error,
respectively):
where:
E = protocol syntax (Rules) error.
S = semantic-parameter or data range error.
I = Information only; not an error.
Both E and S should be regarded as errors.
H
A string that identifies the exact location in the bit stream where the error
was encountered; the format of the string is:
(STREAMTYPE) -> (STREAMTYPE, STREAMID) ->
(NODE) (packetNumber)
For example, the following string identifies an error in packet number 2 of
the MPEG 1 audio stream on PID 210:
TPT->PES(PID=210), MPEG 1 Audio->AES0(2)
H
The message string associated with the message.
Double-clicking a message in the error display window lets you view more
detailed information about the message.
5- 16
MTS400 Series MPEG Test System User Manual
ES Analyzer - Error Testing Methods and Outputs
Error Filtering
Configuring and Filtering
Messages for Display
You can configure and filter the kinds of messages you want ES Analyzer to
report. You can turn on/off messages of any type (Information, Errors, Semantic
checks) to be reported for the entire stream, or any node in the stream hierarchy
displayed in the tree view. You can also store the displayed messages in a file or
clear the message window.
To configure messages:
1. Click the right mouse button anywhere in the error display window.
2. Select Filter Messages from the context menu that appears:
The Filter Message dialog is displayed. The dialog box contains two tabbed
pages: Global and Node.
MTS400 Series MPEG Test System User Manual
5- 17
ES Analyzer - Error Testing Methods and Outputs
Message Filtering - Global. The Global Message Filter tab provides settings that
can be used to select which messages are enabled and disabled and how many
times enabled messages are to be displayed. The rules created are global; that is,
they will be applied to all nodes in the active stream. Rules to be applied to a
single node (such as PSI, PES, VES) can be added from the Node tab.
The top half of the Global tab contains:
H
A drop-down list from which the category of messages can be selected to
which rules are to be applied, and
H
Three options for the display of messages.
As rules are created using these fields, they should be added to the Rules text
field below by selecting the Add Rule button.
5- 18
MTS400 Series MPEG Test System User Manual
ES Analyzer - Error Testing Methods and Outputs
The three options are as follows:
H
Disable all messages on the basis of severity, that is, Info (I), Semantic (S) or
Error (E).
Enable the Disable Messages(s) of checkbox, select the type of message to
be disabled and press the Add Rule button. Note that the rule is added in the
Rules text field.
H
Disable messages on the basis of message number.
Each message is assigned a unique number based on the type of streams it is
related to; a tooltip will be displayed when the cursor is passed over the
message number. Enable the Disable message Number(s) checkbox, select
MTS400 Series MPEG Test System User Manual
5- 19
ES Analyzer - Error Testing Methods and Outputs
the message numbers to be disabled and press the Add Rule button. The
Shift and Control keys can be used to make multiple selections. Note that the
rule is added in the Rules text field.
H
5- 20
Report repeated messages only a specified number of times.
Enable the Report Message Number(s) checkbox and select the message
numbers to be disabled. The Shift and Control keys can be used to make
multiple selections. Select the maximum number of times that the message is
to be reported and press the Add Rule button. Note that the rule is added in
the Rules text field.
MTS400 Series MPEG Test System User Manual
ES Analyzer - Error Testing Methods and Outputs
Combinations of message rules can be created; they will need to be created and
added one at a time.
Rules can be removed individually (Remove Rule button) or globally (Remove
All button). Rules that are already set cannot be edited; they must be removed
and recreated.
Rule sets can be saved and reloaded as required using the Save Rules… and
Load Rules… buttons.
Message Filtering - Node.
1. Select a stream in the left scroll window and then select the types of
messages you want to be filtered out. By default, all messages are displayed
for a stream.
H
If you want your message filter(s) to be applicable to all streams opened
until now, select it for the entire World. This option will apply the
filter(s) to all nodes displayed in the tree view window.
MTS400 Series MPEG Test System User Manual
5- 21
ES Analyzer - Error Testing Methods and Outputs
H
If you want your message filter to be applicable to all streams, irrespective of whether they are opened or not, click the Set for all Streams
button.
2. Click OK to accept to changes; Cancel to close the dialog box without
applying the changes.
To store the displayed
messages:
1. Click the right mouse button anywhere in the error display window.
2. Select Dump To File from the menu that appears.
3. The Dump Message dialog box is displayed. Enter the name of the file in
which you want to store the messages.
4. Click the Save button when done.
To clear the windows
1. Click the right mouse button anywhere in the error display window.
2. Select Clear Log Window from the menu that appears.
5- 22
MTS400 Series MPEG Test System User Manual
ES Analyzer - Error Testing Methods and Outputs
Status Bar
During regression and run-through mode, progress through the stream is
indicated by the status bar at the bottom of the main window. The status bar is
split into multiple fields and displays the following:
H
A progress bar indicates the approximate byte position in the file for the
currently selected stream.
NOTE. Since you can view each embedded stream inside a multiplexed stream
independently, it is possible that in each embedded stream you may be viewing
packets which are far apart in the stream. In such cases, the file pointer will be
at different positions for each embedded stream and the file progress bar is
updated according to the stream being currently viewed. In addition, the byte
offset in the file for the currently displayed unit of data is also displayed in the
status bar. For example, when you are viewing a Packetized Elementary Stream
(PES), the byte offset of the first byte of the start-code of the currently viewed
packet in the opened file is displayed in the status bar. Similarly, when viewing a
GOP in a Video stream that is embedded in a Transport stream, the byte offset of
the start code of the corresponding GOP in the file is displayed in the status bar.
More details are given with the explanation of status bar with each individual
stream.
H
Characteristics of the stream being currently viewed. These vary with the
stream and are described in detail for each stream in subsequent chapters in
this book.
H
The state of the status bar display can be toggled by selecting/deselecting the
Status Bar command on the View menu; that is, View > Status Bar.
MTS400 Series MPEG Test System User Manual
5- 23
ES Analyzer - Error Testing Methods and Outputs
Regression Testing and Error Log Files
With ES Analyzer, you can regression test MPEG streams (with errors being
saved to log files) and save data from selected fields to report files for viewing
later (see the section Reviewing a Report for details).
Regression Test Window
To perform a regression test, close the file, if it is open, using the File menu.
Select File > New Regression Script…. Note that disk drive icons are displayed
on the right side of the directory window; you may need to scroll right to
view/access them.
Double-click on the file you require and it should appear in the lower window
Streams Selected for Regression with an orange question mark to the left of the
file name.
When regression is done, this will turn to a red or green ball, depending on the
errors found. A default log file name is entered; it can be renamed by clicking on
the double-arrow button to the right of the name. After regression testing, the log
file can be viewed by double-clicking on the log file name.
Error messages written to the log file can be controlled via the Message Settings
screen.
5- 24
MTS400 Series MPEG Test System User Manual
ES Analyzer - Error Testing Methods and Outputs
The button View Reports is only available to show dump/.dat files if they have
been set up beforehand (see Select Fields and Reviewing a Report sections).
Setting up the Regression
You can select multiple streams for regression from the displayed list of files.
(To select multiple files, double-click a file or select it and then drag-and-drop it
in the lower window.) The streams selected for regression appear in the lower
window.
For each stream, the following are displayed:
H
File name.
H
Default log file where the messages for the stream will go. You can change
this by clicking the icon displayed next to the log file name. ES Analyzer
displays a default directory where all log files are created that store the
results of the regression. You can change the directory for storing log files by
clicking the Default Dir… button.
H
The stream type. Initially this is not known and is set to Unknown. Once the
regression is complete, this is updated to reflect the type of stream that the
file contains.
H
An icon indicating the state of the stream. Initially, when a file is selected,
the icon appears as a question mark indicating an unknown status. After the
stream is regression tested, the icon changes to red if the regression reported
errors, or changes to green if there were no errors.
MTS400 Series MPEG Test System User Manual
5- 25
ES Analyzer - Error Testing Methods and Outputs
For a regression test, you can also select embedded streams that correspond to
nodes in the tree view for a stream hierarchy. You can do this by clicking the
Streams Option button in the regression test window; see Reviewing a Report
below. This displays the settings for the current stream. By default, the tests are
enabled for all types of streams, which you can disable. Saving a regression
script also saves these settings.
Running the Regression
Once you have set up a regression script, you can run it by clicking the Start
Regression button. A status window displays the continuous status of the
regression. If you want, you can cancel the regression anytime by clicking the
Cancel Regression button in the status window. When the regression is complete,
the state of the regression run on each stream is displayed in a dialog box
through the changed icon which is red (for failure) or green (for success), and the
updated file type. The icon remains a question mark if the file was not a valid
MPEG file.
Viewing and Saving
Results
You can view the error log file created for any stream after it has been regression
tested by double-clicking the specific bit stream file in the regression test dialog
box. You will need to associate files of the type *.log with a text editor of your
choice. You may do so through the Explorer. Click View > Options to display the
Options dialog, and then click the File Types tab. By default, ES Analyzer opens
the log files with the application with which they are currently associated.
You can save the regression script and the results in a regression script. To save
the file, choose Save As from the File menu. The file is saved as a binary file and
also saves the regression results. You can reload the regression file including the
results of the last regression whenever you want. Regression can also be run on a
previously saved regression script file.
Message Settings
5- 26
Messages sent to the log file can be controlled through the Message Settings
dialog box. Rules to be applied to messages can be created as required. The
operation of this dialog box is similar to Message Filtering as described on
page 5--17.
MTS400 Series MPEG Test System User Manual
ES Analyzer - Error Testing Methods and Outputs
Reports and Field Selection
You can save and review reports consisting of field value dumps of specific
fields when you regression test a stream. To review a report, it must first be
created by selecting the fields to be viewed, then setting up and running the
regression, and finally selecting the View Reports button (it is also possible to
select and open multiple reports).
Creating a Report
A regression report is packet-by-packet details listed with information fields you
can choose. A report is not an error list, although errors detected may appear in
it. A report can be used to examine run-ups to problems (pre-trigger).
Before starting a regression test, select the Stream Options button in the
Regression test window. Ensure that the Dump Fields check-box is enabled and
select the adjacent Select… button. You can then add the fields to be listed in the
dump file columns (individual fields or all fields).
You can check the dump in file box and name your dat file or use the default
VES.dat or AES.dat.
Do this for video & audio elementary streams.
To select fields.
1. Click the Stream Options button in the regression test window to display the
following screen.
2. Enable and disable the streams using the checkboxes in the Analyze column.
MTS400 Series MPEG Test System User Manual
5- 27
ES Analyzer - Error Testing Methods and Outputs
Deselect the streams you don’t want ES Analyzer to analyze. By default, all
the streams are selected.
3. If you want to analyze Video Elementary Streams, you may either select
Macroblock Level or Picture Level from the adjacent drop-down list.
4. Select the streams for which you want to dump data by enabling the
checkbox under the Dump Fields column.
5. Click the highlighted Select… button to display the Select Fields dialog box.
6. Finalize the list of names by adding/deleting the field names in the Fields
Included list box and click OK.
You may also double-click a field name displayed in the left list box to
include it in the right list box.
H
5- 28
If you have selected a video elementary stream, ES Analyzer also displays
options in the Select Fields dialog box.
MTS400 Series MPEG Test System User Manual
ES Analyzer - Error Testing Methods and Outputs
You may click the appropriate buttons to select fields specific to these options.
This is a quick way to add/delete specific fields into the Fields Included list box;
otherwise, you will need to manually find and add fields from the Fields
Excluded list box.
For example, if you have added all the fields from the Fields Excluded list box,
and now want to delete VES-related fields from the Fields Included list box, you
may click the Delete All button in the VES section. You can also click the Add
All button under Display Extension to add related fields to the Fields Included
list box.
7. Specify the file into which you want the fields to be dumped.
You may type the filename (*.dat) or select one by using the browse button
next to the default filename.
8. Specify the dump options.
If you select Part of Stream, the Maximum Size (MB) field is enabled and you’ll
need to specify the size of the stream from which the fields will be dumped.
Once you have specified the fields, return to the regression test window by
clicking the button next to the Stream Options button.
MTS400 Series MPEG Test System User Manual
5- 29
ES Analyzer - Error Testing Methods and Outputs
Reviewing a Report
A sample report looks like this:
Collecting Statistics for
“C:\mpegstreams\mls\bird4.mpg”
Date 04/02/98
Time: 16:38:42
Packet
No.
1
2
3
4
5
6
7
8
9
10
SCR
0
1083
2167
3250
4334
5417
6501
7585
8668
9752
Fixed
Flag
1
1
1
1
1
1
1
1
1
1
Audio
Bound
1
1
1
1
1
1
1
1
1
1
(Note that these ‘dump’ files have the default extension of .dat.)
Demultiplexing Transport Streams to PES or Elementary Output Files
It is possible to select a given stream node in navigation view (such as PES
video/audio) or VES audio/video (but NOT gop). The diskette icon will
highlight on top toolbar at the left when the function is available. Select the icon,
name the dump file and select it’s type if required. ES Analyzer will then create a
PES or elementary stream.
This stream can be loaded back into the ES Analyzer to be checked, and then it
can be used as input to Multiplexer application to create a transport
stream with SI/PSI to your specifications.
5- 30
MTS400 Series MPEG Test System User Manual
Working with Transport and PES Streams
Using Packet View
ES Analyzer displays transport packets in a specific way that is useful for
analyzing the Transport stream and also for quickly accessing a packet at
random.
The packet view window can be displayed by clicking the Show/Hide Packet
View icon on the toolbar. A window appears that shows a spectrum of the
packets in the order in which they appear in the transport stream. Each PID is
assigned a color and each packet is represented using a single line of the
corresponding color. By double-clicking the spectral line for any packet, you are
positioned to the corresponding packet in the main window of ES Analyzer.
Packet View communicates with ES Analyzer’s main window through OLE. You
can selectively turn on/off the display of spectral lines for any PID in the Packet
View by clicking the corresponding color index in the Packet View dialog. The
color index is also a toggle for display. You can also view distance graph
between packets of the same PID by just viewing spectral lines of the corresponding PID. To switch back to displaying all PIDs, double-click the All index
(represented by white color).
MTS400 Series MPEG Test System User Manual
5- 31
ES Analyzer - Working with Transport and PES Streams
NOTE. When you first open Packet View, it displays just the front page of the
stream, so that not all of the PID numbers present in the stream are displayed in
the button boxes below the main display. If you want to see them all, drag the
horizontal scroll bar pointer to the far right; all of the PID number buttons will
then be displayed (this could take a few seconds for large stream files).
Packet view does not operate when a program node is highlighted; it works in
all other nodes in navigation view.
Understanding PES
A Packetized Elementary Stream (PES) as the name suggests is composed of
contiguous packets of an elementary stream with packet headers, as shown in the
following illustration, prepended to the packet. A PES occurs only in MPEG-2
streams and its structure has been adapted from the packet structure of the
MPEG-1 System stream.
For more information on PES streams, refer to the ISO/IEC 13818-1 document.
An embedded stream is checked when you navigate through one; for details, see
the Navigating through Streams section in the Getting Started chapter.
5- 32
MTS400 Series MPEG Test System User Manual
ES Analyzer - Working with Transport and PES Streams
For PES streams, you can:
Explaining the Status Bar
Display
H
Run through the stream; see details in the Navigating through Streams
section in the Getting Started section.
H
View packet headers with their decoded fields.
H
View an embedded elementary stream.
H
View PES extension (if received).
The status bar, for PES streams, displays the following:
H
Packet number, which is the number of the current packet in the PES stream.
H
Byte offset in the file, which is the first byte of the Pack header being
currently viewed in both the hexadecimal and decimal formats.
MTS400 Series MPEG Test System User Manual
5- 33
Working with Video Streams
ES Analyzer performs detailed checks on MPEG Video streams. Video streams
are complex with an embedded hierarchy. Structurally, a Video stream consists of
a video sequence that has a start code, end code, sequence header, and any
number of group of pictures (GOP). Each GOP consists of a GOP header and a
group of pictures. Pictures may be of different types (I, B, or P). Pictures can
also be frame pictures that correspond to progressive video or field pictures that
correspond to interlaced video. Pictures are broken down into a slice structure
and each slice consists of macroblocks.
For more details, you may want to refer to the documents ISO/IEC 11171-2 and
ISO/IEC 13818-2 that describe the MPEG-1 and MPEG-2 video standards.
Using ES Analyzer, you can:
H
View the sequence header along with the extensions.
H
Navigate through a stream; see details in the Navigating through Streams,
page 5--9.
H
Run through a stream with the option of analyzing the stream at the picture
level or at the macroblock level.
When analyzing a group of picture, you can:
H
Randomly access any picture within the group.
H
View the picture type spectrum and picture size plots.
H
Zoom into any picture and see its details at the slice or macroblock levels, or
view the encoded picture. You may also use the video or picture player to
play the entire video and pause at any picture when you notice a degradation
in quality; you can then review the details of this picture down to the
macroblock level. ES Analyzer provides an easy mechanism to switch
between the Picture display and the data analysis display windows.
H
Select any macroblock and examine its detailed coding.
H
Perform picture quality analysis with special displays of quantizer scale
distribution, slice size distribution, macroblock-size spectrum and motion
vector plots.
H
Interpret any video descriptors received in the higher level streams and
validate them against the stream.
MTS400 Series MPEG Test System User Manual
5- 35
ES Analyzer - Working with Video Streams
When analysis with the DCT option is enabled, you can:
H
View 8x8 coefficients for all macroblocks within a picture.
H
View coefficient tables for y, cr, cb, luma and chroma pixel data.
Viewing the Sequence Header
The sequence header is interpreted and displayed as shown below.
NOTE. Placing the cursor over either Load Intro Quantizer Matrix or Load
Non-Intra Quantiser Matrix, displays the applicable quantizer matrix. The check
mark icon indicates that the matrix was received in this sequence header.
For MPEG-2 streams, an optional sequence extension and user data may also be
received. User data is displayed as a hex dump. If data is in the ASCII format,
the ASCII equivalent is displayed next to the hex dump.
The picture rate, chroma format, and the video type (NTSC/PAL/Unspecified,
etc.) appear in the status bar when the sequence headers are displayed.
5- 36
MTS400 Series MPEG Test System User Manual
ES Analyzer - Working with Video Streams
The information whether the stream is an MPEG-1 or an MPEG-2 stream is
displayed in the tree view window as a single numeral (1 or 2) on the node icons.
Within a sequence, you can view the GOPs by clicking on the GOP icon in the
left side hierarchy view of the stream. The GOP node appears below the
sequence header node.
Viewing the GOP and Picture Header
When displaying a GOP, ES Analyzer shows you a window with three tabs, as
shown below.
Briefly, the contents of each tab are explained below. For details, see the specific
sections: Displaying the GOP Header, Displaying the Slice and Macroblock, and
Using the Video Viewer for Picture Analysis.
The GOP tab displays the following:
H
GOP header data.
H
A slider for the pictures in the GOP. The slider can be used to randomly
access any picture within the GOP; the slider moves in steps of two to
facilitate working with large GOPs. The slider lists the pictures in the
received (decoding) order.
GOP position transport controls lie to the left of the slider bar
Using these controls, any picture can be selected within the GOP. The controls
include Start and End GOP controls and Next and Previous I frame jump
controls. Note that the I frame controls only works in streams where multiple I
frames are present between GOP sequence headers.
H
Picture header display for the picture selected in the slider.
H
Picture extensions (applicable only to MPEG-2).
MTS400 Series MPEG Test System User Manual
5- 37
ES Analyzer - Working with Video Streams
The Slice and MB tab:
H
Takes you inside a specific picture and provides detailed information down
to the macroblock level.
H
Allows you to generate picture quality plots.
H
Allows you to view a picture frame by frame and view macroblock level data
for a selected macroblock in the picture.
The Picture Player tab allows you to play and view the video output on your
screen.
NOTE. ES Analyzer synchronizes the picture being currently displayed by the
video viewer with the picture/data that is displayed on the other tabs: GOP And
Picture and Slice And MB. For example, if you select a macroblock and switch
from the picture display to the other picture-quality analysis tabs, the same
macroblock remains selected for easy identification.
As an aid to locating a stream, you can click on any open GOP icon in the tree
view to switch picture displays in the stream multiplex.
Displaying the GOP
Header
5- 38
The GOP header is an optional header and it is displayed, as shown below, when
received.
MTS400 Series MPEG Test System User Manual
ES Analyzer - Working with Video Streams
The lower part of the display also shows the picture extensions that have been
received.
Video Analysis Settings. Analysis of GOPs can be carried out at picture level or
macroblock level. This will affect the speed at which the ‘next GOP’ is analyzed.
The setting is selected from the Video Analysis Settings dialog.
Select Menu Bar > Settings > Video Analysis. The following dialog is displayed:
Picture level analysis provides faster analysis but error reporting at the macroblock level is suspended. Macroblock level analysis provides error reporting but
at the cost of analysis speed.
MTS400 Series MPEG Test System User Manual
5- 39
ES Analyzer - Working with Video Streams
Status Bar (in GOP mode). When ES Analyzer displays the GOP and picture
headers, the status bar, as shown below, displays the:
H
Picture rate
H
Chroma format
H
Video Type (NTSC/PAL/Unspecified etc.)
H
GOP number of the current GOP
H
Picture number of the currently selected picture, relative to the current GOP
(the first picture is given the offset 0.)
H
Picture display number, which gives the picture number in display order,
relative to the first GOP received. This represents the actual picture Display
number. It is calculated by adding the temporal reference of the current
picture to the cumulative picture display number prior to the GOP.
Displaying the Picture
Header
The GOP header tab has a slider for selecting the picture whose details you want
to display. The header for the selected picture is displayed below the GOP header
in the same dialog box as shown in the earlier illustration.
Displaying the Picture
Extension
For MPEG-2, several picture extensions may be received. The picture coding
extension is always displayed, while the other picture extensions are displayed
on tabbed folders, as shown below. The tabs for each of these extensions are
enabled and the text on the tab appears in red, only if the corresponding
extension is received in the stream.
All tabs with red text represent extensions that have been received for the current
picture. The next section describes each extension and its interpretation.
5- 40
MTS400 Series MPEG Test System User Manual
ES Analyzer - Working with Video Streams
Explaining the Picture Extensions.
QME
This allows the quantizer matrices to be down(Quantizer Matrix Extension) loaded for any picture.
At most four matrices can be downloaded,
namely, intra-quantizer matrix; non-intra-quantizer matrix, chroma intra-quantizer matrix, and
chroma non-intra-quantizer matrix.
The QME tab displays through a check mark
the matrices that were downloaded. A downloaded matrix is displayed when you move the
mouse over the name of the specific matrix.
CE
(Copyright Extension)
This indicates any copyrights on the video. The
copyright field is interpreted and displayed.
PDE
(Picture Display Extension)
This extension gives display extensions for
MPEG-2 video.
PSSE
(Picture Spatial Scaleable
Extension)
This is received when the spatial scalability of
MPEG-2 video is used in the video stream.
PTSE
(Picture Temporal Scaleable
Extension)
This extension is received when the temporal
scalability of MPEG-2 video is used in the video stream.
UD
(User Data)
This displays any user data associated with the
picture in hexadecimal format. If the data represents ASCII text, the ASCII text is also interpreted and displayed.
CPE
(Camera Picture Extension)
NOTE. These tabs will only operate if the appropriate extensions are present
within the stream under test.
All four matrices will only display if they are downloaded with certain stream
types for example, HDTV streams.
- indicates that only the default matrix will be displayed.
MTS400 Series MPEG Test System User Manual
5- 41
ES Analyzer - Working with Video Streams
Displaying the Slice and Macroblock
ES Analyzer allows you to take a microscopic view of a picture by letting you
view the picture’s slice and macroblock structure.
To view slice details of
any picture:
1. Select the picture by using the picture slider on the GOP And Picture tab.
2. Click the Slice and MB tab.
The macroblocks for the selected picture are displayed as shown below:
The Slice dialog box graphically displays the slices and macroblocks in the
picture and also displays the:
5- 42
H
Slice header for the selected slice.
H
Macroblock details for the selected macroblock.
H
Picture Quality data, which overlaps the slice display area.
H
Decoded field/frame for the selected picture.
MTS400 Series MPEG Test System User Manual
ES Analyzer - Working with Video Streams
Explaining the Slice and
Macroblock Display
When displaying the slices, the current picture is represented by its constituent
slices; see the above illustration. You can move the mouse to any slice and select
it using the left mouse-button. The slice header display shows the header for the
currently selected slice. MPEG-1 slices can span multiple rows and the display
shows the same.
Slice display is color coded. Intra-slices are shown in green color, while slices
that do not have this flag set are displayed in gray color.
Within a slice, the macroblocks are also shown. You can select a macroblock in
the slice using the left mouse-button. The header and information of the currently
selected macroblock is displayed below the macroblock display. Skipped
macroblocks in a slice are shown using a different color and cannot be selected.
When viewing the slice display, you can move forward to the next picture or
backward to the previous picture. You do this by clicking the picture navigation
buttons on the top right corner of the dialog box. You can also return to the GOP
display and select a specific picture. When moving backwards, you cannot cross
the GOP boundary; however, when moving forward, you can cross a GOP
boundary.
When displaying macroblocks, the status bar looks like this:
Viewing Coded Block
Patterns for a Macroblock
While in the slice and macroblock level display, you can view the coded block
pattern for any macroblock (except for the skipped macroblocks). This is
displayed in the last field (CBP) as shown below.
Depending on the chroma format, the coded block pattern is displayed as a
sequence of 6, 8, or 12 bits. From left to right, the bit pattern represents the
blocks in the macroblock as they are numbered in the standard MPEG specifications. For more details, see the ISO/IEC 11172-3 and ISO/IEC 11318-3
documents.
MTS400 Series MPEG Test System User Manual
5- 43
ES Analyzer - Working with Video Streams
Analyzing Picture Quality
Viewing the Macroblock
Size Spectrum
The Macroblock Size Display provides a color-mapped two-dimensional
graphical plot of the macroblock size and type distribution in a picture; it is
plotted as an overlay on the slice display area. This plot can be viewed by
clicking on the MB Size Display button in the Slice and MB tab. The types of all
macroblocks in the picture are color-mapped; a key is shown at the right side of
the display and described below (see Macroblock Colors). Skipped macroblocks
are displayed in dark green. The macroblock size for the selected macroblock is
displayed in the macroblock field display area below it.
Macroblock Colors. The color-coded macroblock type represents the prediction
type employed.
5- 44
Field Based
Predictions are made independently for each field by using
data from one or more previously decoded fields.
Frame Based
Predictions are made for the frame using the data from one or
more previously decoded frames.
MTS400 Series MPEG Test System User Manual
ES Analyzer - Working with Video Streams
16 x 8 MC
(16 x 8 motion compensation) In which two motion vectors are
used for each macroblock. The first motion vector is used for
the upper 16x8 region, the second for the lower 16x8 region. In
the case of a bi-directionally predicted macroblock a total of
four motion vectors will be used since there will be two for
forward prediction and two for the backward prediction. 16x8
MC is only used with field pictures.
Dual Prima
Only one motion vector is encoded (in its full format) in the bit
stream together with a small differential motion vector. In the
case of field pictures, two motion vectors are then derived
from this information. These are used to form prediction from
two reference fields (one top, one bottom) which are averaged
to form the final prediction. In the case of frame pictures, this
process is repeated for the two fields so that a total of four field
predictions are made. This mode is only used in P-pictures
where there are no B-pictures between the predicted and
reference fields or frames.
NA
Not Applicable - Refers to the instances where there is no
prediction in the macroblock.
(For more detailed information, refer to ISO/IEC 13818-2 : 1996, Information
Technology - Generic coding of moving pictures and associated audio information, Part 2 Video.)
Viewing the Quantizer
Scale Distribution
Quantizer scale distribution for the macroblocks in a picture is plotted where the
picture slice is displayed. This gives you a graphical view of the scale code
distribution and lets you visually check any obvious scale code problems. This
plot can be viewed by clicking on the Q-Scale Code Display button in the Slices
dialog box. The scale codes of 1 through 31 are mapped to shades of green with
1 being mapped to the lightest shade and 31 to the darkest (black). Skipped
macroblocks use the same scheme but are mapped in shades of gray. The value
of the scale code for the selected macroblock is displayed in the macroblock field
display area below it.
MTS400 Series MPEG Test System User Manual
5- 45
ES Analyzer - Working with Video Streams
Viewing the Motion Vector
Plots
ES Analyzer gives a detailed graphical display of motion vector for the selected
B or P picture. Both MPEG-1 and MPEG-2 type vectors are interpreted and
displayed.
To view motion vectors (applicable to only B or P pictures).
1. Position the cursor to the picture for which you want to see the slice size
plot.
2. Move into the slice display.
3. Click the Motion Vector Display button in the slice display dialog box.
For each macroblock, the motion vectors corresponding to it are plotted to scale
as a directed arrow. The direction of the arrow represents motion coding for the
macroblock from the reference frame to the current frame. Different types of
vectors are plotted in different colors. You can also selectively choose to display
different motion vectors by using the buttons on the right.
5- 46
MTS400 Series MPEG Test System User Manual
ES Analyzer - Working with Video Streams
FF
Forward Frame
BF
Backward Frame
FTF
Forward Top Field
BTF
Backward Top Field
FBF
Forward Bottom Field
BBF
Backward Bottom Field
DTF
DMV Top Field
DBF
DMV Bottom Field
If a button is grayed out, the associated vector is not currently available.
The motion vectors are plotted for the luminance blocks. They are to scale (in the
resolution of full pel or half pel) according to the pel resolution fields received.
For each macroblock, multiple vectors may be received. All or some of them
may be displayed simultaneously.
When Tooltips are enabled, a summary of parameters is displayed in a popup
window.
For MPEG-1 that has only frame pictures, two kinds of motion vectors are
applicable -forward frame (for P and B pictures) and backward frame (for B
pictures).
For MPEG-2 video, additional vectors may also be coded, which are: forward
frame (for P and B pictures), backward frame (for B pictures), forward top field,
backward top field, forward bottom field, backward bottom field, dual prime top
field, dual prime bottom field.
ES Analyzer interprets all the above vectors and lets you view them graphically.
When motion vectors cross the picture boundary, an error condition occurs and
the same is reported in the error log window. In this case, the vector is drawn
until the edge of the picture display.
MTS400 Series MPEG Test System User Manual
5- 47
ES Analyzer - Working with Video Streams
Reviewing the Decoded
Picture
ES Analyzer decodes and displays the selected picture when you click the Picture
Display button. You can view I, B, or P frames or fields (only for MPEG-2).
ES Analyzer also allows you to view the previous and the next decoded picture
(whether frame or field) by clicking the appropriate buttons. The actual size of
the picture is displayed and if the picture is larger than the picture display area,
scroll bars will appear. For the current picture being viewed, you can select a
macroblock by clicking the left mouse button anywhere in the picture display
area. When you do so, the slice and macroblock area below the picture displays
the slice and MB data for the currently selected macroblock. If Tooltips are
selected, a summary of the macroblock information is displayed in a popup box.
When you switch from the picture display to the other picture-quality analysis
tabs (e.g., MB Size Display, Q-Scale Code Display or Slice Display), the same
macroblock remains selected for easy identification.
You can also enable a macroblock grid on the displayed picture by using the
Show Grid button to easily identify and select macroblocks.
5- 48
MTS400 Series MPEG Test System User Manual
ES Analyzer - Working with Video Streams
The picture display has the following limitations:
H
When you navigate to a specific GOP using the toolbar icon, the picture
display may be unable to display some B pictures correctly. These pictures
are those that use a frame from the previous GOP for reference. This happens
only when you navigate to a GOP that is not a closed GOP.
H
For MPEG-2 scaleable streams, you will be able to display pictures only
from the base layer. Other extension layer data cannot be displayed using
ES Analyzer.
H
ES Analyzer currently displays and decodes video streams within the
following MPEG-2 profiles:
H
Main Profile @ High Level (MP@HL)
H
Main Profile @ Main Level (MP@ML)
H
4:2:2 Profile @ Main Level (4:2:2P@ML)
MTS400 Series MPEG Test System User Manual
5- 49
ES Analyzer - Working with Video Streams
Viewing the Decoded Picture with Motion Vector Plots. The decoded picture can be
further enhanced with an overlay of motion vector plots. The interpretation of the
display corresponds with the description in the previous section - Viewing the
Motion Vector Plots.
To view the vector plots for the currently displayed picture:
H
Select the Show MV button on the right side of the picture.
H
The vectors displayed will depend upon the selections made from the
remaining buttons on the right side of the screen.
The picture display has the following limitations:
5- 50
H
When navigating to a specific GOP using the toolbar icon, the picture
display may be unable to display some B pictures correctly. These pictures
are those that use a frame from the previous GOP for reference. This happens
only when you navigate to a GOP that is not a closed GOP.
H
For MPEG2 scaleable streams, you will be able to display pictures only from
the base layer. Other extension layer data cannot be displayed using ES
Analyzer.
MTS400 Series MPEG Test System User Manual
ES Analyzer - Working with Video Streams
H
For MPEG2 streams, ES Analyzer currently displays and decodes only
decodes MP@HL, MP@ML, and 4:2:2 video streams.
NOTE. Make sure that your monitor’s Display Properties is set to either 24 or
32-bit true color; otherwise, you may find a distortion in the colors in the picture
being displayed.
Displaying DCT Coefficients. The Discrete Cosine Transformation matrix of each
block in a selected macroblock can be seen by selecting Settings > DCT Display
from the Menu Bar. The DCT Display option is available only when viewing the
details of GOP in Video Stream Analysis. Enabling the DCT Display option will
enable Show DCT button next to the displayed picture in Slice & Macroblock
Tab, Picture View Mode.
MTS400 Series MPEG Test System User Manual
5- 51
ES Analyzer - Working with Video Streams
The Show DCT button is used to toggle the DCT Coefficients display. To view
the DCT values of the a macroblock, select the macroblock; a window containing details of coded and decoded DCT values will be displayed.
Note that the luma (y) control has four selections (0, 1, 2 and 3) which correspond to an 8x8 pixel corner of the 16x16 pixel selected macroblock. Chroma
sub-sampling (Cb and Cr) will display matrices for the color differences between
frames.
The picture display has the following limitations:
5- 52
H
When navigating to a specific GOP using the toolbar icon, the picture
display may be unable to display some B pictures correctly. These pictures
are those that use a frame from the previous GOP for reference. This happens
only when you navigate to a GOP that is not a closed GOP.
H
For MPEG2 scaleable streams, you will be able to display pictures only from
the base layer. Other extension layer data cannot be displayed using ES
Analyzer.
H
For MPEG2 streams, ES Analyzer currently displays and decodes only
decodes MP@HL, MP@ML, and 4:2:2 video streams.
MTS400 Series MPEG Test System User Manual
ES Analyzer - Working with Video Streams
DCT Value Display - Version Changes. The diagram below shows the monitoring
points in the analysis process for the DCT values. The diagram also indicates the
changes that occurred between ES Analyzer, Version 1.5 (MPEG Test System,
Versions 6.4 and 6.4.2) and ES Analyzer, Version 1.6 (MPEG Test System,
Version 6.5). The “windows” referred to are those in the DCT Values window.
Configuring Video
Analysis Settings
The video analysis or picture analysis default settings can be set as required.
NOTE. The selected Video Analysis settings will not affect analysis on either the
Slice and Macroblock or the Picture Player pages. On the Slice and Macroblock
page, analysis is always at the macroblock level. On the Picture Player page,
analysis is always at the picture level.
MTS400 Series MPEG Test System User Manual
5- 53
ES Analyzer - Working with Video Streams
Video Analysis Settings. Select Settings > Video Analysis… from the Menu Bar.
The following dialog box is displayed:
Select Picture level analysis to view frames quickly.
Select Macroblock level analysis if pictures/frames are to be analyzed at the
macroblock level.
When Macroblock level analysis is enabled, select the shading scheme required.
Picture Display Settings. A number of display and vector parameters are set from
the Picture Display Settings dialog.
Select Settings > Picture Display… from the Menu Bar. The following dialog is
displayed:
5- 54
MTS400 Series MPEG Test System User Manual
ES Analyzer - Working with Video Streams
Display Order of Pictures
Select Presentation Order or Decoding order
Motion Vector Overlay Colour Section
White: All vectors will be displayed in white.
Black: All vectors will be displayed in black.
Vector Dependent: Colors will correspond to the
vector selection button colors.
Background Dependent: Colors are combined with
picture background to provide a contrast.
Viewing the Slice Size
Distribution
For any picture, you can also view the slice size distribution.
To view the plot.
1. Position the cursor to the picture for which you want to see the slice size plot
on the GOP And Picture tab.
2. Move into the slices display by clicking the Slice and MB tab.
3. Click the Show Slice Size Statistics icon
NOTE. The Show Slice Size Statistics icon
the Slice and MB tab.
on the toolbar.
is grayed out on all tabs except
The plot appears in another window.
MTS400 Series MPEG Test System User Manual
5- 55
ES Analyzer - Working with Video Streams
Viewing the Frame Size
Spectrum
You can view the picture spectrum for a GOP and the frame size plots.
To view the plot..
1. Display the GOP for which you want to see the Frame Size Spectrum plot.
2. Click the Show Frame Size Statistics icon
on the toolbar.
The following plot is displayed. Each bar represents the frame size in kilobytes:
Selecting the Show Data Distribution button will further enhance the plot by
showing the content of each frame.
Content is color-coded as shown by the key in the bottom left corner. Details of
the content of each frame are displayed when the cursor is moved over a frame.
5- 56
MTS400 Series MPEG Test System User Manual
ES Analyzer - Working with Video Streams
Using the Video Viewer for Picture Analysis
The video viewer (or Picture Player) allows you to play a video stream and
display the decoded picture on the screen. The picture player playback speed
may vary from real time according to the ES Analyzer processor speed. You may
also notice certain pauses in the display at regular intervals. These pauses occur
at GOP boundaries. The Remote Control (described below) allows you to pause
and resume the display at any frame. You can also restart the display from the
beginning of the current GOP, or from the start of the video sequence.
The number of the current picture and the number of the last decoded picture are
displayed, as shown in the following illustration. Here is a typical sequence of
steps in which you may use the video viewer:
1. Open the video stream you want to analyze.
2. Start the video viewer.
3. Monitor the displayed picture for quality problems.
4. Pause the player whenever you notice a problem in a picture, such as a
degradation in quality. The player is intentionally made to play at a speed
slower than the regular play speed to allow you to stop at specific frames.
MTS400 Series MPEG Test System User Manual
5- 57
ES Analyzer - Working with Video Streams
5. Switch to the analysis tabs to view details of the currently displayed picture
down to the macroblock level.
6. Step forward or backward in decode order in the Slice And MB tab, or
switch back to the video viewer and resume play.
ES Analyzer synchronizes the picture being currently displayed by the video
viewer with the picture/data that is displayed on the other tabs: GOP And Picture
and Slice And MB. This means that:
H
The GOP And Picture and Slice And MB tabs always display data for the
same picture.
H
When you switch from the video viewer to either the GOP And Picture or
the Slice And MB tab, you are presented the data for the picture being
displayed on the Picture Player tab.
H
When you switch from the GOP And Picture or the Slice And MB tab to the
Picture Player tab, the video viewer presents the picture for the data being
displayed on the GOP And Picture or the Slice And MB tab.
H
If you select a macroblock and switch to the picture-quality analysis tabs
(such as MB Size Display, Q-Scale Code Display or Slice Display), you will
find that the same macroblock remains selected for easy identification.
The video viewer, however, has the following limitations:
5- 58
H
When you navigate to a specific GOP using the toolbar icon, the picture
display may be unable to display some B pictures correctly. These pictures
are those that use a frame from the previous GOP for reference. This happens
only when you navigate to a GOP that is not a closed GOP.
H
For MPEG-2 scaleable streams, you will be able to display pictures only
from the base layer. Other extension layer data cannot be displayed using
ES Analyzer.
H
ES Analyzer currently displays and decodes video streams within the
following MPEG-2 profiles:
H
Main Profile @ High Level (MP@HL)
H
Main Profile @ Main Level (MP@ML)
H
4:2:2 Profile @ Main Level (4:2:2P@ML)
MTS400 Series MPEG Test System User Manual
ES Analyzer - Working with Video Streams
Picture Player Remote
Control
The Remote Control is displayed whenever the Picture Player tab is selected.
Play Video
Plays the video stream from where it
last stopped.
Stop
Stops the video stream and allows the
other analysis tabs to be selected.
Next Picture
Steps forward one frame.
Play from GOP Start
Plays the pictures from the start of the
current GOP.
Zoom/Restore Display
Enlarges and restores the area in
which the picture appears.
Fit Best in Display Area/
Fits picture in display area or displays
Display Picture at True Size picture at original size.
Left/Right Scroll
Scrolls the displayed picture left and
right.
Up/Down Scroll
Scrolls the displayed picture up and
down.
Show/Hide information
Shows or hides the information panel
for the displayed picture. The following information is displayed:
GOP Number - in which the frame is
present.
Coded Number - refers to the picture
number within the GOP.
Display Time - in hh:mm:ss:cc;
where cc is the display number in the
whole file.
Display Number - refers to the display number of a picture within the
GOP.
MTS400 Series MPEG Test System User Manual
5- 59
Working with Audio Streams
ES Analyzer analyzes both MPEG (-1 and -2) Audio streams and Dolby Digital
(AC-3) Audio streams.
Understanding MPEG Audio Streams
An MPEG audio stream consists of a sequence of audio frames. Audio data may
be received for multiple channels. Each channel is divided into sub-bands for
which data is transmitted.
ES Analyzer verifies audio streams according to the MPEG audio recommendations. Support for both MPEG Layer I and Layer II audio is available. MPEG-2
extensions for Layer I and II (surround and center channels, and low frequency
channels) are also interpreted and analyzed. Multi-lingual extensions in MPEG-2
are currently not analyzed. ES Analyzer is also unable to analyze the MPEG-2
Audio stream if the extension bit stream is present.
For a detailed discussion on the MPEG audio syntax, refer to ISO 11172-3 and
ISO 13818-3.
With ES Analyzer, you can:
H
Navigate to any audio frame; see details in the Navigating through Streams
section in the Getting Started chapter.
H
View frame details, including frame header, and plots of the frame data, as
shown in the following illustration.
H
Interpret and display audio descriptors received in higher level streams and
validate them against the stream.
H
Play an audio stream.
For each audio frame, data may be received for at most two channels, as shown
in the next illustration; additional channels may also be received in the MPEG-2
extension.
MTS400 Series MPEG Test System User Manual
5- 61
ES Analyzer - Working with Audio Streams
Audio Player
The Audio Player is available on MPEG-1, MPEG-2 and Dolby AC-3 streams
(and AAC as an option). With a suitable sound card installed in the host PC,
audio streams can be played.
NOTE. The speed and quality of playout, isnot high fidelity, but is sufficient to
allow an audio stream to be monitored for analysis.
WARNING. While an audio stream is playing, you cannot access any other
analyzer functions. In particular, do not close the Audio Player while an audio
stream is playing (especially in loop mode), because you will be unable to
reopen the player (and control the stream) until it has finished playing.
If more than one audio device is installed, a selection can be made from the
Device drop-down list.
The channels to be played can be selected from the Play Channels drop-down
list.
To open the Audio Player, select the player start button, which is
available on the audio stream header pages.
The Audio Player control panel is displayed:
The player controls follow the same convention as the Video Player controls:
Play
Stop
Fast forward
Fast rewind
5- 62
MTS400 Series MPEG Test System User Manual
ES Analyzer - Working with Audio Streams
(To use Fast Forward and Fast Rewind, press the required button and then stop
the action with the Stop button.)
The Audio Player display shows the following:
H
Play time
H
Stream Name and Audio PID number
H
Player status (Stop/Play)
The following controls are available in addition to those described in the
preceding list.
Toggles continuous (or looped) playout.
Toggles a real-time waveform display.
NOTE. Currently two channels are output to the sound card. These can be
assigned as required (as mono or stereo) from any of up to five channels in a
stream.
MTS400 Series MPEG Test System User Manual
5- 63
ES Analyzer - Working with Audio Streams
Explaining MPEG-1 Audio
Streams
ES Analyzer displays data for each channel separately.
For the selected audio frame, ES Analyzer displays the following:
5- 64
H
The frame header.
H
A plot of bits per code word against the sub-bands for each channel.
H
SCFSI (Scale Factor Selection Information) plotted against sub-band for
each channel.
H
Grouping information plotted against sub-bands for each channel.
H
The scale factor plotted against the sub-band.
H
Channel selection and playout controls.
MTS400 Series MPEG Test System User Manual
Test Equipment Depot - 800.517.8431 - 99 Washington Street Melrose, MA 02176 - FAX 781.665.0780 - TestEquipmentDepot.com
ES Analyzer - Working with Audio Streams
Explaining MPEG-2 Audio
Streams
For MPEG-2 Audio streams, ES Analyzer analyzes the following channels if the
data is present: Left, Right, Left Surround, Right Surround, Center and LFE.
Currently, ES Analyzer analyzes 5.1 Audio streams. When ES Analyzer detects
an MPEG-2 Audio stream, the information displayed is similar to what is shown
in the following illustration.
ES Analyzer displays information on the following tabs: MPEG-1 Header, MC
Header (Multi-channel header), and MC Composite Status (Multi-channel
composite status).
MPEG-2 Audio streams are backward compatible with MPEG-1 streams.
Therefore, the MPEG-1 header for each frame is the same as that for an MPEG-2
Audio stream.
MTS400 Series MPEG Test System User Manual
5- 65
ES Analyzer - Working with Audio Streams
The MC Header tab displays information about the additional data present for
the multi-channel extensions, over the two stereo channels. It gives you the
number of channels that are present, the presence of the LFE channel, additional
CRCs, and other relevant fields in the MC Header, as shown.
The MC Composite Status tab provides the sub-band information of the
channels; and their relationship with the transmission channels, as shown.
5- 66
MTS400 Series MPEG Test System User Manual
ES Analyzer - Working with Audio Streams
The lower part of the dialog box displays information specific to the channels.
You can select the channel for which you want to see the details by clicking the
appropriate graphic at right. The channel-specific data for the selected channel is
displayed at left as for MPEG-1.
Explaining the Status Bar
Display
The status bar for Audio streams displays the following:
H
Frame number, which is the number of the current frame in the stream.
H
Layer number, which is the number of the audio stream.
H
Byte offset in the file, which is the first byte of the Frame header being
currently viewed in both the hexadecimal and decimal formats.
MTS400 Series MPEG Test System User Manual
5- 67
ES Analyzer - Working with Audio Streams
Understanding Dolby Digital (AC-3) Audio Streams
ES Analyzer also analyzes Dolby Digital’s audio streams, which could be an
independent, stand-alone audio stream, or a multiplexed stream that is embedded
inside an MPEG-2 System stream (ATSC transport or program stream). The
Dolby Digital stream is analyzed by ES Analyzer for syntactic compliance with
Dolby Digital specifications.
For a detailed discussion on the Dolby Digital audio syntax, refer to the
document A/52 from Advance Television Systems Committee (ATSC).
ES Analyzer analyzes Dolby Digital stream frame by frame and also performs
CRC checks for each audio frame. When analyzing a Dolby Digital stream, you
may navigate to any frame and also view data specific to an audio block within
it.
Automatically detecting the data format used in the Dolby Digital stream, ES
Analyzer analyzes both the little endian and the big endian formats. For ease of
debugging, ES Analyzer displays information for all the fields of any block for
any audio frame.
When errors are encountered in a stream, ES Analyzer reports the errors and
synchronizes to the next audio frame to continue the analysis.
ES Analyzer displays the header and audio block information on specific tabs, as
shown. The Header And BSI tab displays the Dolby Digital synchronization and
bit stream information.
The audio controls are only available on the Header and BSI tab.
5- 68
MTS400 Series MPEG Test System User Manual
ES Analyzer - Working with Audio Streams
Depending on the selection, the Audio Block tab displays information for the
corresponding audio block within the frame.
The lower part of the previous illustration displays the channel-specific
information for the selected audio block, as shown in the following illustration.
MTS400 Series MPEG Test System User Manual
5- 69
ES Analyzer - Working with Audio Streams
The Coupling information tab distinguishes between the stand-alone and coupled
data for the selected channel. The green band denotes the stand-alone information, and the blue region denotes the coupled information. The blue region may
be further divided into bands; these appear as solid lines as opposed to the dotted
lines that denote sub-bands.
Explaining the Status Bar
Display
5- 70
The status bar for Dolby Digital Audio streams displays the following:
H
Frame number, which is the number of the current frame in the stream.
H
Bit rate of the Dolby Digital audio stream.
H
Sampling rate.
H
Frame size information.
H
Byte offset in the file, which is the first byte of the Frame header being
currently viewed in both the hexadecimal and decimal formats.
MTS400 Series MPEG Test System User Manual
Working with Program Streams
Program streams are quite similar to MPEG1 System streams in structure. A
Program stream consists of a sequence of packs. Each pack has a header, an
optional system header, and any number of packets. If a system header is not
received in a pack, then the last received header is applicable for the pack. The
system header is sent periodically in the stream to facilitate random access. Each
pack contains any number of packets. Each packet belongs to a particular stream
and has a PID associated with it. If packets of a given PID are concatenated, you
get the embedded PES stream with this PID. The PES stream in turn has an
elementary stream embedded in it.
For more details on Program streams, refer to the ISO/IEC 13818-1 document.
ES Analyzer performs conformance and semantic checks at the program stream
packet level as per the ISO/IEC 13818-1 recommendations. An embedded stream
is checked when you navigate through one; for details, see the Navigating
through Streams section in the Getting Started chapter.
MTS400 Series MPEG Test System User Manual
5- 71
ES Analyzer - Working with Program Streams
For Program streams, you can:
H
View pack and system headers, as shown in the previous illustration.
H
View the program stream map; see the Viewing Program Map section for
details.
H
View an embedded stream at the PES or the elementary stream level; see the
Understanding Packetized Elementary Streams section for details.
H
Perform buffer analysis of the embedded audio/video stream using the STD
model; see the Analyzing Streams chapter for details.
H
Perform PCR/PTS frequency analysis model; see the Analyzing Streams
chapter for details.
Viewing Pack and System Headers
When navigating through a stream, the current pack is displayed in the header
display area, as shown in the preceding illustration. The pack and system header
fields are displayed for the current packet of the Program stream. The currently
applicable system header is displayed for the packet. The receipt of a system
header in the current pack is indicated by a check mark in the system header
group box. A cross mark indicates that the system header was received earlier.
The list of streams declared in the header is displayed in the elementary stream
list box. It is possible that the stream may contain some PES streams that are not
declared in the System Header. Such streams are added in the tree view when a
packet of the same is encountered.
5- 72
MTS400 Series MPEG Test System User Manual
ES Analyzer - Working with Program Streams
Viewing the Program Stream Map
The program stream map can be viewed by clicking the stream map icon
(PSMAP) in the tree view window. This pops up the stream map showing the
descriptors for the Program stream and the contained elementary streams. The
descriptors associated with each elementary stream in a program can be viewed
in one of two ways:
H
By double-clicking the corresponding icon for the stream in the display
H
By clicking the more details icon shown for the corresponding stream in
the elementary stream listbox
The form is extended (if not already extended) to add the descriptors display, as
shown in the following illustrations. All descriptors that are received for the
corresponding stream are displayed on tabbed folders. If a descriptor is not
received, its tab will not appear in the descriptor display. The illustrations below
show descriptors for the respective video and audio tabs.
MTS400 Series MPEG Test System User Manual
5- 73
ES Analyzer - Working with Program Streams
Explaining the Status Bar
Display
5- 74
The status bar for Program streams displays the following:
H
Pack number, which is the number of the displayed packet.
H
Packet number, which is the number of the current packet in the entire
stream.
H
Packet number of SID, which is the number of the current packet taking into
account only packets of the same stream ID (SID).
H
At GOP level, the location of GOP header/start at PES level and Pack level
is displayed by PES packet number & Pack number respectively.
H
At AES & AC3 level, the location of frame header/start at PES level and
Pack level is displayed by PES packet number and Pack number respectively.
H
Byte offset in the file, which is the first byte of the Pack header being
currently viewed in both the hexadecimal and decimal formats.
MTS400 Series MPEG Test System User Manual
Working with Teletext
Teletext can be incorporated into DVB streams. ES Analyzer allows the
associated data to be analyzed and viewed.
To view the teletext data, navigate to the teletext icon in the Tree View
window.
Initially, the Page Header data will be displayed:
MTS400 Series MPEG Test System User Manual
5- 75
ES Analyzer - Working with Teletext
Using the Next button, details of the page can be viewed in the Data Packet tab.
Other tab pages (Color Map Table, Decoded Display, Decoding Parameters)
provide detailed teletext encoding data. These tabs will only appear as progress
is made through the stream using the Next button and the analyzer detects them.
VBI (Enhanced Teletext Support)
Enhanced teletext support is available (reference: ETSI EN 301-775). The
supported extensions include the following:
H
VPS (Video Program System)
H
WSS (Wide Screen Signaling)
H
Monochrome Data
Note that the associated information screens will only be available for display
where data of the specific type is available in the stream.
5- 76
MTS400 Series MPEG Test System User Manual
ES Analyzer - Working with Teletext
Examples of the screens are shown in the following illustrations.
VPS (Video Program
System)
MTS400 Series MPEG Test System User Manual
5- 77
ES Analyzer - Working with Teletext
WSS (Wide Screen
Signaling)
Monochrome Data
5- 78
MTS400 Series MPEG Test System User Manual
Advanced Audio Compression
Elementary Stream Analyzer (ES Analyzer) performs off-line stored stream
analysis for MPEG1 Audio, MPEG2 Audio, and Dolby Digital Audio streams,
as well as MPEG1 and MPEG2 video streams. The streams can embedded inside
DVB, ATSC or MPEG1 System streams.
Advanced Audio Compression (AAC) is one of the audio compression formats
defined by the MPEG-2 standard. AAC used to be called NBC (Non-BackwardCompatible), because it is not compatible with the MPEG-1 audio formats. AAC
offers a better compression ratio than MP3 (MPEG-1 Layer 3) and is the
state-of-the-art in audio compression technology. It can include up to 48 audio
channels, 15 low frequency enhancement channels, 15 embedded data streams
and has multi-language capability. MPEG formal listening tests have demonstrated that it can provide slightly better audio quality at 96 kb/s than layer-3 at
128 kb/s or layer-2 at 192 kb/s.
Due to its high coding efficiency, AAC is a prime candidate for any digital
broadcasting system. The Japanese authorities were the first to decide to use
AAC within practically all-digital audio broadcasting schemes. Because their
first services will start in the year 2000, this decision has already triggered the
development of dedicated AAC decoder chips at a number of manufacturers. Due
to its superior performance, AAC will also play a major role for the delivery of
high-quality music via the Internet. Furthermore, AAC (with some modifications) is the only high-quality audio-coding scheme used within the MPEG-4
standard.
The AAC bit stream is encoded in either of two formats:
H
Audio Data Interchange Format (ADIF)
H
Audio Data Transport Stream Frame (ADTS)
MTS400 Series MPEG Test System User Manual
5- 79
ES Analyzer - Advanced Audio Compression
The corresponding forms are displayed according to the format of the input bit
stream These forms display the information contained in the fields of the Header
and the Raw Data.
Hierarchy window
Summary window
Analysis window
Error log window
5- 80
MTS400 Series MPEG Test System User Manual
ES Analyzer - Advanced Audio Compression
ADIF Stream Forms
The analyzed information regarding the input ADIF stream is displayed by
means of a property sheet containing three tabs.
The ‘ADIF Header’ tab (Figure 5-1) displays the fields of the header.
Figure 5- 1: ADIF header Information
The ‘Raw Data’ tab (Figure 5--2) displays the fields in each raw data block. A
slider control helps to navigate through the various raw data blocks. The
information regarding each raw data block is displayed by means of another
child property sheet containing seven tabs (the fields in each tab are shown in
Figure 5--3 to Figure 5--9).
MTS400 Series MPEG Test System User Manual
5- 81
ES Analyzer - Advanced Audio Compression
Figure 5- 2: ADIF raw data Information
Element Color Coding in
the Raw Data Tab
Color Coding of Raw Data
Tabs
5- 82
The Element Type (below the slider bar) is color-coded; the key is given on the
right side of the display in the Element Types box. The number displayed in the
Element Type color spot indicates the EIT (element instance tag) of that syntactic
element.
The text in the Raw Data tabs is color-coded as follows:
Light Blue
indicates the syntactic element is present and activated in the
raw data.
Dark Blue
indicates that the syntactic element is present, but currently
inactive in the raw data.
Dark Gray
indicates that the syntactic element is not present in the raw data.
MTS400 Series MPEG Test System User Manual
ES Analyzer - Advanced Audio Compression
Figure 5- 3: Single channel element Information
Figure 5- 4: Coupling pair element information
MTS400 Series MPEG Test System User Manual
5- 83
ES Analyzer - Advanced Audio Compression
Figure 5- 5: Coupling channel element information
Figure 5- 6: Low frequency element channel information
5- 84
MTS400 Series MPEG Test System User Manual
ES Analyzer - Advanced Audio Compression
Figure 5- 7: Data stream element information
Figure 5- 8: Program configuration element information
MTS400 Series MPEG Test System User Manual
5- 85
ES Analyzer - Advanced Audio Compression
Figure 5- 9: Fill element information
5- 86
MTS400 Series MPEG Test System User Manual
ES Analyzer - Advanced Audio Compression
The ‘Channels’ tab (Figure 5--10) displays the configuration of the coded
channels. The physical location of the speakers corresponding to the channels
coded in the stream for standard and non-standard configurations can be
displayed.
Figure 5- 10: ADIF channels (non-standard) information
MTS400 Series MPEG Test System User Manual
5- 87
ES Analyzer - Advanced Audio Compression
The syntactic element type corresponding to each speaker in the Speaker-Channel Mapping is denoted by a color-code scheme, the legend for which is given in
the Ch.Element Types box. The number appearing in the color spots denotes the
EIT (element instance tag) of that syntactic element.
Figure 5- 11: ADIF channels (standard) information
5- 88
MTS400 Series MPEG Test System User Manual
ES Analyzer - Advanced Audio Compression
ADTS Stream Forms
The analyzed information regarding the input ADTS stream is displayed by
means of a property sheet containing three tabs.
The ‘ADTS Header’ tab (Figure 5--12) displays the fields of the header, while the
‘Raw Data’ tab displays the fields in each raw data block and the ‘Channels’ tab
displays the configuration of the coded channels. The content of the ‘Raw Data’
and ‘Channels’ tabs are identical to that in the ADIF stream.
Figure 5- 12: ADTS header information
MTS400 Series MPEG Test System User Manual
5- 89
Closed Caption Analysis
Closed captions are captions that are hidden in the video signal, invisible without
a special decoder. The place they are hidden is called line 21 of the vertical
blanking interval (VBI).
ES Analyzer allows closed caption data to be analyzed and inspected.
The two options are:
H
CCA Standalone (Player + CC-EIA608 + CC-EI708 analysis)
H
Full Elementary Stream Analyzer + CC-EIA608 + CC-EI708 analysis
NOTE. No special installation process is required. The options are dongle
protected/enabled.
The Stand-Alone option has full Closed Caption functionality, but other
ES Analyzer functions are disabled.
XDS analysis is currently disabled. Extended Data Services is a supplementary
data stream existing in Line 21, Field 2. It is used to provide additional data
(primarily content advisory information) on the program being aired
(Reference: EIA-744).
Enabling Closed Caption Analysis
1. Open a stream containing Closed Captions.
2. Expand the navigation tree and open either a VES or a GOP node.
3. Enable Closed Caption Analysis in the Settings menu. A check mark next to
the option indicates that Closed Caption Analysis is enabled.
NOTE. By default, Closed Caption Analysis is enabled. It is recommended that it
be only enabled when required; disabling it will improve the speed of picture
analysis processing.
However, disabling and enabling the Closed Caption Analysis feature should
only be done when a stream is first opened, not during analysis. Opening the
feature during analysis may result in improper analysis.
When Closed Caption Analysis is enabled, the Closed Caption Display tab
will be visible in the Slice and MB GOP tab.
MTS400 Series MPEG Test System User Manual
5- 91
ES Analyzer - Closed Caption Analysis
4. Ensure that the Picture Display Settings (Settings > Picture Display…) are as
shown in the following screenshot:
H
Display Order of Pictures > Presentation Order
H
Motion Vector Overlay Colour Selection > White
Selecting Closed Caption Analysis Standard
Two primary forms of Closed Caption Analysis are offered: CC-EIA608 and
CC-EIA708. CC-EIA746 support is also supported in the EIA608 mode.
The selection of CC-EIA608 or CC-EIA708 is made from the Closed Caption
Display tab available in the Slice and MB GOP tab.
NOTE. Whichever standard is selected, no closed caption content will be
displayed until the file has been at least partially analyzed. To start analyzing
the stream, select the GOP And Picture tab and press the Go button.
A sign that closed caption content has been detected during analysis is that the
Video icon in the navigation tree changes to include a CC symbol:
>
5- 92
MTS400 Series MPEG Test System User Manual
ES Analyzer - Closed Caption Analysis
CC-EIA608 Support
The following dialog box is displayed below the picture display (in the Closed
Caption Display tab) when CC-EIA608 Closed Caption Analysis is enabled:
At the top of the display, the LED icons indicate that closed caption data has
been received in the Field and Services sections; green indicates that data has
been received.
If data has been received for the current GOP it should be displayed in the
Display Memory tab and on the picture display:
The remaining tabs (Roll Up, Pop On and Paint On) display various parameters
defining the manner in which the captions will be displayed.
MTS400 Series MPEG Test System User Manual
5- 93
ES Analyzer - Closed Caption Analysis
CC–EIA746 Support
Associated with CC-EIA608 is CC-EIA746 which supports the transmission of
URLs (Uniform Resource Locators) within the closed caption data.
The URLs transmitted in the T2 closed caption service are parsed, decoded and
displayed in the EIA-746 Data view.
H
The attributes shown apply to the URL selected from the drop-down list.
H
The selected URL is fetched and displayed on the default Web browser
installed on the system.
CC-EIA708 Support
The following dialog box is displayed below the picture display (in the Closed
Caption Display tab) when CC-EIA708 Closed Caption Analysis is enabled:
Details of the fields in the Closed Caption Analysis window are as follows:
5- 94
MTS400 Series MPEG Test System User Manual
ES Analyzer - Closed Caption Analysis
Caption Service
Packet Info
Block Info
The service whose details are to be displayed can be selected from the dropdown list.
Sequence No. The sequence number of the packet from which the current
service block has been extracted (for example, Service 1,
Service 2, etc).
Packet Size
The packet size that has been coded in the packet header.
Bytes Left
The number of bytes still to be received.
Block size
The size of the service block.
Bytes Left
The number of bytes still to be received.
Active Window The Window ID which is currently the active window.
Window Identity
W#
Window Text
The buttons in red in the W# column indicated the defined
windows in the received service. The parameters to the right of
this column depend on the selection made here.
The text shown in the current window.
MTS400 Series MPEG Test System User Manual
5- 95
ES Analyzer - Closed Caption Analysis
Window Definition
Parameters
5- 96
By placing the cursor over the more… field all the parameters related to the
window definition can be viewed.
MTS400 Series MPEG Test System User Manual
ES Analyzer - Closed Caption Analysis
Window Style Parameters
Pen Style Parameters
By placing the cursor over the more… field all the parameters related to the
window styles can be viewed.
By placing the cursor over the more… field all the parameters related to the pen
styles can be viewed.
MTS400 Series MPEG Test System User Manual
5- 97
ES Analyzer - Closed Caption Analysis
Dumping Closed Caption Statistics
Closed Caption Analysis statistics can be written to file for each standard
(EIA608 and EIA708).
NOTE. Regardless of which standard is selected, no closed caption statistics can
be dumped until the file has been at least partially analyzed. To start analyzing
the stream, select the GOP And Picture tab and press the Go button.
A sign that closed caption content has been detected during analysis is that the
Video icon in the navigation tree changes to include a CC symbol:
>
The sequence of actions required for a dump of statistics to be successful is as
follows:
1. The Dump CC Statistics option in the Settings menu will only become
available when analysis (or partial analysis) has established that Closed
Caption data is carried in the stream.
2. A standard must be selected from the Dump CC Statistics option sub-menu,
for example, EIA608.
3. A destination file must be specified for the statistics dump.
4. Further analysis must be carried out to provide data for the statistics dump.
The following paragraphs describe the setup required for each standard; however,
the previous steps must be adhered to for the dump to be successful.
5- 98
MTS400 Series MPEG Test System User Manual
ES Analyzer - Closed Caption Analysis
EIA608 Closed Caption
Statistics Dump
1. Select the EIA608 option from the Dump CC Statistics sub-menu.
2. Enable Dump Statistics.
3. Identify a destination file in the Statistics File: field.
4. Enable the parameters to be dumped.
5. Select OK.
Existing reports (reports that you set up) can be viewed by selecting View
Report.
MTS400 Series MPEG Test System User Manual
5- 99
ES Analyzer - Closed Caption Analysis
EIA708 Closed Caption
Statistics Dump
1. Select the EIA708 option from the Dump CC Statistics submenu.
2. Enable Dump Statistics.
3. Identify a destination file in the Statistics File: field.
4. Enable the parameters to be dumped.
5. Select OK.
Existing reports (that is, reports previously set up) can be viewed by selecting
View Report.
5- 100
MTS400 Series MPEG Test System User Manual
DVB Subtitle Stream Analysis
DVB Subtitling provides a means of conveying region-based bit-mapped
graphics as MPEG-2 packetized elementary streams (PES). The bit-mapped pixel
images are run-length encoded and transmitted with color look-up tables (CLUT)
to a decoder where the stream is decoded and the subtitle image rendered with
the on-screen display.
When a DVB Subtitle node is revealed and highlighted, the screen shown below
is displayed:
NOTE. Some streams may show subtitle nodes from which the Page View
(described below) cannot display any subtitles.
This is not an error, it is because the stream is too short to carry the requisite
data. If possible, record a longer section of the stream and retry the analysis.
MTS400 Series MPEG Test System User Manual
5- 101
ES Analyzer - DVB Subtitle Stream Analysis
The working area contains two tabs: DVB Subtitle Data and Page View.
5- 102
MTS400 Series MPEG Test System User Manual
ES Analyzer - DVB Subtitle Stream Analysis
DVB Subtitle Data Tab
The DVB Subtitle Data tab displays the fields associated with the current
display. Access to two areas of detail is provided by pressing the Default CLUT
Table… and the Show Object… buttons.
MTS400 Series MPEG Test System User Manual
5- 103
ES Analyzer - DVB Subtitle Stream Analysis
Object View
The Object View displays a decoded bitmap of the selected object rendered on a
blank screen (that is, with no underlying picture). The fields at the top of the
dialog box, provide the user with the options of changing the decoder type (2-bit,
4-bit or 8-bit), the background color, and the CLUT identity. As described in the
standard, the CLUT is attached to the region, not the object; therefore, the user
can see the bitmap using all of the available CLUTs.
The Object view is displayed by selecting the Show Object… button on the DVB
Subtitle Data tab.
5- 104
MTS400 Series MPEG Test System User Manual
ES Analyzer - DVB Subtitle Stream Analysis
CLUT View
The Object view is displayed by selecting the Default CLUT table… button on
the DVB Subtitle Data tab.
NOTE. Subtitles in the UK are colored in a limited set, (red, cyan, green, yellow,
white), one for each of four speakers/actors and white for additional speakers/
actors.
MTS400 Series MPEG Test System User Manual
5- 105
ES Analyzer - DVB Subtitle Stream Analysis
Page View Tab
On the Page view tab, the regions listed in the Page Composition Segment area
of the DVB Subtitle Data tab are rendered on a blank screen (size 720(H) x
576(W) pixels). The regions and objects are rendered at their actual locations on
the blank screen. The user can select the Decoder Type and Background Color
from the drop-down lists.
NOTE. Background color is not carried in the broadcast. The user can select a
suitable color.
5- 106
MTS400 Series MPEG Test System User Manual
Test Equipment Depot - 800.517.8431 - 99 Washington Street Melrose, MA 02176 - FAX 781.665.0780 - TestEquipmentDepot.com