1
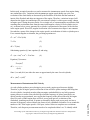
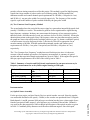
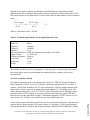
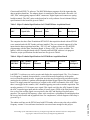
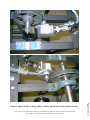
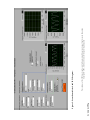
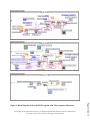
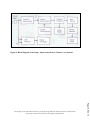
Session 1726
NEW SENSOR AND INSTRUMENTATION FOR
RELATIVE CYLINDER POWER MEASUREMENTS ON
INTERNAL COMBUSTION ENGINES
Emin Yılmaz, Professor and P.E.
Department of Technology
University of Maryland Eastern Shore
Princess Anne, MD 21853
(410) 651-6470
E-mail: [email protected]
Abstract
The purpose of the previous project1 was to design a sensor assembly, which could be used with
a data acquisition system to measure the relative power of each cylinder on an internal
combustion engine. A basic sensor assembly design and construction was completed as a
laboratory requirement for the Mechanical Systems Design course. Pulses generated by the
encoder pressed against engine crankshaft belt were acquired and stored in a file using a National
Instruments2 PCI 6023E, 200 kS/s (kilo-samples per second) throughput data acquision board
and an application program developed using National Instruments LabVIEW 5.0 graphical
programming software. The acquired data was processed using LabVIEW and the results were
displayed. The change in the encoder signal frequency is proportional to the power generated by
the individual cylinders of the engine. A plot is generated for two revolutions of the crankshaft.
Tests showed that, due to the speed of the data acquisition board, only four-cylinder engines
could be analyzed adequately.
Recently a new data acquisition system was assembled with LabVIEW 7.0 software and a 400
kS/s data acquisition board. A more durable optical sensor was also purchased for the system.
After assembling the system and designing a fixture to secure the sensor against engine
crankshaft belt, test runs were run. A new LabVIEW program was written to acquire data using
digital channels of the data acquisition board, instead of analog channels, to expand the range and
the accuracy of measurements.
Results indicate that the new optical-encoder/data acquisition/LabVIEW 7.0 system is capable of
accurately measuring relative cylinder powers of 8-cylinder engines operating over 1000 rpm.
For completeness of the theory, some sections of the previous work1 were included.
Page 10.963.1
Proceedings of the 2005 American Society for Engineering Education Annual Conference & Exposition
Copyright © 2005, American Society for Engineering Education
Nomenclature1
D
I
N
ΔN
ΔP
SR
T
d
f
n
ppr
α
∝
θ
θ0
ω
ωo
Δω
= Engine crankshaft pulley diameter
= Moment of inertia of the moving engine parts
= Engine idling speed, rpm
= Change in engine speed, rpm
= Change in engine power
= Acquisition sampling rate, samples/s
= Torque generated by a cylinder during power stroke
= Encoder pulley diameter
= Frequency of encoder pulses, Hz
= Encoder angular velocity, rpm
= Pulses generated per revolution of encoder
= Engine angular acceleration
= Proportional to
= Angular position at the end of power stroke
= Initial angular position
= Engine angular velocity
= Initial engine angular velocity
= Change in angular velocity
Introduction
Students in Mechanical Engineering Technology program at UMES (University of Maryland
Eastern Shore) are required to take at least one Systems Design course during the last year of
their program. As part of the requirement for this course, students are assigned to design a
system, or systems, that require use of the cumulative knowledge they have acquired in lower
level courses. If the project is large enough, they are assigned a group project. The Sensor
Assembly design project was assigned to one student during spring semester of 2000. The
student has finished the mechanical design and the construction of the sensor assembly. Initially a
DC generator was used as a sensor and very limited testing of the sensor was done on the bench.
The author did the rest of the work during the fall semester of 20011. During the fall semester of
2004, a new data acquisition system was installed; a new optical sensor was purchased for the
same project to improve the accuracy and the range of relative power measurements.
Measurement of Relative Cylinder Power1
Proceedings of the 2005 American Society for Engineering Education Annual Conference & Exposition
Copyright © 2005, American Society for Engineering Education
Page 10.963.2
The author does not know how new engine diagnostic machines measure relative cylinder power
of internal combustion engines. Our old (1984) SUN Interrogator Engine Diagnostic unit kills the
ignition of cylinders, one at a time, and measures change in average engine speed. Change in
engine speed can be related to the relative power of a cylinder. The author could not find a way
of using the SUN diagnostic machine on new car engines. Most new engines do not have open
ignition coils or distributors where one can connect the grounding lead of the diagnostic unit. In
addition, most car computers try to maintain an average engine idle speed at a fixed value even if
one of the cylinders loses its power.
In this study, an optical encoder was used to measure the instantaneous speed of an engine during
one combustion cycle. Variations in the instantaneous engine speed during one cycle (two
revolution of the crank shaft) are decreased by the flexibilies of the belts and the moment of
inertia of the flywheel and other moving parts of the engine. Therefore, variations in speed will
depend on the engine size and design. One can estimate cylinder’s relative power using “change
in engine speed” during the power stroke. For a simple case of constant angular acceleration, and
assuming that acceleration starts from the same initial angular velocity for each cylinder (say at
ω0), as shown below, power generated by a cylinder is proportional to the square of the increase
in the engine speed. In real life, angular acceleration is not constant since torque is not constant.
Nevertheless, square of the change in the engine speed is an indication of relative cylinder power.
For a constant angular acceleration, the governing equations are:
ω2 = ω02 + 2*ω*(θ-θ0)
(1)
T = I*α
(2)
ΔP = T*(Δω)
(3)
Substituting equation (1) into equation (2) and using
ω2 = (ω0 + Δω)2 ≈ ω02 + 2*ω0*Δω
(4)
Equation (3) becomes:
I*ω0(Δω)2
ΔP = ------------(θ-θ0)
(5)
Since I, ω0 and (θ-θ0) are either the same or approximately the same for each cylinder,
ΔP ∝ (Δω)2 ∝ (ΔN)2
(6)
Measurement of Instantaneous Belt Velocity
Proceedings of the 2005 American Society for Engineering Education Annual Conference & Exposition
Copyright © 2005, American Society for Engineering Education
Page 10.963.3
As each cylinder produces power during its power stroke, engine speed increases slightly.
Therefore, a plot of engine speed as a function of time will have peaks starting at the firing time
of each cylinder. An optical encoder riding on engine crankshaft belt (or any belt) generates
square pulses as it rotates. Since the belt speed and the frequency of pulses generated by an
optical encoder are proportional, one can plot the frequency of the pulses instead of the engine
speed. For an 8-cylinder engine there will be 8 power peaks per two revolutions of the
crankshaft. Assuming one needs 10 points to reasonably display each power peak, one has to
measure 80 frequency values within a time frame of two crankshaft revolutions. Let us round this
number to 100. If the engine speed is 1200 rpm, it takes 100 ms to complete two revolutions.
Therefore, each frequency measurement needs to be completed within 1 ms. To identify which
peak belongs to which cylinder; start of the data acquisition needs to be synchronized with the
firing of one of the cylinders. Since firing order of an engine is given starting with the first
cylinder, acquisition may be started with the firing of the first cylinder.
To calculate the frequency of square pulses generated by the optical encoder, one may measure
either the period of the signal or count the number of peaks of the signal within a fixed time
period. If a data acquisition system is used, this can be done with an Analog to Digital Converter
(ADC) channel or with counters of the data acquisition (DAQ) board. When a slow DAQ board
is used, acquired data may be stored in an array or in memory and written into a file. The written
file may be processed after the acquisition is complete. Encoder and DAQ board speed
requirements given in the following methods are for 1% accuracy in frequency measurements,
and for an engine running at 1200 rpm. One has to acquire at least 100 encoder pulses or count
100 clock pulses for each frequency measurement for 1% accuracy.
(1). Period Measurement Using ADC Channel
With this method one can sample the encoder signal using an ADC channel of a data acquisition
board at a fixed rate and count the number of points acquired between two encoder pulses. Since
acquisition rate is constant, the number of acquired points may be used to calculate the period of
the encoder pulse. When the period of the encoder signal is used to calculate the frequency, the
minimum speed requirements for optical encoder and ADC channel are 1 kHz (=100 pulses in
100 ms) and 100 kS/s (=100 acquired points within 1 ms) respectively. The optical encoder
signal has to be sampled at a minimum rate of 100 times of the optical encoder frequency. The
number of the acquired samples between the two pulses divided by the acquisition (sampling)
rate will be the period of the pulse. Frequency is the inverse of the calculated period.
(2). Pulse Counting Using ADC Channel
With this method one can sample the encoder signal using an ADC channel of a data acquisition
board at a fixed rate and count the number of encoder pulses occurring within a fixed number of
acquired data points. For this method, the minimum encoder and ADC channel speed
requirements are 100kHz (100 pulses per 1 ms) and 200 kS/s (two acquired data points per pulse
are required not to miss any pulses) respectively. This method was used with the previous
“Relative Cylinder Power Measurements” project1. The number of peaks of the acquired encoder
signal was counted within 200 acquired values (=200kS/s*1 ms). The frequency of the encoder
signal is equal to the number of counted peaks divided by 10-3 s (=1 ms) or 1000 times the
number of counted peaks.
(3). Two Counters-High Frequency Method
Proceedings of the 2005 American Society for Engineering Education Annual Conference & Exposition
Copyright © 2005, American Society for Engineering Education
Page 10.963.4
There are two methods of measuring the frequency of a signal using counters. Counters are
available on most multi-purpose data acquisition boards. One of the methods uses an accurate,
known-width gate pulse to count the number of pulses received from the source (=the signal
whose frequency will be measured) during the gating duration. A second counter or software is
used to generate the required gate pulse. Since the Windows timer is not accurate for short
periods, software timing cannot be used for this project. This method is good for high frequency
signals since large number of pulses can be received during gating. With this method, the
minimum encoder and counter channel speed requirements are 100 kHz (=100 pulses in 1 ms)
and 50 kHz (=1 ms gate pulse width=2 ms period) respectively. The frequency of the encoder
signal is equal to the number of peaks counted divided by the gate-pulse width.
(4). Two Counters-Low Frequency Method
The second method uses the period of the source signal as a gate and an internal high-speed clock
(usually 5-20 MHz) as a source. This method is good for slower signals and for signals having
large frequency variations. In theory one can measure the frequency of two consecutive pulses,
therefore when a 100 kHz encoder is used, one can have close to 10,000 (=100 kHz* 100 ms plot
duration) data points on the graph. Since 100 frequency values are more than enough to generate
the graph one can use the total period of multiple pulses as a gate. To obtain a cumulative period,
a second counter is used as frequency divider. A division by 100 will be appropriate for an
encoder running at 100 kHz. With this method the minimum encoder and counter speed
requirements are 500 Hz (=1 ms pulse=2 ms period) and 100 kHz (=100 pulses in 1 ms)
respectively.
The “Two Counters-Low Frequency” method was used for this project since it is the most
accurate of the all methods given above for frequency measurement. A summary of optical
encoder and data acquisition board requirements are given in Table 1. If the engine idle speed is
600 rpm, speed requirements will be half of the values given in Table 1.
Table 1. Summary of encoder and DAQ board requirements for one percent accuracy in
frequency measurement for an 8-cylinder engine running at 1200 rpm,
Method of Measurement
Encoder Speed,
kHz
ADC-period measurement 1 (gate)
ADC-pulse counting
100 (source)
2-Counter-Hi Frequency
100 (source)
2-Counter-Low Frequency 0.5 (gate)
ADC speed, kS/s
Counter speed, kHz
100 (source)
200 (gate)
50 (gate)
100 (source)
Instrumentation
(a). Optical Sensor Assembly
Proceedings of the 2005 American Society for Engineering Education Annual Conference & Exposition
Copyright © 2005, American Society for Engineering Education
Page 10.963.5
For the previous project, an Opto Generic Devices optical encoder was used. Since the encoder
was not durable and had a slow speed (~50 kHz) a new encoder was purchased from US Digital3
Both channels, A and B, generate 1000 pulses per revolution but they have a phase angle of onefourth of one period. Index output, I, goes high once per revolution of the encoder. Channel A
was used for the data acquisition. Some technical specifications of the optical encoder are given
in Table 2. Crankshaft pulley diameters are different on different engines. Since belt speed
depends on the engine rotational speed and the crankshaft diameter, an optimum encoder
diameter needs to be calculated. The encoder pulse rate should not exceed its rated value of 100
kHz and should not be less than 500 Hz. It can be shown that1 encoder diameter can be calculated
using
D x N x (ppr)
D x N x (ppr)
---------------- ≤ d ≤ ---------------60 x f1
60 x f2
(7)
Where f1=100,000 Hz and f2 = 500 Hz.
Table 2. Technical Specifications for the Optical Encoder Used
Model No
Channel A
Channel B
Channel I
Max rotational speed
Supply Voltage
Frequency Response
Axial Load
Radial load
Weight
: HD25
: 1000 ppr
: 1000 ppr
: 1 ppr
: 6,000 rpm (limited by electronics at 100 kHz)
: 5.5 VDC max.
: 100 kHz
: 40 lbs.
: 35 lbs.
: 17 oz.
The encoder is bolted to an 18-in. long handle. As shown in Fig.1, with the help of the handle,
the encoder pulley may be pressed against the crankshaft belt for cylinder relative power
measurements.
(b). Data Acquisition System
Our old data acquisition system (still being used) consists of a TDK 486-66 microcomputer, a
Data Translation4 DT2805, low level, 12-bit data acquisition board and ASYST (version 2.1)
software. The DT2805 board has a DT707 screw terminal box. The box supports thermocouple
inputs with a reference junction occupying analog input channel "0". Throughput speed with
single channel analog input is up to 13.7 kHz at 1X and 10X amplifications. Although writing
programs with ASYST is simpler, it was not used because the acquisition speed of DT2805
board was low for this application. Keithley5 discontinued support of ASYST software in 1993
with version 4.01. No drivers are available for new data acquisition boards.
Proceedings of the 2005 American Society for Engineering Education Annual Conference & Exposition
Copyright © 2005, American Society for Engineering Education
Page 10.963.6
A new microcomputer-based data acquisition system was assembled and used to count the pulses
generated by the optical encoder. The system consists of a Pentium-4, 2.0GHz microcomputer,
National Instruments2 PCI-6023E data acquisition board with BNC2090 Shielded BNC Adapter
Chassis and LabVIEW 7.0 software. The BNC2090 adapter supports all of the inputs that the
data acquisition board has. The adapter chassis is connected to the board with a flat cable. All
ADC, DAC and triggering inputs use BNC connectors. Digital inputs and counters use springloaded terminals. The ADC gains on the board can be set by software for each channel. Major
specifications for the board are given in Table 3.
Table 3. Major Technical Specifications for PCI-6023E Data Acquisition Board
Resolution
ADC
ADC Channels
/Speed kS/s
DAC
Channels
Programmable
Gains
I/O Ports
/bits
Counters
/bits/Speed
12
16SE/200
0
0.5,1,10,100
1/8
2/24/20MHz
The computer also has a Data Translation4 DT304 PCI data acquisition board with an STP300
screw terminal and with DT Foundry software installed. The screw terminal supports all of the
inputs that the data acquisition board has. “DT-LV Link” software allows use of LabVIEW
programming with the Data Translation Board. A library of DT-VIs is also available. The
author’s effort in using this board with DT Foundry and LabVIEW software is in progress.
Therefore, major specifications for this board are also given in Table 4.
Table 4. Major Technical Specifications for DT304 Data Acquisition Board
Resolution
ADC/DAC
ADC Channel
SE/DI/Speed
DAC
Channels
Programmable I/O Ports
Gains
/bits
Counters
/bits/Speed
12/12
16/8/400kS/s
2
1,2,4,8
4/16/5MHz
3/8
LabVIEW 7.0 software was used to acquire and display the acquired signal. The “Two-CountersLow Frequency” method, discussed above, was used to measure frequencies of the pulses
received from the optical encoder. Acquisition start time may be triggered by an inductive probe
attached to the cylinder #1 ignition cable through the digital trigger input of the data acquisition
board. This trigger starts the acquisition of a signal on one of the set channels of the ADC. Since
there is no trigger for the counters, ADC channel triggering was used to start the acquisition. The
encoder generates 0-5 Volt square wave signal. This signal was fed to the ADC channel #0 input,
the ADC external trigger input and the counter #0 source input (PFI8) of the DAQ board. Only a
few cycles of the encoder signal were acquired by the ADC and displayed for observation
purposes. The acquired 100 frequency values were stored into a spreadsheet file and displayed on
the screen, both in table and in graphical form. For completeness, a block diagram of the setup is
given in Fig. 6.
Proceedings of the 2005 American Society for Engineering Education Annual Conference & Exposition
Copyright © 2005, American Society for Engineering Education
Page 10.963.7
The author could not use the DT304 board with DT Foundry software since the only available
frequency counter VI was software timed and it was not accurate enough for this project.
(c). Programming of Data Acquisition and Signal Processing
LabVIEW2 software was used to program the data acquisition and to display the acquired
encoder signal frequencies. LabVIEW (laboratory Virtual Instrument Engineering Workbench) is
a development environment based on the graphical programming language. All LabVIEW
programs have a “Front Panel” which uses “Controls Palette” and a “Block Diagram” which uses
“Functions Palette” in their construction. Front Panel is used to control acquisition and/or
processing functions of the LabVIEW software. Block Diagram is used to construct the sequence
of operations. A wiring tool from “Tools Pallet” is used to connect inputs and outputs of different
blocks (functions) to accomplish a combined task. For example one can use an “ADC” block to
acquire an analog data at a specified speed, using a specified channel number, and use “Write to
File” block to pick the acquired data and write it into a specified file.
The LabVIEW computer program for this project consists of three tasks. The purpose of the first
task is to start acquisition with an external trigger and display few cycles of the encoder signal.
The second task acquires the data, calculates the frequencies, stores it into a file and displays it.
The last task reads the data from the stored file, calculates the average frequency and displays it.
For the first task, “Acq&Graph Voltage-Ext Clk.vi” program was used. Major input parameters
for this task are: Analog channel number to be used, scan (acquisition) rate, number of samples
(data points) to be acquired. Not to waste any time in this task, the maximum acquisition rate of
200 kS/s and a minimum number of samples (as few as 2) should be used.
The second task consists of a “Meas Dig Freq-Buffered-Finite-Large Range 2 Ctr.vi” and “Write
to Spreadsheet File.vi” programs. Major input parameters are: Trigger type, maximum and
minimum frequency values, divisor, number of samples to be acquired, and file name to store the
data. The third task consists of “Read from Spread Sheet File”, “Array Subset”, “Array Size”
programs, and “Add Array Elements” and “Divide” functions. The Front Panel and the Block
Diagrams of each task are given in Figures 2 and 3.
Results
The designed system was tested on the electric drive system of our previously designed Wheel
Balancing Machine6. Deceleration and acceleration of a two-pole electric motor was clearly
observed. For further testing, the sensor assembly was pressed against the crankshaft belt of the
author’s 8-cylinder car engine. Typical results are given in Fig.4 and Fig.5. For Fig.4, four of the
cylinders of the 8-cylinder engine were disabled by removing ignition cables to observe the peaks
better. As seen in both figures, all of the cylinders are generating about the same power since all
of the frequency peaks are about the same. In Fig.5 (bottom display) sixth peak is missing since
ignition wire of one of the cylinders was removed. A gradual increase in the average engine
speed is clearly seen as other cylinders add power.
Proceedings of the 2005 American Society for Engineering Education Annual Conference & Exposition
Copyright © 2005, American Society for Engineering Education
Page 10.963.8
As seen from Figures 4 and 5, change in engine speed is very small. When four cylinders are
generating power, the speed change is about 4%. When eight cylinders are generating power,
speed change is only about 1%. For the 8-cylinder case, since the speed change is very small, it
is difficult to identify peaks. Therefore this system should be used with caution with 8-cylinder
engines. One can always remove alternate four ignition wires in the firing order and do the
measurement using four cylinders at a time.
Educational Value of the Project
1. Using it as a Tool in Experiments: The old (ASYST based) data acquisition system is
still being used in Strength of Materials and Heating, Ventilating and Air Conditioning
experiments. The plan is to gradually convert old programs or rewrite new ones so that
the most up to date hardware and software are used in all experiments.
2. Teaching Data Acquisition Techniques in an Instrumentation Courses: New data
acquisition system may be used as a tool in ETME 381-Mechanical Instrumentation and
ETEE 421-Instrumentation courses to teach students modern ways of acquiring,
processing, displaying and communicating data. Both of these courses cover “principles
of data acquisition”. Using the new data acquisition system in one of the experiments will
substantially improve understanding of the data acquisition topics covered.
3. Using as a Tool in Power and Transportation Course: EDTE 341-Power and
Transportation course is taken as a technical elective by most MET students. The course
covers internal combustion engine operations and maintenance. Next time I teach the
course, the DAQ system shall be used to check power balance of the laboratory engine or
student owned car engines. A laptop based system will be more appropriate for field use
and it is being looked at as a next step to improve the use of the data acquisition in
cylinder relative power measurements.
Conclusions
A new and more durable optical encoder was purchased and used for relative cylinder power
measurements. A new technique was also used to measure the varying frequencies of the signal
received from the optical encoder using two counters on the data acquisition board. With this 2counter method, a low speed optical encoder may be used without sacrificing the accuracy of the
measurements. For one percent accuracy, the frequency of pulses generated by the encoder could
be as low as 500 Hz. The encoder pulley diameter is not critical for the accuracy of the
measurements any more as long as the frequency limit of the encoder, 100 kHz, is not exceeded
and as long as the frequency of the encoder pulses is above 500 Hz. Since the program acquires
and displays only 100 data points, one has to adjust the “divisor” of the front panel of the
LabVIEW program to see all of the power peaks on the plot.
Proceedings of the 2005 American Society for Engineering Education Annual Conference & Exposition
Copyright © 2005, American Society for Engineering Education
Page 10.963.9
Planned extensions for this projects are: (a) design and construct a digital triggering probe using
an inductive coil, (b) find a way to numerically integrate the frequency peaks so that relative
power of each cylinder may be displayed numerically, (c) modify the computer program to
acquire and display average frequency graph and relative power of each cylinder for a given
number of power cycles, (d) use the DT304 board with DT-LV and LabVIEW software so that I
do not need to borrow NI DAQ board, and (e). purchase and install a cylinder pressure transducer
to create a pressure trace of each cylinder to validate the relative cylinder power data.
Acknowledgements
The Department of Technology’s financial help is appreciated and acknowledged. Special thanks
go to Dr. Joseph Arumala for letting me use his data acquisition board.
References
1.
Emin Yılmaz, " Instrumentation for Relative Cylinder Power Measurements on Internal Combustion Engines”,
Computers in Education Journal, Vol. XII, No. 4, Oct.-Dec. 2002. Also published in refereed ASEE 2002
Conference Proceedings (CD-ROM), Session 1520. http://facstaffwebs.umes.edu/eyilmaz/relase02.pdf/.
2.
National Instruments, Austin, Texas, (800) 433-3488, http://www.ni.com/. Function and VI Reference Manual
(1/98), Data Acquisition Basics Manual (1/98), LabVIEW G Programming Reference Manual (1/98),
LabVIEW User Manual (4/03), LabVIEW Measurements Manual (8/03), LabVIEW Quick Start Guide (2/99),
DAQ Quick Start Guide for NI-DAQ 7.0 (4/03), DAQ 6023E/6024E/6025E User Manual (12/00), Getting
Started with LabVIEW (4/03).
3. US Digital Corporation, 11100 ne 34th circle, Vancouver, Washington 98632, http://www.usdigital.com.
4. Data Translation, 100 Locke Drive, Marlboro, MA 01752-8528, http://www.datatranslation.com/. DT300 Series
Getting Started manual (2/04), DT300 Series User’s manual (2/04), DT Measure Foundry and RT Streaming
Getting Started Manual, DT-LV Link Reference Manual (7/98), DT-LV Link Getting Started Manual (7/98).
5. Keithley Instruments, Inc. 28775 Aurora Road, Cleveland, Ohio 44139, http://www.keithley.com/.
6. Emin Yılmaz, "Microcomputer Based Instrumentation for Student Designed Wheel Balancing Machine”,
refereed 1998 ASEE Annual Conference Proceedings, CDROM, Session 1426, paper #4,
http://facstaffwebs.umes.edu/eyilmaz/wbmase98.pdf
EMIN YILMAZ
Emin Yılmaz is a Professor of Engineering Technology at the University of Maryland Eastern Shore. He has BS and
MS degrees in Mechanical Engineering and a Ph.D. degree from the University of Michigan in Nuclear Engineering.
He is a heavy user of computers in courses and in his research. He developed and taught several laboratory courses
in engineering and engineering technology. Web Page: http://www.facstaffwebs.umes.edu/eyilmaz.
Page 10.963.10
Proceedings of the 2005 American Society for Engineering Education Annual Conference & Exposition
Copyright © 2005, American Society for Engineering Education
Proceedings of the 2005 American Society for Engineering Education Annual Conference & Exposition
Copyright © 2005, American Society for Engineering Education
Page 10.963.11
Figure 1. Optical encoder as being held by a fixture against electric motor belt for testing.
Proceedings of the 2005 American Society for Engineering Education Annual Conference & Exposition
Copyright © 2005, American Society for Engineering Education
Figure 2. Front Panel of the LabVIEW Program.
Page 10.963.12
Proceedings of the 2005 American Society for Engineering Education Annual Conference & Exposition
Copyright © 2005, American Society for Engineering Education
Page 10.963.13
Figure 3. Block Diagram of the LabVIEW Program with Three Sequence Structures.
Proceedings of the 2005 American Society for Engineering Education Annual Conference & Exposition
Copyright © 2005, American Society for Engineering Education
Page 10.963.14
Figure 4. Frequency variation when only four cylinders are firing at a time (top: 1-4-6-7,
bottom: 5-2-3-8). The other four were disabled. In both cases, frequency (engine speed)
variation is about 4%.
Proceedings of the 2005 American Society for Engineering Education Annual Conference & Exposition
Copyright © 2005, American Society for Engineering Education
Page 10.963.15
Figure 5. Frequency variation when eight cylinders (top) and seven (below) cylinders are
firing. Sixth peak is missing in lower figure. In each case, frequency (engine speed)
variation is about 1%.
Figure 6. Block Diagram of the Setup. Input connections to Counter-1 are internal.
Page 10.963.16
Proceedings of the 2005 American Society for Engineering Education Annual Conference & Exposition
Copyright © 2005, American Society for Engineering Education