1
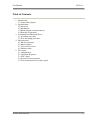
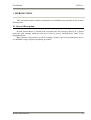
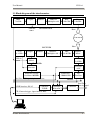
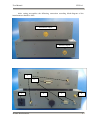
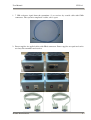
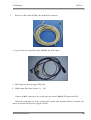
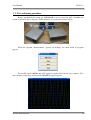
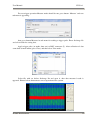
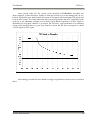
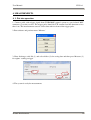
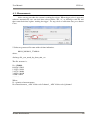
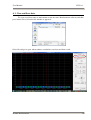
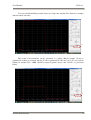
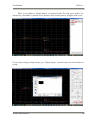
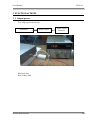
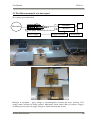
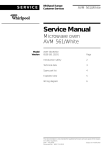
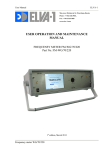
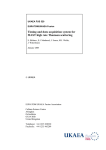
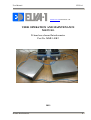
User Manual
ELVA-1
www.elva-1.com [email protected]
USER OPERATION AND MAINTENANCE
MANUAL
D-band one channel Interferometer
Part No. MMI-140R2
2013
D-band Interferometer
0
User Manual
ELVA-1
Table of Contents.
1. Introduction.
1.1 General Description.
2. Specifications.
2.1 Electrical.
2.2 Mechanical.
2.3 Block-diagram of interferometer
2.4 Principle of operation
3. Installation and Functional Tests.
3.1 Assembly procedure.
3.2 Test and tuning procedure.
4. Measurements.
4.1 Put into operation
4.2 Measurements.
4.3 View and Save data.
4.4 Software tools.
5. Test report.
5.1 Output Power
5.2 Operation Frequency.
5.3 AGC signal.
5.4 Accuracy of measurement.
5.5 Test measurement of real time signal
D-band Interferometer
1
User Manual
ELVA-1
1. INTRODUCTION.
This instruction manual contains information on installation and operation of the D-band
Interferometer.
1.1 General Description.
D-band interferometer is intended for measuring the line-averaged density of a plasma
along the path through which the mm-wave beam is passed, through phase shifts in the
propagated beam.
Base principle of operation is an effect of change of phase speed of electromagnetic waves
of a millimeter range in plasma depending on density.
D-band Interferometer
2
User Manual
ELVA-1
2. SPECIFICATIONS.
2.1 Electrical Specifications.
1. RF Frequency
2. LO Frequency
3. Frequency Stability
4. Time Phase Analyze
5. Time collection
6. Phase error measurement
7. Data rate of real time density
8. Real time density interface
9. Real time signal rate
10. Output RF Power
11. Max attenuation Tx-Rx
12. IQ Detector Frequency
13. RF to IF Gain
14. Conversion Loss of Mixer
15. Noise Figure
16. Gain of Horn
17. Waveguide
18. Flange
19. Data interface
20. External trigger
21. Input impedance of trigger input
22. Waveguide transition
23. AC Power
24. Operating temperature range:
140.0 GHz;
138.0 GHz;
10 ppm;
5 µs;
1000 ms;
0.07 radian;
10kHz
voltage, +0.1 … +5.0V
15.4 Rad/V
100 mW;
> 90dB
100 kHz;
70 dB with AGC system;
9 dB;
12 dB;
30 dB;
WR-06
UG-387/U-M
TCP/IP Ethernet;
TTL;
50 Ohm;
WR-06 to WR-42;
220 VAC (external modules)
+10°C…+ 50°C;
2.2 Mechanical Specifications.
1. Transmitter
2. Receiver
D-band Interferometer
300x205x70 mm;
250x235x70 mm;
3
User Manual
ELVA-1
2.3 Block-diagram of the interferometer.
DRO
7.0 GHz
Coupler
Doubler
IMPATT
Multiplier x10
BPF
140 GHz
TRANSMITTER
7 GHz out
SMA
ILA
140 GHz
Horn
TOKAMAK
Horn
RECEIVER
VCO
6.9 GHz
7 GHz in
SMA
Coupler
Doubler
IMPATT
Multiplier x10
BPF
138.0 GHz
Balance
Mixer
Balance
Mixer
LNA
2.0 GHz
IF=100 MHz
Phase
Detector
PA with
AGC
Reference Crystal
Oscillator 100 MHz
Synthesizer
2.00010 GHz
Sin / Cos, AGC signal, 4 pins connector
TCP/IP interface, RJ-45
Controller
TCP/IP
IQ
Detector
100 kHz
Controller
With ADC
Controller
Real Time
Density signal
TTL, External trigger, Opto-isolated, BNC
D-band Interferometer
4
User Manual
ELVA-1
2. 4 Principle of operation.
The interferometer operates at fixed frequency. Due to all built-in oscillators are phaselocked by one reference Cristal oscillator 100 MHz, there is a possibility to control phase shift of
mm-wave signal is passed through plasma.
Mm-wave oscillators (transmitter and LO for receiver) are built on one principle. The
transmitter consists of ultra low phase noise DRO 7.0 GHz, direction coupler 1:10, doubler and
multiplier x10 with integrated high power amplifier at 14 GHz. The direction coupler provides
7.0 GHz signal for receiver. The transmitter generates output frequency at 140.00 GHz, 7.0 GHz
x20.
The mm-wave receiver consists of VCO 6.9 GHz, direction coupler 1:10, doubler,
multiplier x10 with integrated high power amplifier at 14 GHz and balance mixer. For
stabilization IF signal and phase-locking LO frequency, the signal 7.0 GHz from transmitter is
used. After down conversion the signal from transmitter we have IF frequency 2.0 GHz. Then
this signal is amplified by LNA and comes to power amplifier with built-in AGC system. AGC
system allows to keep stable amplitude of IF signal in 30-70 dB attenuation range in mm-wave
channel. Response time of AGC system is 2.5 microsec. Then stabilized IF signal is applied to
IQ mixer, where as LO oscillator synthesizer 2.00010 GHz is used. The synthesizer 2.000010
GHz is also phase-locked by reference Cristal oscillator 100 MHz. IQ mixer provides two IF
signals 100 kHz (sin and cos), which are digitized by built-in 12 bits ADCs. The controller
converts digital data in Ethernet pockets and transfers them via TC/IP interface to PC station.
PC station collects data from the interferometer and calculates absolute phase changing
during discharge of plasma. The software operates the following way: as 100 kHz signals and
trigger of ADC converters are locked by one reference, we can control only pass zero points of
IF signals without any additional reference signal, i.e. relation between period of IF signal and
quantity of digitized points inside of this period is constant in anytime (without plasma). Such
way we get absolute rate Pi / (digitized points) φo and can control phase shift of signal during
discharge of plasma. As we have two 100 kHz signals from IQ detector (sin and cos) total pass
zero points is four times more and finally time phase analyze is 2.5 microsec. The software
calculates time different between close pass zero points and compare it with absolute rate. Then
sum different between actual and absolute rate:
0
∑ (ϕ (n) − ϕ (n − 1) )
N
Where,
n - number of current pass zero point from the beginning of discharge.
N – total quantity pass zero points during of discharge
After collection data and calculation total drift of phase the software recalculate phase in
absolute changing of density of plasma with rate 0.4143*10^(18) / m^3 (operation frequency
140GHz, diameter of plasma 0.4m)
D-band Interferometer
5
User Manual
ELVA-1
3. INSTALLATION AND FUNCTIONAL TEST.
3. 1. Assembly procedure.
The interferometer can be installed directly near windows of TAKAMAK or removed
from it by extension WR-42 waveguides, as it presented on picture below.
D-band Interferometer
6
User Manual
ELVA-1
Waveguide’s set of the interferometer consists of the following components:
- Waveguide transition WR-06/ UG-387/U-M to WR-42 / UG-595/U
-
Horns WR-06/ UG-387/U-M
D-band Interferometer
7
User Manual
ELVA-1
After setting waveguides the following connection according block-diagram of the
interferometer should be done:
Transmitter output
Receiver input
1
2
3
D-band Interferometer
4
5
6
8
User Manual
ELVA-1
1. 7 GHz reference signal from the transmitter (1) to receiver by coaxial cable with SMA
connectors. The system is completed 2 cables, one is spare.
2. Power supplies via applied cables with DB-9 connectors. Power supplies are equal and can be
used any for transmitter and receiver.
D-band Interferometer
9
User Manual
3.
ELVA-1
Receiver to PC station by TP5 cable with RJ-45 connector.
4. Special cable for control IF signals 100 kHz and AGC signal.
5. BNC input for external trigger TTL pulse
6. SMA output ‘Real time density’, 0 …+5V
Connect all BNC connectors any oscilloscope for control 100 kHz IF signals and AGC.
When all connections are done, complete PC station with standard monitor, keyboard and
mouse and switch ON all power supplies and PC.
D-band Interferometer
10
User Manual
ELVA-1
3. 2. Test and tuning procedure.
Before installation the system on TOKAMAK it can be tasted on table. Assemble the
system as disrobed above and place Tx/Rx modules as presented on picture below:
Then run program ‘Interferometer’ (placed on desktop), the main menu of program
appears:
For test IF signals 100kHz and AGC signal test mode should be run, press button ‘Test’
and real time oscilloscope window with 100 kHz IQ signals appears
D-band Interferometer
11
User Manual
ELVA-1
For test trigger operation Measure mode should be run, press button ‘Measure’ and new
sub-menu is appearing:
then press button Measure in sub menu for waiting a trigger pulse. Enter discharge No
and select folder for saving data.
Apply trigger pulse (or make short cut) to BNC connector (5). After collection of data
come back to main menu (press Close) and then select View mode.
Select file with set before discharge No and open it, after that measured result is
appeared. Picture below demonstrates correct operation of the system.
D-band Interferometer
12
User Manual
ELVA-1
After passing ‘table test’ the system can be installed on TOKAMAK. Assemble and
adjust complete system and before starting to work the user has to test and tuning horns (if it is
needed). For that the user should switch on system in Test mode and check form of IF signals and
level of AGC system. To control sinusoidal wave form of IQ signals and AGC signal tune horns
such way to get minimum available level of AGC signal. Below dependence of AGC signal vs
attenuation in waveguide channel is presented. For reference, total attenuation in assembling
system with installed horns in open area should be about 60 dB, that corresponds to about
+2.95V output of AGC signal.
After tuning procedure the user should test trigger operation of system as it was described
above.
D-band Interferometer
13
User Manual
ELVA-1
4. MEASUREMENTS.
4. 1. Put into operation.
1. Connect cable with trigger signal from TOKAMAK control system to opto-isolated BNC
connector (5) on the receiver. The trigger pulse should be TTL standard and has duration no less
then 1 ms. The interferometer starts to collect data with rise front of the trigger pulse.
2. Run software and put into menu ‘Measure’
3. Enter discharge serial No (1) and select folder (2) for saving data and then press Measure (3)
for regime ‘waiting a trigger’
1
2
3
4. The system is ready for measurement.
D-band Interferometer
14
User Manual
ELVA-1
4. 2. Measurements.
After start up procedure the system is waiting for trigger. When trigger pulse is appeared
software automatically save raw data into selected folder, add ‘+1’ to discharge serial No and
then comes back into regime ‘waiting for trigger’. To stop circle of collection data, press button
Close.
129+1
5. Software generates file name with real time indication:
00129_20130912_173640.ifr
where,
discharge No_year_moth_day_hour_min_sec
The file structure is:
N = 2500000
0 26536 -15012
1 22352 -21668
2 16776 -26408
3 10132 -29120
4 2908 -29928
………..
Where,
N – quantity of measurements
No of measurement _ ADC 16 bits code I channel _ ADC 16 bits code Q channel
D-band Interferometer
15
User Manual
ELVA-1
4. 3. View and Save data.
To view saved data come to main menu or run one more Interferometer software and then
press button View. Selection file window is appeared.
Select file and press open, when software recalculates raw data and draw result.
1
D-band Interferometer
16
User Manual
ELVA-1
User can switch On/Off presented data to use flags into window No1. Below is example
with measured data only.
2
The result of measurement can be presented as a phase shift in radians (Y-axis is
graduated in radians) or electron density (Y-axis is graduated in *10^(18) / m^3). To see result in
radians in window No2 ‘1.000’ should be entered (picture above) and ‘0.4143’, as presented
below
2
D-band Interferometer
17
User Manual
ELVA-1
There is possibility to install markers at measured dada. For that press marker list,
activate flag ‘add markers’ (window No3) and then select desired point by using PC mouse tool.
3
To save data as image in bmp format, press ‘Export image’, enter file mane and select folder for
saving.
D-band Interferometer
18
User Manual
ELVA-1
To save final data in txt format press ‘Export data’, enter file mane and select folder for saving.
Software stores data in file ‘xxxx.ifd’
After proceeding data, press button ‘Close’ and save menu appears
, press button ‘Receive data’ and then wait trigger pulse. Message “Data
received’ appears when data is collected and available for viewing and saving
To save data press button ‘Save data’, for viewing “View data’:
4. 4. Software tools.
Set limits for axis
Present data in min to max data scale
X-axis
Y-axis
X and Y axis
Zoom buttons
Button to set scroll sensitivity
D-band Interferometer
19
User Manual
ELVA-1
5. FUNCTIONAL TESTS.
5. 1. Output power.
Test setup in presented below.
Transmitter
Power sensor
Power sensor
Indicator
Measured data:
Pout = 104.4 mW
.
D-band Interferometer
20
User Manual
ELVA-1
5.2. Operation frequency.
Test setup in presented below.
Horn
Horn
Transmitter
Frequency Meter
1m
Measured data:
Fout = 140,004271 GHz
D-band Interferometer
21
User Manual
ELVA-1
5.3. AGC signal.
Test setup in presented below.
Transmitter
10dB
Direction Coupler
10dB
Direction Coupler
Direct reading
Variable attenuator
0 – 70dB
Receiver
Volt
Meter
AGC signal
Test data is presented on plat below.
D-band Interferometer
22
User Manual
ELVA-1
5.4. Accuracy measurement.
Test setup in presented below
Direct reading
10dB
Variable attenuator
Direction Coupler
0 – 70dB
Horn
Horn
Transmitter
PC
1.5m
Receiver
Measured data:
Accuracy measurement is < 0.07 radians
D-band Interferometer
23
User Manual
ELVA-1
5.5 Test Measurement of real time signal
Test setup in presented below
MicroMeter
Electromagnetic solenoid
Transmitter
PC
Receiver
Coil spring Movable metal reflector
Power supply
Trigger Oscillator
Oscilloscope
Principle of operation – apply voltage to electromagnetic solenoid and move reflector. Coil
spring returns reflector in initial position. Micrometer check actual shift of reflector. Trigger
oscillator provides pulse for apply voltage to solenoid and run the system.
D-band Interferometer
24
User Manual
ELVA-1
Measured data
Micrometer: 8.8mm, that corresponds to 8.8 / 2.14 (wave length for 140GHz) *6.28 =25.8 rad
Real time signal on the oscilloscope:
dU=1,684V, that corresponds 1,684V *15,4 Rad/V= 25,93 rad
The system measured 25.97 rad
D-band Interferometer
25