1
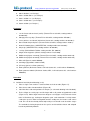
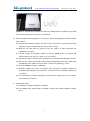
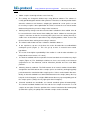
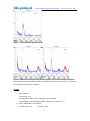
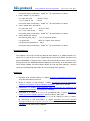
http://www.bio-protocol.org/e1484
Vol 6, Iss 11, Jun 05, 2015
Determination of the Developmental Origin of Seeds Containing Endosperm Using Flow
Cytometric Analysis
*
Christian Sailer , Anja Schmidt and Ueli Grossniklaus
*
Institute of Plant Biology & Zürich-Basel Plant Science Center, University of Zürich, Zürich,
Switzerland
*For correspondence: [email protected]; [email protected]
[Abstract] Seeds derived from a diploid, sexual plant typically contain a 2n embryo (n+n) and
3n endosperm, a ratio characteristic for most flowering plants. However, this ratio is altered in
apomictic species, which reproduce asexually through seeds (Koltunow and Grossniklaus,
2003). Apomixis is usually a facultative trait and encompasses several developmental steps: (1)
apomeiosis (avoidance of meiosis), (2) parthenogenesis (embryo development without
fertilization), and (3) functional endosperm formation (autonomous without fertilization or
pseudogamous requiring fertilization). If all three steps occur, this process results in maternal
offspring (2n+0), which is genetically identical to the mother plant (clonal). Moreover, sexual
and apomictic pathways can occur in the same plant and sometimes they cross over, producing
polyhaploid offspring (n+0; resulting from meiosis and parthenogenesis) or B III hybrids (2n+n;
resulting from apomeiosis and fertilization) (Rutishauser, 1947). The different types of offspring
can be determined in a flow cytometric seed screen (FCSS), in which the relative chromatin
content of stained nuclei is determined by measuring their fluorescence intensity. This allows a
comparison of the ploidy of the endosperm to the ploidy of the embryo and, thus, an inference
of the pathway by which a seed was formed (Matzk et al., 2000). This method is particularly
useful to characterize the developmental origin of seeds in apomictic plants or reproductive
mutants of sexual species.
Here, we present the protocol for an FCSS in Brassicaceae that has specifically been
adapted to plants of the genus Boechera. However, in principle this protocol can be applied to
any species producing seeds that contain endosperm.
Materials and Reagents
1. Citric acid monohydrate (Sigma-Aldrich, catalog number: 33114)
2. Triton X-100 (Sigma-Aldrich, catalog number: X100)
.
3. Na2HPO4 2H2O (Merck KGaA, catalog number: 1.06580.1000)
TM
4. 4’,6-Diamidin-2-phenylindol (DAPI) (Life Technologies, Invitrogen , catalog number:
D1306)
5. β-mercaptoethanol (Sigma-Aldrich, catalog number: M6250)
6. Sheath fluid; Iso-Diluent
(Beckman Coulter, catalog number: NPE 629967)
7. Cleaning solution (Beckman Coulter, catalog number: 629969)
1
http://www.bio-protocol.org/e1484
Vol 6, Iss 11, Jun 05, 2015
8. Shutdown solution (Beckman Coulter, catalog number: 629968)
9. Stock solutions (see Recipes)
10. Otto 1 solution 0.01% (see Recipes)
11. Otto 1 solution 1% (see Recipes)
12. Otto 1 solution 0.5% (see Recipes)
13. Otto 2 solution (see Recipes)
Equipment
1. 1.2 ml Cluster tube and rack (sterile) (Thermo Fisher Scientific, catalog number:
07-200-320)
2. Storage plate cap strips (Thermo Fisher Scientific, catalog number: AB-0981)
3. 3 mm stainless steel beads (Schieritz & Hauenstein, catalog number: 22.455.0011)
4. Nunc Fritted deep well plates (Thermo Fisher Scientific, catalog number: 278011)
5. 96-well V-bottom plates (SARSTEDT AG, catalog number: 82.1583.001)
6. 200 μl tips (SARSTEDT AG, catalog number: 70.760.002)
7. 1 ml tips (Rainin/Mettler Toledo, catalog number: RC-1000/10)
8. Single channel pipettes (Gilson, catalog number: P10, P1000)
9. Multichannel pipette 10-100 µl (Thermo Fisher Scientific, catalog number 4661130)
10. Multichannel pipette 30-300 µl (Thermo Fisher Scientific, catalog number 4661140)
11. Mixer mill (Retsch, model: MM300)
12. Centrifuge (Eppendorf, model: 5810R)
12. UV lamp ((part of 13. flow cytometer))
13. Flow cytometer (Beckman Coulter, Cell Lab Quanta SC, serial number: AN020010)
14. Flow cytometer robotics (Beckman Coulter, MPL, Cell Lab Quanta SC, serial number:
AN90022)
Procedure
A. Isolation of nuclei by bead-beating (3-4 h)
1. Place a single 3 mm stainless steal bead into each cluster tube (Figure 1A).
2. Place cluster tubes into 96-wellrack (Figure 1B).
3. Label the tubes and mark positions of samples (as schematic drawing in the lab book).
4. Fix the silique on a sticky tape and slit it open with a dissection or hypodermic needle
(Figure 1C-D). Add a single mature but still green seed (Figure 1C-D) into each cluster
tube. In Boechera spp. endosperm degrades upon seed maturation. If a fully mature
seed of the species under investigation contains endosperm, the mature seed can be
used. This can be checked by microscopic analyses of cleared seeds at various stages.
The method of clearing depends on the species and should be chosen and adapted
based on published protocols.
2
http://www.bio-protocol.org/e1484
Vol 6, Iss 11, Jun 05, 2015
Figure 1. A. A single 3 mm stainless steel bead in a cluster tube. B. Cluster tubes
containing single beads in the appropriate 96-well rack. C. Optimal seed stage for
Boechera spp. seeds. The top silique has seeds that are too young to be used (too few
cells), and the bottom silique has seeds at an optimal stage. D. The top silique has
seeds that are too old (they start to turn brown, coinciding with degradation of the
endosperm). The lower silique has seeds at an optimal stage. E. Close-up of C. F.
Close-up of D. Lines indicate that part of the picture was removed in the close-up.
5. Add 80 μl of Otto 1 (0.01%) to each tube.
6. Close the tubes using the storage plate cap strips.
7. Crush the seeds by shaking the samples for 3 min at 30 Hz using the mixer mill.
3
http://www.bio-protocol.org/e1484
Vol 6, Iss 11, Jun 05, 2015
8. Turn plates 180° and repeat step A6. The distal part of the arm of the mixer mill has a
larger amplitude than the proximal part. Turning the plates compensates for the
different amplitudes of the mixer mill.
9. Control whether the seeds are crushed by visual inspection. Seeds are crushed if the
solution turned milky (Figure 2).
Figure 2. Crushed and non-crushed seeds. The green arrows indicate successfully
crushed seeds and a milky solution. The white arrow points to a non-crushed seed. The
red arrow shows a tube without a seed. If the solution is clear and the seed is visible in the
cluster tube, it was not crushed and cannot be measured.
10. If not all seeds are crushed repeat steps A7-9 until all seeds are crushed.
11. Shake down the solution to remove drops from the lid, either by gently knocking the
plate flat against the table, or by a quick spin (5 sec) in the centrifuge.
12. Add 80 μl of Otto 1 (1%) to each tube. Be careful to not touch the tube or the foam with
the tip to not cross-contaminate the samples.
13. Close the tubes and mix by inverting 40x manually and avoid generating foam by fast
movements. Now the volume is 160 μl and the concentrations are 0.1 M citric acid and
0.5% Triton X-100.
14. Place a filter plate onto a clean 96-well V-bottom plate (Figure 3A).
15. Label the plates.
16. Transfer the solution with the extracted nuclei into the fritted deep well plates, either by
using a multichannel pipette or by pouring. Be careful to keep the order of the samples.
17. Centrifuge 5 min at 150 x g at room temperature (20 °C) to pellet the nuclei.
18. Carefully remove the plates from the centrifuge. The pelleted nuclei are very loose.
19. Remove the fritted deep well plates. If they are thoroughly washed with tap water and
rinsed with deionized water, they can be reused.
20. Remove the supernatant with a pipette tip placed at the edge of the V (Figure 3B).
21. Do not pipette fast; otherwise nuclei will be sucked up.
22. The pellet should be of white to light brown appearance.
23. Add 30 μl of Otto 1 (0.5%) to resuspend the nuclei. Adding the buffer by fast pipetting is
sufficient to resuspend the nuclei.
24. Samples can now be stored for up to 72 h at 4 °C until used.
4
http://www.bio-protocol.org/e1484
Vol 6, Iss 11, Jun 05, 2015
Figure 3. A. A fritted deep well plate on a 96-well V-bottom plate. B. Cartoon representing
the placement of the tip to remove the supernatant.
B. Measuring DNA-content (ploidy) (ca. 7-8 min per sample, depending on the concentration
of the nuclei)
25. Start the flow cytometer and the UV lamp. Please refer to the user manual of the flow
cytometer or get an introduction from the person in charge.
26. While the UV lamp heats up (30 min), place the samples at room temperature to
equilibrate (see Notes).
27. Load or change the detection settings so that the diploid peak is at channel 200
(relative fluorescent units) on a linear scale (see Notes).
28. Add 160 μl of Otto 2 solution either manually or by using the flow cytometer’s robotics.
29. Measure the sample and record the data. Stop collecting data either after a total count
of 6,000 (this takes about 7-8 min) or after a certain time period (e.g. 5 min).
30. Treat all additional samples accordingly.
31. Manually annotate the peaks (see Figures 4-6). Discard the samples in which the
endosperm does not give a clear peak! It is essential to see the peak of the endosperm
(see Notes).
32. Save your data in a table that provides at minimum the sample name, mean, median
and coefficient of variance.
C. Analyzing the data
33. Compute the ratio of endosperm to embryo.
34. If the ploidy of the mother plant is available, compute the ratio of embryo to mother
plant.
5
http://www.bio-protocol.org/e1484
Ratio endosperm : embryo
Offspring type (embryo)
1.5
sexual (n+n)
Vol 6, Iss 11, Jun 05, 2015
Endosperm
reduced central cell fertilized
with reduced pollen (3n)
unreduced central cell
2.5
apomictic (2n + 0)
fertilized with reduced pollen
(5n)
unreduced central cell
3.0
apomictic (2n + 0)
fertilized with unreduced
pollen
(6n)
Representative data
Figure 4. Sexual offspring (n + n) of diploid Boechera stricta.
This histogram shows the
fluorescence intensity on the x-axis and the number of counts for each intensity on the y-axis.
The peaks are manually annotated and labeled according to ploidy inferred from the internal or
external standard. Green represents the nuclei of the embryo. The 4x and 8x peaks are from
endoreduplicated embryonic nuclei (autopolyploidization). Brown represents the endosperm
nuclei. The ratio of the 3x:2x peaks is 275.99/187.4 = 1.47, indicating sexual development. The
ratio of the 6x:4x peaks is 1.48. Using the autopolyploid peaks for ratio calculations provides an
internal control.
6
http://www.bio-protocol.org/e1484
Vol 6, Iss 11, Jun 05, 2015
Figure 5. Apomictic offspring (2n+0) of triploid Boechera gunnisoniana.
Green
represents the nuclei of the embryo. The 3x, 6x, and 12x peaks represent autopolyploidization.
As apomictic Boechera spp. are typically pseudogamous (Rushworth et al., 2011), we expect a
fertilized endosperm (Table 1). In this case, the endosperm is 9x (9x:3x ratio is 2.86), indicating
fertilization by an unreduced sperm cell.
Figure 6. BIII hybrid offspring (2n+2n) of triploid Boechera gunnisoniana.
This histogram
is almost identical to that shown in Figure 6. However, the red peak (3x) is much smaller than
the 6x peak, indicating that this is contamination from maternal sporophytic tissues, due to
scraping the seeds from the silique. As B. gunnisoniana produces both unreduced female and
male gametes, the 2n+2n embryo peak (6x) will be double the size of that from maternal nuclei
(3x). These data were published by Schmidt and colleagues (2014).
7
http://www.bio-protocol.org/e1484
Vol 6, Iss 11, Jun 05, 2015
Notes
1. Colder samples show higher fluorescence intensity.
2. The settings are changed in distinct ways using different software. The software is
usually provided together with the flow cytometer. Therefore, we do not provide details
about the software used. However, adapting the protocol to a new species or new
tissue always requires some optimization first. Please refer to the user manual and/or
obtain training from the person in charge of the instrument.
3. Staining intensity changes over time after the Otto 2 solution has been added. It has to
be ensured that the time interval from adding the Otto 2 solution to measuring the
sample is constant, or that the measuring takes place once the staining intensity is
stable. Here we describe the procedure using sampling robotics, which ensures that
the time interval from staining to measuring is constant.
4. The volume ratio of Otto 2 to Otto 1 solutions should be about 4:1.
5. In our experience, 25-35% of the data has to be discarded due to unidentifiable
endosperm peaks (Figure 7). This can go up to 45% in material from natural
populations.
6. The results show higher reproducibility if the median is used for ratio calculations (4
independent measurements, CV < 0.01).
7. Use internal standards whenever possible. Internal standards are mixed to every single
sample (Figure 8). For Arabidopsis thaliana we have successfully used Solanum
lycopersicum var. San Marzano, and for Hieracium pilosella we have used Bellis
perennis.
8. Choosing internal standards: The DNA content of an internal standard should differ
enough from the DNA content of the sample species to avoid any overlapping ploidy
peaks between the standard and the sample species. Values can be found in literature.
Ideally, an internal standard has a lower DNA content than the sample (always the very
left peak in the histogram), or a higher DNA content than any expected ploidy peak of
the sample species (always the very right peak of the histogram).
9. If internal standards are unavailable, use external standards (plants of known ploidy).
The external standard should be the first and the last sample measured in a set of
samples on one plate. From the position of the external standard of the known ploidy
(median of the peak), the ploidy of the unknown sample can be calculated.
8
http://www.bio-protocol.org/e1484
Vol 6, Iss 11, Jun 05, 2015
Figure 7. Unidentifiable endosperm peak
Figure 8. Diploid (A) and triploid (B) Boechera plants with internal standard Solanum.
Red marks the internal standard having a higher DNA content than the sample. It is therefore
on the right hand side of the histogram.
Recipes
1. Stock solutions
1 mol/L citric acid
.
Saturated (0.54 mol/L at 20 °C) Na2HPO4 2H2O solution
-1
-1
2 mg/ml DAPI in water (ultrapure water, conductivity > 18 MΩ cm )
2. Otto 1 solution 0.01% (for 100 ml)
0.1 mol/L citric acid
10 ml of 1 mol/L
9
http://www.bio-protocol.org/e1484
Vol 6, Iss 11, Jun 05, 2015
10 μl
0.01% (v/v) Triton X-100
-1
-1
Fill up with water (conductivity > 18 MΩ cm ) to a total volume of 100 ml
3. Otto 1 solution 1% (for 100 ml)
0.1 mol/L citric acid
1% (v/v) Triton X-100
10 ml of 1 mol/L
1,000 μl
-1
-1
Fill up with water (conductivity > 18 MΩ cm ) to a total volume of 100 ml
4. Otto 1 solution 0.5% (for 100 ml)
0.1 mol/L citric acid
10 ml of 1 mol/L
0.5 % (v/v) Triton X-100
500 μl
-1
-1
Fill up with water (conductivity > 18 MΩ cm ) to a total volume of 100 ml
5. Otto 2 solution (for 100 ml)
.
0.4 mol/L Na2HPO4 2H2O
0.4 μg/ml DAPI
0.2 μl/ml β-mercaptoethanol
74.1 ml saturated solution
200 μl of 2 mg/mL stock solution
200 μl
-1
-1
Fill up with water (conductivity > 18 MΩ cm ) to a total volume of 100 ml
Acknowledgements
This protocol is based on previously published work (Matzk et al., 2000; Schmidt et al.,
2014). Our research in this area was supported by the University of Zürich, the Marie Curie
project IDEAGENA, a Syngenta Ph.D. Project of the Zurich-Basel Plant Science Center,
and a grant from the “Staatssekretariat für Bildung und Forschung” in the framework of the
COST Action FA0903. We thank Manuel Waller for help with flow cytometry, and Anja
Herrmann and Margarida Sofia Nobre for careful reading of this protocol.
References
1. Koltunow, A. M. and Grossniklaus, U. (2003). Apomixis: a developmental perspective.
Annu Rev Plant Biol 54: 547-574.
2. Matzk, F., Meister, A. and Schubert, I. (2000). An efficient screen for reproductive
pathways using mature seeds of monocots and dicots. Plant J 21(1): 97-108.
3. Rutishauser, A. (1947). Untersuchungen über die Genetik der Aposporie bei
pseudogamen Potentillen. Experientia 3(5): 204-205.
4. Rushworth, C. A., Song, B. H., Lee, C. R. and Mitchell-Olds, T. (2011). Boechera, a
model system for ecological genomics. Mol Ecol 20(23): 4843-4857.
5. Schmidt, A., Schmid, M. W., Klostermeier, U. C., Qi, W., Guthorl, D., Sailer, C., Waller,
M., Rosenstiel, P. and Grossniklaus, U. (2014). Apomictic and sexual germline
development differ with respect to cell cycle, transcriptional, hormonal and epigenetic
regulation. PLoS Genet 10(7): e1004476.
10