1
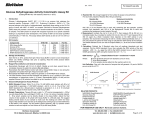
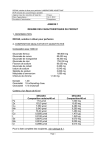
BioVision Rev. 2/13 For research use only Glucose Oxidase Activity Colorimetric/Fluorometric Assay Kit I. II. (Catalog #K788-100; 100 reactions; Store kit at –20°C) Introduction: The glucose oxidase enzyme (GOx) (EC 1.1.3.4) is an oxidoreductase commonly found in a wide variety of microorganisms that catalyzes the oxidation of glucose to hydrogen peroxide and D-glucono-δ-lactone. GOx aids in breaking the sugar down into its metabolites. BioVision’s Glucose Oxidase Assay provides a convenient tool for sensitive detection of the GOx in a variety of samples. Glucose oxidase in samples recognizes Dglucose as a specific substrate leading to proportional color development. The activity of GOx can be easily quantified colorimetrically (λ = 570 nm) or fluorometrically (Ex/Em = 535/585 nm). GOx assay detects glucose oxidase activity as low as 0.01mU. Kit Contents: Components GOx Assay Buffer OxiRedTM Probe GOx Substrate GOx Developer GOx Positive Control H2O2 Standard (0.88 M) K788-100 Cap Code Part No. 28 ml 0.2 ml 1 ml 1 vial 1 vial 0.1 ml WM Red Blue Green Purple Yellow K788-100-1 K788-100-2A K788-100-3 K788-100-4 K788-100-5 K788-100-6 ۰ Glucose Oxidase Activity = ∆܄ × ܂ × Sample Dilution Factor = nmol/min/ml = mU/ml III. BioVision Incorporated 155 S. Milpitas Boulevard, Milpitas, CA 95035 USA (b) 1 (a) 0.8 0.6 y = 0.0591x + 0.0459 0.4 0.2 A2 T1 T2 10 µl 0.8 OD 570 nm GOx Developer and GOx Positive Control: Reconstitute with 220 µl Assay Buffer. Pipette up and down several times to completely dissolve the pellet (Don’t vortex). Aliquot and freeze at -20°C. Stable for up to 2 months at -20°C after reconstitution or freeze-thaw cycles (< 5 times). Keep GOx Positive Control on ice while in use. V. Glucose Oxidase Assay Protocol: 1. H2O2 Standard Curve: Add 10 μl 0.88 M H2O2 Standard to 870 μl dH2O to make 10 mM H2O2 Standard. Dilute 10 mM H2O2 Standard further to 1:19 with Assay Buffer to make 0.5 mM H2O2 Standard. Add 0, 2, 4, 6, 8, 10 μl of the diluted 0.5 mM H2O2 Standard into a series of wells of 96-well plate to generate 0, 1, 2, 3, 4, 5 nmol/well H2O2 Standard. For the fluorometric assay, dilute 0.5 mM H2O2 Standard 1:10 with Assay Buffer to make 50 μM H2O2 standard. Add 0, 2, 4, 6, 8, 10 μl of the diluted 50 μM H2O2 standard into a series of wells of 96-well plate to generate 0, 0.1, 0.2, 0.3, 0.4, 0.5 nmol/well H2O2 Standard. Adjust the final volume to 50 μl with Assay Buffer. 6 2. Sample Preparations: Homogenize cells (1×10 ) with 100-200 μl Assay Buffer. Centrifuge at 13,000 g for 10 min to remove the insoluble material. 5-50 μl serum samples can be directly diluted in the Assay Buffer. Add 1-50 μl sample per well, adjust final volume to 50 μl with Assay Buffer. For samples having high background, prepare a parallel sample well as the background control. Note: For unknown samples, we suggest testing several doses to ensure the readings are within the standard curve range. 3. Positive Control: Add 2-10 µl of Positive Control into the desired well(s) & adjust final volume to 50 µl with Assay Buffer. 4. Reaction Mix: Mix enough reagents for the number of assays to be performed. For each well, prepare 50 μl Reaction Mix containing: Reaction Mix Background Control GOx Assay Buffer 36 μl 46 μl GOx Developer 2 μl 2 μl OxiRedTM Probe 2 μl 2 μl GOx Substrate 10 μl ------ Where: B is the H2O2 amount from Standard Curve (nmol). ∆T is the time incubated (min). V is the sample volume added into the reaction well (ml). Unit Definition: One unit of GOx is the amount of enzyme that generates 1.0 μmol of H2O2 per min at 37°C. OD 570 nm Storage and Handling: Store kit at -20°C, protected from light. Warm Assay Buffer to room temperature before use. Briefly centrifuge all small vials prior to opening. Read the entire protocol before performing the assay. IV. Reagent Reconstitution and General Consideration: Add 50 μl of the reaction mix to each well containing samples, Positive Control, and standards. Mix well. Note: The fluorometric assay is ~10 fold more sensitive than the colorimetric assay so dilute the probe 10 times in Assay Buffer & use the same volume (2 μl). Background control mix is recommended for samples having high background. 5. Measurement: Incubate the plate for 5 min at 37°C & measure OD at 570 nm or fluorescence at Ex/Em = 535/585 nm (A1). Incubate for another 15 minutes to 2 hrs at 37°C & again measure (A2). Note: Incubation time depends on the glucose oxidase activity in the samples. We recommend measuring in a kinetic method (preferably every 1–2 min) and choose the period of linear range to calculate the glucose oxidase activity of the samples. If the absorbance exceeds 0.7 OD ~ 15 minutes, dilute the sample and rerun the assay. The H2O2 Standard curve can read in end point mode (i.e. at the end of incubation time). 6. Calculation: Subtract the 0 standard reading from all readings. Plot H2O2 Standard Curve. Calculate the glucose oxidase activity of the test sample: ∆OD = A2 – A1. Apply the ∆OD to the H2O2 Standard Curve to get B nmol of H2O2 generated by Glucose Oxidase during the reaction time (∆T = T2 – T1). 0.6 0.4 A1 0.2 0 µl 0 0 4 6 8 10 0 5 10 15 20 25 nmol H2O2 minutes Figure: H2O2 Standard Curve (a). Glucose oxidase activity in sample (b). Assays were performed following kit protocol. 0 2 VI. Related Products: NAD/NADH Quantification Kit ADP/ATP Ratio Assay Kit Glucose Assay Kit Ethanol Assay Kit Pyruvate Assay Kit Creatine Assay Kit Ammonia Assay Kit Triglyceride Assay Kit Choline/Acetylcholine Quantification Kit Sarcosine Assay Kit Nitric Oxide Assay Kit NADP/NADPH Quantification Kit Ascorbic Acid Quantification Kit Fatty Acid Assay Kit Uric Acid Assay Kit Lactate Assay Kit /II Creatinine Assay Kit Free Glycerol Assay Kit Hemin Assay Kit Total Antioxidant Capacity (TAC) Assay Kit L-amino Acid Assay Kit Glutamate Assay Kit FOR RESEARCH USE ONLY! Not to be used on humans. Tel: 408-493-1800 | Fax: 408-493-1801 www.biovision.com | [email protected] BioVision Rev. 2/13 For research use only GENERAL TROUBLESHOOTING GUIDE: Problems Cause Assay not working • Use of ice-cold assay buffer • Assay buffer must be at room temperature • Omission of a step in the protocol • Refer and follow the data sheet precisely • Plate read at incorrect wavelength • Check the wavelength in the data sheet and the filter settings of the instrument • Use of a different 96-well plate • Fluorescence: Black plates (clear bottoms) ; Luminescence: White plates ; Colorimeters: Clear plates Samples with erratic readings • Use of an incompatible sample type • Refer data sheet for details about incompatible samples • Samples prepared in a different buffer • Use the assay buffer provided in the kit or refer data sheet for instructions • Samples were not deproteinized (if indicated in datasheet) • Use the 10 kDa spin cut-off filter or PCA precipitation as indicated • Use Dounce homogenizer (increase the number of strokes); observe for lysis under microscope • Cell/ tissue samples were not completely homogenized Lower/ Higher readings in Samples and Standards Readings do not follow a linear pattern for Standard curve Unanticipated results Solution • Samples used after multiple free-thaw cycles • Aliquot and freeze samples if needed to use multiple times • Presence of interfering substance in the sample • Troubleshoot if needed, deproteinize samples • Use of old or inappropriately stored samples • Use fresh samples or store at correct temperatures till use • Improperly thawed components • Thaw all components completely and mix gently before use • Use of expired kit or improperly stored reagents • Always check the expiry date and store the components appropriately • Allowing the reagents to sit for extended times on ice • Always thaw and prepare fresh reaction mix before use • Incorrect incubation times or temperatures • Refer datasheet & verify correct incubation times and temperatures • Incorrect volumes used • Use calibrated pipettes and aliquot correctly • Use of partially thawed components • Thaw and resuspend all components before preparing the reaction mix • Pipetting errors in the standard • Avoid pipetting small volumes • Pipetting errors in the reaction mix • Prepare a master reaction mix whenever possible • Air bubbles formed in well • Pipette gently against the wall of the tubes • Standard stock is at an incorrect concentration • Always refer the dilutions in the data sheet • Calculation errors • Recheck calculations after referring the data sheet • Substituting reagents from older kits/ lots • Use fresh components from the same kit • Measured at incorrect wavelength • Check the equipment and the filter setting • Samples contain interfering substances • Troubleshoot if it interferes with the kit • Use of incompatible sample type • Refer data sheet to check if sample is compatible with the kit or optimization is needed • Sample readings above/below the linear range • Concentrate/ Dilute sample so as to be in the linear range Note: The most probable list of causes is under each problem section. Causes/ Solutions may overlap with other problems. BioVision Incorporated 155 S. Milpitas Boulevard, Milpitas, CA 95035 USA Tel: 408-493-1800 | Fax: 408-493-1801 www.biovision.com | [email protected]