1
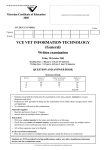
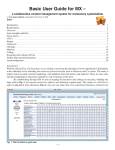
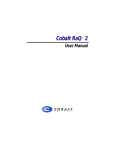
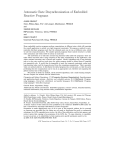
BEHAVIOR
Rapid Analysis of Electronically Monitored Homopteran
Feeding Behavior
WILANT A. VAN GIESSEN1,
2
AND
D. MICHAEL JACKSON
U.S. Vegetable Laboratory, USDAÐARS, 2875 Savannah Highway, Charleston, SC 29414 Ð5334
Ann. Entomol. Soc. Am. 91(1): 145Ð154 (1998)
ABSTRACT Historically, a bottleneck in the analysis of electronically monitored insect feeding
behavior (EMIF) of homopterans has been the conversion of raw waveform data into a format
that is easy to analyze. Here we present an efÞcient method for the analysis of EMIF recordings
using Microsoft Excel, a popular spreadsheet program. Recordings were made with WinDaq,
data-acquisition software from Dataq Instruments. Waveform transitions were saved to Þle using
WinDaqÕs annotation utility. Subsequent data analysis of the WinDaq data Þle was performed
using a custom-designed Microsoft Excel EMIF workbook. After experiment-speciÞc variables
are entered and the data Þle is imported by the user, a complete analysis is performed
automatically. The Excel workbook summarizes the results and generates an output Þle for
further statistical analysis. Any EMIF data Þle containing waveform codes and cumulative time
(i.e., time from the beginning of the recording, in seconds) can be analyzed. The new method
described in this article was used to analyze EMIF recordings of 2 homopteran species, Aphis
gossypii Glover (Aphididae) and Empoasca kraemeri Ross & Moore (Cicadellidae). IdentiÞcation
and Þle export took an average of 5 s per waveform occurrence; the total time required to identify
all waveforms and export them to Þle will depend on the number of occurrences of each
waveform in the EMIF recording, quality of the recording, waveform variability, level of user
experience, and computer speed. The subsequent analysis of each recording with the EMIF
workbook took between 1 and 2 min. Use of the EMIF workbook has the following advantages:
(1) it can be used to analyze EMIF recordings of any homopteran species; (2) it is compatible
with any data acquisition software capable of exporting data Þles containing waveform codes and
cumulative time, as well as with data Þles with a similar format; (3) it can be used in conjunction
with both AC and DC EMIF systems; and (4) it is fast, ßexible, and user-friendly.
KEY WORDS electronic monitoring, electrical penetration graph, data analysis, waveform,
spreadsheet
insect feeding (EMIF)
has been used successfully since 1964 to characterize probing behavior of .50 homopteran species
(McLean and Kinsey 1964, 1965, 1967; for a recent
review, see Backus 1994). This technique has been
used in studies of plant resistance to homopteran
pests (Febvay et al. 1988, Ullman et al. 1988, Montllor and Tjallingii 1989, Calderon and Backus 1992,
Webster et al. 1993, Calatayud et al. 1994, Cole 1994,
Reese et al. 1994, Wayadande 1994, Caillaud et al.
1995), acquisition and transmission of plant viruses
by vectors (Blua and Perring 1992, Powell et al. 1992,
Shuckle and Quiroz 1994), arthropod blood-feeding
behavior (reviewed by Kimsey 1994), and the effects of various control measures on insect feeding
ELECTRONIC MONITORING OF
This article reports the results of research only. Mention of a
proprietary product does not constitute an endorsement or a recommendation by USDA for its use.
1 Department of Plant Pathology and Physiology, Clemson University, 120 Long Hall, Box 340377, Clemson, SC 29634 Ð 0377.
2 Department of Entomology, Wageningen Agricultural University, P.O. Box 8031, NL-6700 EH Wageningen, The Netherlands.
behavior (Saxena and Khan 1985, Hardie et al. 1992,
Powell et al. 1993).
The EMIF system originally designed by McLean
and Kinsey used AC current. Later, Tjallingii (1978,
1988, 1998) developed an EMIF system using DC
current and coined the term electrical penetration
graph (EPG) for the output of an EMIF system. The
output from insect feeding monitors is a variablevoltage signal over time. This variability is caused by
changes in electrical resistance across the feeding
insectÕs stylets (for AC systems), or by changes in
resistance in addition to biologically generated voltage sources (e.g., membrane potentials) for DC
systems (Tjallingii 1998, Walker, 1998). These variations in voltage signal occur in discrete sections of
uniform patterns called waveforms and are correlated with distinct probing and feeding behaviors
(McLean and Kinsey 1967, 1968; Tjallingii 1978,
1985).
Postacquisition analysis of EMIF data formerly
was rather labor-intensive because waveform durations had to be measured manually from paper printouts. A number of researchers have developed soft-
146
ANNALS
OF THE
ENTOMOLOGICAL SOCIETY
ware to record and analyze EMIF data by computer.
Noyes et al. (1990) wrote data acquisition and analysis software in BASIC, C, and 8086 assembly language under MS-DOS for use with AC EMIF systems. For use with DC EMIF systems, Stylet versions
1.0, 2.0, and 2.3 (Tjallingii and Mayoral 1992) and
MacStylet (Febvay et al. 1996) were written in
ASYST (ScientiÞc ÔtoolboxÕ software, Keithley-Metrabyte, Taunton, MA), and QuickBasic, respectively. An upgraded version of MacStylet, written in
C11 and adapted for DOS and PowerPC systems,
is under development (Febvay et al. 1996). Finally,
Gruenhagen and Backus (1996) designed EMIF data
acquisition and analysis software for AC EMIF systems using Streamer (Keithley-Metrabyte), Reßex,
and SuperKey (Borland, Scotts Valley, CA).
Researchers so far were forced to write their own
data acquisition and data analysis software because
professional data acquisition software was too expensive and typically lacked the analysis functions
required for this particular application. To overcome this obstacle, we developed an EMIF analysis
method using commercially available professional
data acquisition software in conjunction with a popular spreadsheet program. EMIF recordings were
made using Windaq (Dataq Instruments, Akron,
OH). Waveform transitions were identiÞed and exported to Þle using the Notepad File utility of
WinDaq/EX (Dataq Instruments). This data Þle (or
any data Þle containing waveform codes and cumulative time) is then imported into a custom-designed
Microsoft Excel EMIF workbook (Excel for Windows, version 5.0 or 7.0, or Excel 97, Microsoft,
Redmond, WA) where it is automatically analyzed.
The EMIF analysis system presented in this article
has the following advantages over existing systems:
(1) it takes advantage of the advanced capabilities
offered by professional data acquisition software
(e.g., real-time display of waveforms during recording), while Microsoft Excel is the most widely used
spreadsheet software; (2) the system can be used in
conjunction with both AC and DC EMIF systems for
use with any homopteran species, and (3) the Excel
EMIF workbook is fast, ßexible, and user-friendly.
Materials and Methods
EMIF Data Acquisition. The EMIF recordings
that were used to develop and test the method
described in this paper were made using 1-channel
or 4-channel versions of an AC electronic insect
feeding monitor (Missouri monitor, produced by
the Electronic Instrument Laboratory, University of
Missouri, Columbia) (Backus and Bennett 1992).
Recordings were made with data acquisition software (WinDaq/200, Dataq Instruments 1994) and
hardware (DI-200 plug-in board [Dataq Instruments 1993] and DI-205 external signal I/O panel, 16
channels, 16-bit resolution, 25-Hz sampling rate
[82,900 Hz max], Dataq Instruments, Akron, OH).
All recordings could be viewed simultaneously and
in real time. Post-acquisition waveform identiÞca-
OF
AMERICA
Vol. 91, no. 1
tion was performed using WinDaq/EX playback and
analysis software.
Waveform Identification. In WinDaq/EX (Dataq
Instruments 1992) (Fig. 1A), the data cursor (Fig.
1B) can be moved along the recorded signal using
the mouse or the left and right arrow keys. With the
cursor at the start of the recording, the keyboard
command Alt-n will bring up the Notepad File window that will prompt the user for a Þlename (use
extension WNF, for WinDaq Notepad File). Use of
the Notepad File function is simple and is described
in detail in the WinDaq manual. Its use will be
brießy summarized here. After bringing up the
Notepad File Function by hitting Alt-n at the beginning of the EMIF data Þle, the user is prompted
to enter the code for the waveform recorded at
time 5 0, which is typically the baseline. The choice
of codes for the different waveforms is entirely up
to the user. However, waveform codes must be 1Ð5
characters long and should all be of identical length.
Next, the data cursor is moved along the signal to the
beginning of the next waveform, and, after pressing
Alt-n, the user enters the code assigned to this next
waveform. This procedure is repeated for all subsequent transitions between adjacent waveforms.
The format of a Windaq Notepad File (WNF) is
illustrated in Fig. 1C. For each waveform code entered by the user, the WNF Þle automatically adds
the time at which the waveform was determined to
begin, and the voltage levels (Fig. 1D, in italics) in
all channels recorded. The latter are not used in the
analysis and are discarded by the Excel EMIF workbook during data import.
Data File Analysis. WNF Þles are analyzed using
a custom-designed Microsoft Excel workbook (Microsoft Excel 5.0, Microsoft Excel for Windows 95
[version 7.0], or Microsoft Excel 97) (Microsoft
1993, 1995, 1995Ð1996) (Fig. 1H). However, data
Þles from other data acquisition software or manually measured or compiled waveform data can also
be analyzed as long as they conform to a simple
2-column formatÑ column 1 contains waveform
codes (1Ð5 characters); column 2 contains the time
that each waveform begins, measured in seconds
from the beginning of the recording (cumulative
time, Fig. 1F), or the duration of each individual
waveform occurrence (Fig. 1G). Which of these 2
data-Þle formats is imported is automatically determined by the Excel EMIF workbook during import.
The EMIF workbook consists of a title page followed by 7 so-called worksheets (Fig. 1H). To accommodate use of the EMIF workbook with monitors with different resolutions, the user can select
from 5 different zoom factors on each worksheet
(Fig. 2G). Each worksheet also has a “..” and a “,,”
button (Fig. 2H) to page forward and backward
through the workbook. Even though these buttons
are present on all 7 worksheets, they are shown only
for worksheet II in Fig. 2. Each worksheet is described in detail below.
January 1998
VAN
GIESSEN
AND
JACKSON: ELECTRONICALLY MONITORED FEEDING BEHAVIOR
147
Fig. 1. Diagram of a new method to analyze recordings of electronically monitored insect feeding behavior (EMIF).
Waveforms are identiÞed by the user using WinDaq/EX postacquisition software (A). The data cursor (B) is moved
across the signal to the transition between 2 successive waveform occurrences, and the “Notepad File” utility is used
to save a code that speciÞes the type of waveform following the transition to a Windaq Notepad File (WNF) (C). Along
with each waveform code entered by the user, a WNF Þle automatically stores the time at which the corresponding
waveforms were determined to begin (0.00E 1 00, 3.46E 1 01, 6.51E 1 01, and others). Following the times, the WNF
Þle also automatically stores the voltage levels (in italics, D), but these are not used in the analysis and are discarded
during data import (E). Data import is not limited to WNF Þles. Any EMIF Þle that adheres to a simple 2-column format
can be imported (F, G). The 1st column must contain the waveform codes, and the 2nd column must contain either
the start of each waveform from the beginning of the recording (F), or the duration of each individual waveform (G).
Data Þles are imported (E) into worksheet III of the EMIF Workbook (H). This Microsoft Excel EMIF workbook consists
of 7 individual worksheets. The arrows (I) indicate the ßow of information among the worksheets. Worksheet I explains
how the workbook is organized, how data Þles are analyzed, and provides the user with a guided tour through the entire
workbook. Experiment-speciÞc variables are entered into worksheet II (see Fig. 2), and EMIF data Þles are imported
into worksheet III (see Fig. 3). In worksheet IV, information from worksheets II and III is used to analyze the data Þle
(see Fig. 4). Results are summarized in worksheet V (see Fig. 5a), are formatted for further statistical analysis in
worksheet VI (see Fig. 5b), and are presented graphically in worksheet VII (see Fig. 6).
Worksheet I—Instructions. The procedure the
user needs to follow to analyze an EMIF data Þle
successfully is presented in worksheet I.
Worksheet II—Specifics. Experiment-speciÞc variables (Fig. 2A) and 3 custom variables (Fig. 2B) can
be entered in worksheet II. The names “custom1,”
“custom2,” and “custom3” can be changed to whatever the user desires. On the right side of worksheet
II, the codes that the user wants to assign to each
waveform (described above under “waveform identiÞcation”) are entered (Fig. 2C). The 1st code
entered must be for baseline (“z” in the example in
148
ANNALS
OF THE
ENTOMOLOGICAL SOCIETY
OF
AMERICA
Vol. 91, no. 1
Fig. 2. Example of worksheet II of the Excel workbook
for the analysis of electronically monitored insect feeding
behavior. Only the shaded areas contain information entered by the user. The information in this Þgure is merely
a speciÞc example. On the left side of this worksheet, the
user enters experiment-speciÞc variables such as experiment code, Þlename, date, etc. (A), and 3 custom variables
(B) (in this example custom variable 1 has been assigned
the name “morph”). On the right of this worksheet, the
user deÞnes the (10 possible) codes assigned to the various
waveforms (C), and the number of characters (1Ð5) used
for waveform codes (D). Depending on the speed of the
computer, the user can toggle between automatic and
manual recalculation by pressing the button positioned
next to, in this case, “manual” (E). Any remarks pertaining
to the recording can be entered at the bottom of this
worksheet (F). To accommodate use of the EMIF workbook with monitors with different resolutions, the user can
select from 5 different zoom factors (80, 100, 120, 140, and
160%) (G). In addition, each worksheet has a “Sheet Forward” (..) and a “Sheet Backward” (,,) button (H) to
move forward and backward through the EMIF workbook.
Even though these buttons are present on all 7 worksheets,
they are shown only in this Þgure.
Fig. 3. Example of worksheet III of the Excel workbook for the analysis of electronically monitored insect
feeding behavior. By pressing 1 of 2 buttons (A), the user
can import data Þles with various formats (see Fig. 1 C, F,
and G). In addition, data can be typed directly into this
worksheet or data can be cut and pasted from other Excel
Þles or other applications. After importing a data Þle,
waveforms that are not speciÞed in worksheet II are
marked with an “x” (coding error), and waveform codes
that occur twice in a row are indicated by a “1” (duplication error) (B). Pressing the button labeled “Show Errors” (C) will reduce the visible part of the data Þle to just
the detected coding and duplication errors (D) to facilitate correction of long data Þles. Pressing the button labeled “Show All” will again show the complete data Þle.
Fig. 2). Up to 10 waveform codes can be entered, in
no particular order. The user must specify the number of characters (1Ð5) used for waveform codes
below this list (Fig. 2D). As noted previously, all
waveform codes must have the same number of
characters. Any remarks pertaining to the recording
can be entered at the bottom of this worksheet (Fig.
2F).
Each time the user enters information, Microsoft
Excel automatically recalculates all the formulas
contained in all the worksheets in the workbook.
Automatic calculation will substantially slow down
analysis on older computers. Therefore, the default
setting for calculation is “manual.” This means that
after all appropriate changes have been made to the
workbook, the user should press function key F9 to
instruct Excel to recalculate all formulas. On faster
computers, the user can change calculation to “automatic” by pressing a button on worksheet II (Fig.
2E).
A custom EMIF workbook can be created (e.g.,
tailored to a particular insect species or experiment)
by saving a version of the workbook with a custom
set of variables and waveform codes under a unique
Þlename.
Worksheet III—Data. EMIF data Þles are imported into the EMIF workbook by pressing 1 of 2
buttons positioned on worksheet III (Fig. 3A). The
button labeled “WNF Format” lets the user import
WinDaq Notepad Files, and the button labeled
“EMIF data File” permits the user to load any data
Þle conforming to the aforementioned 2-column
January 1998
VAN
GIESSEN
AND
JACKSON: ELECTRONICALLY MONITORED FEEDING BEHAVIOR
149
Fig. 4. Example of worksheet IV of the Excel workbook for the analysis of electronically monitored insect feeding
behavior. In this worksheet, data Þles (indicated in gray) (A) are analyzed automatically after import. Parameters such
as total number, total duration, average duration, and percentage (total duration of a waveform/total duration of
recording) are calculated for each waveform (B) through automatic sorting of the waveform durations from the dataÞle
into the respective worksheet columns assigned to each waveform (C). Also, the start of each successive probe is
automatically determined (D), and a number of probe parameters are calculated (E). To the right of the experimentspeciÞc variables listed at the top of the worksheet (F), a number of checks (G) provide the user with an easy way to
check for errors (CE 5 coding errors; DE 5 duplication errors; the labels “percent,” “total,” “count,” and “probe” refer
to 4 internal checks). In addition, “x” or “1” signs will appear in the column (headed E) next to the waveform codes
(H) to indicate coding and duplication errors, respectively (similar to worksheet III, see Fig. 3). In the example in this
Þgure, no such errors were detected.
formats. Import of both Þle types is performed using
Microsoft ExcelÕs “Text Import Wizard” (a Wizard
is an interactive feature in modern software guiding
the user through a multistep procedure). While
using the “Text Import Wizard” to import WNF Þles,
the user should designate the comma as delimiter.
For import of any other EMIF data Þles, the comma,
tab, semicolon, space, or any user-deÞned delimiter
can be used. The user also can enter data directly
into worksheet III, or copy and paste data from
another Excel Þle or from another application. In
these cases, the user must add the word ÔendÕ to the
bottom of the column with the waveform codes
(during automated data import as described above,
“end” is added automatically).
After data import, coding and duplication errors
are automatically detected and reported. A coding
error is a discrepancy between the waveform codes
150
ANNALS
OF THE
ENTOMOLOGICAL SOCIETY
OF
AMERICA
Vol. 91, no. 1
Fig. 5. Examples of worksheets V and VI of the Excel workbook for the analysis of electronically monitored insect
feeding behavior. Worksheet V (a) lists, apart from the experiment-speciÞc variables (A), a number of parameters for
each waveform (B) and a number of probe parameters (C). The user can print out the summary by pressing button (D).
Worksheet VI (b) presents the data in a format suitable for appending it to similar Þles for further statistical analysis.
entered by the user in worksheet II (“SpeciÞcs”),
and the codes encountered in the imported data Þle.
Codes not previously speciÞed in worksheet II are
marked with an “x” in this worksheet (Fig. 3B) and
in worksheet IV (Fig. 4H). Such discrepancies could
be caused either by an oversight when listing codes
in worksheet II or a typographical error in the waveform column of the imported data Þle. Similarly, a
waveform code listed twice in a row (duplication
error) will be marked by a plus sign (1) (Figs. 3B
and 4H). Pressing the button labeled “Show Errors”
(Fig. 3C) will reduce the visible part of the data Þle
to just the detected errors (Fig. 3D), facilitating
correction of long data Þles. Pressing the “Show All”
button will again show the complete data Þle.
Worksheet IV—Analysis. In worksheet IV, the duration of each individual waveform occurrence is
calculated and copied to the column assigned to that
waveform code (Fig. 4C). This facilitates calculation of the total number of occurrences, the total
and average duration, and the percentage of the
total recording for each waveform (Fig. 4B). Also,
the start of each subsequent probe is determined (as
the transition between baseline and any other waveform, Fig. 4D), and the total number of probes, the
total and average probe duration, and the percent-
age of the whole recording spent probing are calculated (Fig. 4E). As was the case in worksheet III,
“x” or “1” signs will appear in the column left of the
waveform codes (Fig. 4H) to indicate coding and
duplication errors, respectively. (In the example
given in Fig. 4, no errors were detected.) After
eliminating any coding or duplication errors in
worksheet III, the internal checks (“percent,” “total,” “count,” and “probe”) at the top of worksheet
IV should indicate “OK”, and CE (number of coding
errors) and DE (number of duplication errors)
should be 0 (Fig. 4G). If this is not the case, there
may be an error in the cumulative time column (e.g.,
not all numbers increase successively going down
the time column), which may require editing of the
original EMIF data Þle before import into worksheet
III.
Worksheet V—Summary. Apart from the experiment-speciÞc variables (Fig. 5A), worksheet V lists
the waveform parameters (Fig. 5B) and probing
parameters (Fig. 5C) calculated in worksheet IV.
The user can print out the summary by pressing a
button on the worksheet (Fig. 5D).
Worksheet VI—Statistics. The information provided by the user in worksheet II and the results
from the analysis in worksheet IV are automatically
January 1998
VAN
GIESSEN
AND
JACKSON: ELECTRONICALLY MONITORED FEEDING BEHAVIOR
151
Fig. 6. Example of worksheet VII of the Excel workbook for the analysis of electronically monitored insect feeding
behavior. The distribution in time and the average duration of the different waveforms are presented in a bar graph,
with the experiment-speciÞc variables listed underneath.
combined into an output Þle in worksheet VI. Its
format facilitates appending it to similar Þles for
further statistical analysis (SAS Institute 1989).
Worksheet VII—Graphs. The percentage distribution of the various waveforms is presented in a bar
graph in worksheet VII (Fig. 6). A 2nd bar graph
shows the average duration of each waveform. The
graph can be printed out by pressing a button on the
worksheet.
System Requirements. WinDaq software (or its
older DOS version CODAS; Dataq Instruments
1990), Microsoft Excel 5.0, Microsoft Excel for Windows 95, and Microsoft Excel 97 run under Microsoft Windows 3.1 or Microsoft Windows 95/NT.
The EMIF workbook can also be used with Microsoft Excel for Macintosh (M. Serrano, personal
communication). The Þle size of the EMIF workbook is 2.02 MB. At least 16 MB of RAM is required
for the workbook to run properly.
EMIF Analysis. The method described in this
article was used to analyze EMIF recordings of 2
homopteran species. Recording A was made of an
apterous virginoparous cotton aphid, Aphis gossypii
Glover (Homoptera: Aphididae), feeding on Mexican lime, Citrus aurantifolia Swingle, provided by
Ray K. Yokomi (Horticultural Research Laboratory,
USDAÐARS Orlando, FL). EMIF recording B (not
shown) was made of an adult female leafhopper,
Empoasca kraemeri Ross & Moore (Homoptera: Cicadellidae), feeding on Phaseolus vulgaris L. (common bean, cultivar BAT41), provided by Miguel S.
Serrano (Department of Entomology, University of
Missouri, Columbia, MO). To determine the speed
with which these 2 recordings could be analyzed, we
timed the various analysis steps.
Results and Discussion
Previously developed software for acquisition and
analysis of EMIF data has certain disadvantages. The
software written by Noyes et al. (1990) was found
to be incompatible with other computers (J. C.
Reese, personal communication), and Stylet
(Tjallingii and Mayoral 1992), MacStylet (Febvay et
al. 1996), and the system developed by Gruenhagen
and Backus (1996) do not provide real-time onscreen display during data acquisition. However,
during use of either program, the signal being recorded can be viewed on a chart recorder or oscilloscope. Because recordings can last many hours
and several insects may be monitored simultaneously, being able to view all recordings in real
time is very convenient. Problems can be spotted
during recording and possibly corrected. Also, in
152
ANNALS
OF THE
ENTOMOLOGICAL SOCIETY
Fig. 7. Analysis of 2 recordings of electronically monitored insect feeding behavior. Recording A is of an adult
apterous virginoparous A. gossypii (cotton aphid) feeding
on C. arantifolii (Mexican lime). Recording B is of an adult
female of E. kraemeri (leafhopper), feeding on P. vulgaris
(common bean).
OF
AMERICA
Vol. 91, no. 1
the system developed by Gruenhagen and Backus
(1996), the complete data Þle must be converted to
ASCII format, after which the user must add a time
column to the variable voltage column. In addition,
the user must keep track of probe numbers manually.
All of the data acquisition programs described
above were written by the users. Commercially
available data acquisition software is likely to be
more sophisticated than these programs, but are
relatively expensive (.$2,500). However, the high
initial costs of professional data acquisition software
is compensated for by the considerable time savings
of researchers not having to develop their own software. Most data acquisition software provides realtime display of waveforms, while the user is presented with various tools to explore the signal after
recording. For instance, in WinDaq/EX, it is possible to zoom in on sections of the recorded signal to
examine waveform transitions in more detail.
In addition to cost, the lack of speciÞc tools for the
analysis of EMIF data has been another obstacle for
the use of professional data-acquisition software.
Use of the EMIF workbook removes this obstacle,
and has the following advantages over currently
available systems:
Waveform Code Flexibility. Unlike STYLET, the
EMIF workbook can be tailored to the different sets
of waveforms generated by various homopteran species (e.g., aphids, planthoppers, leafhoppers, whiteßies, psyllids). In addition, the user can use codes of
up to 5 characters long.
Data File Compatibility. The EMIF workbook can
be used in conjunction with all data acquisition
software capable of exporting waveform codes and
cumulative time, and all data Þles with a 2-column
format (column 1: waveform code; column 2: cumulative time; see Fig. 1). The same format can be
achieved if waveform codes and transition times are
compiled by hand.
EMIF System Compatibility. Originally, the EMIF
workbook was developed for use with WinDaq and
the Missouri AC insect feeding monitor (Backus and
Bennett 1992). However, the workbook can be used
for the analysis of EMIF recordings made with any
other data acquisition software with signals from
either AC or DC systems.
Speed of Analysis. We timed the steps involved in
the analysis of recordings A (A. gossypii on C. aurantifolii, duration: 4 h) and B (E. kraemeri on P.
vulgaris, duration: 2.8 h) (Fig. 7). Using WinDaqÕs
Notepad Utility, the identiÞcation and separation of
the 73 waveform occurrences contained in recording A took 5 min and 40 s, whereas it took '30 min
to identify and separate the 351 waveforms occurrences in recording B. This means that it took approximately 5 s to identify a single waveform occurrence and save it to Þle. Obviously, the time
needed to recognize and mark various waveforms
will depend on the quality of the recording, waveform variability, the number of waveforms to iden-
January 1998
VAN
GIESSEN
AND
JACKSON: ELECTRONICALLY MONITORED FEEDING BEHAVIOR
tify, the level of experience of the user, and computer speed.
The time spent analyzing recording A using the
EMIF workbook can be subdivided as follows: (1)
60 s to Þll out the speciÞc experimental variables in
worksheet II (this will take less time when a series
of similar Þles are being analyzed); (2) between 20 s
(using a 200-MHz Pentium Pro PC) and 45 s (using
a 66-MHz Pentium PC) to import the data Þle into
the workbook; (3) 10 Ð20 s to rename and save the
workbook to ßoppy or hard disk, depending on the
computer used. This means that the complete analysis of recording A took between 1 and 2 min. The
analysis of recording B (351 waveforms) took only
slightly longer.
Reliable pattern recognition software to characterize waveforms automatically has yet to be developed. Tjallingii (1988) and Rahbé et al. (1998) investigated whether signal analysis through Fourier
processing could lead to automated recognition, but
they were not successful. The major reason for this
lack of success is the enormous variability inherent
to EMIF data (Tjallingii 1988). No doubt, advances
in pattern recognition will facilitate this in the future (we are exploring new approaches). However,
until reliable pattern recognition software is developed, the human eye is superior in distinguishing
the sometimes subtle waveform transitions.
Studying various aspects of insectÐplant relationships through the use of EMIF usually involves many
hours of recordings. Clearly, combining the
strengths of WinDaq and Excel now substantially
increases the speed with which these recordings can
be analyzed. The Microsoft Excel EMIF workbook
is currently being used in the Department of Entomology, University of Missouri, Columbia (E. A.
Backus, personal communication), and at the Department of Entomology, University of California,
Riverside (G. P. Walker, personal communication).
A copy of the EMIF workbook can be obtained
free of charge from W.A.v.G. However, we will be
able to offer only limited technical support.
Acknowledgments
We are grateful to Miguel Serrano and Ray Yokomi for
the use of their EMIF recordings. We also thank Elaine
Backus, Jennifer Grob, Rufus Isaacs, Layna Reed, Miguel
Serrano, Freddy Tjallingii, Greg Walker, Sarah Alice
Wyndham, and Ray Yokomi for their helpful comments on
the manuscript. This is Technical Contribution No. 4217,
South Carolina Agricultural Experiment Station, Clemson
University, Clemson, SC.
References Cited
Backus, E. A. 1994. History, development and applications of the electronic insect feeding monitor, pp. 1Ð51.
In M. M. Ellsbury, E. A. Backus, and D. L. Ullman
[eds.], History, development, and application of AC
electronic insect feeding monitors. Thomas Say Publications in Entomology: Proceedings. Entomological
Society of America, Lanham, MD.
153
Backus, E. A., and W. H. Bennett. 1992. A new AC electronic insect feeding monitor for Þne-structure analysis
of waveforms. Ann. Entomol. Soc. Am. 85: 437Ð 444.
Blua, M. J., and T. M. Perring. 1992. Effects of zucchini
yellow mosaic virus on colonization and feeding behavior of Aphis gossypii (Homoptera: Aphididae) alatae. Environ. Entomol. 21: 578 Ð585.
Caillaud, C. M., J. S. Pierre, B. Chaubet, and J. P. Di Pietro.
1995. Analysis of wheat resistance to the cereal aphid
Sitobion avenae using electrical penetration graphs and
ßow charts combined with correspondence analysis.
Entomol. Exp. Appl. 75: 9 Ð18.
Calatayud, P. A., Y. Rahbé, W. F. Tjallingii, M. Tertuliano,
and B. Le Ru. 1994. Electronically recorded feeding
behaviour of cassava mealybug on host and non-host
plants. Entomol. Exp. Appl. 72: 219 Ð232.
Calderon, J. D., and E. A. Backus. 1992. Comparison of
the probing behaviors of Empoasca fabae and E. kraemeri (Homoptera, Cicadellidae) on resistant and susceptible cultivars of common beans. J. Econ. Entomol.
85: 88 Ð99.
Cole, R. A. 1994. Locating a resistance mechanism to the
cabbage aphid in two wild Brassicas. Entomol. Exp.
Appl. 71: 23Ð31.
Dataq Instruments. 1990. Advanced CODAS, userÕs manual, software release level 3, manual revision C. Dataq
Instruments, Akron, OH.
1992. Windaq and Windaq/EX userÕs guide, software
release level 1.31, manual revision C. Dataq Instruments, Akron, OH.
1993. DI-200 PGH/PGL software-conÞgurable analog
and digital I/O board, userÕs manual, manual revision C.
Dataq Instruments, Akron, OH.
1994. Windaq/200 userÕs manual, manual revision C.
Dataq Instruments, Akron, OH.
Febvay, G., Y. Bonnin, R. Bournocille, S. Delrot, and J. L.
Bonnemain. 1988. Resistance of different lucerne cultivars to the pea aphid Acyrthosiphon pisum: inßuence
of phloem composition on aphid fecundity. Entomol.
Exp. Appl. 48: 127Ð134.
Febvay, G., Y. Rahbé, and M. van Helden. 1996. MacStylet, software to analyse electrical penetration graph
data on the Macintosh. Entomol. Exp. Appl. 80: 105Ð
108.
Gruenhagen, N. M., and E. A. Backus. 1996. An inexpensive analog-to-digital system for computer-assisted
measurement of electronic monitoring waveforms. J.
Agric. Entomol. 13: 73Ð78.
Hardie, J., M. Holyoak, N. J. Taylor, and D. C. Griffiths.
1992. The combination of electronic monitoring and
video-assisted observations of plant penetration by
aphids and behavioural effects of polygodial. Entomol.
Exp. Appl. 62: 233Ð239.
Kimsey, R. B. 1994. Measuring and recording arthropod
blood feeding, pp. 122Ð128. In M. M. Ellsbury, E. A.
Backus, and D. L. Ullman [eds.], History, development,
and application of AC electronic insect feeding monitors. Thomas Say Publication in Entomology: Proceedings. Entomological Society of America, Lanham, MD.
McLean, D. L., and M. G. Kinsey. 1964. A technique for
electronically recording aphid feeding and salivation.
Nature (Lond.) 203: 1358 Ð1359.
1965. IdentiÞcation of electrically recorded curve patterns associated with aphid salivation and ingestion.
Nature (Lond.) 205: 1130 Ð1131.
1967. Probing behaviour of the pea aphid Acyrthosiphon
pisum. I. DeÞnitive correlation of electronically re-
154
ANNALS
OF THE
ENTOMOLOGICAL SOCIETY
corded waveforms with aphid probing. Ann. Entomol.
Soc. Am. 60: 400 Ð 406.
1968. Probing behaviour of the pea aphid, Acyrthosiphon
pisum. II. Comparison of salivation and ingestion in
host and non-host plant leaves. Ann. Entomol. Soc. Am.
61: 730 Ð739.
Microsoft. 1993. Microsoft Excel version 5.0, userÕs manual. Microsoft, Redmond, WA.
1995. Getting results with Microsoft OfÞce for Windows
95, version 7.0. Microsoft, Redmond, WA.
1995–1996. Getting results with Microsoft OfÞce 97. Microsoft, Redmond, WA.
Montllor, C. B., and W. F. Tjallingii. 1989. Stylet penetration by two aphid species on susceptible and resistance lettuce. Entomol. Exp. Appl. 52: 103Ð111.
Noyes, S., D. C. Margolies, J. C. Reese, A. Dixon, and P. J.
Bramel-Cox. 1990. Computer acquisition and analysis
of insect feeding monitor data. Ann. Entomol. Soc. Am.
83: 1224 Ð1231.
Powell, G., R. Harrington, and N. J. Spiller. 1992. Stylet
activities and potato virus Y vector efÞciencies by the
aphids Brachycaudus helichrysi and Drepanosiphum
platanoidis. Entomol. Exp. Appl. 62: 293Ð300.
Powell, G., J. Hardie, and J. A. Pickett. 1993. Effects of the
antifeedant polygodial on plant penetration by aphids,
assessed by video and electrical monitoring. Entomol.
Exp. Appl. 68: 193Ð200.
Rahbé, Y., G. Febvay, B. Delobel, and G. Bonnot. 1998.
Amino acids and proteins as cues in aphid-plant interactions. In G. P. Walker and E. A. Backus [eds.], Principles and applications of electronic monitoring and
other techniques in the study of homopteran feeding
behavior. Thomas Say Publications in Entomology:
Proceedings. Entomological Society of America, Lanham, MD (in press).
Reese, J. C., D. C. Margolies, E. A. Backus, S. Noyes, P. J.
Bramel-Cox, and A.G.O. Dixon. 1994. Characterization of aphid host plant resistance and feeding behavior
through use of a computerized insect feeding monitor,
pp. 52Ð72. In M. M. Ellsbury, E. A. Backus, and D. L.
Ullman [eds.], History, development, and application
of AC electronic insect feeding monitors. Thomas Say
Publications in Entomology: Proceedings. Entomological Society of America, Lanham, MD.
SAS Institute. 1989. SAS/STAT userÕs guide, version 6,
4th ed. SAS Institute, Cary, NC.
Saxena, R. C., and Z. R. Khan. 1985. Electronically recorded disturbances in feeding behavior of Nephotettix
virescens (Homoptera: Cicadellidae) on neem oiltreated rice plants. J. Econ. Entomol. 78: 222Ð226.
Shuckle, R. H., and C. Quiroz. 1994. Use of the electronic
monitor for the study of aphids as vectors of barley
yellow dwarf virus, pp. 106 Ð121. In M. M. Ellsbury, E. A.
Backus, and D. L. Ullman [eds.], History, development,
OF
AMERICA
Vol. 91, no. 1
and application of AC electronic insect feeding monitors, Thomas Say Publications in Entomology: Proceedings. Entomological Society of America, Lanham,
MD.
Tjallingii, W. F. 1978. Electronic recording of penetration behaviour by aphids. Entomol. Exp. Appl. 24: 721Ð
730.
1985. Electrical nature of recorded signals during stylet
penetration by aphids. Entomol. Exp. Appl. 38: 177Ð186.
1988. Electrical recording of stylet penetration activities, pp. 95Ð108. In A. K. Minks and P. Harrewijn [eds.],
World crop pests. AphidsÑtheir biology, natural enemies and control, vol. 2A. Elsevier, Amsterdam.
1998. Comparison of AC and DC systems for electronic
monitoring of stylet penetration activities by homopterans. In G. P. Walker and E. A. Backus [eds.],
Principles and applications of electronic monitoring
and other techniques in the study of homopteran feeding behavior. Thomas Say Publications in Entomology:
Proceedings. Entomological Society of America, Lanham, MD (in press).
Tjallingii, W. F., and A. Mayoral. 1992. Criteria for hostplant acceptance by aphids, pp. 280 Ð282. In Proceedings of the 8th International Symposium on InsectPlant Relationships, Wageningen, 9 Ð13 March 1992.
Kluwer Academic, Dordrecht.
Ullman, D. E., C. O. Qualset, and D. L. McLean. 1988.
Feeding responses of Rhopalosiphum padi (Homoptera: Aphididae) to barley yellow dwarf virus resistant and susceptible barley varieties. Environ. Entomol. 17: 988 Ð991.
Walker, G. P. 1998. A beginnerÕs guide to electronic monitoring of homopteran probing behavior. In G. P.
Walker and E. A. Backus [eds.], Principles and applications of electronic monitoring and other techniques
in the study of homopteran feeding behavior. Thomas
Say Publications in Entomology: Proceedings. Entomological Society of America, Lanham, MD (in
press).
Wayadande, A. C. 1994. Electronic monitoring of leafhoppers and planthoppers: feeding behavior and application in host-plant resistance studies, pp. 86 Ð105. In
M. M. Ellsbury, E. A. Backus, and D. L. Ullman [eds.],
History, development, and application of AC electronic insect feeding monitors. Thomas Say Publications in Entomology: Proceedings. Entomological Society of America, Lanham, MD.
Webster, J. A., D. R. Porter, C. A. Baker, and D. W.
Mornhinweg. 1993. Resistance to Russian wheat
aphid (Homoptera: Aphididae) in barley: effects on
aphid feeding. J. Econ. Entomol. 86: 1603Ð1608.
Received for publication 10 June 1997; accepted 3 October
1997.