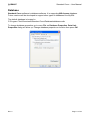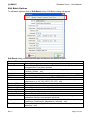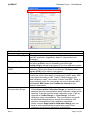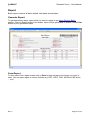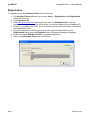
1
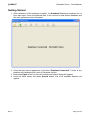
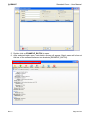
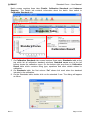
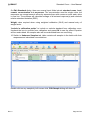
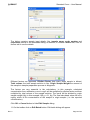
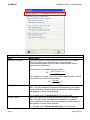
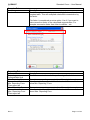
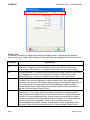
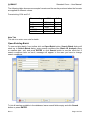
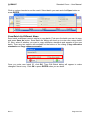
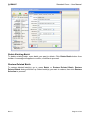
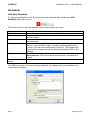
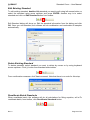
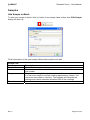
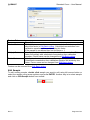
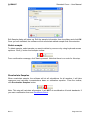
CHEMIASOFT Standard Curve Software Manual Revision 2 January 19, 2015 By CHEMIASOFT TEAM www.chemiasoft.com Note: There might be some differences between this manual and the software due to continuous development. For the latest version of this manual please refer to online version. CHEMIASOFT Standard Curve – User Manual Table of Content About ................................................................................................................................... 3 Features............................................................................................................................... 4 Getting Started.................................................................................................................... 5 Database............................................................................................................................ 11 Batches.............................................................................................................................. 12 Create New Batch ............................................................................................................12 Edit Batch Options ...........................................................................................................13 Open Existing Batch.........................................................................................................19 Save Batch As Different Name ........................................................................................20 Delete Existing Batch .......................................................................................................21 Restore Deleted Batch .....................................................................................................21 Standards .......................................................................................................................... 22 Add New Standard ...........................................................................................................22 Edit Existing Standard......................................................................................................23 Delete Existing Standard..................................................................................................23 Recalibrate Batch Standards ...........................................................................................23 Samples............................................................................................................................. 24 Add Sample to Batch .......................................................................................................24 Edit Sample......................................................................................................................25 Delete sample ..................................................................................................................26 Recalculate Samples .......................................................................................................26 Report ................................................................................................................................ 27 Generate Report ..............................................................................................................27 Save Report .....................................................................................................................27 Registration....................................................................................................................... 28 Rev. 2 Page 2 of 28 CHEMIASOFT Standard Curve – User Manual About Standard Curve is defined as the easiest way to graph calibration curve from standard solutions and identify unknown samples in laboratory. There is no need to use MS Excel to make calculations and pain full process. Standard Curve made it easy for you. Calibration is at the heart of chemical analysis, and is the process by which the response of an instrument (in metrology called ‘‘indication of the measuring instrument’’) is related to the value of the concentration of the analyte. A typical example in analytical chemistry is the calibration of a GC (gas chromatography) analysis. The heights of GC peaks are measured as a function of the concentration of the analyte in a series of standard solutions (‘‘calibration solutions’’) and a linear equation fitted to the data. Standard Curve is robust industrial productivity software. It has been developed in real laboratory world. Width Standard Curve, laboratory routine work becomes easy. In addition, all data will be saved in local computer database and it can be backed up at anytime. Start using Standard Curve today and make your life easy. Rev. 2 Page 3 of 28 CHEMIASOFT Standard Curve – User Manual Features • Easy to use and straight forward. • Support MS Access database. • Create unlimited number of batches. Every batch includes calibration curve and unknown samples. • Graph and run calibration curve from standard solutions and identify unknowns. • Several types of trend line fitting include (Linear, Quadratic, Logarithmic base 10, Exponential, Power and Natural Logarithmic). • Support both Ordinary Least Square (OLS) and Weighted Least Square (WLS) calibration methods. • Accept single or multiple measurement values (like absorbance, peak area or peak height) and calculate average and RSD. • Include or exclude standards from calibration curve. • Graph calibration points and trend line. • Display calibration result in table (like fitting equation, standard errors for equation parameters, coefficient of determination and standard regression error (also called residual standard deviation). • Calculate concentration of unknown samples based on calibration curve. • Support several multiplication factors to finalize calculation in origin samples. For example (Dilution factor, total volume and initial sample weight). • Calculate method detection limits (MDL) as per ISO-11843-2, Hubaux & Vos and SEMI standard method. • Set quantification limits and final reporting limits. • Generate professional batch report, includes standards, calibration curve and unknowns. • Export report as PDF, MS Excel, Image and Email and other formats. • Print and export graph as PDF and image. • Search batches using several inputs like batch ID, analyte, analysis, method, creation date and modification date. • Rev. 2 Delete and restore batches Page 4 of 28 CHEMIASOFT Standard Curve – User Manual Getting Started 1. After installation of the software complete, run Standard Curve from desktop icon or from start menu. Once the software start, it will connect to local default database and the main software screen will appear 2. Once the main screen appeared, it will show “Database Connected”. If there is any problem with database then refer to Database section. 3. Now press Open button on the main toolbar and search dialog will appear. 4. Leave all fields empty and press Search button. List of all available batches will appear. Rev. 2 Page 5 of 28 CHEMIASOFT Standard Curve – User Manual 5. Double click on EXAMPLE_BATCH to open. 6. After selected batch open, main batch screen will appear. Batch name will show at title bar of the software between two brackets [EXAMPLE_BATCH]. Rev. 2 Page 6 of 28 CHEMIASOFT Standard Curve – User Manual Batch screen contains three tabs (Details, Calibration Standards and Unknown Samples). The Details tab contains information about the batch. Now switch to Calibration Standards tab. Standards Table Standard Curve Calibration Result 7. On Calibration Standards tab screen become three parts, Standards table at the top which list all calibration standard solutions, Standard curve area at the left bottom shows the calibration curve. On the bottom right area there is Calibration Result table which contains fitting type, equations and other details related to calibration. 8. On Standards table, the first column “Cal” shows tick mark when the standard included in the calibration. 9. On the Standards table, double click on the standard 2 row. The dialog will appear as follow. Rev. 2 Page 7 of 28 CHEMIASOFT Standard Curve – User Manual On Edit Standard dialog, there are several input fields include standard name, level, remark, concentration and responses. The concentration must be single value, but responses can accept several values by separate them with comma or enter each value in new line. The software will calculate average of all entered response(s) and calculate relative standard deviation (RSD). Weight value required when using weighted calibration (WLS) and manual entry of weight factor. “Include in calibration points” to include or exclude standard from calibration curve. Uncheck the box to exclude from calibration and press OK to see the effect. Equation will be recalculated. All samples also will be recalculated base on new fitting. 10. Switch to Unknown Samples tab, table contains all samples in the batch with their responses and calculated concentrations Double click on any sample by left mouse click, Edit Sample dialog will show up Rev. 2 Page 8 of 28 CHEMIASOFT Standard Curve – User Manual The dialog contains sample input details, like (sample name, order number and responses) similar to the standards dialog. In addition, it contains Factors tab, click on factors tab to see the details. Different factors are appeared. Dilution Factor, how many times sample is diluted. Total volume, the total sample solution in liter. Origin Sample Weight the amount of the sample in sample preparation process in kilograms. The factors are very essential in lab calculations. In this example, calculated concentration from calibration curve in mg/L will be multiplied by dilution factor and then multiplied by total volume of the sample solution. The result will be divided by origin sample weight (Kg) in this example 100 g = 0.1 Kg. The final calculated value will be in mg/kg, which is the concentration of the analyte in origin sample. (i.e. the reported concentration). Click OK or Cancel button to hide Edit Sample dialog. 11. On the toolbar click on Edit Batch button. Edit batch dialog will appear Rev. 2 Page 9 of 28 CHEMIASOFT Standard Curve – User Manual Edit Batch dialog contains all information about the batch and calibration. At the top there are several tabs, you can switch between tabs and discover the details. Make some changes and press OK button to see the effect. That is all for now. Please refer to the Table of Content (page 2) and find out more details. If you can’t find answer of your question, please contact us by sending an email to [email protected] Rev. 2 Page 10 of 28 CHEMIASOFT Standard Curve – User Manual Database Standard Curve software is database software. It is supporting MS Access database. Future versions will be developed to support other types of databases Like MySQL. The default database is located in: C:\Program Files\Chemiasoft\Standard Curve\Database\database.mdb To change database properties go to menu File >> Database Properties. Data Link Properties dialog will show up. Change database properties or location then press OK. Rev. 2 Page 11 of 28 CHEMIASOFT Standard Curve – User Manual Batches In Standard Curve software, every collection of calibration standards and unknowns called a “batch”. Create New Batch To create new batch, from toolbar click New Batch button, enter a unique name of the batch and press OK. If the batch name is unique, the name will be reserved in the database. It is preferred to have unique naming system of all batches in lab. For example, use batch name derived from date of analysis like if a batch analyzed on Jan, 8, 2015 will be named as (e.g. B20150108-A), B means batch and A means first trial of analysis performed. Be careful batch name is permanent and can not be changed after created. Once you press OK, Edit Batch Dialog will appear. Fill batch information and press OK. Rev. 2 Page 12 of 28 CHEMIASOFT Standard Curve – User Manual Edit Batch Options To edit batch options click on Edit Batch button. Edit Batch dialog will appear Edit Batch dialog contains several tabs and below is the details of each: General Tab Item Batch ID Analysis Analyte Name Method Name Reference Instrument Standard Solvent Sample Solution Calibration Date Calibrated By Analysis Date Analyzed By Solns. Conc. Unit Response Unit Batch Status Rev. 2 Description Unique batch ID in the database. This field is “read only”. It can’t be changed after it has been created. Analysis name which is performed in the lab (e.g. Hydrocarbons, Chloride, Sulfate…etc). Name of the analyte to be analyzed The laboratory method name or standard operation procedure (SOP) Reference method number (e.g. EPA, ASTM, ISO…etc) Instrument name or ID used to perform analysis and read analyte responses (e.g. UV-VIS, HPLC, GC, ICP…etc) Solvent name used to dilute standard solutions. Solvent name used to dilute sample solutions. Date of the calibration run of the standards Name of the analyst perform the calibration process Date of performing sample analysis Name of the person perform sample analysis Concentration of the solutions used in the analysis including both calibration solutions and samples solutions. Response name from the instrument used to perform the analysis (e.g. Peak Area, Peak height, Absorbance, intensity…etc). Status of the batch (e.g. Under process, under review, rejected, approved…etc). Page 13 of 28 CHEMIASOFT Calibration Tab Item Trend Line Fitting Type Fitting Curve Options Weighted Least Square (WLS) Method Detection Limit Calibration Concentration Range Rev. 2 Standard Curve – User Manual Description Fitting type, there are six options available (Linear, Power, Natural Logarithmic, Logarithmic base 10, exponential and Quadratic) Force To Origin, make fitting line pass through origin point (0,0) this option available only for quadratic and linear type. Include Origin, include origin point (0,0) to the calibration points. Select Weight Least Square (WLS) option to enable weighted calibration. When this option is not selected, Ordinary Least Square (OLS) will be used in calculations. Calculate method detection limit (MDL) for batch calibration. Enable this option when batch is conducted for MDL study. MDL is calculated according to ISO 11843-2 “Methodology in the linear calibration case”, also called “Hubaux Vos MDL”. Refer to those methods online for more details on how to calculate MDL. Set K value, MDL factor and Confidence Interval as per method requirement. Two options are available here: • When Report within Calibration Range is checked then only samples solutions concentration within calibration range will be reported. If sample solution below calibration range, it will be reported as “Under Range” or “Over Range” if exceed calibration range concentration. The concentration range will be identified automatically by identify the maximum and minimum concentration in the calibration standards. • When uncheck Report within Calibration Range then you have to enter quantification concentration range. Enter maximum and minimum calibration quantification Page 14 of 28 CHEMIASOFT Calibration Tab Item Standard Curve – User Manual Description concentration to be determined base on the equation. Note: Calibration range is different from Final reported range (shown in Report tab). Calibration range is defined as the analyte concentrations in solutions used during running instrument and take reading (responses). Final reported range is defined as the concentration of analyte in origin sample. Reported concentration is calculated from solution concentration. Rev. 2 Page 15 of 28 CHEMIASOFT Samples Tab Item Use dilution factor Multiply Factor Divide Factor Standard Curve – User Manual Description Check this option to include dilution factor column in samples table. This part is very essential when you have high concentrated samples and you want to make dilution before injected to the instrument. Dilution factor is calculated using equation: Final Volume (mL) DF = Initial Volume (mL) For example if you take 5 mL from solution and diluted to 100 mL with solvent then dilution factor will be: 100 (mL) DF = = 20 5 (mL) Check this option to include multiply factor column in samples table. This will multiplied calculated concentration by this factor. Mostly used when sample required preparation before analysis, like digestion in trace metal analysis. For example enter “Total Volume (L)” in the title field. Check this option will include divide factor column in samples table. This will divide calculated concentration by this factor. Mostly used when sample required preparation before analysis, like digestion in trace metal analysis. For example enter “Sample Weight (Kg)” in the title field. Rev. 2 Page 16 of 28 CHEMIASOFT Samples Tab Item Custom Factor Standard Curve – User Manual Description Check this option to include custom multiply factor column in samples table. This will multiplied calculated concentration by this factor. This factor is considered as extra option. Use it if you want to make correction factor of the calculated concentration. For example conversion factor from Liter to milliliter…etc. Reporting Tab Item Reporting Concentration Unit Min. Reporting Conc. If concentration below Min. Reporting Conc. Then report as Max. Reporting Conc. If concentration above Max. Reporting Conc. Then report as Rev. 2 Description The final concentration unit after performing all calculations. The minimum reporting concentration of the original sample. Enter the text to be reported if the final calculated concentration below Min. Reporting Conc. The maximum reporting concentration of the original sample. Enter the text to be reported if the final calculated concentration above Max. Reporting Conc. Page 17 of 28 CHEMIASOFT Standard Curve – User Manual Format Tab In this tab, set details of digital value format to display result in standards and samples tables as per your needs. The following format specifiers are supported in the format result: Specifier 0 # . , Rev. 2 Represents Digit place holder. If the value being formatted has a digit in the position where the '0' appears in the format result, then that digit is copied to the output result. Otherwise, a '0' is stored in that position in the output string. Digit placeholder. If the value being formatted has a digit in the position where the '#' appears in the format string, then that digit is copied to the output string. Otherwise, nothing is stored in that position in the output string. Decimal point. The first dot character ('.') in the format string determines the location of the decimal separator in the formatted value; any additional dot characters are ignored. The actual character used as the decimal separator in the output string is determined by the DecimalSeparator global variable, whose default value is specified in the Number Format of the International section in the Windows Control Panel. Thousand separator. If the format string contains one or more comma characters (','), the output will have thousand separators inserted between each group of three digits to the left of the decimal point. The placement and number of comma characters in the format string does not affect the output, except to indicate that thousand separators are wanted. The actual character used as the thousand separator in the output is determined by the ThousandSeparator global variable, whose default value is specified in the Number Format of the International section in the Windows Control Panel. Page 18 of 28 CHEMIASOFT Standard Curve – User Manual The following table shows some sample formats and the results produced when the formats are applied to different values: Format string 1234 and 0.5 Format string 0 0.00 #.## #,##0.00 #,##0.00 1234 0.5 1234 1234.00 1234 1,234.00 1,234.00 1 0.50 .5 0.50 0.50 Note Tab This tab is to enter user note for batch. Open Existing Batch To open existing batch, from toolbar click on Open Batch button. Search Batch dialog will show up. In Search Batch dialog, enter search conditions like (Batch ID, Analysis name or creation date…etc) and press ENTER or click Search button to see the result list. If search conditions have no result, message will appear. In the case you have to change search conditions. To list all batches available in the database, leave search fields empty and click Search button or press ENTER. Rev. 2 Page 19 of 28 CHEMIASOFT Standard Curve – User Manual Click on column header to sort the result. Select batch you want and click Open button or press ENTER. Save Batch As Different Name Save batch as different name is similar to copy batch. First open the batch you want to copy and press Save As button. Save Batch As dialog will show up to enter new unique batch ID. Also, select if whether you want to copy calibration standards and samples to the new batch. There are two options with available at the bottom of the dialog (Copy calibration standards and Copy unknown samples). Once you enter new batch ID, click OK. Then Edit Batch dialog will appear to make changes if there is any. Click OK or press ENTER when you are done. Rev. 2 Page 20 of 28 CHEMIASOFT Standard Curve – User Manual Delete Existing Batch To delete existing batch, open batch you want to delete. Click Delete Batch button from toolbar. A message will appear to confirm, click Yes to proceed. Restore Deleted Batch To restore deleted batch(s), go to menu Batch >> Restore Deleted Batch. Restore Deleted Batch dialog will show up. Select batch(s) you want to restore, then click Restore Selection to proceed. Rev. 2 Page 21 of 28 CHEMIASOFT Standard Curve – User Manual Standards Add New Standard To add new standard to batch click (+) button from standard table toolbar then Edit Standard dialog will show up. Fill all information of the new standard. Below table explain each part: Item Standard Name Number Concentration Responses Weight Include in calibration points Description Name of the standard (e.g. Standard One 25 ppm). Sequence order in the table. Standards are sorted in the table base on this number. Actual concentration of the analyte in the standard solution. Enter one value only. Responses reading(s) from instruments used to run standard solution. You can enter single or multiple reading separated by comma. You may enter each ready in new line. The software will calculate the average and relative standard deviation RSD of the readings. Weight factor required when weighted calibration is selected in Batch Options. There are manual and automatic calculations of weight. Include or exclude standard from calibration curve. Click OK to proceed. Once you add new standard, the software will do recalibration and recalculate all samples. Rev. 2 Page 22 of 28 CHEMIASOFT Standard Curve – User Manual Edit Existing Standard To edit existing standard, double click standard you want to edit using left mouse button or select the standard using arrow up/down and press ENTER. Another way is to select standard and click on Edit Standard button from toolbar. Edit Standard dialog will show up. Edit the standard information from the dialog and click OK. Once you edit standard, the software will do recalibration and recalculate all samples automatically. Delete Existing Standard To delete standard, select standard you want to delete by mouse or by using keyboard arrows up/down. Click (-) button from standard table toolbar. From confirmation message, click Yes to proceed. Note that there is no undo for this step. Recalibrate Batch Standards When recalibrate batch, the software will do all calculations for fitting equation, will mTo recalibrate batch, from toolbar, click Recalibrate Standards button Rev. 2 Page 23 of 28 CHEMIASOFT Standard Curve – User Manual Samples Add Sample to Batch To add new sample to batch click (+) button from sample table toolbar then Edit Sample dialog will show up. Fill all information of the new sample. Below table explain each part Analyte Tab Item Sample Name Number Responses Remarks Rev. 2 Description Name of the sample. Sequence order in the table. Samples are sorted in the table base on this number. Responses reading(s) from instruments used to run sample solution. You can enter single or multiple reading separated by comma. You may enter each ready in new line. The software will calculate the average and relative standard deviation RSD of the readings. Note about the sample. Page 24 of 28 CHEMIASOFT Factors Tab Item Dilution Factor Multiply Factor Divide Factor Standard Curve – User Manual Description Dilution factors means how many times sample is diluted, more details about this factor in Edit Batch dialog. Calculated concentration from calibration equation will be multiplied by this factor. If the sample is not diluted then set this factor = 1 Usually its value is set to total sample solution volume in liter. This factor will multiply with calculated concentration from calibration equation. Factor name can be changed from Edit Batch dialog. Usually its value is set to initial sample weight in Kg. Calculated concentration from calibration equation will divide by this factor. Factor name can be changed from Edit Batch dialog. Factors can be removed from Edit Batch dialog. Edit Sample To edit existing sample, double click sample you want to edit using left mouse button or select the sample using arrow up/down and press ENTER. Another way is to select sample and click on Edit Sample button from toolbar. Rev. 2 Page 25 of 28 CHEMIASOFT Standard Curve – User Manual Edit Sample dialog will show up. Edit the sample information from the dialog and click OK. Once you edit standard, the software will do recalculate edited sample final concentration. Delete sample To delete sample, select sample you want to delete by mouse or by using keyboard arrows up/down. Click (-) button from sample toolbar. From confirmation message, click Yes to proceed. Note that there is no undo for this step. Recalculate Samples When recalculate sample, the software will do all calculations for all samples, it will take responses and calculate concentrations base on calibration equation. From the toolbar, click Recalculate Samples button Note: This step will calculate all samples. It will NOT do recalibration of batch standards. If you want recalibration then see Recalibrate Batch. Rev. 2 Page 26 of 28 CHEMIASOFT Standard Curve – User Manual Report Batch report contains all batch details, standards and samples. Generate Report To generate batch report, open batch you want to report as per Open Existing Batch section. Click on Report button from toolbar, report will be generated on screen. Press Print button to print generated report. Save Report To save report from report screen click on Save button and select the format you want to save. You can save report in various formats (e.g. PDF, JPEG, PNG, MS Excel, MS Word … etc). Rev. 2 Page 27 of 28 CHEMIASOFT Standard Curve – User Manual Registration To register your copy Standard Curve do the following: 1. On Standard Curve software, go to menu Help >> Registration, the Registration dialog will show up. 2. Copy Hardware ID. 3. Visit www.chemiasoft.com and place your order for Standard Curve. Use the hardware ID while placing your order online, you will be asked for your hardware ID. 4. Once you complete your order, you will receive an email with the license information and registration code. 5. Copy the registration code from the email you received and paste it on the Registration dialog and click Register button. Welcome message will appear. 6. Close and restart Standard Curve to complete registration. 7. Enjoy using Standard Curve with full features. Rev. 2 Page 28 of 28