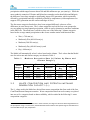
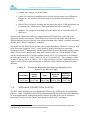
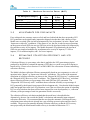
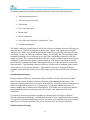
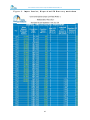
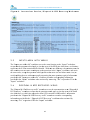
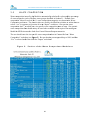
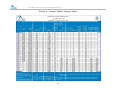
1
User’s Manual: Central‐Easte ern Europe Landfilll Gas Model Versioon 1.0 User’s Manual: Central‐Easte ern Europe Landfilll Gas Model Versioon 1.0 User's U s Man nual Centrral-Ea astern n Euro ope Lan ndfill Gas Modeel Version 1.0 Prepare ed on behalf of: United States Environmental Protection Agency 1200 Pennnsylvania Avee., NW Washington, DC 204 460 2.343.9291 202 Pre epared by: Novvember 2014 File No o. 02210032..25 User’s Manual: Central‐Eastern Europe Landfill Gas Model Version 1.0 Acknowledgements The Central-Eastern Europe LFG Model was developed by SCS Engineers for the Global Methane Initiative (GMI) under contract to the U.S. EPA Landfill Methane Outreach Program (LMOP). In addition, the following persons provided country and site-specific information used in model development: Serbia – Dr. Goran Vujic and Dusan Milovanovic, Faculty of Technical Sciences, University of Novi Sad, Novi Sad. Ukraine – Dr. Yuri Matveev, Renewable Energy Agency, Kiev. Poland – Mr. Piotr Klimek, Department of Renewable Energy Technology, Oil and Gas Institute, Krakow. Bulgaria – Mr. Richard Tipping, Chase Environmental, London, U.K. i User’s Manual: Central‐Eastern Europe Landfill Gas Model Version 1.0 Disclaimer This user’s guide has been prepared specifically for Central and Eastern European countries on behalf of the U.S. Environmental Protection Agency, as part of the Global Methane Initiative program activities in Ukraine, Serbia, Poland, and Bulgaria. The methods contained within are based on engineering judgment and represent the standard of care that would be exercised by a professional experienced in the field of landfill gas projections. The U.S. EPA and SCS Engineers do not guarantee the quantity of available landfill gas, and no other warranty is expressed or implied. No other party is intended as a beneficiary of this work product, its content, or information embedded therein. Third parties use this guide at their own risk. The U.S. EPA and SCS Engineers assume no responsibility for the accuracy of information obtained from, compiled, or provided by other parties. ii User’s Manual: Central‐Eastern Europe Landfill Gas Model Version 1.0 Abstract This document is a user's guide for a computer model, the Central-Eastern Europe Landfill Gas Model Version 1.0 (Model), for estimating landfill gas (LFG) generation and recovery from municipal solid waste disposal (SWD) sites in Ukraine, Serbia, Poland, and Bulgaria. The Model was developed by SCS Engineers under contract to the U.S. EPA. The Model can be used to estimate landfill gas generation rates from SWD sites, and potential landfill gas recovery rates for disposal sites that have, or plan to have, gas collection and control systems and are located in Central or Eastern European countries. The Model also may be used for SWD sites in other countries which experience similar site conditions and climate, and have waste composition data. The Model is an Excel® spreadsheet model that calculates LFG generation by applying a first order decay equation. The model requires the user to input site-specific data for SWD site opening and closing years, refuse disposal rates, and SWD site location, and to answer several questions regarding the past and current physical conditions of the SWD site. The model provides default values for waste composition and input variables (k and L0) for each of the four countries in Central-Eastern Europe represented in the model. The default values were developed using data on climate, waste characteristics, and disposal practices in Ukraine, Serbia, Poland, and Bulgaria, and the estimated effect of these conditions on the amounts and rates of LFG generation. Model users can either rely on waste composition and disposal rates automatically calculated by the Model or input site-specific values. The Model applies the disposal data along with the default k and Lo values for the selected department to estimate average LFG generation rates for each projection year. The Model also applies the user’s answers to questions about site conditions to develop estimates of collection efficiency for each year the LFG collection system is expected to operate. LFG recovery in each year is projected by multiplying LFG generation by the collection efficiency. The Model was developed with the goal of providing accurate and conservative projections of LFG generation and recovery. Other models evaluated during the model development process included the Ukraine Landfill Gas Model (2009), Colombia Landfill Gas Model (2010), and the Intergovernmental Panel on Climate Change (IPCC) 2006 Waste Model (IPCC Model). The Model incorporated the structure of the Colombia Model and IPCC Model, and data from the Ukraine Model, with input assumptions developed to reflect local climate and conditions at disposal sites in the Central and Eastern European countries. iii User’s Manual: Central‐Eastern Europe Landfill Gas Model Version 1.0 Table of Contents Section Page Acknowledgements ............................................................................................................................................. i Disclaimer ............................................................................................................................................................ ii Abstract .............................................................................................................................................................. iii Glossary of Terms............................................................................................................................................. vi 1.0 Introduction to the Central-Eastern Europe LFG Model Version 1.0 ............................................ 1 1.1 Background Information.............................................................................................................. 1 1.2 Model Overview ..........................................................................................................................1 2.0 Model Description .................................................................................................................................. 4 2.1 Model Inputs – Total Site vs. Area With Wells ......................................................................4 2.2 Model k Values ............................................................................................................................4 2.3 Waste Composition and Potential Methane Generation Capacity (L0) ............................5 2.4 Methane Correction Factor ........................................................................................................6 2.5 Adjustments for Fire Impacts ......................................................................................................7 2.6 Estimating Collection Efficiency and LFG Recovery ...............................................................7 2.7 Estimating Methane Oxidation ............................................................................................... 11 3.0 Model Instructions................................................................................................................................. 12 3.1 Inputs Worksheet ...................................................................................................................... 13 3.2 Disposal & LFG Recovery Worksheet ................................................................................... 13 3.2.1 Waste Disposal Estimates ........................................................................................ 17 3.2.2 Actual LFG Recovery ................................................................................................ 17 3.2.3 Collection Efficiency .................................................................................................. 17 3.2.4 Baseline LFG Recovery............................................................................................. 18 3.3 Inputs-Area with Wells............................................................................................................. 19 3.4 Disposal & LFG Recovery-Wells ............................................................................................ 19 3.5 Waste Composition .................................................................................................................. 20 3.6 Model Outputs - Table ............................................................................................................ 21 3.7 Model Outputs - Graph........................................................................................................... 23 4.0 References ............................................................................................................................................. 25 iv User’s Manual: Central‐Eastern Europe Landfill Gas Model Version 1.0 List of Figures No. Figure 1. Figure 2. Figure 3. Figure 4. Figure 5. Figure 6. Figure 7. Page Inputs Section, Inputs Worksheet ............................................................................................ 14 Instructions Section, Inputs Worksheet ................................................................................... 15 Inputs Section, Disposal & LFG Recovery Worksheet ........................................................ 16 Instructions Section, Disposal & LFG Recovery Worksheet................................................ 19 Portion of the Waste Composition Worksheet .................................................................... 20 Sample Model Output Table .................................................................................................. 22 Sample Model Output Graph ................................................................................................ 24 List of Tables No. Table 1. Table 2. Table 3. Page Methane Generation Rate (k) Values by Waste and Climate Category ........................ 5 Potential Methane Generation Capacity (L0) Values by Waste Type ............................. 6 Methane Correction Factor (MCF) ........................................................................................... 7 v User’s Manual: Central‐Eastern Europe Landfill Gas Model Version 1.0 Glossary of Terms Actual Landfill Gas (LFG) Recovery (m3/hr at 50% CH4) ‐ Annual average LFG recovery recorded at the blower/flare station in cubic meters per hour normalized at 50% methane. For instructions on how to normalize to 50% see Section 2.2 of the manual. Baseline Landfill Gas (LFG) Recovery (m3/hr at 50% CH4) ‐ This term is applicable for projects looking to pursue carbon credits and is defined as the amount of LFG recovery that was occurring prior to the start up of the LFG project and would continue to occur (as required by applicable regulations or common practices). For a precise definition of baseline recovery and emissions for Clean Development Mechanism (CDM) projects, please refer to the “Glossary of CDM Terms” available on the UNFCCC website at: http://cdm.unfccc.int/Reference/Guidclarif/glos_CDM_v04.pdf Closure Year ‐ The year in which the SWD site ceases, or is expected to cease, accepting waste. Collection System Efficiency ‐ The estimated percentage of generated LFG which is or can be collected in a gas collection system. Collection efficiency is a function of both collection system coverage and the efficiency of collection system operations. Collection System Coverage ‐ The estimated percentage of a SWD site’s refuse mass that is potentially within the influence of a gas collection system’s extraction wells. Controlled Landfill/Dump Site ‐ A controlled landfill/dump site is defined as having controlled placement of waste (waste directed to specific disposal areas, a degree of control of scavenging and fires), and one or more of the following: cover material, mechanical compacting, or leveling of waste. Design Capacity of the Disposal site ‐ The total amount of refuse that can be disposed of in the SWD site, calculated in terms of volume (m3) or mass (Mg). Dump Site – A dump site is an unmanaged SWD site that does not meet the definition of a controlled landfill/dump site. Garden Waste – The fraction of the total waste stream that contains plants trimmings from homes or city parks (also known as green waste). Landfill Gas ‐ Landfill gas (LFG) is a product of biodegradation of refuse in SWD sites and consists of primarily methane and carbon dioxide, with trace amounts of non‐methane organic compounds and air pollutants. Landfill Gas (LFG) Generation ‐ Total amount of LFG produced by the decomposition of the organic waste present at a SWD site. vi User’s Manual: Central‐Eastern Europe Landfill Gas Model Version 1.0 Landfill Gas (LFG) Recovery ‐ The fraction of the LFG generation that is or can be captured by a landfill gas collection and control system. Modeled LFG recovery is calculated by multiplying the LFG generation rate by the collection system efficiency. Methane Correction Factor (MCF) ‐ Adjustment to model estimates of LFG generation that accounts for the degree to which waste decays anaerobically (See section 1.2.2.1 for more details). Methane Generation Rate Constant (k) ‐ Model constant that determines the estimated rate at which waste decays and generates LFG. The k value is related to the half‐life of waste (t1/2) according to the formula: t 1 / 2 ln(2) . The k is a function of the moisture content in the SWD site refuse, availability of k nutrients for methanogens, pH, and temperature. (Units = 1/year). Potential Methane Generation Capacity (L0) ‐ Model constant that represents the maximum amount of methane (a primary constituent of LFG) which can be generated from a fixed amount of waste, given an infinite period of time for it to decompose. L0 depends on the amount of cellulose in the refuse. (Units = m3/Mg). Sanitary Landfill ‐ A sanitary landfill meets modern engineering prescriptive standards for bottom liners and leachate control systems, waste handling and compaction, cover soil placement and surface drainage, and LFG emissions control. (See the GMI BPG Chapter 2 for details.) Waste Disposal Estimates (Metric Tonnes or Mg) ‐ Annual total waste disposal tonnages recorded at the scale‐house or estimated using other methods. vii User’s Manual: Central‐Eastern Europe Landfill Gas Model Version 1.0 1.0 INTRODUCTION TO THE CENTRAL-EASTERN EUROPE LFG MODEL VERSION 1.0 1.1 BACKGROUND INFORMATION Landfill gas is generated by the decomposition of refuse in a SWD site under anaerobic conditions, and can be recovered through the operation of gas collection and control systems that typically burns the gas in flares. Alternatively, the collected LFG can be used beneficially. Beneficial uses of LFG may include upgrading to pipeline quality methane gas (if there is sufficient quantity and quality to support gas processing costs), or more often using it as fuel in energy recovery facilities, including internal combustion engines, gas turbines, microturbines, steam boilers, or other types of facilities that can use LFG for electricity or heat generation. In addition to the energy benefits from the beneficial use of LFG, collection and control of generated LFG helps to reduce LFG emissions that are harmful to the environment. The U.S. EPA has determined that LFG emissions from municipal solid waste (MSW) disposal sites cause, or contribute significantly to, air pollution that may reasonably be anticipated to endanger public health or welfare. Some are known or suspected carcinogens, or cause other noncancerous health effects. Public welfare concerns include the odor nuisance from the LFG and the potential for methane migration, both on-site and off-site, which may lead to explosions or fires. The methane emitted from SWD sites is also a concern because it is a greenhouse gas, thereby contributing to the challenge of global climate change. 1.2 MODEL OVERVIEW The main purpose of the Model is to provide SWD site owners and operators in Central-Eastern Europe with a tool to use to evaluate the feasibility and potential benefits of collecting and using the generated LFG for energy recovery or other uses. To fulfill this purpose, the Model uses Excel® spreadsheet software to estimate LFG generation and recovery from a SWD site based on the following information (see the Glossary of Terms for definitions of terms): The amounts of waste disposed at the SWD site annually. The opening and closing years of SWD site operation. The methane generation rate (k) constant. The potential methane generation capacity (L0). The methane correction factor (MCF). The fire adjustment factor (F). The collection efficiency of the gas collection system. 1 User’s Manual: Central‐Eastern Europe Landfill Gas Model Version 1.0 Please refer to Chapter 6 (Landfill Gas Modeling) in the “International Best Practices Guide for Landfill Gas Energy Projects” (IBPG)1 published by GMI for additional information on model input parameters k, L0, and MCF. The model estimates LFG generation using the following first-order exponential equation which was modified from the U.S. EPA’s Landfill Gas Emissions Model (LandGEM) version 3.02 (EPA, 2005). 2kL [10 ] (e n QLFG = 1 Mi 0 ‐ktij ) (MCF) (F) t 1 j 0.1 Where: QLFG = maximum expected LFG generation flow rate (m3/yr) i = 1 year time increment n = (year of the calculation) – (initial year of waste acceptance) j = 0.1 year time increment k = methane generation rate (1/yr) Lo = potential methane generation capacity (m3/Mg) Mi = mass of solid waste disposed in the ith year (Mg) tij = age of the jth section of waste mass Mi disposed in the ith year (decimal years) MCF = methane correction factor F fire adjustment factor. = The annual waste disposal rates, k and L0 values, MCF, and fire adjustment factor are used in the above equation to estimate the LFG generation rate for a given year from cumulative waste disposed up through that year. Multi-year projections are developed by varying the projection year, and then re-applying the equation. Total LFG generation is equal to two times the calculated methane generation.2 The model assumes a six month time lag between placement of waste and LFG generation. Annual collection efficiency estimates are applied to the LFG generation estimates to produce LFG recovery projections for SWD sites located in each Central or Eastern European country. Model results are displayed in the “Output-Table” and “Output-Graph” worksheets, which show estimated LFG generation and recovery in cubic meters per hour (m3/hr) and cubic feet per minute (cfm), the energy content of generated and recovered LFG (in million Joules per hour [MJ/hr]), the system collection efficiency, the maximum power plant capacity that could be fueled by the collected LFG (MW), and the emission reductions in metric tonnes (Mg) of CO2 equivalent (CO2e) achieved by the collection and combustion of the LFG. 1 2 www.globalmethane.org/documents/toolsres_lfg_IBPGcomplete.pdf The composition of landfill gas is assumed by the Model to consist of 50 percent methane (CH4) and 50 percent other gases, including carbon dioxide (CO2) and trace amounts of other compounds. 2 User’s Manual: Central‐Eastern Europe Landfill Gas Model Version 1.0 EPA recognizes that accurately modeling LFG generation and recovery is difficult, in part due to limitations in available information for inputs to the model. However, as new SWD sites are constructed and operated, and better information is collected, the present modeling approach can be improved. In addition, as more sites in Central and Eastern Europe develop gas collection and control systems, additional data on LFG generation and recovery will become available for model calibration and the development of improved model default values. While this model was developed primarily for the countries of Central and Eastern Europe, it may also be used for SWD sites in other countries which experience similar site conditions and climate. To run the Model for sites in other countries, it is required that site specific waste composition data be used, and that the site be located in a temperate region with average annual precipitation ranging from 300 to 800 mm per year. Questions and comments concerning the LFG model should be directed to Thomas Frankiewicz of the U.S. EPA at [email protected]. 3 User’s Manual: Central‐Eastern Europe Landfill Gas Model Version 1.0 2.0 MODEL DESCRIPTION The Central-Eastern Europe LFG Model Version 1.0 provides an automated estimation tool for quantifying LFG generation and recovery from MSW disposal sites in Central-Eastern Europe. The Model applies separate equations to calculate LFG generation from each of the following four organic waste3 categories that are grouped according to waste decay rates: 1. Very fast decaying waste – food waste and other organics. 2. Medium fast decaying waste – garden waste (green waste). 3. Medium slow decaying waste – paper and cardboard, textiles. 4. Slowly decaying waste – wood, rubber, leather, bones, straw. Total LFG generation for all wastes is calculated as the sum of the amounts of LFG generated by each of the four organic waste categories. Each of the four organic waste groups is assigned different k and L0 pairs that are used to calculate LFG generation. The Model’s calculations of LFG generation also include an adjustment to account for aerobic waste decay (MCF), and an adjustment to account for the extent to which the site has been impacted by fires. LFG recovery is estimated by the Model by multiplying projected LFG generation by the estimated collection efficiency. Methods used by the Model to estimate each of these variables – k, L0, MCF, fire impact adjustments, and collection efficiency – are discussed in detail below. 2.1 MODEL INPUTS – TOTAL SITE VS. AREA WITH WELLS The Model allows the user to input data for the entire SWD site or for just the portion of the site targeted for development and installation of LFG extraction wells. If the SWD site has portions which are not suitable for installing LFG extraction wells due to shallow waste depths, old waste, or other factors which limit LFG recovery, the Model provides the option of evaluating just the areas targeted for development, if data are available. The user can use this option by selecting “Yes” to Question #32 in the “Inputs” worksheet, which asks: “Is there information on the areas of the site to be developed with wells, including years of disposal and total waste amounts or waste disposal rates?” If “Yes” is selected, the user is required to complete the “Inputs-area with wells” and “Disposal & LFG Recovery – wells” worksheets. If “No” is selected, data in these additional worksheets will be ignored. Required data would include separate disposal estimates for the targeted area and a separate description of site characteristics used for evaluating the MCF, F, and collection efficiency (Questions 19a through 29b in the “Inputs-area with wells” worksheet). 2.2 MODEL K VALUES The Model estimates k values based on climate (precipitation) category and waste type. The countries of Ukraine, Serbia, Poland, and Bulgaria experience a relatively similar range of climates. Other than in mountainous regions, all four countries have average annual temperatures which range from about 6 to 13 degrees Celsius (oC), and average annual 3 Inorganic waste does not generate LFG and is excluded from the model calculations. 4 User’s Manual: Central‐Eastern Europe Landfill Gas Model Version 1.0 precipitation which ranges between about 300 and 800 millimeters per year (mm/yr).4 While the more northerly countries of Ukraine and Poland are somewhat cooler than Serbia and Bulgaria, the difference is not large enough to significantly impact LFG generation, which is primarily affected by precipitation and only secondarily affected by temperatures (cold temperatures can suppress LFG generation near the surface and edges of sites). The four waste categories listed above have been assigned different k values to reflect differences in waste decay rates. The k values assigned to each of the four waste groups also vary according to average annual precipitation, which is used to characterize moisture conditions in the SWD site. The model user is asked to select one of the following 5 climate categories based on the average annual precipitation at the closest weather station with historical data: Wet (>=700 mm/yr); Moderately Wet (600-699 mm/yr); Moderate (500-599 mm/yr); Moderately Dry (400-499 mm/yr); and Dry (<400 mm/yr). The Model will automatically select k values based on the climate. The k values that the Model uses for each waste and climate category are shown in Table 1. Table 1. Waste Category 1 2 3 4 Methane Generation Rate (k) Values by Waste and Climate Category Climate 1 Wet 0.180 0.090 0.036 0.018 Climate 2 Moderately Wet 0.160 0.080 0.032 0.016 Climate 3 Moderate 0.140 0.070 0.028 0.014 Climate 4 Moderately Dry 0.120 0.060 0.024 0.012 Climate 5 Dry 0.100 0.050 0.020 0.010 2.3 WASTE COMPOSITION AND POTENTIAL METHANE GENERATION CAPACITY (L0) The L0 values used in the Model are derived from waste composition data from each of the four Central and Eastern European countries. Waste composition data from each country was placed into one to five categories based on data availability, which resulted in the following 11 waste composition categories: 4 While the Model can be used for SWD sites in other countries, the range of k values has been assigned based on this precipitation range. For this reason, the Model should not be used for sites experiencing less than 300 mm or more than 800 mm per year precipitation. 5 User’s Manual: Central‐Eastern Europe Landfill Gas Model Version 1.0 Ukraine: One category for all of Ukraine. Serbia: Five categories, including one for each of the four largest cities of Belgrade, Kragujevac, Nis, and Novi Sad, and a category for all other cities and towns in Serbia. Poland: Three categories, including one for larger cities above 50,000 population, one for smaller cities with less than 50,000 population, and one for rural areas. Bulgaria: Two categories, including one for the capital city of Sofia and one for all other areas. Default waste composition values are assigned based on the Model user’s selection of the appropriate country and category. The default values are used by the Model unless the user indicates that they have site-specific waste composition data in the “Inputs” worksheet and enters the data in the “Waste Composition” worksheet. The model uses the default or site-specific waste composition data to calculate L0 values for each of the four waste categories. The L0 values which are used by the Model are calculated according to the IPCC methodology, which assigns default values for degradable organic carbon (DOC) for each waste material type, along with a default value of 0.5 for the fraction of DOC which is dissimilated (DOCF) and the methane content of LFG (F), to calculate L0 according to the following formula: L0 = DOC X DOCF X F X 16/12 X 0.0007168.5 The resulting L0 values by material type are shown in Table 2. The L0 value for Waste Category 3 (medium-slow decay organic waste) will have some variation due to different relative amounts of paper and textiles disposed. Table 2. Potential Methane Generation Capacity (L0) Values by Waste Type Food Waste Garden Waste Paper Wood and Straw Textiles & Disposable Diapers 70 m3/Mg 93 m3/Mg 186 m3/Mg 200 m3/Mg 112 m3/Mg 2.4 METHANE CORRECTION FACTOR The MCF varies depending on waste depth and SWD site type, as defined by site management practices. Table 3 summarizes the MCF adjustments applied by the model based on information on waste depths and site management practices that are provided by the user in response to Questions #17 and #18 in the “Inputs” and “Inputs-area with wells” worksheets. 5 Formula for L0 includes conversion factors of 16/12 (ratio of methane and carbon molecular weights) and 0.0007168 Mg/m3 (density of methane at standard conditions). 6 User’s Manual: Central‐Eastern Europe Landfill Gas Model Version 1.0 Table 3. Methane Correction Factor (MCF) Site Management Category Dump Site Controlled Landfill/Dump Site Sanitary Landfill Unknown 2.5 Depth <5m 0.4 0.7 0.9 0.4 Depth 5-10m 0.4-0.7 0.7-0.8 0.9-0.95 0.4-0.7 Depth >10m 0.8 0.9 1.0 0.8 ADJUSTMENTS FOR FIRE IMPACTS Fires at disposal sites consume waste as a fuel and leave behind ash that does not produce LFG. LFG generation can be significantly impacted at disposal sites that have had a history of fires. Model users are asked if the site has been impacted by fires in Question 19a in the “Inputs” and “Inputs-area with wells” worksheets. If the answer is yes, the user is asked to answer questions on the percent of total SWD site area (or SWD site area to be developed with wells) impacted by fires and the severity of fire impacts. The Model discounts LFG generation by the percent of SWD site area impacted multiplied by an adjustment for severity of impacts (1/3 for low impacts, 2/3 for medium impacts, and 1 for severe impacts). 2.6 ESTIMATING COLLECTION EFFICIENCY AND LFG RECOVERY Collection efficiency is a percentage value that is applied to the LFG generation projection produced by the Model to estimate the amount of LFG that is or can be recovered for flaring or beneficial use. Please refer to Section 6.5 in GMI’s IBPG for a discussion of factors influencing collection efficiency. The Model calculates collection efficiency automatically based on user responses to a series of questions in the “Inputs” or “Inputs-area with wells” worksheets. The results of the automatic calculation of collection efficiency are shown in the “Disposal & LFG Recovery” worksheet and the “Disposal & LFG Recovery-wells” worksheet. The “Disposal & LFG Recovery” worksheet shows collection efficiency as a percentage of the total SWD site LFG generation. The “Disposal & LFG Recovery-wells” worksheet shows collection efficiency as a percentage of LFG generated by the disposal areas targeted for development only. Note that the Model outputs (table and graph) show total site LFG generation, even if the user selects the option of estimating LFG recovery based on data from selected areas targeted for waste development (i.e., collection efficiency is the percentage of total site generation which is recovered). The collection efficiency calculation method that the model uses is described below. Alternatively, the user can override the Model’s calculations and manually input estimated collection efficiencies. We recommend that the user keep the automatic collection efficiency calculations intact unless the site already has a gas collection system in place and flow data is available. The process for manually adjusting collection efficiency so that the LFG recovery rates projected by the Model match actual recovery is described in Subsection 3.2.3. 7 User’s Manual: Central‐Eastern Europe Landfill Gas Model Version 1.0 The Model automatically calculates collection efficiency based on the following factors: Site management practices. Collection system coverage –. Waste depth. Cover type and extent. Bottom liner. Waste compaction. Size of the active disposal (“working face”) area. Leachate management. The Model’s methods of application of each of these factors to estimate collection efficiency are discussed below. While answering the questions in the “Inputs” and “Inputs-area with wells” worksheets, the Model user should understand that conditions which affect collection efficiency can change over time as SWD site conditions change. For example, the SWD site depth or the estimated percentages of area with each cover type (final, intermediate, and daily) often will change over time. We recommend that the model user’s answers to the questions reflect current conditions if a gas collection system is already installed. If no system is installed, the Model user should try to estimate the future conditions that will occur in the year that the system will begin operation. The calculated collection efficiency will then reflect conditions in the current year or the first year of system operation. Adjustments to later years’ collection efficiency estimates can be guided by actual recovery data using a process that is described in Subsection 3.2.3. Site Management Practices Properly managed SWD sites, particularly sanitary landfills, will have characteristics which allow for achievement of higher collection efficiencies than unmanaged dump sites. Four categories of management practices are used in the Model to reflect the extent to which the site is known to implement these practices: (1) dump sites; (2) controlled landfill/dump site; (3) sanitary landfill; and (4) unknown site characteristics. The Model user is requested to indicate site management practices in Question #18 of the “Inputs” and “Inputs-area with wells” worksheets. User inputs in response to questions regarding site characteristics will trigger collection efficiency discounts in the Model. An additional discount of 15% is applied for dump sites and 5% applied for controlled landfill/dump sites to account for other characteristics not specifically addressed, as well as the combined effect of site characteristics on collection efficiency. Collection System Coverage 8 User’s Manual: Central‐Eastern Europe Landfill Gas Model Version 1.0 Collection system coverage describes the percentage of the waste that is within the influence of the existing or planned extraction wells. It accounts for system design and the extent to which the installed wells are actively drawing LFG from deposited waste. Most SWD sites will have considerably less than 100 percent collection system coverage. Only sanitary landfills can achieve 100% collection system coverage, and then only in areas that have been closed. The Model user is requested to estimate current or future collection system coverage in Question #21 of the “Inputs” and “Inputs-area with wells” worksheets, which asks for “Percent of waste volume where wells are/will be installed and operating.” Estimates of collection system coverage at disposal sites without systems already in operation should try to account for conditions anticipated for the date that system start-up will occur, including the percentage of areas available for installing extraction wells. Estimates of collection system coverage at disposal sites with systems already in operation should reflect system design and include discounts for non-functioning wells. Waste Depth Deeper waste depths allow deeper wells to be installed. Deeper wells can operate more effectively than shallow wells because a greater vacuum can be applied to the wells. Wells installed in shallow waste less than about 10m will tend to have greater air infiltration. Model users are requested to input average waste depth in Question #17 in the “Inputs” and “Inputs-area with wells” worksheets. The Model assumes a 5% discount to estimated collection efficiency for every 1m of waste depth less than 10m. Cover Type and Extent The type and extent of SWD site cover can have a significant influence on achievable collection efficiency. Collection efficiencies will be highest at SWD sites with a low permeable soil cover over all areas with waste, which limits the release of LFG into the atmosphere, air infiltration into the gas system, and rainfall infiltration into the waste. Unmanaged dump sites with little or no soil cover will have high rates of LFG emissions into the atmosphere and air infiltration into the collection system, resulting in lower rates of LFG capture. Typically, a final cover will have the greatest thickness and lowest permeability and will be the most effective in terms of increasing collection efficiency. Most SWD sites will have at least an intermediate soil cover installed over areas that have not been used for disposal for an extended period; intermediate soils provide a moderate level of control over air infiltration, LFG emissions, and rainfall infiltration. Daily soil cover typically is a shallower layer of soil that is installed at the end of the day in active disposal areas and provides a more permeable barrier to air and water than final or intermediate cover soils. Model users are asked to estimate the percentage of the SWD site area that have or will receive wells with each soil cover type in Questions #22, 23, and 24 in the “Inputs” and “Inputs-area with wells” worksheets. Estimates of percentage of each cover type at SWD sites without collection systems already in operation should try to project the distribution of cover types anticipated for the date that system start-up will occur. The Model automatically calculates the percentage of SWD site area with no soil cover as the remaining area. The Model calculates a 9 User’s Manual: Central‐Eastern Europe Landfill Gas Model Version 1.0 weighted average collection efficiency adjustment to account for the percentages of each soil cover type. SWD Site Liner SWD sites with clay or synthetic liners will have lower rates of LFG migration into surrounding soils, resulting in higher collection efficiencies. Clay or synthetic bottom liners act as a lowpermeability barrier which is effective at limiting off-site LFG migration into surrounding soils, particularly when there is an active LFG collection system operating. Model users are asked to estimate the percentage of SWD site area (that has or will receive wells) with a clay or synthetic bottom liner in Question #26 in the “Inputs” and “Inputs-area with wells” worksheets. The Model calculates a discount to collection efficiency equal to 5% times the percent area without a clay or synthetic liner. Waste Compaction Waste compaction helps promote anaerobic waste decay and tends to improve collection efficiency by limiting air infiltration and improving gas quality. Uncompacted waste will have greater air infiltration and lower gas quality, and thus lower collection efficiency. Model users are asked if waste compaction occurs on a regular basis in Question #27 of the “Inputs” and “Inputs-area with wells” worksheets. Collection efficiency is discounted by 3% if regular waste compaction does not occur. Focused Working Face SWD sites with a large active working face will tend to have lower collection efficiencies than sites where disposal is directed to a focused working face. Disposal sites where waste delivery trucks are directed to unload wastes in a specific area will provide better management of disposed wastes, including more efficient compaction, more frequent and extensive soil covering of exposed wastes, and higher waste depths, all of which contribute to higher collection efficiencies. Model users are asked if waste is delivered to a focused working face in Question #28 of the “Inputs” and “Inputs-area with wells” worksheets. Collection efficiency is discounted by 5% if waste is not delivered to a focused working face. Leachate Leachate almost always limits effective collection system operations at SWD sites in developing countries due to the high waste moisture content and the lack of proper drainage. Areas with heavy rainfall are especially susceptible to leachate buildup in the SWD site. High leachate levels in a SWD site can dramatically limit collection efficiency by blocking well perforations and preventing wells from applying vacuum to draw in LFG from the surrounding waste mass. Unless the climate is extremely dry or the site has been designed to provide good management of liquids through proper surface drainage and cost effective systems for collection and treatment of leachate, the SWD site often will show signs of the accumulation of liquids through surface seeps or ponding. This evidence of high leachate levels in the SWD site may be temporary features that appear only after rainstorms, suggesting that leachate problems may be less severe, or they may persist for longer periods, suggesting that high leachate levels are an ongoing problem. 10 User’s Manual: Central‐Eastern Europe Landfill Gas Model Version 1.0 The impacts of leachate on collection efficiency are evaluated by the Model based on evidence of leachate on the surface of disposal areas, whether the evidence appears only after rainstorms, and climate. Model users are asked if the SWD site experiences leachate surface seeps or surface ponding in Question 29a of the “Inputs” and “Inputs-area with wells” worksheets. If the answer is yes, the Model user is asked in Question 29b if this occurs only after rainstorms. If evidence of leachate accumulation appears only after rainstorms, the Model applies a 10% to 18% discount to collection efficiency depending on climate (wetter climates receive a higher discount). If the evidence of leachate accumulation persists between rainstorms, the Model applies a 20% to 36% discount to collection efficiency, depending on climate. Model Estimate of Collection Efficiency The Model calculates collection efficiency as the product of all the factors listed above. If the collection efficiency factor involves a discount, a value of one minus the discount is used in the calculation. Each step in the collection efficiency calculation and the resulting collection efficiency estimate are shown in Cells J14 through J22 of the “Disposal & LFG Recovery” and “Disposal & LFG Recovery-wells” worksheets. The calculated collection efficiency value also is displayed in Column D of the “Disposal & LFG Recovery” and “Disposal & LFG Recoverywells” worksheets for each year starting with the year of initial collection system start up indicated by the Model user in response to Question #20 in the “Inputs” and “Inputs-area with wells” worksheets, respectively. 2.7 ESTIMATING METHANE OXIDATION Methane oxidation is a process by which methanotropic micro-organisms in cover soils of SWD sites convert methane into carbon dioxide. Rates of oxidation are primarily dependent on cover types and the rate of methane flux through the cover soils. Although a default value of 10% of uncollected LFG from areas with cover soil is typically applied (e.g., by IPCC), current research supports methane oxidation rates at significantly higher levels (Sullivan, 2010), particularly at sites with final covers installed and efficiently operated LFG recovery systems. The Central and Eastern Europe Landfill Gas Model calculates oxidation according to the following formula: (1 – collection efficiency %) x (20% x % area with final cover + 10% x % area with intermediate cover + 5% x % area with daily cover). Oxidation does not affect estimates of LFG generation or recovery. Oxidation estimates are added to baseline methane recovery estimates which are subtracted from methane recovery to calculate methane emissions reduction. 11 User’s Manual: Central‐Eastern Europe Landfill Gas Model Version 1.0 3.0 MODEL INSTRUCTIONS The LFG Model is a Microsoft Excel® spreadsheet operated in a Windows XP® or Vista environment. Open the Model file (“Central-Eastern Europe LFG Model v.1.xls”) by choosing “file” “open,” and then “open” when the correct file is highlighted. The Model has seven worksheets that are accessible by clicking on the tabs at the bottom of the Excel® window screen. The seven worksheets are as follows: 1. Inputs. This worksheet will ask the user a series of 31 questions. Depending on the answers of these questions the Model will select the appropriate default values for k, L0, MCF, fire adjustment factor, and collection efficiency. The Model also will develop annual disposal rate estimates. The last question in row 31 will ask if there is information on the areas of the site to be developed with wells. If data is available on disposal rates and site conditions in these areas, it is recommended that “Yes” is selected to separately evaluate LFG recovery from the areas of the site to be developed with wells; otherwise select “No”. 2. Disposal & LFG Recovery. This worksheet will provide the user the opportunity to enter annual disposal rates, actual LFG recovery rates, and baseline LFG recovery, if available. If actual LFG recovery data are available, the user also can make adjustments to the Model’s automated estimates of collection efficiency so that projected recovery matches actual recovery. 3. Inputs-area with wells. This worksheet will ask the user a series of 23 questions about the area with/to be developed with wells. Depending on the answers of these questions the Model will select the appropriate default values for MCF, fire adjustment factor, and collection efficiency. The Model also will develop annual disposal rate estimates for the targeted disposal areas. 4. Disposal & LFG Recovery-wells. This worksheet will provide the user the opportunity to enter annual disposal rates, actual LFG recovery rates, and baseline LFG recovery, if available, for disposal areas with/to be developed with wells. If actual LFG recovery data are available, the user also can make adjustments to the Model’s automated estimates of collection efficiency so that projected recovery matches actual recovery. 5. Waste Composition. This worksheet will provide the user the opportunity to enter sitespecific waste characterization data if available. 6. Output-Table. This worksheet will provide the results of the model in a tabular form. Note that annual waste disposal and LFG generation estimates reflect the entire SWD site, regardless of whether the option to evaluate data from just the areas with/to receive wells is selected. If this option is selected, the table will show projected LFG recovery from the targeted areas. 7. Output-Graph. This worksheet will provide the results of the model in a graphic form. 12 User’s Manual: Central‐Eastern Europe Landfill Gas Model Version 1.0 All worksheets have been divided in the following two sections: 3.1 Input Section: This section has a blue background and is the location where questions need to be answered or information must be provided. Cells with text in white provide instructions or calculations and cannot be edited. Cells with text in yellow require user inputs or edits. In some instances dropdown menus are provided to limit user inputs to “Yes” or “No” answers or to a specific list of possible inputs (e.g. country names). Instruction Section: This section has a light blue background and provides specific instructions on how to answer questions or input information. INPUTS WORKSHEET The “Inputs” worksheet has 35 rows of text which require user inputs in Column C for 31 items. All 31 questions or phrases that have yellow text in Column C need to be responded to with sitespecific information (items 14, 25, 30 and 31 are calculated automatically and do not require user inputs). Some questions will have drop-down menus in their answer cell to guide the user and limit the range of answers. A drop-down menu will appear when the user selects cells with dropdown menus; the user should select a response from the list of items in the drop-down menu.6 Figure 1 below shows the layout of the Inputs Section showing all questions and user inputs. Instructions on each item in the Inputs Section are provided on the corresponding row in the Instruction Section. Figure 2 shows the layout of the Instruction Section. 3.2 DISPOSAL & LFG RECOVERY WORKSHEET The “Disposal & LFG Recovery” worksheet (Figure 3) does not require user inputs but provides the user the ability to change automatically calculated annual estimates for waste disposal and collection system efficiency, and assumed values for actual LFG recovery and baseline LFG recovery (0 m3/hr). Each of these inputs is described below. 6 Items 3 and 4 in the Inputs sheet require selection of one of the four participating Central‐Eastern European countries from drop‐down menus. These inputs can be overridden in model calculations for sites outside of these four countries; instructions are provided in later sections of this manual. 13 User’s Manual: Central‐Easte ern Europe Landfilll Gas Model Versioon 1.0 Figure 1. Inputs Section, Inputs Worksheet 14 User’s Manual: Central‐Easte ern Europe Landfilll Gas Model Versioon 1.0 Figure 2. Instructions Section, Inputs Worksheet 15 User’s Manual: Central‐Easte ern Europe Landfilll Gas Model Versioon 1.0 Figure 3. Inputs Section, Disposal & LFG Recovery Worksheet 16 User’s Manual: Central‐Eastern Europe Landfill Gas Model Version 1.0 3.2.1 Waste Disposal Estimates The user is encouraged to input annual disposal estimates in Column B for years that data are available. Enter the waste disposal estimates in metric tonnes (Mg) for each year with disposal data; leave the calculated disposal estimates for years without disposal data, including future years. The disposal estimates should be based on available records of actual disposal rates and be consistent with site-specific data on amounts of waste in place, total site capacity, and projected closure year. Disposal estimates should exclude soil and other waste items that are not accounted for in the waste composition data (see “Waste Composition” worksheet). 3.2.2 Actual LFG Recovery If available, actual LFG recovery data from operating LFG collection systems should be converted to m3/hr, adjusted to 50% methane equivalent, and averaged using the following process: Multiply each measured value for the LFG flow rate by the methane percentage at the time of the measured flow to calculate methane flow. Convert units to m3/hr if necessary. Calculate the average methane flow rate using all data for the calendar year. Convert to LFG flow at 50% methane equivalent by multiplying by 2. The calculated average LFG recovery rate should be the average annual total LFG flow at the flare station and/or energy recovery plant (NOT the sum of flows at individual wells). Enter the actual annual average LFG recovery rates in cubic meters per hour in Column E in the row corresponding to the year represented in the flow data. If methane percentage data are not available, the flow data are not valid and should not be entered. The numbers placed in these cells will be displayed in the graph output sheet, so do not input zeros for years with no flow data (leave blank). 3.2.3 Collection Efficiency Accurate estimates of collection efficiency can be difficult to achieve, given all of the influencing factors described above. The accuracy of the estimate tends to be higher when collection efficiency is high and lower when collection efficiency is low. This is because determining that collection system design and operations are being optimized is easier than estimating how much discount should be applied to the collection efficiency estimate when multiple factors create sub-optimal conditions for LFG extraction. The Model is intended to be used by non-professionals who are not trained in methods for evaluating collection efficiency. For this reason, we recommend that the Model’s calculations of collection efficiency be left intact for most applications. The one exception is for modeling sites with active LFG collection systems installed and actual flow data available for comparison to the Model’s recovery estimates. If the flow data includes both LFG flows and the methane content of the LFG, and includes an extended period of system operation (enough to represent average recovery for a year), we 17 User’s Manual: Central‐Eastern Europe Landfill Gas Model Version 1.0 recommend adjusting the collection efficiency estimates. Actual LFG recovery data should be adjusted to 50% methane equivalent (by calculating methane flows and multiplying by 2) and then averaged on an annual basis. The resulting estimate of actual LFG recovery should be entered into the appropriate row in Column E of the “Disposal & LFG Recovery” worksheet or “Disposal & LFG Recovery-wells” worksheet. Collection efficiency estimates in Column D of either worksheet can then be adjusted so that the Model’s projected LFG recovery rate shown in Column F closely matches the actual LFG recovery rate. The Model user can make adjustments to collection system efficiency values in Column D for each year with valid flow data. The effects of the collection efficiency adjustments on projected LFG recovery will be immediately visible in Column F (projected LFG recovery values cannot be adjusted). Continue adjusting collection efficiency for each year with flow data until projected recovery closely matches actual recovery shown in Column E. The user also may want to adjust collection efficiency estimates for future years to match the most recent year with data. 3.2.4 Baseline LFG Recovery Baseline LFG recovery estimates are subtracted from projected LFG recovery to estimate methane emission reductions achieved by the LFG project that are in addition to reductions which may be required by regulations. The default value for baseline LFG recovery is zero for all years, which will be appropriate for most disposal sites in Central-Eastern Europe that were not required to collect and flare LFG under any existing regulation. Baseline LFG recovery can be adjusted in Column G. Methodologies for estimating baseline LFG recovery can be found at the United Nations Framework Convention on Climate Change (UNFCCC) website under Clean Development Mechanism (CDM) projects. The Instructions Section (Figure 4) provides instructions on adjusting values for waste disposal, collection efficiency, actual LFG recovery, and baseline LFG recovery. The automatic calculation of default values for collection efficiency and methane oxidation based on user inputs also is shown. 18 User’s Manual: Central‐Easte ern Europe Landfilll Gas Model Versioon 1.0 Figure 4. Instructions Section, Disposal & LFG Recovery Worksheet 3.3 INPUTS-AREA WITH WELLS The “Inp puts-area with h wells” worrksheet serv ves the same function as the “Inputs”” worksheet, except th hat the questiions asked apply a to just the t areas of the SWD sitte which havve, or whichh are expected d to have LFG G extraction n wells installled. With thhis one diffeerence, the quuestions askked in this work ksheet are the same or an nalogous to the t question s in the “Inpputs” workshheet, and aree in the same order, excep pt that questtions which pertain p to thee entire site are hidden ffrom view (tto avoid tro oubling the user u with unn necessarily answering a thhe same quesstions again)). Informatioon provided d in the “Inpu uts-area with h wells” worrksheet overrrides correspponding infoormation provided d in the “Inpu uts” worksheeet when acttivated by annswering “Y Yes” to questiion #32 in thhe “Inputs” worksheet. 3.4 DISPOSAL & LFG RECOVERY-WELLS The “Dissposal & LFG G Recovery--wells” work ksheet serves the same ffunction as thhe “Disposall & LFG Reccovery” work ksheet, exceept that the questions q askked apply to jjust the areaas of the SW WD site whicch have, or which w are exp pected to hav ve LFG extrraction wellss installed. IInformation provided d in the “Disp posal & LFG G Recovery-wells” workksheet overriides correspoonding informatiion provided d in the ““Diisposal & LF FG Recoveryy” worksheeet when activvated by answerin ng “Yes” to question q #32 2 in the “Inpu uts” worksheeet. 19 User’s Manual: Central‐Easte ern Europe Landfilll Gas Model Versioon 1.0 3.5 WASTE COMPOSITION Waste co omposition iss used by thee Model to automatically a y calculate L0 values andd the percenntage of waste assigned to each of the four f waste groups g descriibed in Sectiion 2.1. Deffault waste composittion values for f each of th he 11 waste compositionn categories are shown inn the Waste Composiition worksh heet. The deffault values are used by the Model tto calculate L0 unless thee user selects “Y Yes” in response to Question #6 in th he “Inputs” worksheet, ““Site-specifi fic waste composittion data?”, in i which casse, site speciific waste coomposition ddata are usedd. Site speciffic waste com mposition daata should allways be useed when avaailable and iss required foor running thhe Model fo or SWD sitess outside of the t four Cen ntral-Easternn European ccountries. The user should enter the site-speecific waste compositionn data in Collumn B of thhe “Waste Composiition” worksheet (see Fig gure 5). Be sure that thee percentagees add up to 100% and thhat “Yes” is selected und der Item #6 in i the “Inputts” worksheeet. Figure 5. Portion of the Waste Composition Worksheet 20 User’s Manual: Central‐Eastern Europe Landfill Gas Model Version 1.0 3.6 MODEL OUTPUTS - TABLE Model results are displayed in a table located in the “Outputs-Table” worksheet that is ready for printing with minimal editing (see Figure 6 for a sample table layout). The title of the table has been set by user inputs in the Inputs worksheet. The table title for SWD sites in countries outside of the four participating countries can be edited to display the correct country name. The table provides the following information which was copied from either the “Disposal & LFG Recovery” worksheet or the “Disposal & LFG Recovery Worksheet-wells” worksheet, or calculated by the model: Years starting with the SWD site opening year/disposal start date for areas which have or will have wells, and ending in a year the user selects. Annual disposal rates in Mg per year. Refuse in place in Mg. LFG generation for each projection year in m3/hr, cfm, and MJ/hr. Collection system efficiency estimates for each projection year. LFG recovery rates for each projection year in m3/hr, cfm, and MJ/hr. Maximum power plant capacity that could be supported by this flow in MW. Combined baseline LFG flow and oxidation rate in m3/hr. Methane emission reduction estimates in tonnes CH4/year and in tonnes CO2e/year. The methane content assumed for the model projection (50%). The k values used for the model run. The L0 values used for the model run. The table is set up to display up to 100 years of LFG generation and recovery estimates. As provided, the table shows 40 years of information. The last 60 years are in hidden rows. The user will likely want to change the number of years of information displayed, depending on how old the site is and how many years into the future the user wants to display information. Typically, projections up to the year 2035 are adequate for most uses of the model. To hide additional rows, highlight cells in the rows to be hidden and select “Format” “Row” “Hide”. To unhide rows, highlight cells in rows above and below rows to be displayed, and select “Format” “Row” “Unhide”. To print the table, select “File” “Print” “OK”. The table should print out correctly formatted. 21 User’s Maanual: Central‐Eastern Europe Landfill Gas Mo odel Version 1.0 Figure 6. Sample Model Output Tabl e 22 3.7 User’s Manual: Central‐Eastern Europe Landfill Gas Model Version 1.0 MODEL OUTPUTS - GRAPH Model results are also displayed in graphical form in the “Outputs-Graph” worksheet (see Figure 7 for a sample graph layout). Data displayed in the graph includes the following: LFG generation rates for each projection year in m3/hr. LFG recovery rates for each projection year in m3/hr. Actual (historical) LFG recovery rates in m3/hr. The graph title says “Landfill Gas Generation and Recovery Projection” and shows the SWD site name, city, and country. The user can make edits to the graph title in Cells A9-A12 (click on the graph and move it to uncover these cells). The timeline shown in the x-axis will need editing if the user wishes to not have the projection end in 2030 or to change the start year. To edit the xaxis for displaying an alternative time period, click on the x-axis and select “Format” “x-axis”. Then select the “Scale” tab and input the desired opening and closing year for the projection. Also, because the graph is linked to the table, it will show data for all projection years shown in the table (given the limits set for the x-axis). It will not show any hidden rows. If the table shows years beyond the range set for the x-axis, the line of the graph will appear to go off of the edge of the graph. To correct this, the user will need to either hide the extra rows or edit the xaxis range to display the additional years. To print the graph, click anywhere on the graph and select “File” “Print” OK”. If the user does not click on the graph prior to printing, the instructions will also appear in the printout. 23 User’s Manual: Central‐Easte ern Europe Landfilll Gas Model Versioon 1.0 Figure 7. Sample Model Output Graph 24 4.0 User’s Manual: Central‐Eastern Europe Landfill Gas Model Version 1.0 REFERENCES EPA, 1991. Regulatory Package for New Source Performance Standards and III(d) Guidelines for Municipal Solid Waste Air Emissions. Public Docket No. A-88-09 (proposed May 1991). Research Triangle Park, NC. U.S. Environmental Protection Agency. EPA, 1998. Compilation of Air Pollutant Emission Factors, AP-42, Volume 1: Stationary Point and Area Sources, 5th ed., Chapter 2.4. Office of Air Quality Planning and Standards. Research Triangle Park, NC. U.S. Environmental Protection Agency. EPA, 2005. Landfill Gas Emissions Model (LandGEM) Version 3.02 User’s Guide. EPA-600/R-05/047 (May 2005), Research Triangle Park, NC. U.S. Environmental Protection Agency. EPA, 2009. Ukraine Landfill Gas Model (September 2009). Developed by SCS Engineers for the U.S. EPA Landfill Methane Outreach Program. EPA, 2010. Colombia Landfill Gas Model (September 2010). Developed by SCS Engineers for the U.S. EPA Landfill Methane Outreach Program. EPA, 2012. International Best Practices Guide for Landfill Gas Energy Projects. Developed by SCS Engineers for the U.S. EPA Landfill Methane Outreach Program. IPCC, 2006. 2006 IPCC Guidelines for National Greenhouse Gas Inventories. Intergovernmental Panel on Climate Change (IPCC), Volume 5 (Waste), Chapter 3 (Solid Waste Disposal), Table 3.1. Patrick Sullivan and Earth Engineering Center. 2010. The Importance of LFG Capture and Utilization in the U.S. SCS Engineers and Earth Engineering Center, Columbia University. 25