1
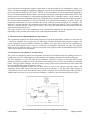
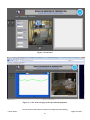
Eleventh LACCEI Latin American and Caribbean Conference for Engineering and Technology (LACCEI’2013) ”Innovation in Engineering, Technology and Education for Competitiveness and Prosperity” August 14 - 16, 2013 Cancun, Mexico. Implementation of a real time monitoring system for a heat exchanger via the internet: Design, construction and testing of the experimental equipment Jorge Duque Rivera Facultad de Ingeniería en Mecánica y Ciencias de la Producción (FIMCP), Escuela Superior Politécnica del Litoral (ESPOL), Guayaquil, Ecuador, [email protected] Oscar Antepara Zambrano Facultad de Ingeniería en Mecánica y Ciencias de la Producción (FIMCP), Escuela Superior Politécnica del Litoral (ESPOL), Guayaquil, Ecuador, [email protected] José Burgos Rivera Facultad de Ingeniería en Mecánica y Ciencias de la Producción (FIMCP), Escuela Superior Politécnica del Litoral (ESPOL), Guayaquil, Ecuador, [email protected] ABSTRACT The development of a digital laboratory based on the Internet can be very beneficial, as these systems are inexpensive, easy to install, and allow communication of video and data in real time with a remote computer. We here report the design and construction of experimental equipment which allows remote monitoring of the thermodynamic variables of a cross flow air – water heat exchanger. The experimental equipment and the principal parts are described. Water flow rate is measured with a rotameter; temperatures are measured for both the cold fluid (water) and the hot fluid (air) with thermocuples, and transmitted via internet, in real time to each remote client linked to the digital lab. For this project a commercial graphical programming language, using the USB port for communication between computer and experimental equipment, was used. Programs were implemented to linearize the thermocouple readings, and filters were placed to remove noise from temperature sensors. The front panel of the system, showing important data of the heat exchanger, plots the measured fluids temperature. From these data, the heat transfer coefficient can be calculated. Moreover, the system displays the experiment (video) and the front panel data from a web page to every computer that is linked to the laboratory, so that the remote client can take control, partial or total, of the experiment in real time from any computer. Finally, some conclusions are presented. Keywords: Experimental, heat exchanger, real time laboratory. 1. INTRODUCTION The emergence of new information and communication technologies, provides the tools necessary for the implementation of remote laboratories. The remote laboratory is a set of physical equipment that can be operated and controlled remotely, using a specific interface. These labs require servers that manage the relation of the users with the laboratory equipment. In this sense, the authors worked with a heat exchanger that developed in a project in a Heat Transfer course, designing and building the experimental equipment. Prashant et al., (2008), present the development of various projects related to remote laboratory experiments in the area of heat transfer and fluid mechanics. Moreover, there are advantages of remote virtual labs and the experience learned through a virtual enviroment in various engineering disciplines from an educational point of view (Prashant et al., 2012) (Naghedolfeizi et al., 2002) (Ammari et al., 2006). Remote lab systems are becoming widely used in industrial and research applications like robotics research (Pitzer et al., 2012), monitor and control laboratory instruments (Figueiredo et al, 2009), and 11th Latin American and Caribbean Conference for Engineering and Technology Cancun, Mexico August 14-16, 2013 1 the development of a maintenance support system based on web and mobile device technologies (Campos et al, 2009). A commercial graphical programming language has been used at the Mechanical Engineering Program of the Escuela Superior Politécnica del Litoral – ESPOL- in the development of several experimental equipment at the areas of instrumentation, fluid mechanics, heat transfer and control systems (Roca, 2004) (Ochoa, 2002). This article presents the development of experimental equipment that will be controlled remotely via the Internet, for heat transfer education in mechanical engineering, specifically heat exchanger characterization. Measurements of the inlet and outlet temperatures of hot and cold fluid for a particular heat exchanger are made. Hence, the temperature information was used to calculate the overall coefficient of heat transfer for the exchanger. The Internet is a tool that will allow the monitoring of the status of the experiment remotely. Thus, a Front Panel was showed to visualize changes on any type of variable. As a result, the experiment can be monitored from any computer that has Internet access. This paper describes each of the components of the experimental equipment, the development of the online monitoring system, presents some results of tests of the equipment and final conclusions. 2. DESCRIPTION OF THE EXPERIMENTAL EQUIPMENT The experimental equipment was built with the purpose to study the thermodynamic variables of a cross flow air – water heat exchanger, and to explore the new technology of remote monitoring and control by computer. The newest technology in control and data acquisition by computer was used to allow control of the experiment, not only on the host computer, but by every user connected to it through the experiment web page. The program allows the user to generate reports, as well as to keep track of the progress of the experimentation using live feed video on the web page of the experiment. 2.1 DESCRIPTION AND SCHEMATIC OF THE SYSTEM The system was designed to acquire the temperature of the hot and cold fluids on the heat exchanger. However, temperatures need to be stabilized prior to performing the corresponding calculations for the heat exchanger. The heat exchanger is a cross flow plate fin heat exchanger with hot air running over the tubes with 3/8pulg. diameter, which have straight fins. In the tube interior water coming from a reservoir was heated by the incoming hot air. This type of heat exchanger was used to achieve a large surface area of heat transfer per unit volume and because it enables large amounts of energy recovery. The experimental equipment includes two 66 liters reservoirs. One of the reservoirs provides water to the exchanger, and the other collects the hot water leaving the heat exchanger. A 12v DC pump with a capacity of 17liters/min was used to force the cold fluid (water) into the exchanger, and a 1600W heat gun with a capacity of 400liters/min was used to force hot air across the exchanger. A scheme of the experiment is shown in Figure 1. 11th Latin American and Caribbean Conference for Engineering and Technology Cancun, Mexico August 14-16, 2013 2 Figure 1: Scheme of experimental equipment The experimental equipment works as follows: water is fed by the pump, the hot air flow is provided by the heat gun, and both of them have an on-off control that works with the voltage from the data acquisition module. When the pump is turned on, it forces the water to the heat exchanger, which is connected with the heater gun that provides the hot air flow at 100oC. The water flow that enters the heat exchanger is measured in liters per minute by a rotameter. The changes of temperatures of both fluids, water and air, are registered by thermocouples installed in the system. Figure 2 shows a picture of the experimental equipment. The camera that was used to acquire video was e-Messenger 112 which has a resolution of 320x240 and a 7fps image acquisition. The front panel, in the computer, shows the changes in the temperatures of the fluids in time on a waveform chart, and the video of the experiment. Figure 2: Experimental equipment set-up: 1,2- Reservoirs; 3-Power supply; 4-Heat gun; 5-Heat exchanger; 6-DC pump; 7-Data acquisition module. 3. INTERFACE AND EQUIPMENT FOR DATA ACQUISITION The data acquisition consists in registering a group of physical variables, transforming them in voltage signals and digitalizing in a way that can be used by a computer. It requires a conditioning step, where the signal must be in the adequate range of values for the device that transforms the analog signal into digital. This element that makes this transformation is the data acquisition module. This project uses the NI USB 6009 with 14bits at 48kS/s (NI-USB 6009, 2004), for being a low cost device, with good functionality and easy to install. LabVIEW© (Laboratory Virtual Instrumentation Engineering Workbench) from National Instruments, was chosen to be the link between the experimental equipment, the lab computer and the remote client. 3.1 TEMPERATURE SENSORS For this project, type J thermocouples were used to register the temperature of the hot and cold fluids due to the temperature ranges of this experiment. A software method was used to compensate the cold joint, which consists in manually introducing the environment temperature. Due to the fact that the voltage output from the thermocouples are highly nonlinear a polynomial adjustment of the form shown below was used (1) 11th Latin American and Caribbean Conference for Engineering and Technology Cancun, Mexico August 14-16, 2013 3 Where V is the output voltage of the thermocouple in volts, T is the temperature in Celsius and a0 through an are specific coefficients for each type of thermocouple (National Instruments, 2010). For this calculation the voltagetemperature converter program was used. 3.2 SIGNAL CONDITIONING The outputs of the thermocouples are very small and change from 7 to 70μV per degree (1 °C), making these signals very susceptible to the effects of electrical noise. The USB-6009 has 14-bit resolution with a minimum range of + / - 1 volt. This gives a resolution of 122 microvolts. The estimated response of the different types of thermocouples can be obtained from the NIST thermocouple table. For this experiment was used a type J with 56 microvolts per degree Celsius. Therefore, the USB-6009 can only measure changes of about 2-3 degrees Celsius. A software filter was used to remove noise from 50 Hz, and then an average of the signals for greater accuracy in measuring temperature was performed. 4. REMOTE MONITORING A feature called remote front panels allows the users to view and control the front panels from a web browser without any additional programming. Figure 3 shows the front panel at the end of the paper. The front panel that was designed for this application contains the following features: Date of the experiment. Time of the experiment. Water flow rate entering the heat exchanger. Air flow rate entering the heat exchanger. Water temperature at exchanger inlet. Air inlet temperature to the exchanger. Moreover, the front panel has the life video feed captured by the camera placed in the experimental equipment so that the remote users can watch the experiment. An ON-OFF control located in the front panel were used to turn on/off the pump or the heat gun; these buttons are located in the left side of the Front Panel, each of them have a LED that indicates the current status of the pump and the heat gun. The heater and the pump are turned on via an interface circuit; this requires a control circuit that can operate power equipment from weak signals. The NI-USB6009 has an output of 0 to 5V and 5mA. To perform the on-off control of the pump, a control circuit was designed that allows the passage of power to the pump when 5V are sent from the NI-USB6009. For this circuit a resistance of 220ohm, a 4N35 optocoupler, a 1k resistor and an IRF540 mosfet were used. The circuit is presented in figure 4. Figure 4: Pump control circuit diagram 11th Latin American and Caribbean Conference for Engineering and Technology Cancun, Mexico August 14-16, 2013 4 To perform the on-off control of the heater, a circuit was designed to activate the heater when 5VDC were sent from the NI-USB6009 through the front panel. For this circuit a resistance of 390ohm, a resistance of 470ohm, a MOC3041 optocoupler, a 1k resistor and a BTA086 triac were used. The circuit is presented in figure 5. Figure 5: Heater control circuit diagram 4.1 REPORT GENERATION The VI (Virtual Instrument) developed for this application has the feature to generate a report that is exported to a spreadsheet in Microsoft Excel. To generate the report there is a button on the front panel called "Generate Report", which once operated open a spreadsheet in Microsoft Excel and copy all the temperature readings obtained through Usb6009 NI. Once the readings are copied to the spreadsheet, it automatically begins to generate the temperature vs. time graph. The Vision Acquisition Software showed to the remote users the behavior of the heat exchanger at all times through the Remote Panel which can be accessed from the Internet. This software includes NI-IMAQ, a free driver for acquiring images from video device such as webcams. 4.2 WEB PUBLISHING LabVIEW© offers the possibility of creating a web server that allows publishing the front panels of the VI's, so this can be accessed from any terminal that has Internet access. Also allows manipulating the controls from the remote terminals, so that any user can control the processes that are running remotely. Figure 6 shows the web page at a remote site at the end of the paper. Something to remark is that the HTML page generated can be modified using any HTML editing tool and include any type of scripts such as ASP, PHP, JavaScript, etc. 5. TESTING AND EXPERIMENTATION To perform the experiment, one must be sure that all the sensors needed are correctly connected before running the program. Once the connections between devices are correctly verified, the desired water flow must be adjusted. The experimental equipment has in the outlet of the pump a bypass that allows the user to adjust the water flow that enters the heat exchanger. To adjust the water flow at minimum, first shut closed the bypass valve until the water flows through the heat exchanger. Once this is done, open the bypass valve to make the water flow that enters to the heat exchanger decrease at minimum. With the water flow adjusted, all sensors and devices correctly connected one can start the experimental work. At the end of the experiment, two graphs with the outlet temperatures of air and water were produced. With the option to generate reports, a table with the values of the temperatures in time was obtained. The average outlet temperature was obtained using the last five values. The average of the last five points it’s done by the software and displayed the average temperature on the front panel and in the spread sheet. Figure 7 shows a graph that was obtained from the system. 11th Latin American and Caribbean Conference for Engineering and Technology Cancun, Mexico August 14-16, 2013 5 Figure 7: Plot of experimental temperature. 6. CONCLUSIONS The outcome of this project is an experiment equipped with the latest technology that can be used as a tool of study and experimentation in the field of industrial instrumentation. The application of this technology is extensive in the industry and should be further developed in our environment. With the help of the program, the acquisition device, the thermocouples and the control circuits, variations in temperatures of fluids in the heat exchanger can be monitored and recorded in the practice that is performed in the experimental equipment. By using the acquisition device through the selected software made the measurements more accurate, and broadcast the video and data through the internet. This temperature monitoring via the Internet prototype, can be very important in modern industry, as it can carry out on a smaller scale in order to simulate and study in a more easy and clear way. According to the results obtained, it will be possible to implement data acquisition live video and data broadcast over the internet in other experimental equipments of the Department, which would consider remote laboratories very useful to solve the crowded experiment problem. ACKNOWLEDGMENT The technical advice of Professor Jorge Roca, instructor of instrumentation and of Professor Eduardo Orcés, senior Professor of Controls and Head of the Mechanical Design area of the Mechanical Engineering Program at ESPOL is greatly appreciated. Their support at allowing the use of the package was very important to the development of this work. Part of the funding of the work came from the ESPOL´s fund for modernization of the laboratory infrastructure for education in the Mechanical Engineering program. REFERENCES Ahmed Chiheb Ammari, Jaleleddine Ben Hadj Slama, (2006). “The Development of a Remote Laboratory for Internet-Based Engineering Education”, Sloan-C Annual Conference. Campos Jaime, Erkki Jantunen, Om Prakash, (2009). “A web and mobile device architecture for mobile emaintenance” The International Journal of Advanced Manufacturing Technology. Figueiredo,R.C. Ribeiro, A.M.O. Arthur, R. ; Conforti, E. (2009). “Remote instrumentation control and monitoring based on LabVIEW and SMS”. Industrial Electronics, 2009. IECON '09. 35th Annual Conference of IEEE 11th Latin American and Caribbean Conference for Engineering and Technology Cancun, Mexico August 14-16, 2013 6 Masoud Naghedolfeizi, Sanjeev Arora, and Singli Garcia, (2002). "Survey of LabVIEW Technologies for Building Web/Internet-Enabled Experimental Setups". National Instruments, web page. http://zone.ni.com/devzone/cda/tut/p/id/4237. 03/23/2010. (date accessed) NI-USB 6009, (2004). User manual, National Instruments. Ochoa Gustavo, (2002). “Diseño y construcción de un equipo interfase de señales para un sistema de adquisición de datos aplicado al banco de bombas centrífugas del Laboratorio de Termofluídos de la FIMCP”, Thesis, Facultad de Ingeniería Mecánica y Ciencias de la Producción, Escuela Superior Politécnica del Litoral. Pitzer,B. Osentoski, S. ; Jay, G. ; Crick, C. ; Jenkins, O.C. (2012). “PR2 Remote Lab: An environment for remote development and experimentation”. Robotics and Automation (ICRA), 2012 IEEE International Conference Prashant K. Jain, Yuxiang Gu, Rizwan-Uddin, (2008). “Broadcasting Engineering Laboratories-Audio/Video and Data-In Real-Time Over the Internet”, Advances in Engineering Education, 1(2), pp.12-13 Prashant Kumar Tripathi, Jidhu Mohan M, K V Gangadharan, (2012). “Design and Implementation of Web based Remote Laboratory for Engineering Education”, International Journal of Engineering and Technology Volume 2 No. 2, Roca Jorge, (2004). “Implementación de un Sistema de Control Digital para el Módulo de Temperatura de la Planta de Procesos Industriales de FIMCP”, Thesis, Facultad de Ingeniería Mecánica y Ciencias de la Producción, Escuela Superior Politécnica del Litoral. Authorization and Disclaimer Authors authorize LACCEI to publish the paper in the conference proceedings. Neither LACCEI nor the editors are responsible either for the content or for the implications of what is expressed in the paper. 11th Latin American and Caribbean Conference for Engineering and Technology Cancun, Mexico August 14-16, 2013 7 Figure 3: Front Panel Figure 6: A view of the web page of the experimental equipment 11th Latin American and Caribbean Conference for Engineering and Technology Cancun, Mexico August 14-16, 2013 8