1
TIBCO® Spotfire® DecisionSite® 9.1.1
for Lead Discovery - User's Manual
Important Information
SOME TIBCO SOFTWARE EMBEDS OR BUNDLES OTHER TIBCO SOFTWARE. USE
OF SUCH EMBEDDED OR BUNDLED TIBCO SOFTWARE IS SOLELY TO ENABLE
THE FUNCTIONALITY (OR PROVIDE LIMITED ADD-ON FUNCTIONALITY) OF THE
LICENSED TIBCO SOFTWARE. THE EMBEDDED OR BUNDLED SOFTWARE IS NOT
LICENSED TO BE USED OR ACCESSED BY ANY OTHER TIBCO SOFTWARE OR FOR
ANY OTHER PURPOSE.
USE OF TIBCO SOFTWARE AND THIS DOCUMENT IS SUBJECT TO THE TERMS AND
CONDITIONS OF A LICENSE AGREEMENT FOUND IN EITHER A SEPARATELY
EXECUTED SOFTWARE LICENSE AGREEMENT, OR, IF THERE IS NO SUCH
SEPARATE AGREEMENT, THE CLICKWRAP END USER LICENSE AGREEMENT
WHICH IS DISPLAYED DURING DOWNLOAD OR INSTALLATION OF THE
SOFTWARE (AND WHICH IS DUPLICATED IN TIBCO BUSINESSWORKS CONCEPTS).
USE OF THIS DOCUMENT IS SUBJECT TO THOSE TERMS AND CONDITIONS, AND
YOUR USE HEREOF SHALL CONSTITUTE ACCEPTANCE OF AND AN AGREEMENT
TO BE BOUND BY THE SAME.
This product includes software licensed under the Common Public License. The source code for
such software licensed under the Common Public License is available upon request to TIBCO
and additionally may be obtained from http://wtl.sourceforge.net/.
This document contains confidential information that is subject to U.S. and international
copyright laws and treaties. No part of this document may be reproduced in any form without
the written authorization of TIBCO Software Inc.
TIBCO, Spotfire, and Spotfire DecisionSite are either registered trademarks or trademarks of
TIBCO Software Inc. and/or subsidiaries of TIBCO Software Inc. in the United States and/or
other countries. All other product and company names and marks mentioned in this document
are the property of their respective owners and are mentioned for identification purposes only.
This software may be available on multiple operating systems. However, not all operating
system platforms for a specific software version are released at the same time. Please see the
readme.txt file for the availability of this software version on a specific operating system
platform.
THIS DOCUMENT IS PROVIDED “AS IS” WITHOUT WARRANTY OF ANY KIND,
EITHER EXPRESS OR IMPLIED, INCLUDING, BUT NOT LIMITED TO, THE IMPLIED
WARRANTIES OF MERCHANTABILITY, FITNESS FOR A PARTICULAR PURPOSE,
OR NON-INFRINGEMENT. THIS DOCUMENT COULD INCLUDE TECHNICAL
INACCURACIES OR TYPOGRAPHICAL ERRORS. CHANGES ARE PERIODICALLY
ADDED TO THE INFORMATION HEREIN; THESE CHANGES WILL BE
INCORPORATED IN NEW EDITIONS OF THIS DOCUMENT. TIBCO SOFTWARE INC.
MAY MAKE IMPROVEMENTS AND/OR CHANGES IN THE PRODUCT(S)
AND/OR THE PROGRAM(S) DESCRIBED IN THIS DOCUMENT AT ANY TIME.
Copyright © 1996- 2008 TIBCO Software Inc. ALL RIGHTS RESERVED.
THE CONTENTS OF THIS DOCUMENT MAY BE MODIFIED AND/OR QUALIFIED,
DIRECTLY OR INDIRECTLY, BY OTHER DOCUMENTATION WHICH ACCOMPANIES
THIS SOFTWARE, INCLUDING BUT NOT LIMITED TO ANY RELEASE NOTES AND
"READ ME" FILES.
TIBCO Spotfire DecisionSite is covered by U.S. Patent No. 6,014,661 and U.S. Patent No. 7,
216,116. Other patent(s) pending.
TIBCO Software Inc. Confidential Information
Table of Contents
Table of Contents
1
1.1
1.2
1.3
2
2.1
2.2
2.3
2.4
3
3.1
3.2
3.3
3.4
3.5
4
4.1
4.2
4.3
4.4
4.5
4.6
4.7
4.8
4.9
5
5.1
5.2
5.3
5.4
5.5
5.6
5.7
5.8
5.9
5.10
5.11
5.12
5.13
5.14
5.15
6
6.1
6.2
6.3
6.4
6.5
PREFACE ................................................................................................................ 1
What is Spotfire DecisionSite? ......................................................................................................... 1
Third Party Components .................................................................................................................. 1
How to Contact Support ................................................................................................................... 3
INTRODUCTION ...................................................................................................... 4
Spotfire DecisionSite Overview ........................................................................................................ 4
Installation and Setup ....................................................................................................................... 5
Getting Started ................................................................................................................................. 6
Lead Discovery Troubleshooting .................................................................................................... 13
LOADING DATA .................................................................................................... 17
Loading Data .................................................................................................................................. 17
DecisionSite Library........................................................................................................................ 17
Import Data ..................................................................................................................................... 21
Information Links ............................................................................................................................ 45
Import SAS Data............................................................................................................................. 56
VISUALIZATIONS ................................................................................................. 60
Scatter Plots ................................................................................................................................... 60
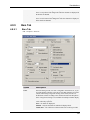
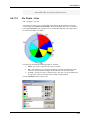
Bar Charts ...................................................................................................................................... 61
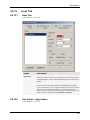
Pie Charts ....................................................................................................................................... 64
Line Charts ..................................................................................................................................... 65
Profile Charts .................................................................................................................................. 66
Heat Maps ...................................................................................................................................... 67
Tables ............................................................................................................................................. 70
Properties Dialog ............................................................................................................................ 72
Working with Visualizations .......................................................................................................... 166
QUERY DEVICES ................................................................................................ 182
What is a Query Device? .............................................................................................................. 182
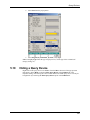
Range Sliders ............................................................................................................................... 183
Item Sliders ................................................................................................................................... 185
Full-text Search ............................................................................................................................ 186
Check Boxes ................................................................................................................................ 189
Radio Button ................................................................................................................................. 190
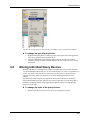
Changing the Type of Query Devices .......................................................................................... 190
Moving Individual Query Devices ................................................................................................. 191
Sorting the Query Devices ........................................................................................................... 192
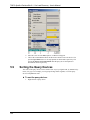
Hiding a Query Device.................................................................................................................. 193
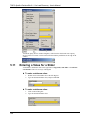
Entering a Value for a Slider ........................................................................................................ 194
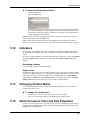
Indicators ...................................................................................................................................... 195
Changing Column Name .............................................................................................................. 195
Quick Access to Color and Size Properties.................................................................................. 195
Initial Query Device Selection ...................................................................................................... 196
DETAILS-ON-DEMAND AND LEGEND .............................................................. 197
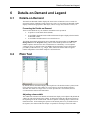
Details-on-Demand....................................................................................................................... 197
Plain Text ...................................................................................................................................... 197
Locking the Details-on-Demand Window ..................................................................................... 199
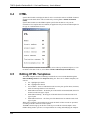
HTML ............................................................................................................................................ 200
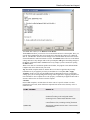
Editing HTML Templates .............................................................................................................. 200
iii
TIBCO Spotfire DecisionSite 9.1.1 for Lead Discovery - User's Manual
6.6
6.7
6.8
6.9
7
Descriptive Statistics for HTML Templates .................................................................................. 202
Editing HTML: An Example .......................................................................................................... 202
Information About the Data Set .................................................................................................... 203
Legend .......................................................................................................................................... 203
WORKING WITH THE DATA .............................................................................. 205
7.1
7.2
7.3
7.4
7.5
7.6
7.7
7.8
7.9
7.10
8
Add Columns ................................................................................................................................ 205
New Column by Binning ............................................................................................................... 215
New Column from Marked Records ............................................................................................. 220
New Column from Expression ...................................................................................................... 221
Column Normalization .................................................................................................................. 241
Pivot Data ..................................................................................................................................... 245
Depivot Data ................................................................................................................................. 249
Transpose Data ............................................................................................................................ 254
Hierarchical Clustering ................................................................................................................. 258
Profile Search ............................................................................................................................... 277
TOOLS ................................................................................................................. 285
8.1
8.2
8.3
8.4
8.5
8.6
8.7
8.8
9
Structure Analytics........................................................................................................................ 285
Portfolio ........................................................................................................................................ 335
List Logic ...................................................................................................................................... 348
Web Links ..................................................................................................................................... 350
Compound Details ........................................................................................................................ 354
Computation Services .................................................................................................................. 355
Distance Calculator ...................................................................................................................... 381
Administration Tools ..................................................................................................................... 381
GUIDES................................................................................................................ 383
9.1
9.2
9.3
9.4
9.5
9.6
What is the Guides Pane? ............................................................................................................ 383
Guides .......................................................................................................................................... 383
Guides Pane Options ................................................................................................................... 384
Run from Library... ........................................................................................................................ 385
Create and Edit Guide .................................................................................................................. 387
Publish to Library .......................................................................................................................... 409
10
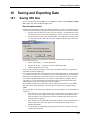
SAVING AND EXPORTING DATA .................................................................. 415
10.1
10.2
10.3
10.4
10.5
10.6
10.7
10.8
10.9
10.10
10.11
10.12
10.13
10.14
Saving SFS files ........................................................................................................................... 415
Spotfire Files................................................................................................................................. 416
Publish Analysis to Library ........................................................................................................... 418
Publish Poster to Library .............................................................................................................. 422
Microsoft PowerPoint Presentation .............................................................................................. 437
Microsoft Word Presentation ........................................................................................................ 439
Export as Web Page..................................................................................................................... 440
Export SDFile ............................................................................................................................... 442
Exporting Details-on-Demand ...................................................................................................... 443
Export Current Visualization..................................................................................................... 443
Export Database Queries ......................................................................................................... 444
Export Legend Image ............................................................................................................... 444
Export Data .............................................................................................................................. 445
Printing ..................................................................................................................................... 446
11
QUICK REFERENCE ....................................................................................... 447
11.1
11.2
11.3
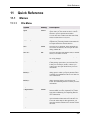
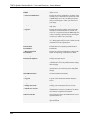
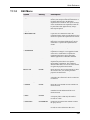
Menus ........................................................................................................................................... 447
Query Device Pop-Up Menu ........................................................................................................ 456
Visualization Pop-up Menu ........................................................................................................... 458
iv
Table of Contents
11.4
11.5
Toolbar Buttons ............................................................................................................................ 466
Mouse Shortcuts........................................................................................................................... 468
12
GLOSSARY ...................................................................................................... 472
13
INDEX ............................................................................................................... 478
v
Preface
1
1.1
Preface
What is Spotfire DecisionSite?
TIBCO® Spotfire® DecisionSite® is a solution for accessing, analyzing, and reporting on data.
It enables you to rapidly identify trends, anomalies, outliers and patterns in your data.
Spotfire DecisionSite can access data residing in databases, in a local or networked file system,
or on the desktop. It is database independent and extracts data (several hundred thousand
records or more, depending on computer performance) from commercial data sources such as
Oracle, SQL-Server, Informix, and Sybase.
Spotfire DecisionSite uses the patented Spotfire DecisionSite visualization technology,
allowing you to interactively query data and instantly visualize results as scatter plots, bar
charts, profile charts and a number of other modes.
Spotfire DecisionSite stores data internally in a proprietary data format, allowing for rapid
response times to user interaction. It has a series of built in heuristics and algorithms that helps
you find interesting alternative views of data.
Spotfire DecisionSite allows you to share your work. Analyses can be easily presented as
structured reports for printing or Internet publishing.
1.2
1.2.1
Third Party Components
SharpZipLib 0.8.4 from IC#Code
License
The library is released under the GPL with the following exception: Linking this library
statically or dynamically with other modules is making a combined work based on this library.
Thus, the terms and conditions of the GNU General Public License cover the whole
combination. As a special exception, the copyright holders of this library give you permission
to link this library with independent modules to produce an executable, regardless of the license
terms of these independent modules, and to copy and distribute the resulting executable under
terms of your choice, provided that you also meet, for each linked independent module, the
terms and conditions of the license of that module. An independent module is a module which
is not derived from or based on this library. If you modify this library, you may extend this
exception to your version of the library, but you are not obligated to do so. If you do not wish to
do so, delete this exception statement from your version. Note: The exception is changed to
reflect the latest GNU Classpath exception. Older versions of #ziplib did have another
exception, but the new one is clearer and it doesn't break compatibility with the old one. Bottom
line: In plain English this means you can use this library in commercial closed-source
applications.
1.2.2
WebFX Menu 4.22 and 4.30 from WebFx
Microsoft Permissive License (Ms-PL)
Published: October 18, 2005
This license governs use of the accompanying software. If you use the software, you accept this
license. If you do not accept the license, do not use the software.
1. Definitions
The terms "reproduce," "reproduction" and "distribution" have the same meaning here as under
U.S. copyright law. "You" means the licensee of the software. "Licensed patents" means any
1
TIBCO Spotfire DecisionSite 9.1.1 for Lead Discovery - User's Manual
Microsoft patent claims which read directly on the software as distributed by Microsoft under
this license.
2. Grant of Rights
(A) Copyright Grant- Subject to the terms of this license, including the license conditions and
limitations in section 3, Microsoft grants you a non-exclusive, worldwide, royalty-free
copyright license to reproduce the software, prepare derivative works of the software and
distribute the software or any derivative works that you create.
(B) Patent Grant- Subject to the terms of this license, including the license conditions and
limitations in section 3, Microsoft grants you a non-exclusive, worldwide, royalty-free patent
license under licensed patents to make, have made, use, practice, sell, and offer for sale, and/or
otherwise dispose of the software or derivative works of the software.
3. Conditions and Limitations
(A) No Trademark License-This license does not grant you any rights to use Microsoft’s name,
logo, or trademarks.
(B) If you begin patent litigation against Microsoft over patents that you think may apply to the
software (including a cross-claim or counterclaim in a lawsuit), your license to the software
ends automatically.
(C) If you distribute copies of the software or derivative works, you must retain all copyright,
patent, trademark, and attribution notices that are present in the software.
(D) If you distribute the software or derivative works in source code form you may do so only
under this license (i.e., you must include a complete copy of this license with your distribution),
and if you distribute the software or derivative works in compiled or object code form you may
only do so under a license that complies with this license.
(E) The software is licensed "as-is." You bear the risk of using it. Microsoft gives no express
warranties, guarantees or conditions. You may have additional consumer rights under your local
laws which this license cannot change. To the extent permitted under your local laws, Microsoft
excludes the implied warranties of merchantability, fitness for a particular purpose and noninfringement.
1.2.3
STLPort 5.1.0
Copyright 1994 Hewlett-Packard Company
Copyright 1996,97 Silicon Graphics Computer Systems, Inc.
Copyright 1997 Moscow Center for SPARC Technology.
Permission to use, copy, modify, distribute and sell this software and its documentation for any
purpose is hereby granted without fee, provided that the above copyright notice appear in all
copies and that both that copyright notice and this permission notice appear in supporting
documentation. Hewlett-Packard Company makes no representations about the suitability of
this software for any purpose. It is provided "as is" without express or implied warranty.
Permission to use, copy, modify, distribute and sell this software and its documentation for any
purpose is hereby granted without fee, provided that the above copyright notice appear in all
copies and that both that copyright notice and this permission notice appear in supporting
documentation. Silicon Graphics makes no representations about the suitability of this software
for any purpose. It is provided "as is" without express or implied warranty. Permission to
use, copy, modify, distribute and sell this software and its documentation for any purpose is
hereby granted without fee, provided that the above copyright notice appear in all copies and
that both that copyright notice and this permission notice appear in supporting documentation.
Moscow Center for SPARC Technology makes no representations about the suitability of this
software for any purpose. It is provided "as is" without express or implied warranty.
1.2.4
Numerical Recipes
Copyright © 1986-1992 Numerical Recipes Software
2
Preface
1.3
How to Contact Support
If you have any questions about a TIBCO Spotfire® product, please do the following:
• Use the built-in help function.
• Consult the README files which are included with the product.
• Visit the Spotfire web site, http://support.spotfire.com, where you can send questions
to our support department.
• Get personal contact from TIBCO Spotfire Support.
TIBCO Spotfire offers a variety of support agreements. Contact TIBCO Spotfire for more
information about support, training, consulting agreements, and our Product Subscription
Programs.
3
TIBCO Spotfire DecisionSite 9.1.1 for Lead Discovery - User's Manual
2
2.1
2.1.1
Introduction
Spotfire DecisionSite Overview
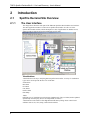
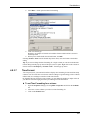
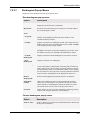
The User Interface
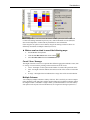
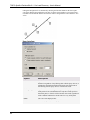
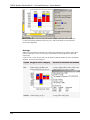
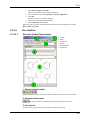
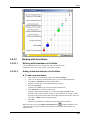
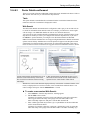
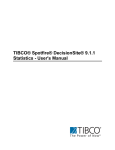
The image below shows the main parts of the TIBCO® Spotfire® DecisionSite® user interface.
The entire application window is referred to as Spotfire DecisionSite. It is the core of the
Spotfire DecisionSite solution, which encompasses a suite of applications for database access,
statistical analysis, data preprocessing and domain-specific tasks.
Visualizations
Visualizations are the key to analyzing data in Spotfire DecisionSite. A variety of visualization
types can be used to provide the best view of the data:
Scatter Plots
Bar Charts
Pie Charts
Line Charts
Profile Charts
Heat Maps
Tables
Different types of visualizations can be shown simultaneously. They are linked, and are updated
dynamically when the query devices are manipulated (see below).
Visualizations can be made to reflect high-dimensional data by letting values control visual
attributes such as size, color, shape, rotation and text labels.
4
Introduction
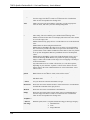
The Query Device window
Query devices are used to filter your data. Query devices appear in several forms, and you can
easily select a type of query device that best suits your needs (e.g., check boxes, sliders, etc.).
When you manipulate a query device by moving a slider or selecting a check box, all
visualizations are immediately updated to reflect the new selection of data.
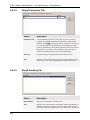
The Details-on-Demand window
The Details-on-Demand window can be used to show the exact values of a record or group of
records. By clicking a record in a visualization, or marking several records by drawing a
rectangle around them, you can study their numerical values and textual data in a tabular form.
The Guides pane
The Guides pane is a web browser, fully integrated into the Spotfire DecisionSite environment.
This is where you can run Guides, step-by-step instructions for common workflows or tutorials,
guiding you through an analysis.
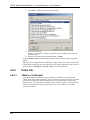
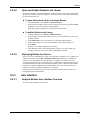
2.1.2
Lead Discovery Features
TIBCO delivers several different Guided Analytical applications. Which tools are present in
your DecisionSite depends on which application package you are using and what licenses you
have bought. Depending on the nature of the various features, you will find them under the File,
Data, Tools or Guides menu.
Tools that are launched in the Guides pane (e.g., Information Builder) or in separate web
windows have their own online help files. To access the online help for these applications, you
must first start the application by selecting the appropriate link from the menu. Once an
application has been launched, the online help is reached via the Help menu in the application
window.
2.2
2.2.1
Installation and Setup
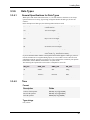
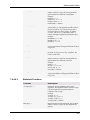
Hardware Requirements
Spotfire DecisionSite in itself does not require very high powered computers to run smoothly.
However, if your data sets are large they will require both a certain amount of RAM, and will of
course benefit from high processor speeds.
Minimal Client Hardware requirements
Processor:
Intel PentiumTM or equivalent, 500 MHz
RAM:
128 MB (256 MB or greater is recommended)
Hard Disk:
The installation footprint is approximately 30 MB
Display:
VGA or better, resolution 800x600 pixels, 256 colors (1024x768
pixels, 16 bit high colors or greater is recommended)
Others:
Network card or modem
Mouse
CD-ROM drive (if installation is done from a CD-ROM)
Graphics cards
When 3D visualizations are used for analyzing, you will find that the graphics card of the
computer is an important component. OpenGL support is required and hardware acceleration
beneficial to allow the processor to devote its work to other things than presenting the display
5
TIBCO Spotfire DecisionSite 9.1.1 for Lead Discovery - User's Manual
with information. Due to the great variety of graphics cards manufacturers, Spotfire
DecisionSite has not been tested on all of them. If you experience difficulties or slow
performance, check that the most recent drivers for your hardware are installed and that the
manufacturer's recommendations are met.
2.2.2
Software Requirements
During the installation process the setup program checks that your computer contains all
necessary operating system components. Most components are mandatory, while some may be
missing without the installation being aborted. If this is the case you will be warned about the
missing system component.
Please visit http://www.spotfire.com/sr for information on which Operating System and other
Software versions that are required to run DecisionSite Client.
Web connection
Spotfire DecisionSite requires a Web connection to a Spotfire DecisionSite Analytics Server,
either at http://home.spotfire.net or a company specific Spotfire DecisionSite Analytics Server.
Microsoft Internet Explorer on the client should be configured to access the Spotfire
DecisionSite Analytics Server via the standard Web connection. The security settings in
Microsoft Internet Explorer for accessing the Spotfire DecisionSite Analytics Server should be
set to Medium Security. This includes enabling ActiveScripting, enabling cookies and enabling
the download of signed ActiveX components. Downloading signed ActiveX components and
scripts from the Spotfire DecisionSite Analytics Server must be allowed through the firewall.
Other requirements
You must have Administrator privileges to install Spotfire DecisionSite.
Microsoft PowerPoint must be installed on the computer in order to use the PowerPoint
presentation tool.
Microsoft Word must be installed on the computer in order to use the Word presentation tool.
2.3
2.3.1
Getting Started
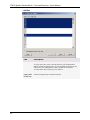
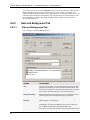
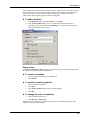
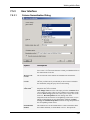
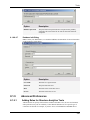
Logging In
Logging In
When you start Spotfire DecisionSite a login dialog appears. First select which DecisionSite
Analytics Server you want to log into by clicking on the Server drop-down list. Usually you
will only have one server so there might not be a need to choose. You can also add a new server
if you need to, by clicking on the Server drop-down list, selecting Add new... and typing in the
location and name of the new server.
Then type your User ID and Password, and click on the Login button to start Spotfire
DecisionSite.
Logging into Spotfire DecisionSite will give you access to the Guides and Tools that are
specific for your profile. Pressing Cancel will start Spotfire DecisionSite but will not provide
access to these Guides and Tools. See also Working Offline below.
Depending on the configuration of your DecisionSite Analytics Server, some of the following
options may be available in the login dialog:
Remember me
If you select this check box when you log in, you will not be prompted to log in when you start
Spotfire DecisionSite the next time. Your User ID and Password will be saved on your
computer and will be used automatically each time you start Spotfire DecisionSite.
Register a new user
If you are not a registered user of Spotfire DecisionSite click on the Register a new user link.
6
Introduction
This will display a new window in which you can register. You will then be able to access the
specific features of Spotfire DecisionSite that you have a license for.
Working Offline
If you have no network connection to the DecisionSite Analytics Server you can still use most
features of Spotfire DecisionSite. Start DecisionSite as usual and log in when prompted. Even
though you are working offline without any connection to the Spotfire DecisionSite Analytics
Server or the internet, you will still be able to use most of the Guides and Tools if these were
cached locally on your computer the last time you were connected to the server. The exceptions
are those Guides and Tools that need to connect to databases, etc., which obviously cannot do
so while working offline.
Note: Working offline requires at least one previous successful login to the Spotfire
DecisionSite Analytics Server. Each time you log into the server it checks to see which Guides
and Tools that should be available to you, and if there are any new updates. Spotfire
DecisionSite automatically downloads these to your computer so that they are available the next
time you log in, whether you are connected to the server or not.
Unsupported Software
If your computer does not have the proper software installed (for example an Internet Explorer
version that is too old) a dialog will appear. This dialog will state exactly what is wrong, and
also ask you to contact your Administrator for further help.
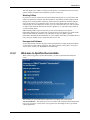
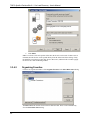
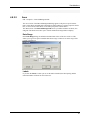
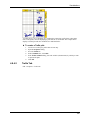
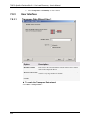
2.3.2
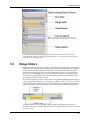
Welcome to Spotfire DecisionSite
When you have logged in to Spotfire DecisionSite, you will be presented with a Welcome
screen.
This will help you get started with the application by providing some useful options:
Get an introduction – This option gives you a five minute tour of Spotfire DecisionSite and of
how to use its features. It is the perfect way to get the basic knowledge of how to get started
with the application.
7
TIBCO Spotfire DecisionSite 9.1.1 for Lead Discovery - User's Manual
Open a sample file – This option presents a number of example data sets, and describes the
content of each data set. You can easily open any of these data sets in DecisionSite and explore
the visualizations on your own.
Open data – This option provides a quick way for you to access your own data. It gives you the
choice to open a file, paste data from your clipboard or open data from an information link to a
database.
Switch to another DecisionSite – Different DecisionSites have a different set of Tools and
Guides. If you are missing a certain Tool or Guide that you believe should be available, you
may need to switch to another DecisionSite. This option explains how to do this.
Click on Close this window to close the welcome screen and start using DecisionSite.
If you also select the Don't show this window at startup check box, the welcome screen will
not appear when you start the application in the future. However, if you wish to display it again
it is always available from the View menu, by selecting Getting Started.
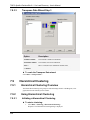
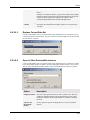
2.3.3
Loading Data
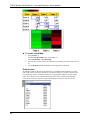
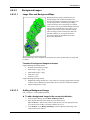
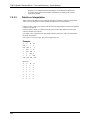
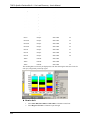
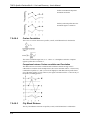
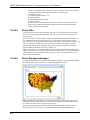
The Periodic table data set
As an example of simple, yet interesting information, the periodic table of the elements will be
used. The data set holds 75 records with 9 fields each. The columns are: the name of the
element, six of its properties, and finally the coordinates of each element when the periodic
table is printed in the familiar layout first suggested by Dimitri Mendeleev. The text file
contains the column names, column types (integer or string) and the data itself.
Element, Atomic Number, Atomic Mass, Atomic Radius, Ionic Radius,
Ionization Energy, Electronegativity,*P1,*P2
STRING,INT,INT,INT,INT,INT,INT,INT,INT
Ac,89,227,200,126,51,11,140,0
Ag,47,107,144,129,75,18,630,80
Al,13,27,143,67,60,16,750,160
.....
This data is stored in one of the data formats recognized by Spotfire DecisionSite. This
particular example can be found in the directory named Data/General/Periodic Table in the
Spotfire DecisionSite distribution as periodic.csv.
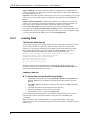
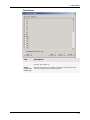
Loading a data set
► To load a data set into Spotfire DecisionSite:
1.
Start Spotfire DecisionSite by selecting Spotfire DecisionSite from Programs in the
Windows Start menu, or by double-clicking the Spotfire DecisionSite icon on the
desktop.
2. Select File > Open in the Spotfire DecisionSite main window. The File open dialog
will appear.
3. The folder Data will be shown in the DecisionSite directory.
4. Browse to the folder General/Periodic/Periodic Table.
5. Select the file periodic.csv and click the Open button.
Spotfire DecisionSite will automatically set up an initial visualization where each record is
represented by a marker, along with a number of query devices for manipulating the
visualization.
Tip: An alternative way of loading the data is to open the file periodic.sfs. This may be
preferable since sfs-files contain Spotfire-specific information on how the visualizations will be
initially set up.
8
Introduction
2.3.4
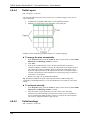
Changing Visualization Axes
To change the column to be mapped to each axis, click on an axis selector, and select a column
name. For example, to see the Mendeleevian layout of the peroidic.csv example data set, select
P1 for the X-axis and P2 for the Y-axis.
Note: You can also select which column to use as an X, Y or Z-axis by right-clicking on the
Query Device representing that column, and selecting Set Property > Axis from the pop-up
menu.
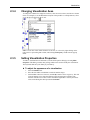
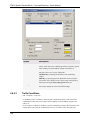
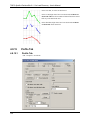
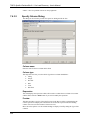
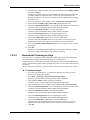
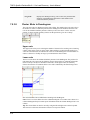
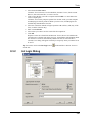
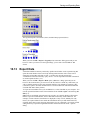
2.3.5
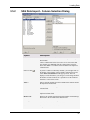
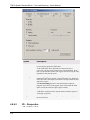
Setting Visualization Properties
To make a visualization more informative, activate the Properties dialog by selecting Edit >
Properties. This dialog contains many settings which can be used to modify the visualization.
The keyboard shortcut is [Alt+Enter] or [Ctrl+Enter].
► To adjust the appearance of a visualization:
1.
2.
3.
Select the Markers tab.
Move the Size slider towards Max to make the markers larger.
Set the Color control to Continuous, and the By control to Electronegativity. This will
cause the markers to be colored according to their electronegative potential. The
elements with the lowest values will be red and the highest blue. You may alter these
colors with a dialog box that opens under Customize.
9
TIBCO Spotfire DecisionSite 9.1.1 for Lead Discovery - User's Manual
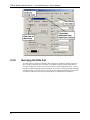
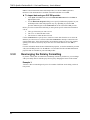
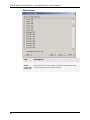
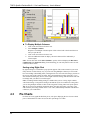
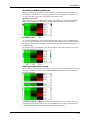
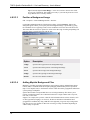
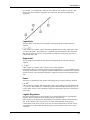
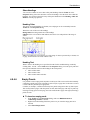
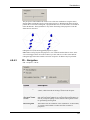
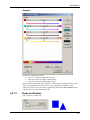
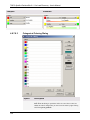
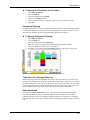
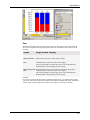
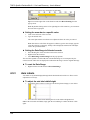
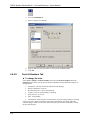
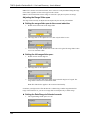
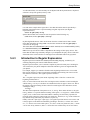
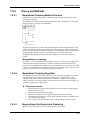
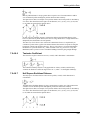
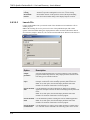
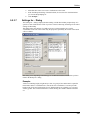
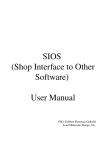
2.3.6
Querying the Data Set
To select a subset of markers to display in the visualizations, change the settings of the query
device sliders found in the area to the right. For example, using the Periodic Table data set,
move the left drag box of the Ionization Energy slider, as shown in the image below, to select
only those elements with high ionization energies. We can now see that the elements with high
ionization energy are more or less the same as those with high Electronegativity since there are
few markers with color representing low electronegative potential in the visualization.
10
Introduction
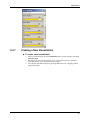
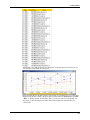
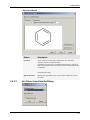
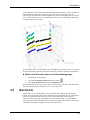
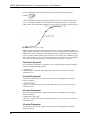
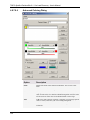
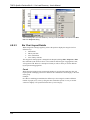
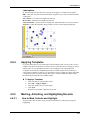
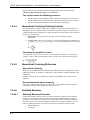
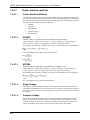
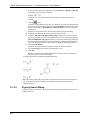
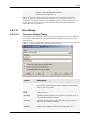
2.3.7
Creating a New Visualization
► To create a new visualization:
1.
2.
3.
Select a visualization type from the Visualization menu. For this example, select New
3D Scatter Plot.
Reassign the X-axis to Electronegativity the Y-axis to Ionization Energy and the Zaxis (along the top of the visualization) to Ionic Radius
View the plot from different angles by pressing Shift and/or Ctrl + dragging with the
right mouse button.
11
TIBCO Spotfire DecisionSite 9.1.1 for Lead Discovery - User's Manual
The 3D plot created in this example will cover the 2D plot but you can show both plots by
selecting Window > Auto Tile.
If you move your mouse pointer over one of the markers in the 2D plot, the corresponding
marker will also be highlighted in the 3D view. If you activate one element in the 2D plot (by
clicking on it) you can move the circle indicating the active element using the arrow keys.
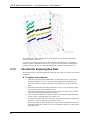
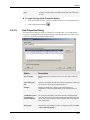
2.3.8
Checklist for Exploring New Data
The following steps are typically helpful when exploring a new data set, especially if its content
is unknown.
► To explore a new data set:
1.
2.
3.
4.
5.
6.
12
Start off by selecting different combinations of visualization axes to reveal patterns,
trends, and anomalies. Use View Tip to browse through different combinations of
axes. The anomalies should be scrutinized to determine if they are due to erroneous
data.
Write down particularly interesting combinations of axes, or save the settings so that
you can retrieve interesting visualizations later.
Color the visualization objects, first by category. Again, write down or save variables
that produce interesting groupings and/or patterns.
Color visualization objects by continuous variables, to reveal areas where interesting
features such as consistently high or low values occur.
Go through the range sliders to reveal markers with values occurring in a certain range
and observe if they are grouped in some kind of cluster.
When interesting clusters are identified, these may be either zoomed in on or marked,
followed by changing to another view to reveal whether the markers are clustered for a
particular reason.
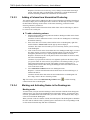
Introduction
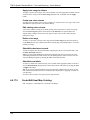
2.4
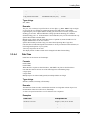
Lead Discovery Troubleshooting
This topic lists some known trouble situations when working with Spotfire DecisionSite for
Lead Discovery and explains how to solve or work around the problems.
The interaction with visualizations is very slow
Problem: Sometimes the interaction between some Lead Discovery tools and the
visualizations is very slow.
Explanation: All records in the object that you interact with are marked by default in the
visualizations. When you work with a large data set in Spotfire DecisionSite, it takes a long
time for the application to mark all records.
Solution: You can switch off the auto-mark function for the Structure Viewer in the Structure
Viewer Properties dialog when working with large data sets. You can also switch off the automark function for the Portfolio in the Portfolio: Options dialog by clearing the Mark on
browse check box.
Columns are not added to the data set
Problem: When I try to add a column from Structure Viewer to the data set, no column is
added. A message appears: "The columns were not added correctly".
Explanation: This is a problem caused by the column identification in Spotfire DecisionSite.
You may have previously added a column from the same tool and then changed the name of
that column in Spotfire DecisionSite.
When you try to add another column, Spotfire DecisionSite thinks the column already exists
and therefore no new column is added.
Solution: Do not rename the columns that are added from Structure Viewer. If you have
already renamed columns, you need to remove these to be able to add new columns from
Structure Viewer.
Added column contains empty values
Problem: When I add a column to the data set from a Lead Discovery tool, the new column
contains empty values for some of the records.
Explanation: If you add a column from any of the Lead Discovery tools, the column will
only contain values for those compounds that were included in the calculation. If you chose to
work on selected compounds, only the compounds that were selected via the query devices
and zoom bars will be included in the calculation. All other records in the data set will have
empty values in the new column.
Solution: The only solution is to include all records in the calculations. Make sure you set
Work on: to All records in the options dialog of the tool.
If you want to work on selected compounds, there will always be empty values for those
compounds that are not included in the calculation.
Structures are not shown in Structure Viewer
Problem: No structures are shown when I interact with records in a visualization, dendrogram
or Portfolio list.
13
TIBCO Spotfire DecisionSite 9.1.1 for Lead Discovery - User's Manual
Explanation:
The ID field of the database in the structure connection must contain the same type of
information as the Spotfire ID column or Portfolio list, or else no structures will be shown.
If a compound in the visualization or Portfolio list is not found in the ISIS database, no
structure can be shown.
Solution: Make sure you have selected the correct ID fields/columns using the Structure
Connection tool.
I cannot mark a list (or a record) in the Portfolio
Problem: When I click on a list (or a compound) in the Portfolio nothing happens with the
Structure Viewer tool, nor with the visualizations.
Explanation: The list (or compound) was probably marked before and when you click on it
again, the application does not notice any change.
Solution: Click on another object in the Portfolio and then click on the list (or compound) you
want to mark again.
If nothing happens in the visualizations when you click in the Portfolio, the interaction
concerning marked records has probably been switched off. In the Portfolio:Options dialog,
make sure Mark on browse check box is selected.
I cannot mark records in the ID list
Problem: When I click on a record in the ID list, nothing happens in the visualizations.
Explanation: There may be a number of reasons why nothing happens in the visualizations.
See below.
Solution: You need to make sure the following is OK.
The ID field of the database and the Spotfire ID column in the structure connection must
contain the same type of information, or else there will be no interaction with the records in
the visualizations.
The compound must be part of the current data set in Spotfire DecisionSite.
No structure keys are added when using Add ISIS Keys
Problem: No structure keys are added to the data set, or structure keys are only imported for
some of the records.
Explanation: Structure keys are only imported for records that are included both in the ID list
and in the current data set in Spotfire DecisionSite.
Solution: You need to make sure the following is OK.
The ID field of the database and the Spotfire ID column in the structure connection must
contain the same type of information, or else there will be no interaction with the records in
the visualizations.
To import structure keys for a compound in Spotfire DecisionSite, the compound must be
present both in the current data set and in the ID list.
14
Introduction
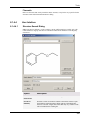
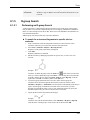
Edit Structure in Structure Search does not seem to work
Problem: When I click on the Edit Structure button in the Structure Search tool, nothing
happens.
Explanation: If you have never opened ISIS/Draw on your computer, Spotfire DecisionSite
does not find the program.
Solution: Start ISIS/Draw once as a stand alone application (e.g., from the Start menu).
The Structure Analytics tools always use MDL Draw even though I
have selected ISIS/Draw as my editor/renderer.
Problem: I have added preferences to always use ISIS/Draw as my structure editor/renderer,
but it is always MDL Draw that turns up. This also has the effect that the R-group Search tool
cannot be used, since it requires use of ISIS/Draw.
Explanation: This problem occurs when MDL Draw has been installed as the drawing editor
to associate with the MDL file extensions and to use in MS Office applications:
Since DecisionSite uses the same settings as the Office applications, this will unfortunately
make it impossible to use ISIS/Draw, even though it is installed on your computer.
Solution:
Reinstall MDL Draw and select ISIS/Draw as the default drawing editor.
Explicitly configure DecisionSite to use MDL Draw for structure editing, where desired.
I cannot send edited structures back from MDL Draw
Problem: I use MDL Draw 2.1 as structure editor. When I edit a structure in MDL Draw and
15
TIBCO Spotfire DecisionSite 9.1.1 for Lead Discovery - User's Manual
click on the Transfer button to send the structure back to the DecisionSite Structure Search
dialog, an error message is shown: "Unable to update clipboard because the MDLDrawObject
component is missing", and no structure is returned.
Explanation: This problem occurs when MDL Draw has been installed as the drawing editor
to associate with the MDL file extensions and to use in MS Office applications. See above.
Solution:
Reinstall MDL Draw and select ISIS/Draw as the default drawing editor.
Explicitly configure DecisionSite to use MDL Draw for structure editing, where desired.
16
Loading Data
3
3.1
Loading Data
Loading Data
The Periodic table data set
As an example of simple, yet interesting information, the periodic table of the elements will be
used. The data set holds 75 records with 9 fields each. The columns are: the name of the
element, six of its properties, and finally the coordinates of each element when the periodic
table is printed in the familiar layout first suggested by Dimitri Mendeleev. The text file
contains the column names, column types (integer or string) and the data itself.
Element, Atomic Number, Atomic Mass, Atomic Radius, Ionic Radius,
Ionization Energy, Electronegativity,*P1,*P2
STRING,INT,INT,INT,INT,INT,INT,INT,INT
Ac,89,227,200,126,51,11,140,0
Ag,47,107,144,129,75,18,630,80
Al,13,27,143,67,60,16,750,160
.....
This data is stored in one of the data formats recognized by Spotfire DecisionSite. This
particular example can be found in the directory named Data/General/Periodic Table in the
Spotfire DecisionSite distribution as periodic.csv.
Loading a data set
► To load a data set into Spotfire DecisionSite:
1.
Start Spotfire DecisionSite by selecting Spotfire DecisionSite from Programs in the
Windows Start menu, or by double-clicking the Spotfire DecisionSite icon on the
desktop.
2. Select File > Open in the Spotfire DecisionSite main window. The File open dialog
will appear.
3. The folder Data will be shown in the DecisionSite directory.
4. Browse to the folder General/Periodic/Periodic Table.
5. Select the file periodic.csv and click the Open button.
Spotfire DecisionSite will automatically set up an initial visualization where each record is
represented by a marker, along with a number of query devices for manipulating the
visualization.
Tip: An alternative way of loading the data is to open the file periodic.sfs. This may be
preferable since sfs-files contain Spotfire-specific information on how the visualizations will be
initially set up.
3.2
3.2.1
DecisionSite Library
What is DecisionSite Library?
DecisionSite Library provides publishing capabilities for of all your analysis materials, so you
can share the data with your colleagues. Using the Library, you can organize your analysis
material and collaborate with others in a distributed environment. The Library can be used
directly from DecisionSite Client by anyone who has at least read privileges.
The DecisionSite Library is divided into Library Sections which contain all material published
to the Library and where access permissions are set. With write access you can open and
17
TIBCO Spotfire DecisionSite 9.1.1 for Lead Discovery - User's Manual
publish any type of analysis material; Analyses, Guides, or Posters. If you have read access you
can open any material in the Library Section.
For more information, see the Library Help in the DecisionSite Library tool.
Note: The license for DecisionSite Library must be enabled if you intend to use the Library.
Note: You must have a license for DecisionSite Posters to use DecisionSite Posters.
Please contact your DecisionSite Administrator for information about licenses.
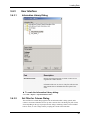
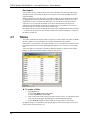
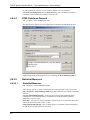
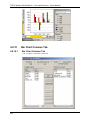
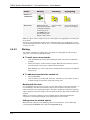
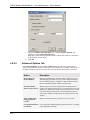
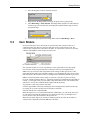
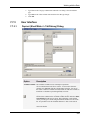
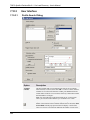
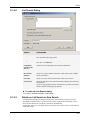
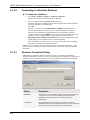
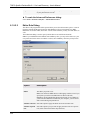
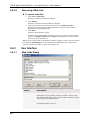
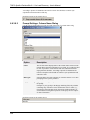
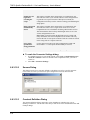
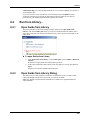
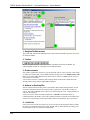
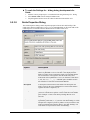
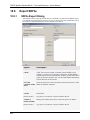
3.2.2
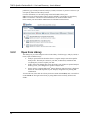
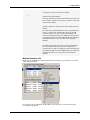
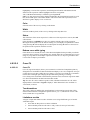
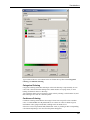
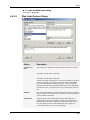
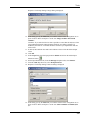
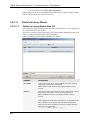
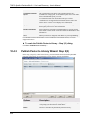
Open from Library
This dialog lets you select and open an item in the Library. Each item type, Analysis, Guide, or
Poster, opens in different ways:
• Analysis: opens in the DecisionSite Client as a regular Analysis stored in a Spotfire
Analysis File. The Analysis consists of your data, visualizations, annotations and
everything else you use to explore your data.
• Guide: opens in the Guides pane where the Guide is run. Guides are captured analyzes
made by you or your colleagues for repetitive analysis flows.
• Poster: opens in a separate Microsoft® Internet Explorer where the Poster is displayed.
Posters are web based snap-shots of your Analysis, designed for easy sharing and
collaboration.
To locate the item, either look in a Library Section's content on the Library tab, or search for it
on the Search tab. Navigate in the Library by using double-click on Library Sections and
folders.
18
Loading Data
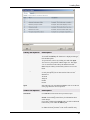
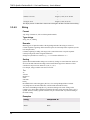
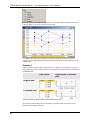
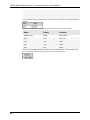
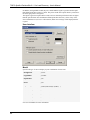
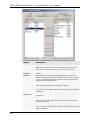
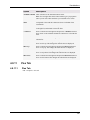
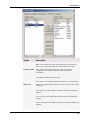
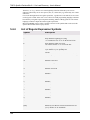
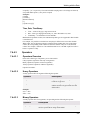
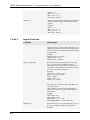
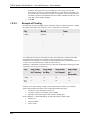
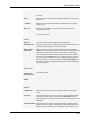
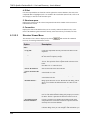
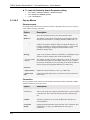
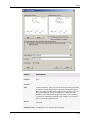
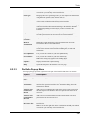
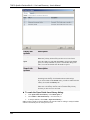
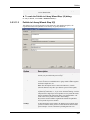
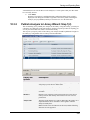
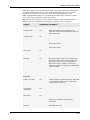
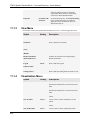
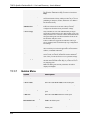
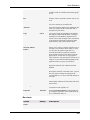
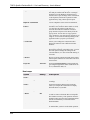
Library tab options
Description
Library tab
All Library Sections, items, and folders are listed in the Library
View under the Library tab. Each item is displayed with type,
title and description.
To open an item, select it by clicking on it and click Open.
You can view your position with the flight view. The flight
view is seen between the Library tab and the item table.
Note: Only the Library Sections that you have access to are
listed.
Items of type:
Select the item type you want to view. This filter allows you to
see only the options you are interested in. There are four
alternatives:
All items
Analyses
Guides
Posters
Open
Select the item you want and click Open to open it. See the top
of the page about the various responses.
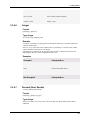
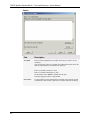
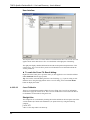
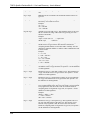
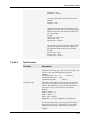
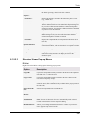
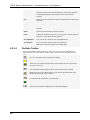
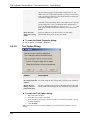
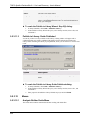
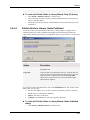
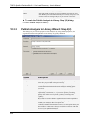
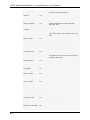
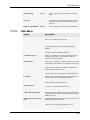
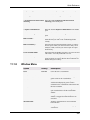
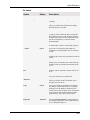
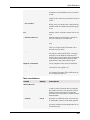
Search tab options
Description
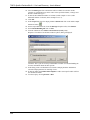
Search tab
Use Search to search for the item you want to open.
Search for:
Enter the search string in the Search for: field and click
Search. See Searching in the Library for information about
search strings.
If you click a folder in the Search result, you will be redirected
to the Library View under the Library tab.
Look in:
Select which Library Section you want to perform your search
in. Either all Library Sections or one can be searched. Only
19
TIBCO Spotfire DecisionSite 9.1.1 for Lead Discovery - User's Manual
Library Sections you have access to are listed.
Items of type:
Select which type of Library item you want to perform your
search on. There are four alternatives:
All items
Analyses
Guides
Posters
► To reach the Open from Library dialog:
Click File > Open from Library....
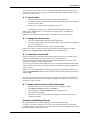
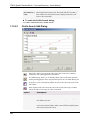
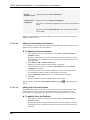
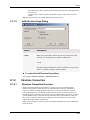
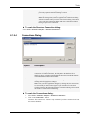
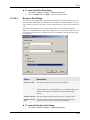
3.2.3
Searching in the Library
Search
Searches are performed on title, description, and keywords for a precise result. Searching works
according to the following criteria:
• The search is either performed on all Library Sections or one at a time.
• The search is either performed on all Library items or on only one type at a time. (If
the Open from Library dialog is reached via the Guides pane or the Guides menu,
Guides are always the only items found in the search.)
• The search words are matched according to title, keywords, or description. Note that
folders are also included in the search.
• The search words are separated by space.
• All words used in the search must be present in the item properties.
• To find a phrase, use quotation marks (") around it.
• The search is case sensitive.
• Wild cards, asterisks (*), can be used inside words to find variations on that word.
Example
Suppose that there is a Guide in the Library whose properties include:
• Title: "Wafer anomalies Guide"
• Description: "This Guide captures how we find anomalies in our wafer production
data. Look closely at Temperature vs Time!"
• Keywords: "Plant A"; "Wafer"; "CODE1A".
Examples of a few search strings which can be used to find the Guide:
• Wafer - Finds the title and keyword.
• anomalies - Finds the title and description.
• wafer - Finds the description since "wafer" is lower case.
• "wafer production" - Finds the phrase part in the description.
• "wafer production" CODE*A - Finds the description and keyword.
Note: The search will only be performed on items that you have read access to.
20
Loading Data
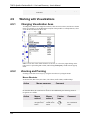
3.3
3.3.1
Import Data
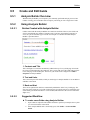
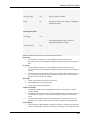
Importing Data
Spotfire DecisionSite can access data from a variety of sources:
• Spotfire Analysis File (SFS)
• Text files (TXT, CSV, SKV)
• Microsoft Excel Workbooks (XLS)
• MDL SDFiles (SDF)
• Databases (OLE DB or ODBC)
• The Windows clipboard
SFS files, text files and SDFiles can be opened directly using the Open option on the File
menu. This is the quickest way to access unambiguously formatted data from a file.
Note: You can also enter a URL in the File name field, and access data from a web server.
Similarly, properly formatted data on the clipboard can be pasted directly into Spotfire
DecisionSite.
However, if your data resides in a database, or if it needs some kind of preprocessing before
being visualized in Spotfire DecisionSite, then use Import Data. This dialog is designed to
help you access your data, whatever the source and whatever preprocessing you require.
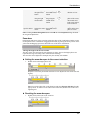
► To import data:
Select File > Import > Import Data....
1. Select a data source, such as a file or database.
2. Select methods for data conditioning, such as pivoting, aggregation, or normalization.
You can also choose to normalize the character case, so the data is imported non-case
sensitively.
3. Optionally, save all settings for data source and/or data conditioning as a favorite. This
will allow you to reuse the same data without having to configure data source and data
conditioning each time.
The details of each of these steps vary depending on which type of data source or data
conditioning method is chosen. A sequence of dialogs will guide you through the required
interaction in each case. For example, accessing a database involves setting parameters that are
not required when working with a text file. The following sections will deal with each of the
three steps above, describing in detail the different cases that may arise.
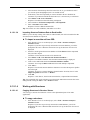
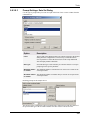
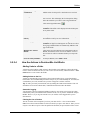
3.3.2
3.3.2.1
Data Sources
Selecting a Data Source
The first step in the Import Data dialog to specify a data source. A data source can be one of the
following:
• A file
• The clipboard
• A database
• The Spotfire Text Data Format
• A data source defined in a previous data import session, a so called Favorite.
► To select a data source:
1.
Select File > Import > Import Data....
21
TIBCO Spotfire DecisionSite 9.1.1 for Lead Discovery - User's Manual
2.
3.3.2.2
Double-click a data source, or select an item and click Next >.
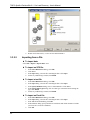
Importing from a File
► To import data:
Select File > Import > Import Data... and:
► To import an SFS file:
1.
2.
3.
4.
In the Select Data Source dialog, select File.
Click Next >.
In the Open dialog, select the file containing the data. Click Open.
Unless any conditioning is needed, click Finish.
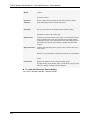
► To import a text file:
1.
2.
3.
4.
5.
In the Select Data Source dialog, select File.
In the Open dialog, select the file containing the data. Click Open.
In the Specify Delimiter dialog, select a column delimiter. Click Next >.
In the Specify Data Types dialog, click on a data type in the table head to change the
type. Click Finish.
Unless any conditioning is needed, click Finish.
► To import an Excel file:
1.
2.
3.
4.
5.
22
In the Select Data Source dialog, select File.
In the Open dialog, select the file containing the data. Click Open.
In the MS JET OLE DB dialog, click OK.
In the Database dialog specify which Excel worksheets and which columns to include.
(An Excel file is treated as a database).
Click OK.
Loading Data
► To import an SDFile file:
1.
2.
3.
4.
3.3.2.3
In the Select Data Source dialog, select SDFile.
Click Next >.
In the Open dialog, select the file containing the data. Click Open.
Unless any conditioning is needed, click Finish.
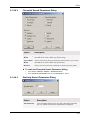
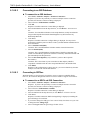
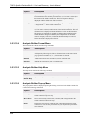
Importing from the Clipboard
► To import data from the Windows clipboard:
1.
Mark a number of cells in a text window, a spreadsheet program or another program
providing a tabular presentation of data, such as Statistica, Microsoft Excel, Word, etc.
2. Select Edit > Copy or hit [Ctrl+C] to copy them to the clipboard.
3. In Spotfire DecisionSite, select File > Import > Import Data....
4. From the Common folder, select Clipboard.
5. Click Next >. This triggers the same dialog as when importing text files.
Tip: If your clipboard data is formatted using a standard column delimiter, and if no
preprocessing is required, you can paste it directly into Spotfire DecisionSite. Press [Ctrl+V].
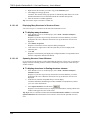
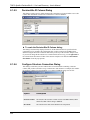
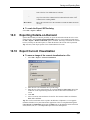
3.3.2.4
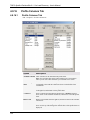
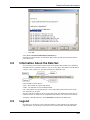
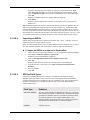
Importing from a Database
By default, Spotfire DecisionSite connects to external sources of data by means of ODBC
(Open Database Connectivity). This allows you to import data from virtually any kind of
database commercially available.
To learn how to set up an ODBC data source, please refer to the database vendor's
documentation and the Windows documentation on ODBC. It might be necessary to install
ODBC driver software particular to the database used before being able to utilize the ODBC
option.
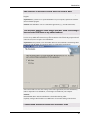
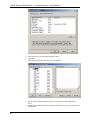
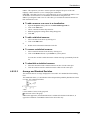
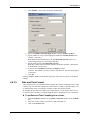
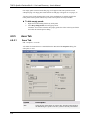
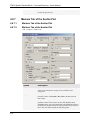
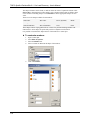
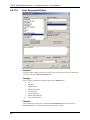
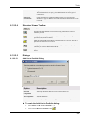
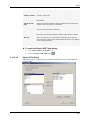
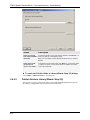
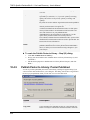
► To import from a Database:
1.
2.
3.
4.
Select File > Import > Import Data....
Select Database from the list of data sources.
Click Next >.
In the Select Data Source dialog, go to the Machine Data Source tab.
23
TIBCO Spotfire DecisionSite 9.1.1 for Lead Discovery - User's Manual
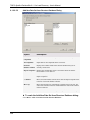
5.
6.
7.
Select the source from which data should be loaded.
Click OK.
Enter login name and password to log on to the database.
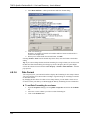
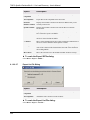
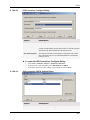
8.
Determine which database fields to import by selecting the corresponding check
boxes.
Edit the SQL statement manually if required. This may be necessary for example when
joining tables.
9.
24
Loading Data
10. Click OK.
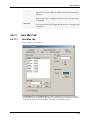
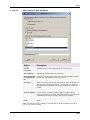
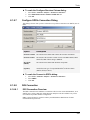
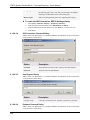
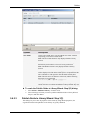
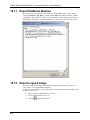
3.3.2.5
Importing a Spotfire Text Data File
The Spotfire Text Data format uses a method which enables quick opening of text files. The
file is saved as Unicode which makes it possible to read all alphabets. This format is useful
when you have data that can be imported wrongly, e.g., if you have strings that contain
semicolons or tabs which would otherwise cause the imported file to be split up into the wrong
number of columns.
► To import a Spotfire Text Data File:
1.
2.
3.
4.
5.
3.3.2.6
Select File > Import > Import Data....
Select Advanced > Spotfire Text Data Format from the list of data sources.
In the Spotfire Text Data Format dialog, select the file containing the data. Click
Open.
In the Data Conditioning dialog, select a conditioning method if desired.
Click Next > to save this as a Favorite, or simply click Finish.
Importing Using a Favorite
Using a Favorite requires that you have defined a data source and preprocessing methods in a
previous session and have saved these settings (see Creating Favorites).
► To use a Favorite:
1.
2.
3.
Select File > Import > Import Data....
Select a favorite from the list of data sources.
Click Finish to load the data set, or Next > to edit data conditioning before loading.
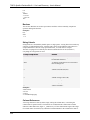
3.3.3
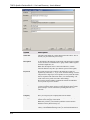
Data Conditioning
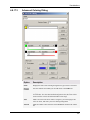
3.3.3.1
Data Conditioning
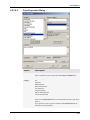
Once you have specified a data source, it is possible to manipulate the data in various ways.
Standard methods include the "Tall/Skinny => Short/Wide" conversion (described in What is
Tall/Skinny-Short/Wide Conversion?) as well as the Depivot (Short/Wide => Tall/Skinny)
conversion, but custom methods designed by Professional Services or a third party may also be
available.
You can also select the Normalize case filter. This will cause the data to be imported non-case
sensitively. This means "Chrome", "chrome" and "CHROME" will be interpreted as the same
string. The default when importing is to import case sensitively, thus the examples above would
be interpreted as three different strings.
Note: When importing strings, duplicates are removed. In Spotfire DecisionSite version 7.0 and
older, comparison ignored differences in case. Version 7.1 and later treats two strings as
different if they contain the same sequence of characters but not the same case. Selecting the
Normalize case filter will mimic the old behavior.
► To apply a conditioning method:
1.
2.
3.
4.
5.
Select a data source.
Click Next >.
Select a method from the drop-down list.
Make the required settings.
Click OK.
25
TIBCO Spotfire DecisionSite 9.1.1 for Lead Discovery - User's Manual
3.3.3.2
Applying Multiple Conditioning Methods
When applying several transformations on top of each other, it is important to decide in which
order the methods should be applied. Once one conversion has been applied, the next
conversion will apply to the output from the previous one, and so on.
► To apply multiple conditioning methods:
1.
2.
3.
3.3.3.3
3.3.3.3.1
Select a method from the drop-down list.
Configure the method and click OK.
Repeat from step 1 as many times as required.
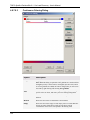
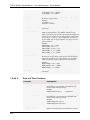
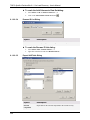
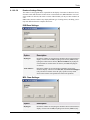
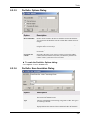
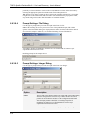
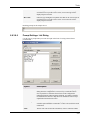
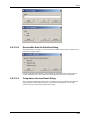
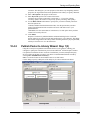
Tall/Skinny-Short/Wide Conversion
Tall/Skinny to Short/Wide Conversion
Tall/Skinny to Short/Wide conversion is a method for modifying the format of a data table
during import. It can be used for pivoting and aggregating data.
Note: You can also reach this dialog via Data > Pivot Data... if you want to apply pivoting to
an already opened data set. See Pivot Data for more examples.
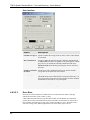
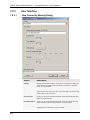
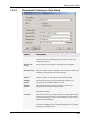
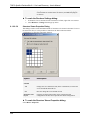
► To apply Tall/Skinny to Short/Wide conversion to your original
data:
1.
2.
3.
4.
5.
6.
7.
8.
9.
26
Select File > Import > Import Data....
Select a data source, and click Next >.
Select Tall/Skinny -> Short/Wide from the drop-down list.
Click Configure...
In the Identity list, select one or more columns.
Comment: Each unique value in the chosen column produces a row in the generated
table. You can choose more than one column. Doing so means that the new table will
have a separate row for each unique combination of values in the chosen columns.
In the Category list, select one or more columns.
Comment: Each unique value in the chosen column produces a new column in the
generated table. Selecting more than one column means that the new table will have a
separate column for each unique combination of values in the chosen columns.
In the Values list, select one or more columns.
Comment: The column selected under Values is the column from which the data is
pulled. It is possible to select more than one Value column. The values in the
generated table are always computed as the average of values in the original table,
unless the original values are strings. If so, values in the generated table will consist of
concatenated strings. To change the way the values are calculated, right-click on the
Method and select a different method from the list, or use Ctrl+click to select multiple
methods.
In the Other Columns list, select one or more columns.
Comment: This option allows you to include an overall average of a particular
measurement, for each row in the generated table. For each column selected here, one
new column will be created in the new table. To change the way the measurements are
calculated, right-click on the Method and select a different method from the list, or use
Ctrl+click to select multiple methods.
Click OK.
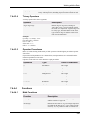
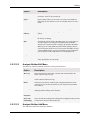
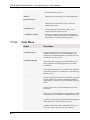
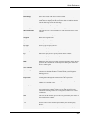
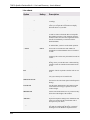
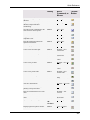
Option
Description
Identity
Each unique value in the chosen column produces a row in the
generated table.
You can choose more than one column. Doing so means that
Loading Data
the new table will have a separate row for each unique
combination of values in the chosen columns.
Category
Each unique value in the chosen column produces a new
column in the generated table.
Selecting more than one column means that the new table will
have a separate column for each unique combination of values
in the chosen columns.
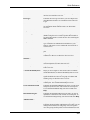
Values
The column selected under Values is the column from which
the data is pulled. It is possible to select more than one Value
column.
The values in the generated table are always computed as the
average of values in the original table, unless the original
values are strings. If so, values in the generated table will
consist of concatenated strings. To change the way the values
are calculated, right-click on the Method and select a different
method from the list, or use Ctrl+click to select multiple
methods.
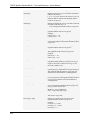
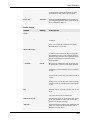
Other Columns
This option allows you to include an overall average of a
particular measurement, for each row in the generated table.
For each column selected here, one new column will be
created in the new table. To change the way the measurements
are calculated, right-click on the Method and select a different
method from the list, or use Ctrl+click to select multiple
methods.
Method Selection List
Right-click on the Method to change the method of calculation for your column. Ctrl+click to
select multiple methods.
For examples of how Tall/Skinny to Short/Wide conversion can be used, see Pivoting and
Pivoting and Aggregation.
27
TIBCO Spotfire DecisionSite 9.1.1 for Lead Discovery - User's Manual
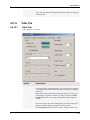
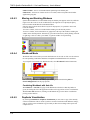
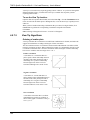
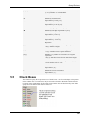
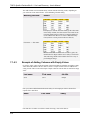
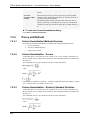
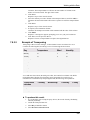
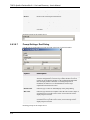
3.3.3.3.2
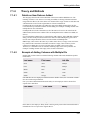
Pivoting
Pivoting, in its simplest form, means rotating a table. Mostly, though, it also includes
performing some form of aggregation, so that the new table is more compact than the original.
Pivoting a data set means changing it from a tall/skinny format to a short/wide format. Consider
the following tall/skinny table, based on a series of temperature measurements:
City
Month
Temp
London
February
4
New York
February
6
London
May
16
New York
May
19
London
August
28
New York
August
26
London
November
13
New York
November
11
As we add more observations, the table grows taller, but remains three columns wide. While
useful during data collection, this format may not be appropriate for certain types of
calculations or visualizations. For example, the entities that interest us are the different cities, so
we may want a representation with a single record for each city.
Tall/Skinny=>Short/Wide conversion lets us pivot this table, producing the following (note that
avg(Temp) is the average of a single cell):
avg(Temp) for
February
avg(Temp)
for May
avg(Temp) for
November
London 28
4
16
13
New
York
6
19
11
City
avg(Temp)
for August
26
Each city is now represented by a single record, which makes this format very suitable for
Spotfire DecisionSite profile charts. This example demonstrates three steps:
• Creating a row for each unique value in City.
• Creating a column for each unique value in Month.
• Entering a value from Temp for each cell in the resulting grid.
In the Tall/Skinny => Short/Wide dialog, the following settings would be made:
Identity: City
Category: Month
Values: Temp
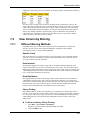
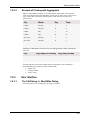
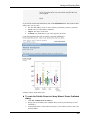
3.3.3.3.3
Pivoting and Aggregation
Note: To understand this example, it is recommended to read Pivoting first.
Apart from changing format from tall/skinny to short/wide, pivoting can be used to create a
more compact table. Consider the following table, based on a series of temperature
measurements:
28
Loading Data
City
Month
Day
Temp
London
February
1
5
London
February
15
8
London
May
1
15
London
May
15
22
New York
February
1
9
New York
February
15
7
New York
May
1
18
New York
May
15
24
Tall/Skinny=>Short/Wide conversion lets us pivot and aggregate this table, producing the
following:
City
avg(Temp) for February
avg(Temp) for May
London
6.5
18.5
New York
8
21
A smaller table has been created, summarizing the original table. In the Tall/Skinny =>
Short/Wide dialog, the following settings would be made:
Identity: City
Category: Month
Values: Temp
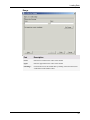
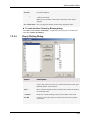
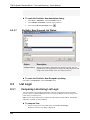
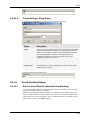
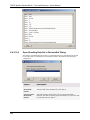
3.3.4
3.3.4.1
Favorites
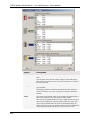
Creating Favorites
Favorites are combinations of data sources and data conditioning methods. A favorite stores all
settings made during a session with the Import Data dialogs. A favorite may, for example,
specify a database, all the information required to log on, and a data conditioning method.
Favorites can also specify just a data source, or just a preprocessing method.
► To create a favorite:
1.
2.
3.
4.
Define a data source as described in Selecting a Data Source.
Define a data conditioning method as described in Data Conditioning.
In Save Session dialog, specify a name for your favorite, e.g., "Average temperature
1961-1991". You can also add a description.
Under Favorite options, select both Include reference to data source and Include
reference to data conditioning methods
29
TIBCO Spotfire DecisionSite 9.1.1 for Lead Discovery - User's Manual
5. Click Finish.
Note: Your choice of Favorite options affects how the favorite can be used. If a data source is
included, then the favorite can be opened directly from the Select Data Source dialog. If only
the method is saved, then you must first select a data source, and then in the second step apply
the favorite as a data conditioning method.
3.3.4.2
Organizing Favorites
Favorites are organized in folders. Click Organize Favorites in the Select Data Source dialog.
The Data source tab contains favorites that are linked to data. These can be loaded directly
from the Select Data Source dialog.
30
Loading Data
The Conditioning methods tab contains favorites that are not linked to a data source. These
can only be applied from the Data Conditioning dialog (i.e., you must specify a data source
before using them).
► To move a favorite to a different folder:
1.
2.
3.
Highlight a favorite.
Click Change Group.
Select a group from the list, or enter a new group name.
► To remove a favorite:
1.
2.
3.3.5
3.3.5.1
Highlight a favorite.
Click Delete.
Text File Formatting
General Text File Specifications
A data set imported into Spotfire DecisionSite consists of the following:
One line containing the name of each column (optional)
One declaration line describing the type of data in each column (optional)
The first two single lines make up the header. If the original data set has no header (i.e., it
consists of raw data) Spotfire DecisionSite will name the columns Column1, Column2, ...
One line per data record
[Carriage return] followed by [Line feed] end each row
Note:
•
•
The type declaration is case insensitive.
Data sets must contain at least 3 rows to be valid. Add an empty row if you need to
import a data set with 2 rows.
• The number of columns present in the first row determines the number of columns
used in the entire data set. Additional columns in subsequent rows will be ignored.
Therefore, make sure the first row contains the correct number of columns.
• The first row of a data set must never be empty, i.e., it should only contain a row break
or similar.
The following are examples of well-formatted text files:
City,Month,Day,Temp
String,String,Integer,Integer
London,May,5,14
New York,May,5,23
London,May,10,16
New York,May,10,27
London,May,15,20
New York,May,15,24
London,November,5,7
New York,November,5,12
Location;Day;Temp
London;5;14
New York;5;23
London;10;16
31
TIBCO Spotfire DecisionSite 9.1.1 for Lead Discovery - User's Manual
New York;10;27
London;15;11
New York;15;29
London;20;13
New York;20;20
3.3.5.2
Spotfire Text Data Format Specifications
A Spotfire Text Data file imported into Spotfire DecisionSite consists of the following:
One line containing information about the format.
Two lines which explain how the file was generated.
One line containing the name of each column.
One declaration line describing the type of data in each column.
One line per data record.
[Carriage return] followed by [Line feed] end each row; each column ends with a semicolon.
Note: The type declarations and the column names are case sensitive.
The following is an example of a well-formatted text file:
\! filetype=Spotfire.DataFormat.Text; version=1.0;
City;Month;Day;Temp;
String;String;Integer;Integer;
London;May;5;14;
New York;May;5;23;
London;May;10;16;
New York;May;10;27;
London;May;15;20;
New York;May;15;24;
London;November;5;7;
New York;November;5;12;
3.3.5.3
Supported Formats
The following standardized text file formats are supported:
CSV – values are separated by the default list separator. (This is a Regional Setting property of
your system. Comma is used in the US.)
TXT – values are separated by tabs
SKV – values are separated by semicolons
All these file formats are simple and text based – they do not contain any formatting or product
specific information. The CSV and SKV formats can be exported from many spreadsheet and
database programs. Many research tools produce output in these formats as well.
Note: Spotfire Text Data Format is also available see Spotfire Text Data Format Specifications
for more information.
3.3.5.4
Column Separators
Individual fields (column names, type strings, and values) are delimited by column separators—
usually commas, semicolons or tabs, but the | (pipe) symbol is also recognized.
Spotfire DecisionSite automatically decides which character is interpreted as separator. To do
this, Spotfire DecisionSite checks the first line in the database for the following characters:
32
Loading Data
Separator
Name
ASCII code
[tab]
Horizontal tab (invisible on screen)
9
,
Comma
44
;
Semicolon
59
|
Pipe
124
The most common character of the ones above is selected as separator (characters enclosed in
quotation marks are not considered). All following lines are assumed to use this most common
character as column separator.
Note:
• To load text data that uses a column separator different from those mentioned above,
use the Import Data option. This will allow you to specify manually which character to
interpret as separator.
•
3.3.5.5
Dialog Box Controls for the Specify Delimiter dialog:
Delimiter – Select one of the four common delimiter symbols, or enter a character of
your choice.
Column names – Check the box if you know that the first row contains column
names and not data.
Data preview – The table shows how the file will be interpreted, given the specified
delimiter
Values in a Spotfire DecisionSite data set may contain any character (including white
space) except the column separator. If enclosed in double quotation marks, columns
may also contain separator characters. Column headers are allowed to contain
separators if double quoted and the first double quotation mark is preceded by a
backslash.
Name and Type Strings
The first one or two lines in a text file or file may be interpreted as name and type information
according to the following rules:
If the second line appears to be type information, i.e., containing columns with strings like INT,
STRING, DATE etc., it is used as type information. The first line is then expected to contain
name information. For example, a small database with personal data and both name and type
information looks like the table below. Here, the second line is interpreted as type information
and the first as name information.
Data
Spotfire DecisionSite
Interpretation
Name,Age
name info
STRING,INT
type info
Peter,26
data
John,35
data
If the first line contains only type information, Spotfire DecisionSite will use that line for type
information. The column names are automatically generated as "Column1", "Column2", etc.
Note: The type determined by the type declaration line has the highest priority when
determining the type of each individual data line. If a value cannot be converted into the
relevant type, it will be set to empty. For example, a string appearing in a column defined as
integer cannot be converted and will therefore be set to empty.
33
TIBCO Spotfire DecisionSite 9.1.1 for Lead Discovery - User's Manual
Data
Spotfire DecisionSite
Interpretation
STRING,INT
type info
Peter,26
data
Susan, 19
data
John,35
data
Spotfire DecisionSite tries to find type information in lines one and two. If it cannot, line one is
used as name information, and the program makes a qualified guess of the types contained by
analyzing the type of the following first non-empty 100 values in each column.
If more than 80% of the values can be interpreted as one and the same type other than String,
the column will be set to that type. Any values not corresponding to that type will be set to null.
If there are the same numbers of records for two different types among the 100 analyzed values,
then the type guessing will be done according to this priority list:
1. Integer
2. Decimal
3. Date
4. Time
5. TimeStamp
If more than 80% of the values cannot be interpreted as a type other than String, then all values
in the column will be set to String.
Note: Date format is determined in a similar way. Please see Date for more information.
The following is a small database with personal data, but no type information. Here, the first
line is interpreted as name information, and the types are set to STRING and INT.
Data
Spotfire DecisionSite
Interpretation
Name,Age
Type guess: STRING, STRING
Peter,26
Type guess: STRING, INT
Susan, 19
Type guess: STRING, INT
John,35
Type guess: STRING, INT
If 1,2 and 3 fail, the column names are automatically generated as "Column1", "Column2", etc.
The program then makes a qualified guess of the types just as in section 3 above.
For example, for a small database with personal data with no type or name information, the type
information is set to STRING and INT, and the names are set to Column1 and Column2:
Data
Spotfire DecisionSite
Interpretation
Peter,26
Type guess: STRING, INT
Susan, 19
Type guess: STRING, INT
John,35
Type guess: STRING, INT
Note: If a column is declared as being of one type, but some values in the column are of a
different type, then the incongruous values will be set to null.
34
Loading Data
3.3.6
3.3.6.1
Data Types
General Specifications for Data Types
White spaces and ASCII control characters (i.e., all code characters less than 32) are always
ignored at the start of a string. Type strings (strings that declare the data type) are not case
sensitive.
In the descriptions of data types, the following abbreviations are used:
[ ] (i.e., square brackets)
For any item, this indicates optional items or groups of
correlated items.
YY
Year as two digits.
YY[YY]
Year as two or four digits.
MM
Month as one or two digits.
DD
Day as one or two digits.
HH
Hours as one or two digits
Mm
Minutes as one or two digits.
SS
Seconds as one or two digits.
fff
Fractions of a second, as many digits as there are.
MonthString
In English only. This may also be the abbreviated version
of the month, e.g., Jan stands for January.
If you are uncertain about whether or not Spotfire DecisionSite supports a data type, or how it
must be formatted to be recognized during import, use a text editor to write a short file with
sample data using the types that you want to test. Copy and paste the text directly into Spotfire
DecisionSite, and use Details-on-Demand to verify the results.
The following tab-separated file can be used as a template for such a file:
3.3.6.2
int_col
time_col
date_col
str_col
int
sfTime
date
string
1
11:01:32 PM
990807
"hello"
2
110132.6
08/07/99
hello
3
11:01 AM
99-08-07
""Hello!", I said"
Time
Format
Description
Fields
Colon as field separator
HH:Mm[:SS[.fff]][AM|PM]
Dot as field separator
HH.Mm[.SS[.fff]][AM|PM]
No field separator
HHMm[SS[.fff]][AM|PM]
Type strings
time, sfTime
35
TIBCO Spotfire DecisionSite 9.1.1 for Lead Discovery - User's Manual
Remarks
The format requires that hour and minute be specified. Optionally seconds and fractions of
seconds can be included. The fractions must be in the range of real values, and must begin with
a period or the decimal separator defined by the regional settings in Windows.
In addition to a colon separator (as above), it is also possible to use a decimal point or no
character at all.
AM or PM can optionally be specified at the end of a time string.
Time must be within legal values. For example, 13:00 AM is not supported. Negative times are
not supported.
Examples
Accepted
Not accepted
14:05:32.6
14:05:32:6
14.05
25.05
140532
140532,6
2.05.32 PM
14.05.32 PM
2.05.32 AM
14.05.32 AM
2.5.2
The display format of a Time column can be changed in the Time Format dialog.
3.3.6.3
Date
Please see the Remarks section following the formats table for more information on priority
formats and other important details of the formats.
It is recommended that you use Long ISO formats, since there is no ambiguity in these.
When type guessing a text file that is being imported, DecisionSite makes a qualified guess of
any dates contained by analyzing the format of the following first non-empty 100 values in each
column.
DecisionSite checks to see how many matches each of the following format receives, and then
chooses the one with the most matches. If several formats should receive the same amount of
matches, then DecisionSite will choose the date format according to the Interpretation Priority
as seen in the table below.
Dates not matching the selected format will be discarded as conversion errors.
Formats
36
Name
Fields
Interpretation Priority
ISO format:
YY[YY]-MM-DD
Highest
User Locale Setting:
<MS Windows setting>
Reverse ISO format:
DD-MM-YY[YY]
USA & UK format:
MM/DD/YY[YY]
European format:
DD/MM/YY[YY]
Custom format:
YY[YY]/MM/DD
Custom format:
YYYYMMDD
Custom format:
YYMMDD
Custom format:
DD.MM.YY[YY]
Loading Data
Long ISO format:
DD MonthName YY[YY]
Long ISO Internet:
DD-MonthName-YY[YY]
Long USA & UK format:
MonthName DD, YY[YY]
Lowest
Type strings
date, sfDate
Remarks
The year, YY, can always be specified in two or four digits, e.g., 89 or 1989. If only two digits
are given for the year, the date is assumed to belong to the 20th century if the number
representing the years is higher than the dividing year, and to the 21st century if equal to the
dividing year or below. Microsoft Windows settings provide the dividing year. Windows
default dividing year is 31. If alterations have been made there, they will be reflected in the way
Spotfire DecisionSite calculates dates.
Months can be written using the initial three letters. If spelled out, names should be in U.S.
English. Month names are not case sensitive.
Spotfire DecisionSite performs a leap year control when importing data of type Date.
Once date data is loaded into Spotfire DecisionSite it will be presented in localized format (set
in the Regional Properties of your system).
Years may range from 100 to 9999.
The display format of a Date column can be changed in the Date Format dialog.
3.3.6.4
DateTime
DateTimes are also known as TimeStamps.
Formats
DATE TIME
DATE/TIME
Where DATE is any date as described above, and TIME is any time as described above.
Note that there must be at least one of the following between both main groups:
a single Space
a single Slash
Multiple Spaces are allowed and ignored, but multiple Slashes are illegal.
Type strings
datetime, timedate, timestamp, sfTimeStamp
Remarks
The DateTime format is used to combine date and time in a single data column. In previous
documentation it has been referred to as TimeStamp.
A value is accepted as DateTime even if it lacks the Time component.
Examples
DateTime
Interpreted as
99-08-07 11:01:32.6
August 7, 1999, 11:01:32.600
99-08-07 11.01.32
August 7, 1999, 11:01:32
08/07/99 11:01
August 7, 1999, 11:01:00
37
TIBCO Spotfire DecisionSite 9.1.1 for Lead Discovery - User's Manual
08/07/99 11.01.32.6 PM
August 7, 1999, 23:01:32.600
99/08/07 11:01
August 7, 1999, 11:01:00
990807 11:01:32.6
August 7, 1999, 11:01:32.600
990807 110132 AM
August 7, 1999, 11:01:32
07 aug 99 11:01
August 7, 1999, 11:01:00
The display format of a DateTime column can be changed in the Date and Time Format dialog.
3.3.6.5
String
Format
Any string of characters, with or without quotation marks
Type strings
string, text, str, sfString
Remarks
Matching pairs of quotation marks at the beginning and end of the string are removed.
Column separators appearing within outermost quotes are not interpreted as separators (see the
last example below).
Columns beginning or ending with empty noise (control characters except the separator
currently being used) will be stripped of that noise.
Strings are by default case sensitive, e.g., a12 is treated as different to A12.
Sorting
Spotfire DecisionSite handles Strings case-sensitively. Strings are sorted based on ASCII (see
also Unicode and Character Encodings) which means that all uppercase characters will be
sorted before any lowercase characters (A, B, C, a, b, c).
For example, strings would be sorted as seen below:
1
1005
34
Arizona
Beethoven
Zebra
anaconda
bakery
Be mindful of this when using Query Devices, since setting a Range Slider to include
everything between Arizona and Zebra, will not include anaconda or bakery.
The reason for handling sorting this way, and not according to the locale setting on the
computer, is to insure that a Spotfire DecisionSite file looks exactly the same where ever it is
opened. Therefore country-specific characters may be sorted in other ways than according to
the locale setting.
Examples
38
String
Interpreted as
Hello
Hello
"Hello"
Hello
""Hello""
Hello
Loading Data
3.3.6.6
"Hello "there""
Hello "there"
"3" 5'"
3" 5'
one, two, three
one two three (separate columns)
"one, two, three"
one, two, three (one column)
""Hello", I said"
"Hello", I said
Integer
Format
[#|##|###][[ |,]###]*[%]
Type strings
int , integer, long, mapstring, sfInt
Remarks
An integer can include a grouping symbol for thousands, millions, etc. Permitted symbols are
comma and white-space.
However, every value in the entire column must be a valid integer, or else the entire column
will be interpreted as Decimal or even Invalid.
Optionally, the %-character can be appended at the end. The %-character will be removed
during import, thus 68% will be interpreted as 68 not 0.68.
Examples
3.3.6.7
Accepted
Interpreted as
6843
6843
6 843
6843
6,843
6843 (see Remarks above!)
68,432,701
68432701
68%
68
Not Accepted
Interpreted as
68,43
68.43 Decimal
68,432,70
Invalid
Decimal (Real, Double)
An 8 byte floating point number.
Format
[#|##|###][[ |,]###]*[.#*]][ ][%]
Type strings
decimal, real, float, real1, real2, real3, real4, real5, dbl, num, dreal, double, dfloat, sfReal,
sfDecimal
39
TIBCO Spotfire DecisionSite 9.1.1 for Lead Discovery - User's Manual
Remarks
Written as an integer, optionally followed by a decimal part. The decimal separator can be a
comma or period, but must be different from the thousands separator.
Optionally, the %-character can be appended at the end. The %-character will be removed
during import, thus 0.68% will be interpreted as 0.68.
In Spotfire DecisionSite 6.1 and later versions, all Decimals are treated as Doubles. Older
versions differentiate between 4 byte Reals and 8 byte Doubles.
Examples
3.3.6.8
Accepted
Interpreted as
6,84
6.84
6,843
6.843 (see Integer description!)
6.843
6.843
6 843.27
6843.27
6 843,27
6843.27
6,843.27
6843.27
0.68%
0.68
1E17
1E+017
1d17
1E+017
Not Accepted
Interpreted as
6.843,27
Invalid
6.843.27
Invalid
6,843,27
Invalid
Data Type Constraints in Current 32 Bit Operating
Systems
Int
Integer 32 bits signed
Maximum (signed) int value
2147483647
Minimum (signed) int value
-2147483647
Double
64 bits
40
Number of decimal digits of precision
(That is the total number of digits, not to be
confused with number of digits after the decimal
point)
15
Smallest such that (1.0+DBL_EPSILON !=1.0)
The minimum difference between numbers that are
to be calculated as having different values
2.2204460492503131e-016
Number of bits in mantissa
53
Loading Data
Maximum value
1.79769313486231e+308
Maximum decimal exponent
308
Maximum binary exponent
1024
Minimum positive value
2.22507385850720e-307
Minimum decimal exponent
(-307)
Minimum binary exponent
(-1021)
Exponent radix
2
Addition rounding: near
1
Real
In Spotfire DecisionSite 6.1 and later versions, all Real are treated as Double. For older
versions see below:
Float 32 bits
3.3.7
3.3.7.1
Number of decimal digits of precision
(That is the total number of digits, not to be confused with
number of digits after the decimal point)
6
Smallest such that (1.0+FLT_EPSILON !=1.0)
The minimum difference between numbers that are to be
calculated as having different values
1.192092896e-07F
Number of bits in mantissa
24
Maximum value
3.402823466e+38F
Maximum decimal exponent
38
Maximum binary exponent
128
Minimum positive value
1.175494351e-38F
Minimum decimal exponent
(-37)
Minimum binary exponent
(-125)
Exponent radix
2
Addition rounding: near
1
OLE DB
Connecting to a Data Source Using OLE DB
An OLE DB data provider allows native access to data, such as a SQL Server or Oracle
database. Using an OLE DB provider, Spotfire DecisionSite can retrieve and manipulate data
from a wide variety of data sources, not just relational databases. When you create a data link,
you specify the OLE DB provider that is designed to work with your data. For example, you
could access a flat file system using the CSV provider and display the data in Spotfire
DecisionSite.
You can create data links for any Microsoft or third party OLE DB provider. The following
providers are included with the Microsoft data access components:
Microsoft Jet 3.51 OLE DB Provider
OLE DB Provider for Oracle
OLE DB Provider for SQL Server
OLE DB Provider for ODBC Drivers
41
TIBCO Spotfire DecisionSite 9.1.1 for Lead Discovery - User's Manual
Note: For more information about OLE DB providers, see the OLE DB Programmer's
Reference. This documentation is available in the Microsoft Data Access SDK.
► To import data using an OLE DB provider:
1.
Click Open on the File menu, and select Full OLE DB Connect from the Files of
type drop-down list.
2. Use the Data Link Properties dialog box to specify initialization properties for your
OLE DB provider. Data link properties may vary depending on your OLE DB
provider. Next navigates to the Connection tab for the selected OLE DB provider.
Before you can access data from OLE DB, you must provide specific connection information
such as:
• The type of data that you want to access
• The server on which the data resides
• The database in which the data is stored
Use the Connection tab to specify how to connect to Oracle data. Enter the server where the
database you want to access is located. Click Test Connection to attempt a connection to the
specified data source. If the connection fails, ensure that the settings are correct. For example,
spelling errors and case sensitivity may be the cause of a failed connection. Click OK to
connect.
For more information about advanced initialization properties, see the documentation provided
with your OLE DB provider. Use the All tab to view and edit all of the OLE DB initialization
properties that are available for your OLE DB provider.
3.3.8
Rearranging the Data by Formatting
If you have a Time, Date or a DateTime (TimeStamp) column in your data set, you can change
what you actually filter on with the query devices just by changing the format of the column.
Example 1:
You have a data set containing stock prices for a number of different stocks during a selected
time period:
42
Loading Data
Traditionally, you could plot the data in a scatter plot or a profile chart to see how the price of
each stock has varied during the time period:
But by changing the way the date column is represented, you can obtain new views of the data.
Right-click on the date column in the Query Devices panel and select Set Property > Format
> Date... to display the Date Format dialog. Here, you can select Day of week, Monday first
(day name), to show the different weekdays instead. The language is determined by your
current locale.
43
TIBCO Spotfire DecisionSite 9.1.1 for Lead Discovery - User's Manual
This way, you can get a completely different view of the data and spot whether the stock prices
tend to be higher or lower on a certain day of the week:
According to this scatter plot, it looks like it would be a good idea to buy new stocks on
Tuesdays. (This example does not contain any real data and the advice should therefore not be
taken literally.)
Example 2:
Another example of how the data interpretation can be changed via formatting is if you have a
time column where hours, minutes and seconds are displayed, and then change the formatting to
a HH:MM format.
Data values:
Represented in a scatter
plot:
Original data:
Formatted data:
Hence, the number of unique values is reduced from three to two.
The following formats change the perceived data type of the column from a Date, Time or
DateTime into an Integer or String:
44
Loading Data
Format
Perceived type
Year (YYYY)
Integer
Year, short (YY)
Integer
Day of week, Monday first (day name)
String
Day of week, Sunday first (day name)
String
Day of month (dd)
Integer
Day of year (ddd)
Integer
Week of year (ww)
Integer
Month of year (mm)
Integer
Month of year (short name)
String
Month of year (full name)
String
24 hour time, hour only (HH)
Integer
Resetting the formatting to the original brings back the original data type as well as any
temporarily trimmed values.
3.4
3.4.1
Information Links
Introduction to Information Library
Information Library is a tool for accessing data from databases. This is done by opening
information links. An information link is a preconfigured database query, specifying the
columns to be loaded, and any filters needed to reduce the size of the data set prior to
visualization in Spotfire DecisionSite.
Information Library is built on top of the Information Model (IM). This model resides on your
server, and is a representation of one or more databases which may be geographically dispersed.
It allows you to execute advanced database queries without any knowledge of the underlying
database structures. The model appears as a folder structure (see Information Library Dialog).
Information Library is part of a suite of tools called Information Services (IS). The other tools
are Information Builder and Information Designer. While Information Library is primarily
designed to execute predefined queries stored in the IM, Information Builder lets you create
such queries from building blocks such as columns and filters. Information Designer is the
administrative tool for designing the Information Model, configuring the database connections
and assigning user permissions for accessing various parts of the model.
3.4.2
Using Information Library
3.4.2.1
Opening an Information Link
Information Library provides a set of information links (predefined queries), organized into
different domains. Which domains are available to you depends on how your permissions have
been set by the administrator. The information links are defined in Information Builder.
► To open an information link:
1.
Select File > Import > Open Information Link....
Response: The Information Library dialog is shown.
45
TIBCO Spotfire DecisionSite 9.1.1 for Lead Discovery - User's Manual
2.
3.
In the Information Links pane, select a link, .
Response: Information about the selected link is displayed in the Information Link
details pane.
Comment: Click the + symbols to see the contents of a domain.
Click Open.
Comment: To open a link directly, double-click the link icon, .
Response: The information link is opened, and the data is shown in DecisionSite. If the
information link includes run-time filters, one or more dialogs will now appear. See
Filtering Data During Retrieval for details.
3.4.2.2
Filtering Data During Retrieval
An information link can include columns with run-time filters. For each such column that is
loaded, you are asked to specify the values that you are interested in. Only records with the
selected values will then be loaded.
Note: To enable run-time filtering for a column, or to set the type of control used for selecting
values, use Information Builder to edit the information link.
► To open an information link with run-time filters.
1.
2.
3.
4.
5.
6.
3.4.2.3
Select File > Import > Open Information Link....
Response: The Information Library dialog is shown.
In the Information Links pane, select a link with run-time filters.
Response: Information about the selected link is displayed in the Information Link
details pane. You will see here whether or not the link includes columns with run-time
filters.
Click Open.
Comment: To open a link directly, double-click the link icon,
Response: The first Set Filter for Column dialog appears.
Specify the values or range of values in which you are interested.
Comment: Information links may include more than one run-time filter. In this case
each prompt will reduce the data set, such that subsequent prompts may present fewer
values. See the Run-time Filter Example for more details.
Click Next > (or Finish if this is the last filter).
Repeat steps 4 and 5 for each column with a run-time filter.
Using Current Query Device Settings as a Filter
When opening information links with run-time filters that prompt for values or value range (see
Filtering Data During Retrieval) it is possible to use the visual capabilities of Spotfire
DecisionSite to set these values.
► To use the current visualization for filter definition:
1.
2.
3.
4.
5.
46
Open a suitable data set in DecisionSite.
Choose a subset of data either by using the query devices, or by marking records.
Comment: Marking means clicking and dragging a rectangle around a group of
markers in a visualization.
Open the information link.
When the Set Filter for Column dialog for the desired column appears, click Get
Values... or Get Range....
Response: The Get Values from Data Set dialog is displayed.
From the Matching column drop-down list, select the column (in the visualized data
set) from which you want to get the values or the range.
Loading Data
6.
7.
8.
9.
3.4.2.4
Click Selected records or Marked records, depending on which values you want to
use.
Click OK.
In the Set Filter for Column dialog, click Next > (or Finish if this is the last
prompted column).
Repeat steps 4 to 8 for each column that has a run-time filter.
Response: The data is loaded and displayed in a visualization.
Using Structure Search
Users of DecisionSite for Lead Discovery can use structure search in run-time filters. This
means using substructure or similarity search to limit the data set to chemical structures of a
particular type.
► To use a run-time filter with structure search:
1.
2.
3.
4.
5.
6.
3.4.2.5
Open an information link that contains columns with structure search run-time filters.
Response: The system will begin to retrieve data. For each column with run-time filter
the Set Filter for Column Dialog will appear, asking you to specify the filter conditions
for this column.
Select Substructure or Similarity, depending on the type of search you want to
perform.
Click Edit Structure.
Response: ISIS/Draw is launched.
Draw a structure to use as search template.
Comment: See ISIS/Draw documentation for more information on how to edit
structures.
When you are done drawing the structure, click the
button in ISIS/Draw.
Response: ISIS/Draw is closed and the structure appears in the Set Filter for Column
dialog.
Click Next > (or Finish if this is the last prompted column).
Response: The data is retrieved. If this is the last run-time filter, then the data is
displayed in a visualization.
Run-time Filter Example
Information links may include more than one column with run-time filters (which prompt you
for input during retrieval). In this case, each filter will reduce the data set, such that subsequent
prompts may present fewer values. Consider the following example:
This is the data as it would look if no filters were being applied:
Name
Salary
Location
Prompt: None
Range
Check Boxes
Miller
1300
New York
King
1400
New York
Clark
700
New York
Ford
1100
Dallas
Adams
900
Dallas
Scott
1300
Dallas
47
TIBCO Spotfire DecisionSite 9.1.1 for Lead Discovery - User's Manual
Jones
1200
Dallas
James
800
Chicago
Turner
1000
Chicago
As the information link is opened, Salary will be filtered first (the order is set using Information
Builder).
The user enters the limits 1100 to 1300. After the first filter, the following remains:
Name
Salary
Location
Prompt: None
Range
Check Boxes
Miller
1300
New York
Ford
1100
Dallas
Scott
1300
Dallas
Jones
1200
Dallas
Several rows, including all Chicago employees, have been filtered out. This means that when
the Location filter is shown, Chicago will not be presented as an option:
48
Loading Data
3.4.3
3.4.3.1
User Interface
Information Library Dialog
Part
Description
Information Links
Displays the information links to which you have access
organized in a folder structure.
Information Link details
Describes the selected information link (click an
information link once to select it). The pane will show the
data elements that are included and a description if one
exists.
► To reach the Information Library dialog:
Select File > Import > Open Information Link....
3.4.3.2
Set Filter for Column Dialog
The Set Filter for Column dialog appears when an information link is being opened, and a
column is encountered that has been set up with a run-time filter. The dialog may take various
forms depending on the type of prompt selected. Strings containing commas can be included
both as values, as well as range limits by escaping the comma with a backslash.
49
TIBCO Spotfire DecisionSite 9.1.1 for Lead Discovery - User's Manual
Values
Part
Description
Text field
Enter a comma-separated list of column values that you want to use as a
constraint.
You can also paste values of a column from a Microsoft Excel® sheet. The
data will automatically be formatted in the right way.
Enter \, to include a comma as a value.
Enter \\ to include a backslash as a value.
For Procedures, enter \NULL to include the null value.
Example: apple,pear,\NULL,orange,banana
50
Get Values...
Use this button to set the column filter by fetching values from the current
visualization in DecisionSite. Opens the Get Values from Data Set dialog.
Browse...
Fetch filter values from a text file.
Loading Data
Range
Part
Description
Lower
Enter the lower limit for the values of the column.
Upper
Enter the upper limit for the values of the column.
Get Range...
Use this button to set the column filter by fetching values from the current
visualization in DecisionSite. More
51
TIBCO Spotfire DecisionSite 9.1.1 for Lead Discovery - User's Manual
List Box
52
Part
Description
List box
Select the individual values for the column by clicking the entries in the list.
To select consecutive values, click the first item, press and hold down
SHIFT, and then click the last item. To select multiple entries that are not
consecutive, press and hold down CTRL, and then click each item.
To select all the values in the list, press CTRL+A.
Include
empty values
for this step
Select this check box to also include records that contain no data for this
column (consequently not available in the list).
Loading Data
Check Boxes
Part
Description
Check boxes
Select individual values for the column from the list. To select all the values
in the list, press CTRL+A.
Include
empty values
for this step
Select this check box to also include records that contain no data for this
column (consequently not available in the list).
53
TIBCO Spotfire DecisionSite 9.1.1 for Lead Discovery - User's Manual
Radio Buttons
Part
Description
Radio buttons Select a unique value for the column by clicking an entry in the list.
Include
empty values
for this step
54
Select this check box to also include records that contain no data for this
column (consequently not available in the list).
Loading Data
Structure Search
3.4.3.3
Option
Description
Search for
Select whether to search using a substructure, or to search for
structures similar to a master structure.
If similarity is selected, type a threshold value between 1 and 100. A
high value means that only very similar records will be included in the
resulting list.
Edit Structure
Launches ISIS/Draw, where you can edit the master structure before
performing the search.
Import Structure
Displays the Open dialog where you can select a MOL file to use in
the search.
Get Values from Data Set Dialog
55
TIBCO Spotfire DecisionSite 9.1.1 for Lead Discovery - User's Manual
Part
Description
Matching column:
Use the drop-down list to select the column in the current data set
from which to get the values.
Get values from:
Select whether to use Marked records or Selected records as
filter values (or range limits).
► To reach the Get Values from Data Set dialog:
1.
2.
3.5
3.5.1
Open an Information Link with run-time filters.
When the Set Filter for Column dialog for the desired column appears, click Get
Values... or Get Range....
Import SAS Data
Importing SAS Data Files
In order to open SAS data files in Spotfire DecisionSite, you will need the SAS OLEDB driver.
More information on how to get this can be found at http://www.spotfire.com/sr.
► To import SAS data files:
1.
2.
3.
4.
5.
56
File > Import > Import Data....
In the Select Data Source dialog, select File.
In the Open dialog, select the file containing the SAS data. Click Open.
Response: The SAS Data Import - Column Selection dialog is opened.
In the Available SAS columns list, click to select the columns that you want to
import.
Comment: For multiple selection, press Ctrl and click on the desired columns in the
Available SAS columns list. You can sort the columns in the list alphabetically by
clicking on the Column name bar.
Click on the Add >> button to send the selected columns to the Imported columns
field.
Select whether you want to map your data to Spotfire compatible types.
Comment: See SAS Column Formatting for more information on this.
Select whether you want the description to be the column name once imported into
Spotfire DecisionSite.
Click Next >.
Response: The Import Data - Data Conditioning dialog is opened.
Select a conditioning method if desired and click Finish.
Response: The data from the selected SAS file is imported into Spotfire DecisionSite
as a new data set.
Loading Data
3.5.2
SAS Data Import - Column Selection Dialog
Option
Description
Available SAS columns: The columns in the SAS file available to be imported into Spotfire
DecisionSite.
Click a column name in the list to select it. To select more than
one column, press Ctrl and click the column names in the list.
Then click Add >> to send the selected column to the Imported
Columns field.
Enter text here
If you have a data set with many columns, you can right-click on
the header of the columns in the Available columns list box and
select Show Search Field from the pop-up menu. This will
display a search field where you can type a search string and limit
the number of items in the list. It is possible to use the wildcard
characters * and ? in the search.
Add >>
Moves selected columns from the Available SAS columns field to
the Imported columns field.
<< Remove
Removes a column and brings it back to the Available SAS
columns field.
Add All
Adds all columns from the Available SAS columns field to the
Imported columns field.
Remove All
Removes all columns from the Imported columns field and brings
them back to the Available SAS columns field.
Move Up
Moves the selected column up in the list.
Move Down
Moves the selected column down in the list.
File:
The pathname of the SAS data file.
57
TIBCO Spotfire DecisionSite 9.1.1 for Lead Discovery - User's Manual
Map data to Spotfire
compatible types
Allows you to map the data types to Spotfire compatible ones. If
this check box is cleared, the SAS formatting will be unchanged.
Use Description as
column name (if
available)
Allows you to specify whether to use the SAS description as the
column name once imported into DecisionSite. If this check box is
cleared, the current column name will be unchanged after import.
► To reach the SAS Data Import - Columns Selection dialog:
1.
2.
3.
3.5.3
Select File > Import > Import Data...
In the Select Data Source dialog, select File.
In the Open dialog, select the SAS data file. Click Open.
SAS Column Formatting
Spotfire DecisionSite allows you to import SAS Data files of the format .sas7bdat and .sd2 into
DecisionSite. It is also possible to open .sd7 files if they are first renamed to have a .sas7bdat
extension. Other file formats are not supported at this time.
If the "Map data to Spotfire compatible types" check box is selected in the SAS Data Import Column Selection dialog, or if a SAS file is opened without the data import dialog; Spotfire
DecisionSite attempts to reproduce the data type that SAS would for the same data. If it is not
selected, raw data will be read from the SAS data file and columns will be of the type string or
decimal.
The table below shows how the SAS formats are used to map the data to Spotfire DecisionSite
specific data types:
58
SAS Format
Spotfire Type
Date
Date
Dateampm
DateTime
Datetime
DateTime
Day
Integer
Ddmmyy
Date
Downame
String
Dtdate
DateTime
Dtmonyy
DateTime
Dtyear
Integer
Dtyyqc
DateTime
Hour
Integer
Julian
String
Mmddyy
Date
Mmyy
Date
Monname
String
Loading Data
Month
Integer
Monyy
Date
Octal
String
Qtr
Integer
Qtrr
String
Timeampm
String
Tod
Time
Weekdate
Date
Weekdatx
Date
Weekday
Integer
Worddate
Date
Worddatx
Date
Xyymmdd
Date
Year
Integer
Yymm
Date
Yymmdd
Date
Yymmn
Date
Yymon
Date
Yyq
String
Yyqr
String
59
TIBCO Spotfire DecisionSite 9.1.1 for Lead Discovery - User's Manual
4
4.1
Visualizations
Scatter Plots
Scatter plots are similar to line graphs in that they use horizontal and vertical axes to plot data
points. However, they have a very specific purpose. Scatter plots show how much one variable
is affected by another. Each record (or row) in the data set is represented by a marker whose
position depends on its values corresponding to the X and Y axes.
The above picture demonstrates how scatter plots can be used. Say, for example, that you want
to show whether studying longer hours helps you improve your test grades.
The scatter plot shows that according to this set of data, the longer you study, the better grade
you will get on your test.
A third variable can be set to correspond to the color or size of the markers, thus adding yet
another dimension to the plot.
Two-dimensional scatter plots are the default visualization of many data sets.
► Make a new 2D scatter plot in one of the following ways:
•
Press Ctrl+1 on the keyboard.
.
• Click the New Scatter Plot button on the toolbar,
• Select New Scatter Plot from the Visualization menu.
By right-clicking in a visualization a pop-up menu appears. This context menu lets you access
many features in a fast and easy way. For example, you can select to show structures in marker
labels:
60
Visualizations
A 3D scatter plot is used to show the relationship between three variables. It shows the data set
in three dimensions, using three columns as axes. Each record (or row) in the data set is
represented by a marker whose position depends on its values corresponding to the X, Y and Zaxis. A fourth variable can be set to correspond to the color or size of the markers, thus adding
yet another dimension to the plot.
3D scatter plots allow a lot of information to be encoded into visualizations. They are especially
useful when analyzing data that is not clustered along any of the axes (columns) of the data set.
► Make a new 3D scatter plot in one of the following ways:
•
Press Ctrl+2 on the keyboard.
.
• Click the New 3D Scatter Plot button on the toolbar,
• Select New 3D Scatter Plot from the Visualization menu.
3D visualizations have the Z-axis selector and zoom bar along the top edge of the visualization.
The Z-axis initially points towards the viewer, out from the screen.
4.2
Bar Charts
A Bar Chart is a way of summarizing a set of categorical data. It displays the data using a
number of bars of the same width, each of which represents a particular category. The length of
each bar is proportional to the count, sum or the average of the values in the category it
represents, such as age group or geographical location. In DecisionSite it is also possible to
color or split each bar into another categorical column in the data, which enables you to see the
contribution from different categories to each bar in the bar chart.
61
TIBCO Spotfire DecisionSite 9.1.1 for Lead Discovery - User's Manual
The above picture demonstrates how bar charts can be used. Say, for example, that you want to
show the total yearly revenue of a company with offices in three different cities. The bar chart
sums the revenue for the three cities and displays them per year.
Bar charts can also be categorically colored, which means that the partial sums of the bars are
colored differently. Expanding the Legend shows the meaning of each color.
When categorical coloring is applied, you have the option to display the categories in four
different ways:
• Stacked bars
• Side-by-side bars
• 100% stacked bars
• 100% side-by-side bars
If you want to compare the proportions of different categories for, e.g., different time periods,
you can use either of the 100% layout options in the Properties dialog. With 100% stacked bars,
all bars will be of equal height (100%), unless some negative values exist in the data.
62
Visualizations
In the example above, one can see that the Seattle revenue (yellow) has affected the total
revenue more during 2002 than in previous years, whereas the Dallas revenue (blue) has
decreased in importance. See Bar chart layout details for more information.
If the categories are split to several columns, categorical coloring can also be shown via
differently colored bars in multiple columns (see below).
► Make a new bar chart in one of the following ways:
•
Press Ctrl+4 on the keyboard.
•
•
.
Click the New Bar Chart button on the toolbar,
Select New Bar Chart from the Visualization menu.
Count / Sum / Average
The height of the bars can be set to represent three different aggregation methods: Count, Sum
or Average. You select this by clicking on the Axis Selector for the Y-axis.
• Count – the height of a bar represents the number of records with a particular value.
• Sum – the height of the bar indicates the total sum of the values of all records in that
bar.
• Average – the height of the bar indicates the average value of all records in that bar.
Multiple Columns
You can display multiple columns as side-by-side bars. This is useful if you want to compare
many parameters at the same time, and the categorical data exist in different columns. (When
the categorical data is included in a single column, you should instead use one of the side-byside options in the Layout section of the Bars tab, see Categorical Coloring Layout below.)
63
TIBCO Spotfire DecisionSite 9.1.1 for Lead Discovery - User's Manual
► To Display Multiple Columns:
1.
2.
Click on the Axis Selector for the Y-axis.
Select Multiple Columns.
Response: The Multiple Columns option will be selected with a check mark the next
time you open the list.
3. Click on the Axis Selector for the Y-axis.
4. Select an additional column to display. Selected columns will be indicated by a
colored square.
Note: You can also click on the Select Columns... option, which will display the Bar Chart
Columns tab of the Properties dialog. From this dialog you can easily add or remove several
columns to the bar chart.
Sorting using Right-Click
By right-clicking in a visualization a pop-up menu appears. This context menu lets you access
many features in a fast and easy way. If you are not using Multiple Columns you can sort the
bars in ascending or descending order; selecting the Reverse sort order will arrange your bars in
the reverse order of the current sort order. This is an instantaneous sorting of the bars; if you
filter the data with the query devices so the height of the bars change, their horizontal order will
not change until you choose to sort them again.
Note: Ascending and descending sorting is available when you are viewing single columns
with fixed coloring or categorical coloring in stacked bar layout. You cannot use sorting when
you are using multiple columns or either of the categorical coloring 100% bars layout options.
Tip: If you want to sort multiple column bar charts, first apply the sorting you want to a bar
chart with only the sorting column on the Y-axis. Then, select Multiple Columns and add more
columns to your visualization.
4.3
Pie Charts
Pie charts are circle graphs divided into pieces, each piece displaying the size of some related
piece of information. Pie charts are used to show percentages of a whole.
64
Visualizations
A pie chart visualization can consist of one or more pies. Multiple pies are used to split the data
by different categories in a column. This is accomplished by setting the X-axis and/or Y-axis
selectors to represent a categorical column in the data set.
► Make a new pie chart in one of the following ways:
•
Press Ctrl+5 on the keyboard.
.
• Click the New Pie Chart button on the toolbar,
• Select New Pie Chart from the Visualization menu.
By right-clicking in a visualization a pop-up menu appears. This context menu lets you access
many features in a fast and easy way.
4.4
Line Charts
A line chart is a way to summarize how two pieces of information are related and how they
vary depending on one another. Line charts are useful for visualizing data that behaves like a
function with respect to the variable on the X-axis, such as time series data. This visualization
type is ideal for showing trends or changes in data over a period of time, at even intervals. Line
charts emphasize time flow and rate of change rather than the amount of change.
65
TIBCO Spotfire DecisionSite 9.1.1 for Lead Discovery - User's Manual
The above picture demonstrates how line charts can be used. Say, for example, that you want to
show how fast a car devaluates the more mileage it gets. The line chart shows that according to
this set of data, the longer a car is driven, the more its value decreases.
► Make a new line chart in one of the following ways:
•
Press Ctrl+6 on the keyboard.
.
• Click the New Line Chart button on the toolbar,
• Select New Line Chart from the Visualization menu.
By right-clicking in a visualization a pop-up menu appears. This context menu lets you access
many features in a fast and easy way.
4.5
Profile Charts
A profile chart maps each record as a line, or profile. Each attribute of a record is represented
by a point on the line. This makes profile charts similar in appearance to line charts, but the way
data is translated into a plot is substantially different.
Consider, for example, a data set with three different applicants for a job position. Through tests
or interviews, the recruiter may have provided percentage estimates of each candidate in terms
of experience, social competence, and creativity. The data may look as follows:
Applicant
Experience
Grades
Creativity
Lisa
85
95
60
Joe
70
75
95
Anne
100
80
80
For each applicant, it is now possible to plot a personality profile. This will give a good (if
somewhat simplified) overview of characteristics, and a possibility to visually match an
applicant against a "model profile" for the job. The profile chart would look as follows:
66
Visualizations
► To create a profile chart:
1.
Press [Ctrl+7], or
click the New Profile Chart button on the toolbar, or
select Visualization > New Profile Chart.
2. Go to the axis selector of the X-axis and uncheck columns that you do not want to
include in the chart, such as identifier columns.
3. Use the Properties dialog to adjust the various properties of the chart.
By right-clicking in a visualization a pop-up menu appears. This context menu lets you access
many features in a fast and easy way.
4.6
Heat Maps
Heat Map plots are also known as Intensity plots or Matrix plots. A Heat Map can be likened to
a spreadsheet, where the values in the cells are instead represented by colors.
Heat Maps can be used to identify clusters of records with similar values, as these are displayed
as "areas" of similar color.
The easiest way to understand a heat map is to think of a table or spreadsheet which contains
colors instead of numbers. The default color gradient sets the lowest value in the heat map to
bright green, the highest value to a bright red, and mid-range values to black, with a
corresponding transition (or gradient) between these extremes.
67
TIBCO Spotfire DecisionSite 9.1.1 for Lead Discovery - User's Manual
► To create a Heat Map:
1.
2.
3.
Press [Ctrl+8], or
click the New Heat Map button on the toolbar, or
select Visualization > New Heat Map.
Go to the axis selector of the Y-axis and select the columns you wish to order the rows
by.
Use the Properties dialog to adjust the various properties of the chart.
Order of rows
By default, the order of the rows in the heat map is set to None, meaning that they are in the
same order as they were before the data set was imported. However, you may want to sort the
rows differently, such as if a certain column was pre-generated to contain a relevant sorting
order. The order of the rows is shown numerically in the X-axis selector of the Heat Map.
Click on the vertical axis selector to select which column (or None) to order the rows by.
68
Visualizations
Activating and Marking Records
Making a record active or marking several records in a heat map plot differs somewhat from
other plots. In a heat map, one row always equals one record. Consequently you always select
or mark one or more entire rows, which equals one or many records.
Making a record Active
When you click on a row, a black triangle appears at both ends of the selected row to indicate
that it is active. Information about the row is displayed in the Details-on-Demand window.
Marking Records
By clicking and holding the mouse button while the mouse pointer is on a row and dragging it
to cover several rows, these rows all become marked. This is indicated by a small bar shown at
the left and right of the rows in question. Details on these records are shown in the Details-onDemand window.
By right-clicking in a visualization a pop-up menu appears. This context menu lets you access
many features in a fast and easy way.
Show/hide deselected records
Records that have been deselected by using the query devices become gray (default color) in the
heat map. To hide these records, clear the Show deselected check box in the Heat Map tab of
the Properties dialog.
Note: If you have had a dendrogram associated to the heat map, this will no longer be valid
after hiding the deselected values. In this case, the dendrogram tree will be removed. You can
show the dendrogram again by selecting the Show deselected check box.
69
TIBCO Spotfire DecisionSite 9.1.1 for Lead Discovery - User's Manual
Row Labels
It is possible to show row labels either to the left or to the right of the heat map. This setting,
plus the selection of the column to display as row labels, are set on the Heat Map tab of the
Properties dialog.
When row labels have been displayed, it is possible to adjust the space available for the labels
by dragging the line between the heat map and the row labels with the mouse pointer. If the
height of the rows is so small that it is impossible to see row labels, row labels will not be
shown on every row. Instead, the number of row labels that fit into the heat map will be
displayed at an equal distance from each, for example only on every fifth row. If rows have
been deselected, no row labels will be shown for these rows.
Row labels that are too long to be displayed correctly will be truncated and end with an ellipsis
(...). In this case, hovering over the row label with the mouse pointer will display a ToolTip of
the entire row label text.
4.7
Tables
The Table visualization presents the data as a table of rows and columns. The Table can handle
the same number of rows and columns as any other visualization in DecisionSite.
In the Table, a row represents a record. By clicking on a row, you make that record active, and
by holding down the mouse button and dragging the pointer over several rows, you can mark
them.
You can sort the rows in the table according to different columns by clicking on the column
headers, or filter out unwanted records by using the query devices.
► To create a Table:
1.
Press [Ctrl+9], or
click the New Table button on the toolbar,
or select Visualization > New Table.
2. Click on the header of the column you wish to sort the rows by, or rearrange the order
of the columns by dragging and dropping the column headers horizontally.
3. Use the Properties dialog to further adjust the various properties of the chart.
By right-clicking in a visualization a pop-up menu appears. This context menu lets you access
many features in a fast and easy way.
70
Visualizations
You can sort the vertical order of the rows in the table. This can be done in several steps, for
example: first sort according to the values in column 1, then by the values in column 5, then by
the values in column 3, etc.
► To sort the data:
1.
2.
3.
Click on the header of the first column you wish to sort the data by.
Press Shift and click on another column header to make a subsequent sort according to
the values in that column.
Repeat step 2 on other columns as many times as you like.
A small digit will appear in the column headers indicating the sorting order.
Note: Click an additional time on a column header to toggle between Ascending and
Descending row order.
Note: For more information on how strings are sorted in a Table see the topic String.
► To change the column order:
1.
2.
Click on a column header and hold the mouse button down.
You can now drag and drop that column horizontally. Move the header to the position
you want it to be placed.
3. Release the mouse button when you wish to insert the column.
Note: You can move a column to the first or last position by right-clicking in the column
header and selecting Move First or Move Last from the menu that appears.
► To resize the column width:
Place the mouse pointer to the right of the column header you want to resize (just between it
and the next column header). The cursor changes into a cross with arrows.
By double-clicking, the column width will automatically expand so that all the items in the
column can be displayed without being truncated.
If you want to rescale the column width by hand, you can instead hold down the mouse button
and move the mouse horizontally, which will adjust the width. Release the mouse button when
you are satisfied.
Note: You can also set the width of a column by right-clicking in the column heading, and
selecting Column Width from the menu that appears. Enter the width in number of characters
and press OK.
In a table with many columns you often need to scroll horizontally. However, sometimes you
may want certain columns to always be displayed regardless of scrolling. This is achieved by
freezing one or more columns.
► To freeze columns when scrolling horizontally:
1.
2.
3.
4.
5.
Place the columns you want to freeze to the far left, using drag and drop.
Select Edit > Properties and choose the Table tab.
Select the number of Frozen columns from the drop-down list box.
Close the Properties dialog.
The leftmost column(s) you specified will be displayed at all times, when you are
scrolling horizontally.
Activating and Marking Records
Moving the mouse over a record will highlight it with a thin black rectangle.
To make a record Active simply click on it. The Active record is indicated by a thick black
rectangle around it. You can use the arrow keys to move the active record indicator up or down,
thus making another record active instead.
71
TIBCO Spotfire DecisionSite 9.1.1 for Lead Discovery - User's Manual
There are several ways to help you mark a set of records in the Table, as explained in the table
below. Marked records are by default indicated by a dark green background.
The following instructions explain how to mark one or more records in the Table:
► To mark one single record:
Mouse:
Drag the mouse over the record while holding down the left mouse button. A dotted rectangle
will indicate the drag operation.
Keyboard + mouse:
Click on the record you want to mark. Then click on it again, while holding down the Shift key.
Keyboard:
Press the Spacebar to mark the currently active record (only in table visualizations).
► To mark a range of records:
Mouse:
Drag the mouse over the records you want to mark. A dotted rectangle will indicate the drag
operation.
Keyboard + mouse:
Click on the first record in the range. Hold down the Shift key and click on the last record in the
range. The records in the range will be marked.
Keyboard only:
Move the active record to the first record in the range using the up and down arrow keys. Press
the Spacebar to mark this record and to start a new "marking session". Hold down the Shift key
while pressing the up/down arrow keys. The records will be marked one after another.
► To mark multiple records:
Keyboard + mouse:
Drag the mouse over the records in the first range. Hold down the Ctrl key and drag over
another range. The records will be added to the set of marked records.
Alternative: Hold down the Ctrl key while clicking on individual records. This will include the
clicked records in the set of marked records.
Keyboard only:
Mark a range of records as described above. Continue to move the active record with the arrow
keys. Hold down the Ctrl key and press the Space key to add the currently active record to the
set of marked records.
4.8
Properties Dialog
4.8.1
Annotations Tab
4.8.1.1
Annotations Tab
Edit > Properties > Annotations tab
72
Visualizations
You can give any visualization a title and an annotation. The title will appear as the caption of
the window. It can also appear in the heading of printouts. The annotation will appear as a
ToolTip when you place the mouse pointer over the paper clip at the bottom-left corner of the
visualization.
► To set title and annotation:
1.
2.
3.
Go to the Annotations tab of the Properties dialog.
Type a title and/or an annotation.
Select the check box Append axes names to visualization title if you want the
current axes to be appended to the title.
73
TIBCO Spotfire DecisionSite 9.1.1 for Lead Discovery - User's Manual
You can type in a lot of text in the Annotation field, as well as cut and paste to and from other
Windows applications; this can only be done with text, however. This is a good place for
adding information about the purpose and methods used in the visualization, features to look for
and other helpful information concerning the data. The annotation can be printed together with
the visualization, by selecting the Include annotation option available in the Print Layout
Wizard on the File menu.
4.8.2
4.8.2.1
Data and Background Tab
Data and Background Tab
Edit > Properties > Data and Background tab
74
Option
Description
Axes
The Axes section allows you to control axis labels, data range and
grid lines for bar charts, pie charts, line charts and heat maps. This
section does not appear for scatter plots since these have a separate
Tab for more advanced settings, see Axes for Scatter Plots.
Background image
Background image lets you select a file to use as background. You
can also specify how the background image is positioned.
HTML Details-onDemand
Details-on-Demand lets you choose templates for formatting the
HTML display of record details.
Statistical measures
Statistical measures offers control over the standard deviation
marking lines, error bars, and different types of curves and curve
fits. Available for 2D scatter plots and pie charts only.
In bar charts, you can select to add a vertical reference line from the
Visualizations
Add menu under Statistical measures.
4.8.2.2
Axes
Edit > Properties > Data and Background tab
The Axes section of the Data and Background dialog appears in all plots except for Scatter
Plots. Scatter Plots can handle more advanced axis labels and have a separate properties tab for
this, see Axes tab for Scatter Plots. For all other plots please continue below.
The Axes section of the Data and Background tab lets you define attributes for labels, axes
and grids. The check boxes allow you to control which labels and grid lines to display.
Data Range
In the Data Range dialog, the minimum and maximum values of the axes can be set. This
allows you to get more space around the data whose range is otherwise set to the range of the
records of the data set.
Labels
If you click the Labels... button you can set the label orientation, the label spacing and the
maximum number of labels for each of the axes.
75
TIBCO Spotfire DecisionSite 9.1.1 for Lead Discovery - User's Manual
76
Option
Description
Label Orientation
Specifies whether the labels should be oriented horizontally or
vertically on the X-axis and on the Y-axis.
Tick spacing
For spacing you can select to show axis ticks in four ways:
Even Distribution will attempt to distribute ticks evenly between
the highest and lowest value .
At Values will not place a tick where there is no value.
At All Values will place ticks at all values (within density
constraint).
At Even Values will attempt to place ticks at evenly spaced whole
numbers.
Max no. of ticks
Specifies the maximum number of allowed ticks. However, the
actual number of displayed ticks might be less than this number
depending on which option you have selected under Tick spacing
above.
Reset
Resets all settings in this dialog to its default value.
Visualizations
4.8.2.3
4.8.2.3.1
Background Images
Image Files and Background Maps
Background maps, images, and figures may be
displayed along with visualization markers in a
Spotfire DecisionSite visualization. Such images can
ease the interpretation of the data by providing a
context in which it can be interpreted. For example,
some aspects of the environmental database described
earlier can be examined more easily if data is seen
together with a map of Sweden. Another example
where an image provides context to the data is the
metabolic pathway for yeast genes used in the
microarray sample file included in the Spotfire
DecisionSite distribution.
Background images can be added to 2D scatter plots, line charts, profile charts, bar charts and
pie charts.
Formats of background images and maps
Supported background image formats:
• Windows bitmap images (*.bmp)
• JPEG images (*.jpg, *.jpeg)
• PNG bitmap images (*.png)
• TGA files (*.tga)
• PCX files (*.pcx)
Supported background map formats:
• MapInfo Interchange Format files (*.mif). These are typically tagged with for example
with zip codes, which Spotfire DecisionSite can use to position visualization markers.
• Spotfire mapping files (*.sfm)
4.8.2.3.2
Adding a Background Image
Edit > Properties > Data and Background tab
► To add a background image to the current visualization:
1.
2.
3.
In the Properties dialog, open the Data and Background tab.
Enter the path and name of the image file to use in the file box.
Tip: The Browse... button can be used to search the file system for appropriate files.
You can also enter an URL to an image available on a server.
Click Position... in the Background Image section to adjust the positioning of the
image relative to the markers.
77
TIBCO Spotfire DecisionSite 9.1.1 for Lead Discovery - User's Manual
Tip: If desired, adjust the Data Range... in the Axes section to increase the visible
area of your visualization. This might be necessary if you want the picture area to be
larger than the area covered by markers.
4.8.2.3.3
Position a Background Image
Edit > Properties > Data and Background tab > Position...
On the Data and Background tab of the Properties dialog, click the Position... button. The
dialog that appears allows you to specify how the background image is positioned, by giving
the coordinates for two opposing corners. These coordinates refer to the current X and Y-axes.
This means that the corners are "pinned" to values in the data range. Zooming and panning will
cause the image to stretch and scroll with the data.
4.8.2.3.4
Option
Description
Y High
Specifies the top position of the background image.
Y Low
Specifies the bottom position of the background image.
X Low
Specifies the left edge of the background image.
X High
Specifies the right edge of the background image.
Default
Reverts to the default coordinates.
Adding MapInfo Background Files
MapInfo is a leading geographic information system software package. MapInfo Interchange
Format (MIF) is an ASCII format developed by Mapping Information Systems Corporation
(http://www.mapinfo.com/) to facilitate the transfer of data from other geographical information
system packages to MapInfo.
Spotfire DecisionSite can import MIF files to use as background maps. This allows you to
position visualization markers in two dimensions based on a single column such as zip code,
area code, or area name.
Suppose, for example, that you have a data file with information about various countries, such
as name, population, language, etc. However, the data set includes no information about
geographical coordinates. By using a MIF file as background, you get not only a background
map, but also two new columns of data. Each record is given map coordinates depending on
which country it represents.
78
Visualizations
► To use a MIF file as background:
1.
2.
3.
Create a scatter plot visualization.
Activate the Properties dialog and select the Data and Background tab.
Click the Browse... button by the Background Image field and select MapInfo
Interchange Files, then browse to the file you want as a background.
4. Click Open.
The Match Data and Background dialog is displayed, where it is possible to match a
database column with a tag in the MIF file.
5. In the left field, select the column in your data set that identifies geographical position,
in this case Country.
6. In the right field, select the MapInfo tag in the MIF file that relates to the same
information, in this case Country. (The names are not necessarily the same.)
7. In the two text fields, enter names for the new columns that will be added to your data
set, specifying X and Y position.
8. Make sure Use current axes is cleared. If you select this option, then no new
coordinates will be extracted from the MIF file. You will then only get a background
image.
9. If you want to add all the information in the MIF file (i.e., not just the coordinates) to
your data set, then select Make new columns for background columns.
10. Click OK.
Comment: Spotfire DecisionSite will try to match data and background. The
background image is shown, and the axes changed to the new coordinate columns.
4.8.2.3.5
Spotfire DecisionSite Mapping Files (SFM Files)
The Spotfire DecisionSite mapping file (*.sfm) format first establishes a coordinate system,
which relates the data set's coordinate system to that of the polygon set being defined. After
that, a number of polygons are defined. A polygon is defined by a fill color, an origin point, a
border color, the number of points and the X, Y, and Z coordinates of the points.
The Z coordinates are ignored, but they must be included. The format of the file as follows
(with variables in italics):
COORDSYS xmin xmax ymin ymax zmin zmax
ADD
POLY fillcolor xorigin yorigin zorigin
!yes
numberofpoints
x1 y1 z1
x2 y2 z2
...
A sample file could look as follows:
COORDSYS 0.0 1.0 0.0 1.0 0.0 1.0
ADD
POLY LimeGreen 0.0 0.0 -0.02 0.0
!yes
5
0.677419 0.976261 0.0
0.680645 0.977745 0.0
0.680645 0.983680 0.0
0.677419 0.985163 0.0
0.677419 0.988131 0.0
The env.sfm file in the Spotfire DecisionSite distribution serves as an example of this
background map format.
To map a data file to a Spotfire mapping file:
79
TIBCO Spotfire DecisionSite 9.1.1 for Lead Discovery - User's Manual
In your visualization, select the two axes from the data that serve as coordinates.
In the Data and Background tab in the Properties dialog, select an SFM file which has a
coordinate system matching the coordinates in the axes file.
4.8.2.4
HTML Details-on-Demand
Edit > Properties > Data and Background tab
The information of each record can be displayed in an external or internal HTML browser.
HTML Details-on-Demand templates are accessed through the Data and Background tab.
4.8.2.5
4.8.2.5.1
Statistical Measures
Statistical Measures
Edit > Properties > Data and Background tab
Some statistics and curves can be visualized directly in 2D scatter plots. This section of the
Edit > Properties > Data and Background dialog offers control of several kinds of statistical
measures:
Average and Standard Deviation – X-axis and Y-axis average and standard deviation
marking lines. The standard deviation is an indication of how dispersed the probability
distribution is about its center.
Error Bars – Error bars are used to indicate the estimated error in a measurement. Errors bars
indicate the uncertainty in the x and/or y values.
Orthogonal Straight Line Fit – This is suitable when it is reasonable to assume randomness
for both the X-axis values and the Y-axis values.
80
Visualizations
Curve – This option lets you enter a custom expression using the full power of the SXL
language, which is drawn as a curve overlaying the visualization.
Curve Fit – This adds a best fit curve to the graph using one of several different models. Curve
fit should be used when there is no randomness for the markers along the X-axis.
Note: If you designate X and Y axes for a Pie Chart, you can add some statistical measures to
that visualization as well.
► To add a measure or a curve to a visualization:
1.
2.
3.
4.
5.
Open the Properties dialog and select the Data and Background tab.
Click on the Add button.
Choose a measure from the drop-down list.
Make the appropriate settings in the dialog that appears.
Click OK.
► To edit a statistical measure:
1.
2.
Select a measure from the list by clicking on it.
Click on the Edit button.
•
Double-click on the statistical measure in the list.
or
► To remove a statistical measure:
1.
2.
Select a statistical measure from the list by clicking on it.
Click on the Remove button, or press Delete on your keyboard.
You can show or hide a statistical measure without removing it permanently from the
list.
► To show/hide a statistical measure:
•
•
4.8.2.5.2
Select the check box beside a statistical measure to show it in the scatter plot.
Clear the check box beside a statistical measure to hide it in the scatter plot.
Average and Standard Deviation
The statistical measure "Average" displays the X-axis and Y-axis standard deviation marking
lines.
The standard deviation, s, is an indication of how dispersed the probability distribution is about
its center. It is computed as follows:
where
n is the number of values in the group and
is the mean value of the group.
Note: In this application, the standard deviation is calculated for the data in the data set, as
opposed to calculation of standard deviation for the mean value only.
81
TIBCO Spotfire DecisionSite 9.1.1 for Lead Discovery - User's Manual
User Interface
4.8.2.5.3
Option
Description
Calculate average of
Specifies whether the average of the X values or the Y values should
be calculated.
Base calculation on
Specifies whether the statistical measure should be calculated based
on All records in the data set regardless of any filtering done with the
query devices, or whether the calculation should be based on the
Selected records so that filtering with the query devices will affect
the result.
Number of standard
deviations
Specifies how many standard deviations away from the (bolder)
average line the deviation lines will be drawn.
Trellis plot options
Specifies whether the average displayed in each trellis panel will be
calculated based on the records specific to that trellis panel only, or if
the average will be based on all records regardless of trellis condition
and therefore be the same for every trellis panel.
Color
The color of the displayed line.
Width
The width (in pixels) of the displayed line.
Error Bars
Error bars are used to indicate the estimated error in a measurement. In other words, they
indicate the uncertainty in the x and/or y values.
Unlike other statistical measures in Spotfire DecisionSite, no calculations are performed to
produce the error bars. Instead the data needed is assumed to be in the data set, in the form of
three columns representing an average value, a high error and a low error. The marker itself
shows the average value, and the high and low error values make up the error bar.
82
Visualizations
User Interface
4.8.2.5.4
Option
Description
Column containing
main values
Specifies which column contains the main (or average) values.
Column containing
upper errors
Specifies which column contains the upper error values.
Column containing
lower errors
Specifies which column contains the lower error values.
Use marker color
Select this option to use the marker color for the error bars.
Use custom color
Select this option to use a custom color for the error bars.
Width
The width (in pixels) of the error bars.
Orthogonal Straight Line Fit
83
TIBCO Spotfire DecisionSite 9.1.1 for Lead Discovery - User's Manual
Orthogonal straight line fit is calculated by choosing the line that minimizes the least square
sum of the distance d perpendicular to the line, of all the selected markers (see picture below).
It should be used when the distance between the markers along both the X-axis and the Y-axis
varies.
User Interface
84
Option
Description
Base calculation on
Specifies whether the line should be calculated based on all records in
the data set regardless of any filtering done with the query devices, or
whether the calculation should be based on the selected records so
that filtering with the query devices will affect the result.
Trellis plot options
Specifies whether the orthogonal straight line fit displayed in each
trellis panel will be calculated based on only the records specific to
that trellis panel, or if the fit will be based on all records regardless of
trellis condition and therefore be the same for every trellis panel.
Color
The color of the displayed line.
Width
The width (in pixels) of the displayed line.
Visualizations
Results
If Orthogonal Straight line fit is active and the Legend is visible, information about Statistical
measures will be displayed there. The correlation value, R, which is displayed, is the standard
Pearson's correlation and is calculated like this:
Note: The Legend will not display the R value if you have several Trellis panels.
4.8.2.5.5
Curve
The Curve feature allows you to specify a curve to be displayed on top of a scatter plot or pie
chart, given that you have specified X- and Y-axes in the pie charts. You simply enter an
expression where the curve is defined as "y as a function of x" and it will be drawn on top of the
plot. To aid you in creating powerful expressions, you can use the Spotfire Expression
Language (SXL). All the functions of SXL can be selected and inserted from the Function list
in the dialog.
Examples:
y(x) = 10+x
y(x) = Average(x)+100
y(x) = 10*sin(x*PI())+5
You can also select the color and width of the curve. In the Status field there is also a syntax
verification of the entered expression, where you can easily see if the expression is correct.
If the expression is valid, and the Redraw curve while typing check box is selected, the curve
will be drawn and immediately updated on screen when you edit your expression, so you can
always check to see if it looks like you intended.
Transformations
The x and y values are unaffected by transformations, but the mapping onto the plot will be
affected. This means that a straight line equation such as y(x) = x, will turn into a curve if the
X-axis column uses a Log transform.
85
TIBCO Spotfire DecisionSite 9.1.1 for Lead Discovery - User's Manual
User Interface
Category
Select a category of functions to limit the choices in the Function list.
• All
• Operators
• Math Functions
• Statistical Functions
• Text Functions
• Logical Functions
• Date & Time Functions
• Conversion Functions
Function
Select a function by clicking on it, and click the Insert Function button to insert it to the
Expression field. You can also double-click on a function to insert it.
If you place the cursor at a specific location in the Expression field, the function will be
inserted there.
Description
This field provides a brief description of the selected function. For more detailed descriptions,
please see Spotfire Expression Language (SXL).
Expression
This is the text field in which you build your expression. You can insert functions to it from the
list, or enter text as in any standard text editor.
Cut/Copy/Paste works in the field using standard Ctrl+X / Ctrl+C / Ctrl+V.
86
Visualizations
Highlighting a section of the expression, and clicking Insert Function will add the selected
function to the expression with the highlighted section as an argument.
Also, Undo/Redo functionality is available by pressing Ctrl+Z.
Note: Very long expressions will be displayed truncated in the Visualization Legend. To avoid
this, insert a blank space with suitable distance. This will not affect the expression, but will
allow the Legend to display it over several rows.
Color
Select the color of the curve by clicking on this button.
Width
Select the width (in pixels) of the curve by clicking on this drop-down list.
Status
This field shows if the current expression is valid or not. If the expression is correct, then OK
will be shown.
If this field shows an #EXPR! error, there is a problem with the syntax of the expression.
Moving the mouse pointer over the field or clicking on it, will display an explanation of what is
wrong. Pressing F5 will also display the error description. Pressing F4 will move the cursor to
the position in the expression where the error lies.
Redraw curve while typing
If this check box is selected, the curve will be drawn and updated in the plot while you edit the
expression. This is useful to verify that the curve actually looks like you intended, but if you are
using very large data sets and complex expressions for the curve, it may be a good idea to turn
it off in order to improve performance.
4.8.2.5.6
4.8.2.5.6.1
Curve Fit
Curve Fit
Curve fit (regression analysis) allows you to summarize a collection of sample data points by
fitting them to a model that will describe the data and display a curve or a straight line on top of
a scatter plot or a pie chart. Unlike the Curve feature, Curve Fit is not a fixed curve, but rather a
line that can be changed upon changing the input data during filtering or zooming.
Curve fitting can be used either to determine the parameter values of a known regression model
or to find a model that fits the data better than other models.
Tip: If a curve fit is active and the Legend is visible, information about the curve fit will be
displayed there. Select View > Legend to display it. More information is also available via
View Result, see below.
Transformations
The x and y values are unaffected by transformations, but the mapping onto the plot will be
affected. This means that a straight line equation such as y(x) = x, will turn into a curve if the
X-axis column uses a Log transform.
Limitations on data
All types of input data cannot be used to calculate curves using all different types of models.
All models require:
• more than one data point to use in the calculation
• that not all data points have the same x- and y-values (lie on top of each other)
• that not all data points have the same x-value
87
TIBCO Spotfire DecisionSite 9.1.1 for Lead Discovery - User's Manual
In addition, the logarithmic model, the power model and the logistic regression model require
that all data points have positive x-values. The power model also requires that all y-values have
the same sign (positive or negative).
The logistic regression requires that no values are lower than the specified min value or higher
than the specified max value and that not all data points have the same y-value. If any of the
above limitations occur, no curve will be drawn, and an error message will be displayed in the
Legend.
User Interface
Model
Specifies the type of curve to display in your visualization. Choose from:
Straight Line
y=a+bx
Logarithmic
y=a+blnx
Exponential
y=aebx
Power
y=axb
Logistic Regression
y=min+(max-min)/(1+(X50/x)Hill)
2nd order Polynomial
y=a+bx+cx2
3rd order Polynomial
y=a+bx+cx2+dx3
4th order Polynomial
y=a+bx+cx2+dx3+ex4
5th order Polynomial
y=a+bx+cx2+dx3+ex4+fx5
See Curve Fit Models for more information.
88
Visualizations
Properties...
Available for Logistic regression only. Lets you specify values for max and min. If no values
are specified, they will be automatically calculated.
Note: If you specify max and min values within the range of your data, you must filter out all
data points outside of your specified range using the query devices or zooming in order to
obtain a curve. (For example, no curve will be calculated if the min value equals the lowest
value of y in your data set, unless you filter out this value and base the calculation on selected
values only.)
Base calculation on
Specifies whether the statistical measure should be calculated based on all records in the data
set regardless of any filtering done with the query devices, or whether the calculation should be
based on the selected records so that filtering with the query devices will affect the result.
Color
The color of the displayed line.
Width
The width (in pixels) of the displayed line.
Trellis plot options
Specifies whether the curve fit displayed in each trellis panel will be calculated based on only
the records specific to that trellis panel, or if the fit will be based on all records regardless of
trellis condition and therefore be the same for every trellis panel.
View Result
Opens the Curve Fit: Result dialog, where detailed results from the fit is shown and can be
copied into other applications.
Apply
Applies the curve fit to the visualization. Allows you to test one or many curve fits in your
visualization without having to close the Curve Fit dialog.
4.8.2.5.6.2
Curve Fit: Result Dialog
The Curve Fit Result dialog displays detailed information about all curve fits that were enabled
when you clicked on the button. Click on a specific curve fit in the Visualizations tree to view
its details.
Tip: Select all text in the gray part of the dialog and copy the information, if you want to
include the results in a report.
89
TIBCO Spotfire DecisionSite 9.1.1 for Lead Discovery - User's Manual
User Interface
The left pane shows a tree view of the different visualizations that have one or more curve fits
applied. Click on the desired curve fit to view the details in the right pane of the dialog.
The right pane displays detailed information about the used equations and parameters of the
selected curve. See Curve Fit Theory and Curve Fit Models for more information about the
various parameters.
► To reach the Curve Fit: Result dialog:
Right-click in the scatter plot or pie chart where you have applied a curve fit and select View
Curve Fit Result from the pop-up menu.
Tip: You can also reach this dialog from the Curve Fit dialog, e.g., if you are testing several
different curves using the Apply-button. In the Curve Fit dialog, click on the View Result
button to display the results.
4.8.2.5.6.3
Curve Fit Models
There are several different models available for curve fitting. See Curve Fit for information
about how to apply the various curves. The Curve Fit models below can be used when there is
no randomness for the markers along the X-axis.
Straight Line
The straight line fit is calculated by choosing the line that minimizes the least square sum of the
vertical distance d, of all the selected markers (see picture below) by using the following
equation:
where a is the slope and b is the intercept.
90
Visualizations
For example, you could plot days along the X-axis and have one marker for each day. The
distance between the markers along the X-axis is the same, thus making straight line fit
appropriate.
Logarithmic
The logarithmic fit calculates the least squares fit through points by using the following
equation:
where a and b are constants, and ln is the natural logarithm function. This model requires that
x>0 for all data points. DecisionSite uses a nonlinear regression method for this calculation.
This will result in better accuracy of the calculation compared to using linear regression on
transformed values only.
Exponential
The exponential fit calculates the least squares fit through points by using the following
equation:
where a and b are constants, and e is the base of the natural logarithm.
Exponential models are commonly used in biological applications, e.g., for exponential growth
of bacteria. DecisionSite uses a nonlinear regression method for this calculation. This will result
in better accuracy of the calculation compared to using linear regression on transformed values
only.
Power
The Power fit calculates the least squares fit through points by using the following equation:
where a and b are constants. This model requires that x>0 for all data points, and either that all
y>0 or all y<0. DecisionSite uses a nonlinear regression method for this calculation. This will
result in better accuracy of the calculation compared to using linear regression on transformed
values only.
Logistic Regression
The logistic regression fit is a dose response ("IC50") model, also known as sigmoidal dose
response. The four parameter logistic model is the most important one.
Dose-response curves describe the relationship between response to drug treatment and drug
dose or concentration. These type of curves are often semi-logarithmic, with log (drug
concentration) on the X-axis. On the Y-axis one can show measurements of enzyme activity,
accumulation of an intracellular second messenger or measurements of heart rate or muscle
contraction.
91
TIBCO Spotfire DecisionSite 9.1.1 for Lead Discovery - User's Manual
The current implementation of the logistic regression fit uses the following equation:
where min and max are the lower and upper asymptotes of the curve, Hill is the slope of the
curve at its midpoint and X50 is the x-coordinate of the inflection point (x, y). This model
requires that x>0 for all data points and that you use at least four records to calculate the curve.
Note: The logistic regression model of DecisionSite does not assume logarithmic values of x
and X50, unlike some other curve fitting software. Hence, if your input data is logarithmic you
might want to create a column that is not logarithmic before you apply the logistic regression
curve fit, in order to obtain similar results to the ones you are used to. (For example, by using
Data > New Column > By Expression.) If you want the curve to be displayed on a logarithmic
form, right-click in the Query Devices window and select Set Property > Log Scale.
2nd order Polynomial
The second order polynomial fit, or quadratic curve, calculates the least squares fit through
points by using the following equation:
where a, b and c are constants. This model requires that you use at least three records to
calculate the curve.
3rd order Polynomial
The third order polynomial fit calculates the least squares fit through points by using the
following equation:
where a, b, c and d are constants. This model requires that you use at least four records to
calculate the curve.
4th order Polynomial
The fourth order polynomial fit calculates the least squares fit through points by using the
following equation:
where a, b, c , d and e are constants. This model requires that you use at least five records to
calculate the curve.
5th order Polynomial
The fifth order polynomial fit calculates the least squares fit through points by using the
following equation:
92
Visualizations
where a, b, c , d, e and f are constants. This model requires that you use at least six records to
calculate the curve.
If you have a low number of unique x-values, a polynomial curve can be calculated in an
unlimited number of ways. This means that you may end up with a curve that does not look like
expected. If this should happen, you probably should not apply this model to your data. The
polynomial models have all been partially solved by using the LAPACK software package, see
References.
4.8.2.5.6.4
Curve Fit Theory
Generally, curve fit algorithms determine the best-fit parameters by minimizing a chosen merit
function. In order to optimize the merit function, it is necessary to select a set of initial
parameter estimates, and then iteratively refine the merit parameters until the merit function
does not change significantly between iterations. The Levenberg-Marquardt algorithm has been
used for nonlinear least squares calculations in the current implementation.
The goodness of fit is shown as an R2-value. A value of R2=1.0 indicates a perfect fit, whereas
R2=0.0 indicates that the regression model might be unsuitable for this type of data.
The standard deviation (StdDev) shown in the Curve Fit: Result dialog is the standard deviation
of the differences between the actual data points and the calculated curve. It approaches 0 if the
selected model accurately describes the data.
R2
The R2-value measures how much of the variation in the data points that can be explained by
the selected regression model:
where
(the regression sum of squares)
(the residual or error sum of squares)
(the total sum of squares, SST= SSE+SSR)
and represents the ith fitted value (calculated using the selected model) of the dependent
variable Y.
Limitations to curve fitting
Since the calculation of the curve is an iterative process, the calculation must stop somewhere.
In some cases the maximum number of iterations might be reached before the best possible
curve has been calculated. In that case, a message will inform you of this in the Legend (select
View > Legend to display it). In some cases, for example if the data is widely scattered or too
few data points are available, the iterative process might also result in a curve that converges on
a false minimum.
When a model is applied during data analysis, it is important not only to look at the R2-value
and how well the curve fits the current markers in the scatter plot. It is also good to consider
93
TIBCO Spotfire DecisionSite 9.1.1 for Lead Discovery - User's Manual
what the curve would look like for more extreme values and determine if the model is
reasonable in a scientifical or statistical context. The number of unique x-values must be larger
than, or equal to, the number of degrees of freedom in order to obtain a unique curve. If the
curve can be solved in an infinite number of ways, it is not sure that the presented curve will be
relevant to your data.
References
Heath, M.T., (2002), Scientific Computing: An Introductory Survey, 2nd ed., McGraw-Hill,
New York.
Anderson, E., Bai, Z., Bischof, C., Blackford, S., Demmel, J., Dongarra, J., Du Croz, J.,
Greenbaum, A., Hammarling, S., McKenney, A., Sorensen, D., (1999), LAPACK Users' Guide,
3rd ed., Society for Industrial and Applied Mathematics, Philadelphia, PA, ISBN = 0-89871447-8
4.8.2.6
4.8.2.6.1
Reference Lines in Bar Chart
Reference Line Dialog
This dialog is used to create vertical reference lines in a bar chart.
94
Option
Description
Expression
Type the expression you want to be presented as a reference line in
Visualizations
the text field. If you want a line drawn at a specific number, you
simply type that number in the text field. You can also type more
complicated expressions, including a number of functions and
variables such as mean and median directly in the field. For more
information about the available functions and variables, click on
Edit... (see below).
Note that variables such as median and mean are always calculated on
all data and not on the data filtered by the query devices or zooming.
Edit...
Opens the Edit Expression dialog, where you can combine different
variables and functions into an expression, as well as read a short
description of all available functions.
Result
Displays the result of the expression.
Line style
Allows you to change the color, style and line width of the reference
line.
Transparency
Allows you to change the transparency of the reference line. A
completely solid line is obtained by moving the thumb to the far right.
Place line in
Determines whether the line should be placed in the Foreground or in
the Background of the bars.
Show label
Select this check box to show a label for the reference line. Clear the
check box to remove the label.
You can type a label text directly in the text field or, you can use one
of the available templates, see below.
Templates
Displays a drop-down menu from where you can select a template for
how the label should be presented.
Choose from Value (which simply shows the x-axis value of the
reference line), Expression (which shows the expression, e.g.,
"median+150"), Expression: Value (e.g., "median+150:328") or
Display Name (which shows the name of the reference line as it is
presented in the legend (e.g., "Vertical reference line: x =
median+150").
Horizontal
Click this radio button for a horizontal label.
Vertical
Click this radio button for a vertical label.
Adjust data range to Select this check box to adjust the data range so that the reference line
becomes visible even if it is outside the data range for the current data
include line
set.
► To reach the Reference Line dialog:
1.
2.
3.
4.
Create a bar chart with a continuous column on the X-axis.
Select Edit > Properties.
Go to the Data and Background tab.
Click on Add and select Vertical Reference Line... from the drop-down menu.
95
TIBCO Spotfire DecisionSite 9.1.1 for Lead Discovery - User's Manual
4.8.2.6.2
96
Edit Expression Dialog
Option
Description
Variables
Lists the available variables which can be used to create your expression.
Insert a variable into your expression with the Insert Variable button.
Function
category
Select a category of functions to limit the choices in the Functions list:
All
Operators
Math Functions
Statistical Functions
Text Functions
Logical Functions
Date & Time Functions
Conversion Functions
Function
Select a function by clicking on it, and click the Insert Function button to
insert it to the Expression field. You can also double-click on a function to
insert it.
If you place the cursor at a specific location in the Expression field, the
function will be inserted there.
Visualizations
Description
Provides a brief description of the selected function. For more detailed
descriptions, please see Spotfire Expression Language (SXL).
Expression
This is the text field in which you build your expression. You can insert
variables and functions to it from the lists, or enter text as in any standard
text editor.
Cut/Copy/Paste works in the field using standard Ctrl+X / Ctrl+C /
Ctrl+V.
Highlighting a section of the expression, and clicking Insert Function will
add the selected function to the expression with the highlighted section as
an argument.
Also, Undo/Redo functionality is available by pressing Ctrl+Z.
Note: Very long expressions will be displayed truncated in the
Visualization Legend. To avoid this, insert a blank space with suitable
distance. This will not affect the expression, but will allow the Legend to
display it over several rows.
Target type
Displays the data type of the result.
Result
This field displays the result of applying the current expression to the data
set.
If this field shows an error message, then there is a problem with the
expression. Clicking on the field will display an explanation of what is
wrong. Pressing F5 will also display the error description. Pressing F4 will
move the cursor to the position in the expression where the error lies.
There are three kinds of error messages:
#EXPR! – there is a problem with the syntax of the expression.
#NUM! – the expression evaluates to infinity or other illegal number.
#ARG! – there is a problem with one or many arguments.
Recent
expressions
This list contains the fifteen most recent expressions you have created.
Insert
Inserts the selected recent expression to the cursor position of the
expression field.
4.8.3
Columns Tab
4.8.3.1
Columns tab
Edit > Properties > Columns tab
97
TIBCO Spotfire DecisionSite 9.1.1 for Lead Discovery - User's Manual
This dialog is used to set column properties columns—how they are viewed, what query device
to associate with the column, annotations, name, scale, etc.
98
Option
Description
Column
Lists all the existing columns in the data set. Select a column name
and use the controls described below to control that column. Click
on the headers (e.g., Column, Type, etc.) to sort the columns
accordingly.
Annotation
Enter any text that you want to associate with this column. This text
will appear when you place the mouse pointer over the paper clip
icon next to a query device.
Show indicators in
query devices
Displays a paper-clip icon in the upper right corner of the query
device when the column has an annotation, and displays the letter 'e'
when the column contains empty values.
Query device type
Shows what query device type is assigned to the selected column in
the list.
Show empty values
Shows (or hides) all records were a value is missing in the selected
column.
Show/Hide
Toggles the query device associated with this column.
Rename Column
Allows you to enter a new name for the column.
Format
Configures how to display the format for various columns (Number
Formatting, Date and Time Formatting, Date Formatting or Time
Formatting). For example, how to represent negative values, number
of decimal digits, etc.
Visualizations
Select one or more columns from the list, click the Format button,
and select a formatting option to access the formatting dialog.
Note: Formatting may change the perceived type of a column. For
example, a date column will be presented as a string column when
week day formatting is applied. See Rearranging the Data by
Formatting for more information.
Selecting Format > None from the drop-down menu, resets the
options to the default settings.
Scale
Sets the scale of the selected column or columns when mapped to an
axis in the visualization. Scale options: Original, Ln(1+x), Log,
Exp, Exp10, Inverse Scale, and Reverse sorting.
New Column
Adds a new column either by Binning or from an Expression.
Delete Columns
Deletes the selected column from memory. The underlying file is not
affected unless you save the data set.
This dialog can also be accessed by double-clicking in the upper right corner of any query
device.
4.8.3.2
Annotating Columns
Edit > Properties > Columns tab
It is possible to annotate individual columns. This text will appear when you place the mouse
pointer over the paper clip next to a query device.
► To enter an annotation for a column:
1. Go to the Columns tab of the Properties dialog.
2. Select a column.
3. Enter your text in the Annotation field.
You can also edit annotations for a column by double-clicking the paper-clip next to the
corresponding query device, or by selecting Edit Annotations... from the query device pop-up
menu.
4.8.3.3
Transforming Axis Scale
A numerical column can be set to display its values using a variety of scales instead of the
linear scale, which is default: Natural Log Scale (Ln (x+1)), Logarithmic Scale (Log),
Exponential to the bases of e (Exp) and 10 (Exp10), Inverse Scale (1/x), and Reverse Scale. The
last option changes the sort order for the selected column. This is accomplished by rightclicking on the query device representing the column, and from the Set Property sub-menu
selecting the transformation desired.
Another way to change the scale is from the Columns tab of the Properties dialog, by marking
the column to rescale and selecting the transformation from the Set Scale pull down box.
99
TIBCO Spotfire DecisionSite 9.1.1 for Lead Discovery - User's Manual
The transformation can be removed and the scale reset to linear by choosing Original Scale.
4.8.3.4
Number Format
You can specify how you want DecisionSite to display number formatting for integer and
decimal columns. You can set the number of decimal digits, how to display negative numbers,
to display numbers using scientific notation, select whether or not to use thousands separators,
and also add a currency symbol to be displayed together with the actual value.
Note: If you prefer, you can set default number formatting for all Integer type columns and all
Decimal type columns, instead of specifying this for each column individually. Such default
settings will be applied every time you open a new data set in DecisionSite Client. Default
settings are made in the Fonts & Numbers tab of the Options dialog.
► To set Number Formatting for a column:
1.
2.
3.
100
Open the Properties dialog by selecting Edit > Properties and click on the Columns
tab.
Select one or more columns you wish to set number formatting for.
Click on the Format button.
Visualizations
4.
Select Number... which opens the Number Format dialog.
5.
6.
Specify the Number of decimal digits and how to display Negative numbers.
Specify whether or not you wish to display the numbers in Scientific notation. (For
example: 1,23E+006.)
Note: When using Scientific notation, the Use thousands separator check box is
cleared and grayed out, as it is no longer applicable.
7. Decide whether or not to Use thousands separator.
Note: The symbol used for thousands separator and decimal separator is determined
by the Windows Locale setting.
8. If desired, enter Unit labels in the Left or the Right text field.
Comment: This could be a currency symbol or any other unit. The maximum length is
12 characters.
9. Click OK.
Selecting Format > None from the Format drop-down menu, resets the options to the default
settings.
4.8.3.5
Date and Time Format
You can specify how you want DecisionSite to display date and time formatting for time stamp
columns. You can set the date and time to be shown either according to regional settings, with
or without milliseconds, or according to a number of other date and time formats.
By changing the date format for a date or time stamp column, you can obtain a whole new set
of factors to filter your data by. See Rearranging the Data by Formatting for more information.
► To set Date and Time Formatting for a column:
1.
2.
3.
Open the Properties dialog by selecting Edit > Properties and click on the Columns
tab.
Select one or more columns you wish to set time formatting for.
Click on the Format button.
101
TIBCO Spotfire DecisionSite 9.1.1 for Lead Discovery - User's Manual
4.
Select Date and Time... which opens the Date and Time Format dialog.
5.
Click on a format type.
Response: An example of what the selected date and time format would look like is
shown in the Sample field.
6. When you are satisfied with the selected format, click OK.
Selecting Format > None from the Format drop-down menu, resets the format to the default
setting.
Tip: If you want to change the date and time formatting for a single column you can also reach
the Date and Time Format dialog from the pop-up menu of the Query Devices panel. Rightclick on the column of interest and select Set Property > Format > Date and Time... from the
pop-up menu.
4.8.3.6
Date Format
You can specify how you want DecisionSite to display date formatting for time stamp columns.
You can set the date to be shown either according to regional settings or according to a number
of other date formats.
By changing the date format for a date or time stamp column, you can obtain a whole new set
of factors to filter your data by. See Rearranging the Data by Formatting for more information.
► To set Date Formatting for a column:
1.
2.
3.
102
Open the Properties dialog by selecting Edit > Properties and click on the Columns
tab.
Select one or more columns you wish to set date formatting for.
Click on the Format button.
Visualizations
4.
Select Date... which opens the Date Format dialog.
5.
Click on a format type.
Response: An example of what the selected date format would look like is shown in
the Sample field.
6. When you are satisfied with the selected format, click OK.
Selecting Format > None from the Format drop-down menu, resets the format to the default
setting.
Tip: If you want to change the date formatting for a single column you can also reach the Date
Format dialog from the pop-up menu of the Query Devices panel. Right-click on the column of
interest and select Set Property > Format > Date... from the pop-up menu.
4.8.3.7
Time Format
You can specify how you want DecisionSite to display time formatting for time and time stamp
columns. You can set the time to be shown either according to regional settings, with or without
milliseconds, or according to a number of other time formats.
By changing the time format for a time column, you can change the number of unique values in
your data set. See Rearranging the Data by Formatting for more information.
► To set Time Formatting for a column:
1.
2.
3.
Open the Properties dialog by selecting Edit > Properties and click on the Columns
tab.
Select one or more columns you wish to set time formatting for.
Click on the Format button.
103
TIBCO Spotfire DecisionSite 9.1.1 for Lead Discovery - User's Manual
4.
Select Time... which opens the Time Format dialog.
5.
Click on a format type.
Response: An example of what the selected time format would look like is shown in
the Sample field.
6. When you are satisfied with the selected format, click OK.
Selecting Format > None from the Format drop-down menu, resets the format to the default
setting.
Tip: If you want to change the time formatting for a single column you can also reach the Time
Format dialog from the pop-up menu of the Query Devices panel. Right-click on the column of
interest and select Set Property > Format > Time... from the pop-up menu.
4.8.4
4.8.4.1
Trellis Tab
What is a Trellis plot?
Trellis plots enable you to quickly recognize similarities or differences between different
subsets. Trellis plots provide the means to create a systematic layout for scatter plots, bar charts,
profile charts and heat maps. Each individual pane in a Trellis plot displays a subset of the
original data set, where the subset is defined by certain conditions. By this we mean that all the
records in a particular subset have the same value for one or more attributes. A condition
specifies one attribute.
104
Visualizations
A Trellis plot is a way of breaking up a visualization (scatter plot, profile chart or heat map)
into several panels, each one displaying a particular sub set of the data. The example above
displays a Trellis plot with two conditions: Sex and Dead/Alive.
► To create a Trellis plot:
1.
2.
3.
4.
5.
6.
4.8.4.2
Create a new scatter plot, profile chart or heat map.
Open the Properties dialog.
Go to the Trellis tab.
In the Conditions box, click Add...
In the Trellis condition dialog, select the variable (column name) by which you want
to separate the plots.
Click OK.
Trellis Tab
Edit > Properties > Trellis tab
105
TIBCO Spotfire DecisionSite 9.1.1 for Lead Discovery - User's Manual
4.8.4.3
Option
Description
Conditions
A condition specifies a variable by which the data is divided into
subsets. Each value of the conditioning variable will yield a separate
subset. Adding a second condition will split each subset, etc.
Layout
You can control the layout of the plots in terms of rows, columns
and pages. There are two ways of doing this:
Automatically, by binding a dimension to each conditioning
variable.
Manually, by specifying the exact dimensions of the Trellis plot.
You can also select whether or not to show empty trellis panels by
clearing or selecting the Drop empty panels check box.
Headings
Specifies whether or not to show headings.
You can also change the colors used in the headings.
Trellis Conditions
Edit > Properties > Trellis tab
A condition specifies a variable by which the data is divided into subsets. Each value of the
conditioning variable will yield a separate subset. Adding a second condition will split each
subset, etc.
If, for example, two Boolean variables are used as conditioning variables, this will result in four
separate plots representing the combinations True-True, True-False, False-True and False-
106
Visualizations
False. If a Boolean variable is used in conjunction with a variable that has five different values,
this will yield ten plots. From this follows that variables with a continuous distribution and a
wide range of values (e.g. Real values) should be binned before forming a Trellis plot.
Otherwise the number of plots quickly becomes unmanageable.
► To add a condition:
1.
2.
3.
4.
In the Properties dialog, under the Trellis tab, click Add...
In the Trellis condition dialog, select a variable and a dimension to bind it to.
Optionally, use the radio buttons in the Heading box to control what information to
show in the heading for this variable.
Click OK.
Empty values
Selecting the Show empty values option will generate an extra trellis panel containing records
for which the conditioning variable is undefined.
► To remove a condition:
1.
2.
Select a condition from the list on the Trellis tab.
Click Remove.
► To modify an existing condition:
1.
2.
3.
4.
Select a condition from the list.
Click Edit...
In the Trellis condition dialog, make the desired changes.
Click OK.
► To change the order of conditions:
1. Select a condition from the list.
2. Click Move up or Move down.
Tip: The settings in the Trellis condition dialog can also be reached and changed by rightclicking on any trellis panel heading.
107
TIBCO Spotfire DecisionSite 9.1.1 for Lead Discovery - User's Manual
4.8.4.4
Trellis Layout
Edit > Properties > Trellis tab
You can control the layout of the plots in terms of rows, columns and pages. There are two
ways of doing this:
• Automatically, by binding a dimension to each conditioning variable.
• Manually, by specifying the exact dimensions of the Trellis plot.
Example of three conditioning variables bound to rows, columns and pages.
► To arrange the plots automatically:
1.
In the Properties dialog, under the Trellis tab, make sure the check box labeled Bind
dimensions to conditioning variables is selected.
2. Click Add....
3. In the Trellis Condition dialog, select a variable and a dimension to bind it to.
Comment: If Bind to: Columns is selected, all trellis panels will be displayed side by
side with the title at the top. If Bind to: Rows is selected, the trellis panels will be
under each other with the title on the right hand side of all rows. If Bind to: Pages is
selected, each trellis panel will be displayed on a separate page and you will have to
scroll down to see all panels.
4. Repeat steps 2 and 3 for any additional conditions.
Tip: Experiment with different layouts while still in the Trellis Condition dialog. The
visualization is updated dynamically, so you can immediately see the results of your current
settings.
► To set layout manually:
1.
2.
4.8.4.5
In the Properties dialog, under the Trellis tab, make sure the check box labeled Bind
dimensions to conditioning variables is cleared.
Enter the number of trellis panels that you want to show next to each other
simultaneously, both horizontally (columns) and vertically (rows). The number of
pages is automatically updated to make sure there is room for the specified panels –
you can never change the number of pages directly.
Trellis Headings
Edit > Properties > Trellis tab
108
Visualizations
Show Headings
You can select whether or not to show trellis panel headings from the Trellis tab of the
Properties dialog. Select the check box to show all headings. Clear the check box to hide all
headings. You can also right-click on any trellis panel header and select Heading > Hide All
Headers from the pop-up menu.
Heading Color
The colors used in the headings of columns, rows and pages can be set manually from the
Trellis tab of the Properties dialog.
Text is the color of the text in all headings.
Background is the background color of all headings.
Indicator is the color of the bar that indicates the relative size and position of the range of
values.
Note: The indicator bar represents the size of the range of values represented by a column, row
or page, not the number of records with that value.
Heading Text
What to show in the heading text is specified from the Trellis condition dialog, reached by
clicking Add... or Edit... on the Trellis tab of the Properties dialog. You can specify which of
three options should be shown as the heading for the trellis panels.
• Show variable name
• Show variable value
• Show variable name and value
4.8.4.6
Empty Panels
It is possible to insert empty panels anywhere in the layout. This can be useful when manually
configuring a multi-page layout. Normally in such a layout, a page flows to the next as soon as
it is full. This may not always be appropriate.
Consider, for example, a situation with twenty-four panels arranged in a three-by-three layout.
This would yield two pages with nine panels on each, and a final page with only six panes. By
inserting an empty panel on each page, the result would be three pages with eight (non-empty)
panels on each.
► To insert an empty panel:
1.
2.
3.
In the Trellis tab of the Properties dialog, make sure Bind dimensions to
conditioning variables is cleared.
Right-click in the heading field of the panel were you want the empty panel to be
inserted.
Select Insert Empty Panel.
109
TIBCO Spotfire DecisionSite 9.1.1 for Lead Discovery - User's Manual
If an empty panel is inserted on the first page, it will appear at the same position on each
subsequent page. An empty panel inserted on the second page will appear on even pages, etc.
You may also be in the situation where some of the combinations of variables used for the
trellis panels result in panels without any records. These panels can easily be hidden.
► To hide empty panels:
1.
2.
Right-click in the heading field of any trellis panel.
Select Drop Empty Panels from the pop-up menu.
Comment: You can also select the Drop empty panels check box in the Layout field of
the Trellis tab in the Properties dialog.
4.8.5
Axes Tab
4.8.5.1
Axes Tab
Edit > Properties > Axes tab
Axis labels for Scatter Plots are controlled from the Axes tab of the Properties dialog. For
other plots see Axes.
110
Option
Description
Axis
Select the axis whose labels you want to edit. All other settings made in
the Axes dialog are specific to the axis you have currently selected here.
Visualizations
Range
The minimum and maximum values specify the range of the axis labels.
Default will set the range to encompass the entire data range.
Ticks
There are three options for tick mark control:
Automatic – this option will attempt to display a suitable number of
labels at even intervals. You can modify this somewhat by clicking the
Settings button, which opens the Ticks dialog.
Select the Spacing you want, and the number of Ticks to be displayed.
For spacing you can select to show axis labels in four ways:
Even Distribution – will attempt to distribute labels evenly between the
highest and lowest value
At Values – will not place a label where there is no value
At All Values – will place labels at all values
At Even Values – will attempt to place labels at evenly spaced whole
numbers.
Interval – this option lets you specify an exact interval for the labels,
which you enter in the Every field. You may also specify from which
value the labels should be drawn, in both directions. For example, if you
set Every: 10 and From: 1920, labels would appear in steps of -10 and
+10 originating from the value 1920.
Fixed – this option lets you specify the exact values for which you want
labels to appear. Simply type the values into the field separated by a
semicolon. Example: 1920;1922;1930;1955;1991
This can also be used to specify the number of decimals to be shown on
the axes.
Another feature of the Fixed option is that you may name a tick mark to
display a string instead of the value, like this: 0.0;3.14=Pi;5.0;10.0 which
would display the text "Pi" as a label instead of 3.14.
Labels
The Show labels check box sets whether or not to display labels for the
current axis.
The Horizontal or Vertical radio buttons sets whether the labels for the
current axis should be displayed horizontally or vertically.
Grid
The Show grid lines check box sets whether or not to display grid lines
for the current axis.
4.8.6
3D Tab
4.8.6.1
3D Tab
Edit > Properties > 3D tab
111
TIBCO Spotfire DecisionSite 9.1.1 for Lead Discovery - User's Manual
4.8.6.2
Option
Description
Dimensions
You can chose whether to display a 2D Scatter Plot or a 3D Scatter Plot
by selecting the appropriate radio button.
A 3D visualization can be 'flattened' into a 2D scatter plot or,
conversely, a 2D plot can be made into one with 3D attributes. In the
latter case Spotfire DecisionSite will suggest a third axis using the same
algorithm as with 2D scatter plots.
Rendering
With the Lighting check box cleared, the glyphs will be flat, as if
illuminated evenly from all sides, a sphere will appear as a filled circle
and a cube from certain angles will look like a hexagon and from other
angles like a square.
The Smooth Shading alternative will smooth edges of adjacent
polygons on the surface of the glyphs; mostly useful when the filled
sphere is used, this makes the sphere appear rounder.
Perspective
The perspective slider modifies the 'field of view' of the 3D
visualization. Using the mouse, drag the slider towards the right for a
'wide angle' perspective.
Navigation
This section provides various helpful settings for quicker navigation of
the 3D scatter plot.
3D – Perspective
Edit > Properties > 3D tab
112
Visualizations
The perspective slider modifies the 'field of view' of the 3D visualization. Using the mouse,
drag the slider towards the right for a 'wide angle' perspective. With the slider in the left-most
position the view becomes orthogonal, a projection where the size of the markers is retained no
matter the distance. The keyboard arrow keys allow fine-tuning of the perspective when the
slider has been activated.
Orthogonal view (left) and exaggerated perspective (right).
Note: When viewing 3D plots the perspective view will make markers that are 'closer' to the
viewer look bigger and so care must be taken if you also want size to reflect some attribute.
Orthogonal projection where markers retain size irrespective of distance may be preferable.
4.8.6.3
3D – Navigation
Edit > Properties > 3D tab
Option
Description
Show bounding box
This draws a dotted cube around the edges of the visualization
volume, which often aids in locating a marker in the 3D space.
Show axes
This draws the arrows representing the X, Y and Z axes.
Quick navigation if
more than...visible
records
This lets you speed up rotation, zooming, etc by drawing markers as
dots while navigating. Markers are restored to their normal shapes as
soon as you stop navigating. Use this feature if the lag times become
too great during 3D navigation.
Reset Navigation
This button resets the orientation of the visualization—X (horizontal),
Y (vertical), and Z (depth)—but does not affect zooming or
perspective.
113
TIBCO Spotfire DecisionSite 9.1.1 for Lead Discovery - User's Manual
Note: The Reset button in the toolbar will reset not only navigation,
but also all query devices.
4.8.7
Markers Tab of the Scatter Plot
4.8.7.1
Markers Tab of the Scatter Plot
4.8.7.2
Markers Tab of the Scatter Plot
Edit > Properties > Markers tab
114
Option
Description
Color
Markers can be colored to reflect the value of a particular attribute.
There are three modes for coloring: Fixed, Continuous and
Categorical.
Shape
The shape of markers can be fixed, or made to reflect the value of a
particular column. Click Fixed or Per value to alternate between
these modes.
Labels
It is possible to tag each marker with a label, showing the value of a
particular column. You can select to show both Dynamic labels
(Highlight and/or Active) and Static labels (None/Marked/Visible) at
the same time. Dynamic labels are always placed on top of any static
labels. The static labels include the following options:
Visualizations
None – No labels are visible.
Marked – Only records that are marked will have labels next to them.
Visible, max – All visible records (up to a specified maximum
number) will have labels next to them, provided that the number of
visible markers does not exceed the specified max number. If so, no
labels are shown.
Select the column you wish to label by, from the drop-down list By:.
Click on Customize to open the Customize Labels dialog, where you
can change the color and line width of the label frames and lines, as
well as the size available to labels.
You can drag labels to any position within the visualization area.
Click on Reset to return all marker labels to their original position.
If you are running DecisionSite for Lead Discovery, you can also
select to display the chemical structure for each record in the label.
This is done by right-clicking in the scatter plot and selecting
Structure Marker Labels from the pop-up menu.
Select Structure Marker Labels > Remove to revert to the column
selected here.
4.8.7.3
Size
The size of markers can be made to reflect the value of a particular
column. Select a column from the drop-down list under Size. Moving
the slider changes the size of all markers, while maintaining the size
ratio of different markers.
Drawing order
It is possible to specify the order in which the markers of a scatter plot
will be drawn. This is done by specifying a column that will determine
the drawing order.
Note: By setting both Size by and Drawing order by to the same
column, the smaller markers will be drawn on top of the larger ones.
Jitter
Jittering displaces markers slightly and randomly, thereby making
aggregations stand out visually. Attention is brought to areas where
many records overlap.
Rotate
The rotation of markers can be made to reflect the value of a column.
Using asymmetrical markers and rotating them according to a chosen
variable takes advantage of the human ability to visually detect
regions with different surface structure.
Line connection
Line connection means that a line is drawn between records that share
some property. To follow a progression, markers can also be
connected in ascending order according to some other property. The
order of lines can be made clearer by use of arrows indicating
direction (pointing from lower to higher value in the Order column).
Color
Edit > Properties > Markers tab
115
TIBCO Spotfire DecisionSite 9.1.1 for Lead Discovery - User's Manual
Markers can be colored to reflect the value of a particular attribute. There are three modes for
coloring: Fixed, Continuous and Categorical. The mode is set in the Properties dialog.
Option
Description
Fixed
Fixed coloring means that all markers are the same color (except
deselected and marked).
Continuous
Continuous coloring means that the maximum and minimum specified
values in the selected column are each assigned a color. Intermediate
values are then assigned colors on a scale ranging between the two
extreme colors. In scatter plots, any column can be used for
continuous coloring. Any values not included in the range are given a
specific color.
Colors, representing minimum and maximum values are set with the
Customize dialog. Begin and End categories define the color limits.
When one of the categories is selected, you can choose which color
will represent that end of the value range. A line with the color scale is
displayed below the corresponding query device.
4.8.7.4
Categorical
Categorical coloring means that each value in the chosen column is
given its own color. However, categorical coloring makes most sense
if there are less than ten unique values. To control which color is
assigned to each value, click Customize.
Customize Colors
Regardless of coloring mode, the choice of colors can be controlled by
clicking Customize on the Markers tab of the Properties dialog.
Depending on the current coloring mode, the top-most list will display
the fixed color, Begin and End colors (continuous mode), or the color
associated to each category (categorical mode). The other list displays
colors associated with deselected, empty and marked records.
("Empty" refers to records for which no value is specified in the
column used for coloring.)
Overlapping Color Ranges
It is possible to specify overlapping color ranges. This means that the value of a marker can be
inside several ranges, but the marker will always only have one color. DecisionSite uses the
following method to determine which color range will be used to set the color of the marker:
If the value of a marker is included in several ranges, the gradient with the highest start value is
selected. However, if multiple gradients exist with the same low start value, the gradient with
the lowest end value is selected.
Also note that categorical values are more important than continuous ones. In other words, if
you have a value that you have set to a specific categorical color, this color will be used even if
the value is also defined within a color range.
116
Visualizations
Example:
If you have set the Ranges as above:
• Value 1 is colored according to the first range.
• Value 20 is colored according to the third range.
• Value 30 is colored according to the last range.
When the dialog is opened the color gradients are sorted such that the highest priority is at the
bottom, next highest just above that, and so on. If new gradients are added, the order is
changed, but you can restore the order by right-clicking and selecting Sort gradients, which
will cause the list to reflect the drawing order.
4.8.7.5
Shape and Rotation
Edit > Properties > Markers tab
117
TIBCO Spotfire DecisionSite 9.1.1 for Lead Discovery - User's Manual
The shape of markers can be fixed, or made to reflect the value of a particular column. Click
Fixed or By to alternate between these modes. Only columns with less than 23 distinct values
can be used for controlling shapes. Click Customize to choose appropriate shapes for each
value.
There are twelve shapes available for 3D markers:
Solid Cube
Wire Cube
Arrow (Pyramid)
Minus
Solid Sphere
Wire Sphere
Diamond
Bar
Solid Tetrahedron
Wire Tetrahedron
Cross
Point
These shapes consist of polygonal surfaces or lines. They all show shading and other '3D'
characteristics. Some shapes are particularly useful in conjunction with rotation.
It is possible to customize the shape and size of the markers in a scatter plot.
► To customize markers:
118
1.
2.
3.
4.
Open a scatter plot.
Select Edit > Properties.
Select the Markers tab.
Select a column to determine the shape of the markers.
5.
Click on Customize.
Visualizations
6.
7.
8.
Select a value ("no", "yes" or "Empty" in the example above).
Select a shape for that value.
Select the Specify size check box.
When this option is selected, the custom size overrides the usual size slider in the
properties Marker tab.
9. Enter Width and Height.
These values are relative to the scale used in the current visualization. Look at the
scale used in the current visualization and determine how large you wish your markers
to be.
Note: The horizontal and vertical scale may be different, which means that a perfect square
might not have the same Width and Height values.
Note: Use Reverse sorting if you want the markers to be drawn in the opposite order. Rightclick in the Query Device you wish to sort by, select Set Property and Reverse sorting.
Rotation
The rotation of markers can be made to reflect the value of a column. Using asymmetrical
markers and rotating them according to a chosen variable takes advantage of the human ability
to visually detect regions with different surface structure. The maximum rotation is 90 and so
the most useful shapes for this effect are the arrow, the minus, and the bar.
In 3D plots, the marker rotation is implemented around the Z-axis.
4.8.7.6
Jitter
Edit > Properties > Markers tab
Jittering displaces markers slightly and randomly, thereby making aggregations stand out
visually (below, right). Attention is brought to areas where many records overlap. Such regions
can then be investigated further, by zooming, changing axes, etc. Use the slider to increase or
decrease jittering.
Scatter plots, line charts, profile charts and pie charts support jittering.
119
TIBCO Spotfire DecisionSite 9.1.1 for Lead Discovery - User's Manual
4.8.7.7
Line Connection
Edit > Properties > Markers tab
Line connection means that a line is drawn between records that share some property. To follow
a progression, markers can also be connected in ascending order according to some other
property. The order of lines can be made clearer by use of arrows indicating direction (pointing
from lower to higher value in the Order column). To demonstrate the usefulness of line
connection, in the example data above, the locations of two salespersons, indicated by red and
blue, are plotted. The two salespersons visit various locations at different points in time.
Without the lines and arrows indicating direction, we would be unable to see in which order the
blue salesperson visited the different locations.
Setting the By: selection to (None) causes the Line connections to disregard which individual
salesperson went to what location, and will instead plot a timeline showing which locations
were visited by any salesperson in order of the date the locations were visited:
120
Visualizations
4.8.7.8
4.8.7.8.1
User Interface
Fixed Coloring Dialog
Option
Description
Fixed
Shows the color of the markers in the data set.
Marked
Shows the color of the records that have been marked.
Empty
Shows the color of the empty records. Empty refers to records that have at
least one empty field. These records are not shown at all in visualizations
where an axis corresponds to the missing field.
Undefined
Shows the color of values that are not included in a range (continuous).
Deselected
Shows the color of the deselected values. Deselected refers to records that
do not fulfill the constraints of the query devices.
121
TIBCO Spotfire DecisionSite 9.1.1 for Lead Discovery - User's Manual
4.8.7.8.2
122
Continuous Coloring Dialog
Option
Description
Ranges
Displays the values in the chosen column, and the color for each value.
Note: When the dialog is opened the color gradients are sorted such that
the highest priority is at the bottom, next highest just above that, and so
on. If new gradients are added, the order is changed, but you can restore
the order by right-clicking and selecting Sort gradients.
Add
Adds a new item to the list of Color ranges. Using this, you can assign
specific colors to values, and create your own coloring arrangement.
Delete
Removes a selected value. Ctrl+click to select multiple items for
deletion.
Marked
Shows the color of the records that have been marked.
Empty
Shows the color of the empty records. Empty refers to records that have
at least one empty field. These records are not shown at all in
visualizations where an axis corresponds to the missing field.
Visualizations
Other
Shows the color of values that are not included in a range (continuous).
Deselected
Shows the color of the deselected values. Deselected refers to records
that do not fulfill the constraints of the query devices.
Templates >
> Two color
gradient for all
records
Applies a two-color color arrangement to your data, one color as your
minimum value, and one as your maximum value.
> Three color
gradient for all
records
Applies a three-color color arrangement to your data, one color as your
minimum value, one as your maximum value, and the third color as a
central value.
> Two color
gradient for
visible records
Applies a two-color color arrangement to your visible data.
> Three color
gradient for
visible records
Applies a three-color color arrangement to your visible data.
> Two color
gradient
highlighting
outliers
Applies a two-color color arrangement to your data, but outliers are
highlighted in another color, rather than being included in the continuous
coloration.
Applies a two-color arrangement to your data in which all values before
> Two color
gradient resisting median-2*stddev are colored the first color (red), and all values after
median+2*stddev are colored the final color (blue). Outliers are colored
outliers
either red or blue. Values close to the median are easily distinguished.
Import...
Imports a color arrangement from a file.
Export...
Exports a color arrangement to a file. This enables you to save a color
arrangement and reuse it.
Advanced
Switches you to the Advanced Coloring dialog where you can have more
control over the way you color your values and ranges.
► To change a color in Continuous mode:
1.
2.
Click on the square of the color that you want to modify.
Select a color from the palette or click More colors... to see the complete color palette.
► To change the Marked, Empty or Deselected color:
1.
2.
Click the button of the color that you want to modify.
Select a color from the palette or click More colors... to see the complete color palette.
► To switch between the Compact and Extended color views:
Right-click in the Continuous Coloring dialog and select either Compact color view or
Extended color view.
Compact color view is useful when you are creating a connected gradient, i.e., when there are
overlaps or holes. If, for example, you have a connected gradient through the points min>median->max, and you wish to change median to average, you only need to change one item
in the Compact color view, whereas you would have to change two items (min->median and
median->max) in the Extended color view.
123
TIBCO Spotfire DecisionSite 9.1.1 for Lead Discovery - User's Manual
Compact
4.8.7.8.3
124
Extended
Categorical Coloring Dialog
Option
Description
Values
Displays the values in the chosen column, and the color for each value.
Note: When the dialog is opened the values are sorted. If new values are
added, the order is changed, but you can restore the order by right-clicking
and selecting Sort gradients.
Visualizations
Add
Adds a new item to the list of Color values. Using this, you can assign
specific colors to values, and create your own coloring arrangement.
Delete
Removes a selected value. Ctrl+click to select multiple items for deletion.
Marked
Shows the color of the records that have been marked.
Empty
Shows the color of the empty records. Empty refers to records that have at
least one empty field. These records are not shown at all in visualizations
where an axis corresponds to the missing field.
Other
Shows the color of values that are not specified in the Values list.
Deselected
Shows the color of the deselected values. Deselected refers to records that
do not fulfill the constraints of the query devices.
Import...
Imports a color arrangement from a file.
Export...
Exports a color arrangement to a file. This enables you to save a color
arrangement and reuse it.
Advanced
Switches you to the Advanced Coloring dialog where you can have more
control over the way you color your values and ranges.
► To change a color in Categorical mode:
1.
2.
Click on the square of color that you want to modify.
Select a color from the palette or click More colors... to see the complete color palette.
► To change the Marked, Empty, Other or Deselected color:
1.
2.
Click the button of the color that you want to modify.
Select a color from the palette or click More colors... to see the complete color palette.
125
TIBCO Spotfire DecisionSite 9.1.1 for Lead Discovery - User's Manual
4.8.7.8.4
126
Advanced Coloring Dialog
Option
Description
Name
Displays the name of the coloring arrangement. Type to enter a new
name.
Preview Column
Lists the columns from which you can add values to the Values list.
Values
Displays the values in the chosen column (Preview Column), and the
color for each value. If a value has a defined categorical color, this color
will be used even if the value is also defined within a color range.
Add
Adds a new item to the list of Values. Using this, you can assign specific
colors to values, and create your own coloring arrangement.
Add All
Adds all available values from the selected Color by column to the
Values list.
Visualizations
Delete
Removes a selected value. Ctrl+click to select multiple items for
deletion.
Delete All
Deletes all items in the Values list.
Ranges
Shows the color of the empty records. Empty refers to records that have
at least one empty field. These records are not shown at all in
visualizations where an axis corresponds to the missing field.
Add
Adds a new item to the list of Ranges. Using this, you can assign specific
colors to values, and create your own coloring arrangement.
Delete
Removes a selected value. Ctrl+click to select multiple items for
deletion.
Delete All
Deletes all items in the Ranges list.
Other Color >
Determines which color is used for markers that do not get a color from
any other setting. The color a marker gets is decided in the following
order:
Markers associated with a data row with empty/null value in the color
column are set to the empty color
Markers filtered out by query devices or zoom sliders are set to the
deselected color.
Marked items are drawn using the marked color.
Markers that are included in the value list are set to the color specified
there. The value list may include values that are not part of the current
data set, but you know those values could be included in a future data
set, thus it is possible to set up color arrangements that have predefined
colors for all anticipated values.
Markers that are included in a color range (from the Ranges list) are set
to a color from that range. Note: Because it is possible to specify
overlapping ranges, a marker can be inside several ranges. See
Overlapping Color Ranges for more information.
Any other markers are set to either a fixed color, or a color from a
palette, depending on your selections. A palette is a list of colors. If there
are more unique values in the color column than there are colors in the
palette, colors will be reused.
> From palette
Causes each marker to get an individual color from the color palette list.
Note: If there are more than 97 values, colors will be reused.
> Edit
Launches the Edit Palette dialog where you can adjust the RGB values of
individual colors.
> Fixed
Lets you choose the color that the markers will get.
Deselected
Shows the color of the deselected values. Deselected refers to records
that do not fulfill the constraints of the query devices.
Marked
Shows the color of the records that have been marked.
Empty
Shows the color of the empty records. Empty refers to records that have
at least one empty field. These records are not shown at all in
visualizations where an axis corresponds to the missing field.
Templates >
> Two color
gradient for all
Applies a two-color color arrangement to your data, one color as your
127
TIBCO Spotfire DecisionSite 9.1.1 for Lead Discovery - User's Manual
records
minimum value, and one as your maximum value.
> Three color
gradient for all
records
Applies a three-color color arrangement to your data, one color as your
minimum value, one as your maximum value, and the third color as a
central value.
> Two color
gradient for
visible records
Applies a two-color color arrangement to your visible data.
> Three color
gradient for
visible records
Applies a three-color color arrangement to your visible data.
> Two color
gradient
highlighting
outliers
Applies a two-color color arrangement to your data, but outliers are
highlighted in another color, rather than being included in the continuous
coloration.
> Two color
gradient resisting
outliers
Applies a two-color arrangement to your data in which all values before
median-2*stddev are colored the first color (red), and all values after
median+2*stddev are colored the final color (blue). Outliers are colored
either red or blue. Values close to the median are easily distinguished.
Import...
Imports a color arrangement from a file.
Export...
Exports a color arrangement to a file. This enables you to save a color
arrangement and reuse it.
Basic
Returns you to the basic Categorical or Continuous or Heat Map
Coloring dialog.
► To change a color of the Values or Ranges:
1.
2.
Click on the square of color that you want to modify.
Select a color from the palette or click More colors... to see the complete color palette.
► To change the Marked, Empty or Deselected color:
1.
2.
128
Click the button of the color that you want to modify.
Select a color from the palette or click More colors... to see the complete color palette.
Visualizations
4.8.7.8.5
Color Expression Dialog
Option
Description
Variables
Lists the available variables which can be used to create your expression.
Insert a variable into your expression with the Insert Variable button.
Function
category
Select a category of functions to limit the choices in the Functions list:
All
Operators
Math Functions
Statistical Functions
Text Functions
Logical Functions
Date & Time Functions
Conversion Functions
Function
Select a function by clicking on it, and click the Insert Function button to
insert it to the Expression field. You can also double-click on a function to
insert it.
If you place the cursor at a specific location in the Expression field, the
function will be inserted there.
129
TIBCO Spotfire DecisionSite 9.1.1 for Lead Discovery - User's Manual
130
Description
Provides a brief description of the selected function. For more detailed
descriptions, please see Spotfire Expression Language (SXL).
Expression
This is the text field in which you build your expression. You can insert
variables and functions to it from the lists, or enter text as in any standard
text editor.
Cut/Copy/Paste works in the field using standard Ctrl+X / Ctrl+C /
Ctrl+V.
Highlighting a section of the expression, and clicking Insert Function will
add the selected function to the expression with the highlighted section as
an argument.
Also, Undo/Redo functionality is available by pressing Ctrl+Z.
Note: Very long expressions will be displayed truncated in the
Visualization Legend. To avoid this, insert a blank space with suitable
distance. This will not affect the expression, but will allow the Legend to
display it over several rows.
Target type
Displays the data type of the result.
Result
This field displays the result of applying the current expression to the first
row of the data set.
If this field shows an error message, there is a problem with the expression.
Clicking on the field will display an explanation of what is wrong. Pressing
F5 will also display the error description. Pressing F4 will move the cursor
to the position in the expression where the error lies.
There are three kinds of error messages:
#EXPR! – there is a problem with the syntax of the expression.
#NUM! – the row evaluates to infinity or other illegal number.
#ARG! – there is a problem with one or many arguments.
Recent
expressions
This list contains the twenty most recent expressions you have created.
Insert
Inserts the selected recent expression to the cursor position of the
expression field.
Visualizations
4.8.7.8.6
Customize Labels Dialog
Option
Description
Maximum label size Allows you to change the maximum label size that you wish to allow.
4.8.8
4.8.8.1
Background
Allows you to change the color of the background on the label. You
can also adjust the transparency of the background using the slider.
Border
Allows you to change the color of the frame surrounding the label as
well as the line leading to the border. The transparency of the border
can also be adjusted.
Use marker color
Select this check box to use the same color on the label frame and line
as is used on each item.
Note: In bar charts, only the segment labels will be affected by this
setting, not the bar labels.
Frame width
Adjusts the thickness of the surrounding frame.
Line width
Adjusts the thickness of the line leading from the marker to the label.
Text
Allows you to change the color of the label text.
Details Columns Tab
Details Columns Tab
Edit > Properties > Details Columns tab
131
TIBCO Spotfire DecisionSite 9.1.1 for Lead Discovery - User's Manual
Option
Description
Available columns These columns are not included in the bar chart.
Note: You can right-click on the Name header to get a pop-up menu
where you can select other attributes you would like to be visible.
132
Columns in
Details-onDemand
These columns are displayed as information in the Details-on-Demand
window.
Note: The Details-on-Demand table cannot display more than a few
hundred columns (depending on the width the columns). This means that
in a very wide data set you might not be able to view all columns in the
Details-on-Demand simultaneously.
Add >>
Select a column from the left list and press the Add >> button to move it
to the right list, and include it in the details-on-demand.
<< Remove
Select a column from the right list and press the <<Remove button to
move it back to the available columns list, and remove it from the detailson-demand.
Remove All
Removes all columns from the right list, and moves them to the available
columns list.
Move First
Select a column from the right list and press the Move First button to
move it to the top. This changes the order the columns are displayed in
the details-on-demand.
Move Up
Select a column from the right list and press the Move Up button to
move it a step up. This changes the order the columns are displayed in the
details-on-demand.
Visualizations
Move Down
Select a column from the right list and press the Move Down button to
move it a step down. This changes the order the columns are displayed in
the details-on-demand.
Move Last
Select a column from the right list and press the Move Last button to
move it to the bottom. This changes the order the columns are displayed
in the details-on-demand.
4.8.9
Bars Tab
4.8.9.1
Bars Tab
Edit > Properties > Bars tab
Option
Description
Color
If fixed coloring is used, one color is assigned to the entire bar or, if you
are using multiple columns, to the part of a bar that originates in a single
column. When using categorical coloring for bar charts, the bars are
divided into sections according to the column selected in the drop down
menu. Categorical coloring is not available for multiple columns display.
Labels
You can select to display labels for the bars in the bar chart, to see the
exact values they represent.
None – No labels are displayed.
Marked – Only the bars that are marked will display labels.
Visible, max – All visible bars will have labels next to them, provided
133
TIBCO Spotfire DecisionSite 9.1.1 for Lead Discovery - User's Manual
that the number of visible bars does not exceed the specified max
number. If so, no labels are shown.
Click on Customize to open the Customize Labels dialog, where you can
change the color and line width of the label frames and lines, as well as
the size available to labels.
Select the Bar labels check box to display labels above the bars. Select
the Segment labels check box to display labels on bar segments.
You can also specify whether you want Horizontal or Vertical labels.
4.8.9.2
Width
Drag the slider to modify the width of the bars.
If you select the Show outline on bars check box, black outlines will be
drawn around the bars.
Layout
When categorical coloring is applied, you can choose between four
different ways of displaying the bars. Stacked bars will place all
columns in a category on top of each other, in effect summarizing them.
Side-by-side bars will place the bars beside each other for comparison.
The 100%-options are used if you want to compare the proportions of
different categories for, e.g., different time periods. With 100% stacked
bars, all bars will be of equal height (100%), unless some negative
values exist in the data. 100% side-by-side bars displays bars side by
side, but proportionally so that each group sums up to 100% (if the Sum
measure is selected). See Bar Chart Layout Details for more information.
Selecting the Drop empty bars check box, will hide all bars containing
no records from the visualization, letting the visible bars use the space
along the horizontal axis. Filtering with the query devices will cause bars
to appear/disappear dynamically if this option is selected.
X-axis
Use the drop-down list to change the column to use on the X-axis.
If the X-axis in your bar chart represents a numeric value, you can select
to bin (group) the records from several bars into larger "binned" bars.
Rather than showing a separate bar for say, 1987, 1988, 1989, etc., you
can show a single bar for 1980-1989, another bar for 1990-1999, etc.
Do this by first selecting the Use binned values check box. This setting
can also be reached from the right-click menu of the axis selector. Then
you can either can choose your own number of bins by typing the number
into the Manual field, or, select Automatic and adjust the slider to
display a suitable number of bars.
Moving the slider sets a maximum number of bins (1-1000), and the bar
chart displays a number of bars as close to this as possible depending on
the range of the data.
Note: Automatic binning of the bar charts uses a form of even interval
binning, which is optimized for interactivity and has heuristics to
automatically adjust to fit logical tick marks on the X-axis.
Click on Create Binned Column to add a new column to the data set
containing the binned values. Create Binned Column can also be reached
from the right-click menu of the axis selector.
Bar Charts – Color
Edit > Properties > Bars tab
Fixed Coloring
If fixed coloring is selected, one color is assigned to all bars. If you are displaying Multiple
Columns, the bars of each column will by default be a different color.
134
Visualizations
► To Specify the Fixed Color for a Column:
1.
2.
3.
4.
5.
6.
Select Edit > Properties.
Select the Bars tab.
Select the radio button called Fixed.
Click on the Customize button.
Select a column from the list, and pick a color for it in the palette to the right.
Click OK.
Categorical Coloring
In single column mode you can use categorical coloring for the bars, which means that each bar
is divided into differently colored sections, representing another column of your data set. See
Bar Chart Layout Details for more information about different layout options.
► To Specify Categorical Coloring:
1.
2.
3.
4.
5.
Select Edit > Properties.
Select the Bars tab.
Select the radio button called Categorical.
Note: You cannot set Categorical coloring when using Multiple Columns.
Select the column you want to color the sections by.
Optionally, you can also click the Customize button to set the specific colors used.
Bar chart with categorical coloring, displaying the Average Value line.
Total Sum Line / Average Value Line
When using categorical coloring and there are negative segments in the bar, it can still be very
useful to see how high the bar would be if all the positive and negative segments were summed
up. This is indicated by a black line crossing each bar. If the bars are set to show the Sum of the
values the line indicates the Total Sum, and if the bars are set to show the average of the values
the line indicates the Average Value. Such a value can be both positive and negative.
Show deselected
If you select the Show deselected check box, a gray shadow will appear behind the regular
bars. This indicates how the bars would look if all the records in the data set are included.
Filtering with a query device or zooming in another plot deselects records in bars, causing the
bars to change, but you can always compare them to the background shadows which remain the
same.
135
TIBCO Spotfire DecisionSite 9.1.1 for Lead Discovery - User's Manual
You can change the color of the shadow by clicking on the Customize color button in the Bars
tab of the Properties dialog.
4.8.9.3
Bar Chart Layout Details
When categorical coloring is applied, you have the option to display the categories in four
different ways:
• Stacked bars
• Side-by-side bars
• 100% stacked bars
• 100% side-by-side bars
The categorical coloring layout is changed in the Properties dialog (Edit > Properties > Bars
tab). Different layout modes are more or less useful for different types of aggregations: Sum,
Average and Count. Below is a description of what you will see when you use the different
layout options and aggregations.
Count
With Count, the height of a bar represents the number of records with a particular value. All
layout options will display positive bars and show the contribution of each category to the total
of the group.
Example:
In a data set containing personal data, the different eye color categories contain a different
number of people (4,5,5). Also, by using the 100% stacked bar option, it is easy to see that
women are slightly over-represented in the blue eye color category.
136
Visualizations
Sum
With Sum, the height of the bar indicates the total sum of the values of all records in that bar.
The various categorical coloring layout options show the contribution of all categories to the
total sum.
Option
Height of each category
Stacked bars
Represents the sum of the values in that category.
Side-by-side bars
Represents the sum of the values in that category.
100% stacked
bars
Represents how many percent of the total sum for the group that is
constituted of the sum of the values in the category.
The exact percentage of each category can be seen in the details-ondemand window, when clicking on a bar category.
100% side-by-side Represents how many percent of the total sum for the group that is
constituted of the sum of the values in the category.
bars
The exact percentage of each category can be seen in the details-ondemand window, when clicking on a bar category.
Example:
If you want to compare the proportions of different categories for, e.g., different time periods,
you can use either of the 100% layout options in the Properties dialog. With 100% stacked bars,
all bars will be of equal height (100%), unless some negative values exist in the data.
137
TIBCO Spotfire DecisionSite 9.1.1 for Lead Discovery - User's Manual
In the example above, one can see that the Seattle revenue (yellow) has affected the total
revenue more during 2002 than in previous years, whereas the Dallas revenue (blue) has
decreased in importance.
Average
Note: The representation of the bars may be difficult to understand if your data contains both
positive and negative values. Use this type of representation with moderation for data with
mixed signs.
Click on a bar or a bar category and view the details-on-demand window for more information
about the various bars and categories.
Option Height of each category
Stacked
bars
Details-on-Demand information
Represents the average of the values The exact percentage of each category's
in that category divided by the
average compared to the total average of the
number of categories (Avgcat/n).
entire group ((Avgcat/Avggroup)*100).
Side-by- Represents the average of the values The average of category as well as the
average of the entire group.
side bars in that category (Avgcat).
138
Visualizations
100%
stacked
bars
Represents the average of the
category divided by the average of
the group and the number of
categories as a percentage
((Avgcat/Avggroup)*(100/n)).
Represents the average of the values
100%
side-by- in that category divided by the
side bars average of the group
((Avgcat/Avggroup)*100).
The exact percentage of each category's
average compared to the total average of the
entire group ((Avgcat/Avggroup)*100).
The exact percentage of the selected
category's average compared to the total
average of the entire
group ((Avgcat/Avggroup)*100).
Example:
When you are using Average to represent the height of the bars, the 100% side-by-side bars
option will display the percentage of the category average compared to the group average. That
means that if the average for the specific category is higher than the average for the whole
group, the bars will reach a height of more than 100%, see below.
139
TIBCO Spotfire DecisionSite 9.1.1 for Lead Discovery - User's Manual
4.8.10
4.8.10.1
Bar Chart Columns Tab
Bar Chart Columns Tab
Edit > Properties > Bar Chart Columns tab
140
Visualizations
Option
Description
Available columns These columns are not included in the bar chart.
Note: You can right-click on the Name header to get a pop-up menu
where you can select other attributes you would like to be visible.
Columns in bar
chart
These columns are included in the bar chart. The order of this list
corresponds to the order the columns are shown in the Bar Chart
visualization.
Add >>
Select a column from the left list and press the Add >> button to move it
to the right list, and include it in the bar chart.
<< Remove
Select a column from the right list and press the <<Remove button to
move it back to the available columns list, and remove it from the bar
chart.
Remove All
Removes all columns from the right list, and moves them to the available
columns list.
Move First
Select a column from the right list and press the Move First button to
move it to the top. This changes the order the bars are displayed.
Move Up
Select a column from the right list and press the Move Up button to
move it a step up. This changes the order the bars are displayed.
Move Down
Select a column from the right list and press the Move Down button to
move it a step down. This changes the order the bars are displayed.
Move Last
Select a column from the right list and press the Move Last button to
move it to the bottom. This changes the order the bars are displayed.
4.8.11
Pies Tab
4.8.11.1
Pies Tab
Edit > Properties > Pies tab
141
TIBCO Spotfire DecisionSite 9.1.1 for Lead Discovery - User's Manual
142
Option
Description
Color
A pie chart can consist of one or more bands, each reflecting the
distribution of values in a certain column. Set Number of color bands to
the desired number, then select one band at a time using Color band. Color
settings are set for each band individually.
Labels
Five different labels can be added to the pie charts:
Pie size shows the number of records associated with the pie, or average or
sum, depending on the settings under Size.
Pie sector value shows the value associated with each sector in the
outermost band.
Pie sector percentage shows the percentage of the pie that each sector
covers in the outermost band.
Pie records count shows the number of records in the pie.
Pie position shows the position of the pie. Requires the use of axes.
Size
The maximum size of the pies in the pie chart can be varied with the Size
slider. Under the Size slider there are four options of radio buttons with the
following functions:
Fixed size – pies are sized all the same.
By records count – pies are sized according to the number of records in
each pie.
By average – pies are sized according to the average value of the records in
the pie.
By sum – pies are sized according to the sum of the records in the pie.
Jitter
The Jitter function, at the bottom right of the Properties dialog, can be
used in the same way with pie charts as when working with scatter plots.
Visualizations
The overlapping pies will be randomly displaced so that hidden information
will be made visible. At least one axis has to be in use.
4.8.11.2
Pie Charts - Color
Edit > Properties > Pies tab
A pie chart can consist of one or more bands, each reflecting the distribution of values in a
certain column. Set Number of color bands to the desired number, then select one band at a
time using Color band. Color settings are set for each band individually. The image shows a
pie chart with multiple color bands.
For whole pies or bands, three coloring modes are available:
• Fixed – One color is assigned to the entire pie or band.
• Pies – The normal way of coloring: the band to be colored is divided into sections
whose size is determined according to the distribution of the selected column.
• Average – Assigns one color to each band or pie. The color is given according to the
average value of the records in the chosen column for that pie/band.
Use the Customize button to choose color.
143
TIBCO Spotfire DecisionSite 9.1.1 for Lead Discovery - User's Manual
► To change a color:
1.
2.
Select the category that you want to modify.
Select a color from the palette.
► To revert to default coloring, click Default Colors.
► To select a color from the complete palette, click Other....
Note: Empty refers to records that have at least one empty field. These records are not shown at
all in visualizations where an axis corresponds to the missing field.
Use Show deselected if all records in the data set should be included in the pies. The deselected
records are displayed as a separate sector. The color of this sector can be altered with the color
selector under Customize the color of the sector representing empty markers and the marking
color can be changed in the same way.
4.8.11.3
Pie Charts - Size
Edit > Properties > Pies tab
The maximum size of the pies in the pie chart can be varied with the Size slider. Under the Size
slider there are four options of radio buttons with the following functions:
• Fixed size – pies are sized all the same.
• By records count – pies are sized according to the number of records in each pie.
• By average – pies are sized according to the average value of the records in the pie.
• By sum – pies are sized according to the sum of the records in the pie.
When high negative values are used for sizing (By average or By sum), pies will appear large.
A red filled circle within the pie will indicate that the value used for sizing is negative. If the
sum or average is zero, this will yield invisible pies.
144
Visualizations
4.8.12
Lines Tab
4.8.12.1
Lines Tab
Edit > Properties > Lines tab
4.8.12.2
Option
Description
Appearance
Here you set the properties for each column, that is, each line. Select the
column you want to edit, and view the properties in the list boxes on the
right. Adjusting the controls will change the appearance of the selected
column.
Layout
When Scale Mode is set to Individual (see Markers property page) it is
possible to control the vertical position and amplitude of the plotted
curves. This makes it easy to compare the shapes of the curves. Position
and scale can be set either using sliders, or by entering numerical
values. You can at any time switch between the two modes by pressing
either of the two radio buttons labeled Relative or Numeric.
Line Charts – Appearance
Edit > Properties > Lines tab
145
TIBCO Spotfire DecisionSite 9.1.1 for Lead Discovery - User's Manual
On the Lines of the Properties dialog tab you set the properties for each column, i.e., each line.
Select the column you want to edit, and view the properties in the list boxes on the right.
Adjusting the controls will change the appearance of the selected column.
Color
The color used for this column. The column is used for lines and markers as well as for axis
labels in the Individual Scale mode.
Line type
Determines the type of the line used to connect points. Alternatives:
None – no line will be drawn
Straight line – points will be connected with a straight line
Step – points will be connected with a right angle. The first line is horizontal
Line width
Indicates the width of the line in pixels. The default setting is 1.
Thick lines take considerably longer time to draw. It is therefore a good idea to use a low value
for Line width when viewing large data sets.
Marker
Allows you to select a shape to use for markers. If Marker is set to None, no markers are
shown in the plot.
Please note that no markers will be drawn unless Show Markers is turned on in the Markers
tab.
4.8.12.3
Line Charts – Layout
Edit > Properties > Lines tab
When Scale Mode is set to Individual (see Markers property page) it is possible to control the
vertical position and amplitude of the plotted curves. This makes it easy to compare the shapes
of the curves. Position and scale can be set either using sliders, or by entering numerical values.
You can at any time switch between the two modes by pressing either of the two radio buttons
labeled Relative or Numeric.
Vertical Position (Relative)
Moves the selected curve up and down in the visualization window. This may be desirable
when you want to compare two curves by superimposing them on one another.
Vertical Scale (Relative)
Scales the selected curve. If you move the slider to Min the curve will appear almost flat. When
set to Max the curve amplitude will equal the window height of the visualization.
High (Numeric)
Sets the highest value of the visible range.
Low (Numeric)
Sets the lowest value of the visible range.
Cascade all
Sets the Scale and Position of all columns so that each of them will occupy a separate slot of the
window height.
Maximize all
Set the Scale and Position on every column so they utilize the whole height of the window.
146
Visualizations
4.8.13
4.8.13.1
Line Chart Columns Tab
Line Chart Columns Tab
Edit > Properties > Line Chart Columns tab
Option
Description
Available columns These columns are not included in the line chart.
Note: You can right-click on the Name header to get a pop-up menu
where you can select other attributes you would like to be visible.
Columns in line
chart
These columns are included in the line chart. The order of this list
corresponds to the order the columns are shown in the Line Chart
visualization.
Add >>
Select a column from the left list and press the Add >> button to move it
to the right list, and include it in the line chart.
<< Remove
Select a column from the right list and press the <<Remove button to
move it back to the available columns list, and remove it from the line
chart.
Remove All
Removes all columns from the right list, and moves them to the available
columns list.
Move First
Select a column from the right list and press the Move First button to
move it to the top. This changes the order the lines are displayed.
Move Up
Select a column from the right list and press the Move Up button to
147
TIBCO Spotfire DecisionSite 9.1.1 for Lead Discovery - User's Manual
move it a step up. This changes the order the lines are displayed.
4.8.14
4.8.14.1
Move Down
Select a column from the right list and press the Move Down button to
move it a step down. This changes the order the lines are displayed.
Move Last
Select a column from the right list and press the Move Last button to
move it to the bottom. This changes the order the lines are displayed.
Markers Tab of the Line chart
Markers Tab of the Line chart
Edit > Properties > Markers tab
148
Option
Description
Color
The colors used for drawing marked and deselected records are edited
here. Whether deselected records should be drawn or not is determined
with the Show Deselected check box.
Note: the color used to plot the records is the same as the connecting
line, and thus configured on a per column basis on the Lines tab.
Scale mode
The line chart works in two modes: one in which all columns are plotted
against a common Y-axis, and one where each column has a Y-axis of
its own.
One for all
In this mode there is a single Y-axis scale for all columns. The range of
Visualizations
this axis is automatically adjusted to fit all the columns currently being
visualized.
Note: Since the values of the plotted columns may be of different
magnitude, some lines might not be visible due to their low amplitude in
relation to the scale of the Y-axis. Select Individual scale mode, or use
the zoom bar on the Y-axis to zoom in on curves with low amplitude.
Individual
In this mode each column has a Y-axis scale of its own. This is useful
when you want to visualize data of different types and magnitude in one
plot, or when the shapes of the curves are more interesting than the
absolute values. In Individual mode you can control the vertical position
and scale of each plotted column using the sliders on the Lines tab.
4.8.14.2
Labels
For line charts, labels show the values of the column being plotted.
Functionality is otherwise the same as for scatter plots.
Markers
The markers check box determines if markers should be drawn or not.
The size of markers is controlled with the Size slider. The shape and
color of the markers are controlled on column basis on the Lines tab.
Jitter
Jittering has the same functionality as for scatter plots. That is, the X and
Y coordinates are slightly moved to make it possible to tell data points
with the same coordinate apart. The slider sets the amount of random
displacement.
Line connection
You can choose which column to use for discriminating between lines
(Connect by), and the order in which data points are connected within
each line (Order by). The order can be set to any column, to Row
Number, or to None. The column on the X-axis is used by default.
Selecting None turns line connection off.
Line Charts – Line Connection
Edit > Properties > Markers tab
You can choose which column to use for discriminating between lines (Connect by), and the
order in which data points are connected within each line (Order by). The order can be set to
any column, to Row Number, or to None. The column on the X-axis is used by default.
Selecting None turns line connection off.
Line connection works in a slightly different way for line charts compared to scatter plots. In
scatter plots, points will be connected no matter how many intermediate points are deselected
(filtered out). In a line chart, you can control how you want to handle values that are missing or
deselected.
149
TIBCO Spotfire DecisionSite 9.1.1 for Lead Discovery - User's Manual
In the first chart, no values are deselected.
In the second, high values have been deselected and Break on
deselected values has been turned on. Broken lines then extend
half way to the deselected value.
In the third chart, high values have been deselected and Break
on deselected values turned off.
4.8.15
Profile Tab
4.8.15.1
Profile Tab
Edit > Properties > Profile tab
150
Visualizations
Option
Description
Color
Markers can be colored to reflect the value of a particular attribute.
There are three modes for coloring: Fixed, Continuous and Categorical.
Coloring in profile charts is identical to scatter plots.
Scale mode
The vertical dimension in a profile chart represents the value of each
attribute. The scale can either be the same for all columns, or individual
for each column.
In the first case, the scale used for all columns ranges from the lowest to
the highest value in all columns being plotted. This should be used when
the values in the plotted columns are of the same unit and similar
magnitude. To use this mode, select All columns use same scale. In the
second case, the scale for each column ranges from the lowest value in
the column to the highest value in the column. To use this mode, select
All columns use individual scales.
Labels
It is possible to tag each profile with a label, showing the value of a
particular column. You can select to show both Dynamic labels
(Highlight and/or Active) and Static labels (None/Marked/Visible) at the
same time. Dynamic labels are always placed on top of any static labels.
The static labels include the following options:
None – No labels are visible.
Marked – Only records that are marked will have labels next to them.
Visible, max – All visible records (up to a configurable maximum
number) will have labels next to them, provided that the number of
visible records does not exceed the specified max number. If so, no
labels are shown.
Click on Customize to open the Customize Labels dialog, where you
can change the color and line width of the label frames and lines, as well
as the size available to labels.
You can drag labels to any position within the visualization area. Click
on Reset to return all profile labels to their original position.
Select the column you wish to label by, from the drop-down list By:.
If you are running DecisionSite for Lead Discovery, you can also select
to display the chemical structure for each profile in the label. This is
done by right-clicking in the profile chart and selecting Structure
Marker Labels from the pop-up menu. Select Structure Marker Labels
> Remove to revert to the column selected here.
Jitter
Jittering displaces markers slightly and randomly, thereby making
aggregations stand out visually. Attention is brought to areas where
many records overlap. Such regions can then be investigated further, by
zooming, changing axes, etc. Use the slider to increase or decrease
jittering.
Lines
The width of all lines is adjusted by moving the Width slider. Select a
column under Line width by to associate the width of individual lines
with the value of a particular attribute.
Empty values can be dealt with in two ways: either by leaving a gap in
the profile, or by connecting the values on each side with a straight line.
To leave a gap, select Break on empty.
151
TIBCO Spotfire DecisionSite 9.1.1 for Lead Discovery - User's Manual
4.8.16
Profile Columns Tab
4.8.16.1
Profile Columns Tab
Edit > Properties > Profile Columns tab
Option
Description
Available columns These columns are not included in the profile chart.
Note: You can right-click on the Name header to get a pop-up menu
where you can select other attributes you would like to be visible.
Columns in profile These columns are included in the profile chart. The order of this list
corresponds to the order the columns are shown in the Profile Chart
chart
visualization.
152
Add >>
Select a column from the left list and press the Add >> button to move it
to the right list, and include it in the profile chart.
<< Remove
Select a column from the right list and press the <<Remove button to
move it back to the available columns list, and remove it from the profile
chart.
Remove All
Removes all columns from the right list, and moves them to the available
columns list.
Move First
Select a column from the right list and press the Move First button to
move it to the top. This changes the order the lines of the profile chart are
displayed.
Visualizations
Move Up
Select a column from the right list and press the Move Up button to
move it a step up. This changes the order the lines of the profile chart are
displayed.
Move Down
Select a column from the right list and press the Move Down button to
move it a step down. This changes the order the lines of the profile chart
are displayed.
Move Last
Select a column from the right list and press the Move Last button to
move it to the bottom. This changes the order the lines of the profile chart
are displayed.
4.8.17
Heat Map Tab
4.8.17.1
Heat Map Tab
Edit > Properties > Heat Map tab
The Heat Map tab of the Properties dialog is used to modify the color range of the heat map
and to display or hide row labels and deselected records. The default color range is set to green
for minimum values, black for intermediate values and red for maximum values.
153
TIBCO Spotfire DecisionSite 9.1.1 for Lead Discovery - User's Manual
Apply color range to column
To apply a specific color range to one or more columns, select the appropriate columns from the
list, then choose a range from the Color range drop-down list, and finally click the Apply
button.
Create new color scheme
To change the color range of one or more columns, you need to create a new range. Click on the
New button to open the Create Color Scheme dialog.
Edit existing color scheme
You can also edit the coloring of an already existing color range. Select a certain color range
from the Color range drop-down list and click on the Edit button to open the Edit Color
Scheme dialog. Changes made to this color range will have effect on the columns already
linked to the range.
Delete color range
To delete a color range, select the color range from the Color range drop-down list and click
on the Delete button. Any columns linked to the deleted range will automatically be reset to the
Default color range.
Show/hide deselected records
To hide records that have been deselected by using the query devices from the heat map, clear
the Show deselected check box.
Note: If you have had a dendrogram associated to the heat map, this will no longer be valid
after hiding the deselected values. In this case, the dendrogram tree will be removed. You can
show the dendrogram again by selecting the Show deselected check box.
Show/hide row labels
To show row labels next to the heat map, select a column where appropriate labels are located
from the Row labels By: drop-down list. Choose the location of the labels by clicking the Left
or Right radio button.
Tip: If you want to include information from more than one column in the row labels, use the
New Column from Expression tool to concatenate the columns prior to applying row labels on
your heat map.
To remove the row labels, select [None] in the drop-down list.
4.8.17.2
Create/Edit Heat Map Coloring
Edit > Properties > Heat Map Tab > New/Edit Color Range
154
Visualizations
Type a Name of the new color scheme in the text field at the top. Then select Categorical
Coloring or Continuous Coloring.
Categorical Coloring
Categorical Coloring means that each unique value in the heat map is represented by its own
color. This is most useful when dealing with a smaller number of varying values, or when
looking for identical values in a heat map.
You can change which color to represent a certain value by selecting a value from the list, and
then choosing a new color for it from the palette.
Continuous Coloring
Continuous Coloring means that the color range is linear from one specific color to another
color, via a third middle color. By default this is set to show low values in shades of green,
intermediate values going towards black, and high values in shades of red.
Select new colors to represent the Min, Mid or Max values, by clicking on their corresponding
color button and picking a new color from the palette that appears.
155
TIBCO Spotfire DecisionSite 9.1.1 for Lead Discovery - User's Manual
Continuous Coloring is divided into three sub-options:
• Shared custom range:
With this option, you can specify an exact Min, Mid and Max value for the color range
instead of having these values being automatically determined. All selected columns
will be colored according to these values regardless of their own individual Min and
Max values.
• Shared auto range:
With this option, there is a separate shared auto range per data-type category:
• Date/DateTime
• Time
• Integer/Decimal
String columns are not grouped at all, and each column will get an individual range spanning
from the first string to the last.
• Individual auto range:
With this option, the Min, Mid and Max values for the range are automatically set to
the lowest, median and highest values respectively, that exist in each individual
column. All selected columns will be colored according to their own individual Min
and Max values.
156
Visualizations
4.8.17.3
Advanced Coloring Dialog
Option
Description
Name
Displays the name of the coloring arrangement. Type to enter a new name.
Preview
Column
Lists the columns from which you can add values to the Values list.
Values
Displays the values in the chosen column (Preview Column), and the color
for each value. If a value has a defined categorical color, this color will be
used even if the value is also defined within a color range.
Add
Adds a new item to the list of Values. Using this, you can assign specific
colors to values, and create your own coloring arrangement.
Add All
Adds all available values from the selected Color by column to the Values
list.
157
TIBCO Spotfire DecisionSite 9.1.1 for Lead Discovery - User's Manual
Delete
Removes a selected value. Ctrl+click to select multiple items for deletion.
Delete All
Deletes all items in the Values list.
Ranges
Shows the color of the empty records. Empty refers to records that have at
least one empty field. These records are not shown at all in visualizations
where an axis corresponds to the missing field.
Add
Adds a new item to the list of Ranges. Using this, you can assign specific
colors to values, and create your own coloring arrangement.
Delete
Removes a selected value. Ctrl+click to select multiple items for deletion.
Delete All
Deletes all items in the Ranges list.
Other Color Determines which color is used for markers that do not get a color from any
other setting. The color a marker gets is decided in the following order:
>
Markers associated with a data row with empty/null value in the color column
are set to the empty color
Markers filtered out by query devices or zoom sliders are set to the deselected
color.
Marked items are drawn using the marked color.
Markers that are included in the value list are set to the color specified there.
The value list may include values that are not part of the current data set, but
you know those values could be included in a future data set, thus it is possible
to set up color arrangements that have predefined colors for all anticipated
values.
Markers that are included in a color range (from the Ranges list) are set to a
color from that range. Note: Because it is possible to specify overlapping
ranges, a marker can be inside several ranges. See Overlapping Color Ranges
for more information.
Any other markers are set to either a fixed color, or a color from a palette,
depending on your selections. A palette is a list of colors. If there are more
unique values in the color column than there are colors in the palette, colors
will be reused.
> From
palette
Causes each marker to get an individual color from the color palette list.
Note: If there are more than 97 values, colors will be reused.
> Edit
Launches the Edit Palette dialog where you can adjust the RGB values of
individual colors.
> Fixed
Lets you choose the color that the markers will get.
Deselected
Shows the color of the deselected values. Deselected refers to records that do
not fulfill the constraints of the query devices.
Marked
Shows the color of the records that have been marked.
Empty
Shows the color of the empty records. Empty refers to records that have at
least one empty field. These records are not shown at all in visualizations
where an axis corresponds to the missing field.
Templates >
> Shared
auto range
158
With this option, there is a separate shared auto range per data-type category:
3. Date/DateTime
4. Time
5. Integer/Decimal
Visualizations
String columns are not grouped at all, and each column will get an individual
range spanning from the first string to the last.
> Individual Sets the Min, Mid and Max values for the range automatically to the lowest,
median and highest values respectively, that exist in each individual column.
auto range
All selected columns will be colored according to their own individual Min
and Max values.
> Shared
custom
range
Lets you specify an exact Min, Mid and Max value for the color range instead
of having these values being automatically determined. All selected columns
will be colored according to these values regardless of their own individual
Min and Max values.
Import...
Imports a color arrangement from a file.
Export...
Exports a color arrangement to a file. This enables you to save a color
arrangement and reuse it.
Basic
Returns you to the basic Categorical or Continuous or Heat Map Coloring
dialog.
► To change a color of the Values or Ranges:
1.
2.
Click on the square of color that you want to modify.
Select a color from the palette or click More colors... to see the complete color palette.
► To change the Marked, Empty or Deselected color:
1.
2.
Click the button of the color that you want to modify.
Select a color from the palette or click More colors... to see the complete color palette.
159
TIBCO Spotfire DecisionSite 9.1.1 for Lead Discovery - User's Manual
4.8.17.4
Color Expression Dialog
Variables
Lists the available variables which can be used to create your expression. Insert a variable into
your expression with the Insert Variable button.
Category
Select a category of functions to limit the choices in the Functions list.
• All
• Operators
• Math Functions
• Statistical Functions
• Text Functions
• Logical Functions
• Date & Time Functions
• Conversion Functions
Function
Select a function by clicking on it, and click the Insert Function button to insert it to the
Expression field. You can also double-click on a function to insert it.
160
Visualizations
If you place the cursor at a specific location in the Expression field, the function will be
inserted there.
Description
This field provides a brief description of the selected function. For more detailed descriptions,
please see Spotfire Expression Language (SXL).
Expression
This is the text field in which you build your expression. You can insert variables and functions
to it from the lists, or enter text as in any standard text editor.
Cut/Copy/Paste works in the field using standard Ctrl+X / Ctrl+C / Ctrl+V.
Highlighting a section of the expression, and clicking Insert Function will add the selected
function to the expression with the highlighted section as an argument.
Also, Undo/Redo functionality is available by pressing Ctrl+Z.
Note: Very long expressions will be displayed truncated in the Visualization Legend. To avoid
this, insert a blank space with suitable distance. This will not affect the expression, but will
allow the Legend to display it over several rows.
Recent expressions
This list contains the twenty most recent expressions you have created. You can select one of
these and click the Insert button to insert the expression into the Expression field. This will not
replace the entire content of the field, only insert the selected expression at the cursor position.
Result
This field displays the result of applying the current expression to the first row of the data set.
If this field shows an error message, there is a problem with the expression. Clicking on the
field will display an explanation of what is wrong. Pressing F5 will also display the error
description. Pressing F4 will move the cursor to the position in the expression where the error
lies.
There are three kinds of error messages:
#EXPR! – there is a problem with the syntax of the expression.
#NUM! – the row evaluates to infinity or other illegal number.
#ARG! – there is a problem with one or many arguments.
4.8.18
4.8.18.1
Heat Map Columns Tab
Heat Map Columns Tab
Edit > Properties > Heat Map Columns tab
161
TIBCO Spotfire DecisionSite 9.1.1 for Lead Discovery - User's Manual
Option
Description
Available columns These columns are not included in the heat map.
Note: You can right-click on the Name header to get a pop-up menu
where you can select other attributes you would like to be visible.
162
Columns in heat
map
These columns are included in the heat map. The order of this list
corresponds to the order the columns are shown in the Heat Map
visualization. You can also see this numerically in the X-axis selector of
the Heat Map.
Add >>
Select a column from the left list and press the Add >> button to move it
to the right list, and include it in the heat map.
<< Remove
Select a column from the right list and press the <<Remove button to
move it back to the available columns list, and remove it from the heat
map.
Remove All
Removes all columns from the right list, and moves them to the available
columns list.
Move First
Select a column from the right list and press the Move First button to
move it to the top. This changes the order the lines are displayed.
Move Up
Select a column from the right list and press the Move Up button to
move it a step up. This changes the order the columns are displayed in
the heat map.
Move Down
Select a column from the right list and press the Move Down button to
move it a step down. This changes the order the columns are displayed in
the heat map.
Visualizations
Move Last
4.8.19
Table Tab
4.8.19.1
Table Tab
Select a column from the right list and press the Move Last button to
move it to the bottom. This changes the order the columns are displayed
in the heat map.
Edit > Properties > Table tab
Option
Description
Color
You can change the color that indicates marked and deselected markers
by clicking on the corresponding button. You can also choose whether or
not to display deselected records in the table by selecting or clearing the
check box.
Note: Deselected records cannot be marked or made active in any way.
Even though it is possible to make them visible by selecting the Show
deselected check box, they are not included when marking a group of
records.
Sort rows by
You can sort the order of the rows in the table. From the Properties dialog
this can be done by up to three columns, but if you wish to sort by more
than three columns simply use the Shift+click functionality.
In the Properties dialog, first select a primary column to sort the rows
163
TIBCO Spotfire DecisionSite 9.1.1 for Lead Discovery - User's Manual
by, and select whether the order should be Ascending or Descending.
You may then select a secondary column to sort by, and even a third if
you so desire.
Note: You can also sort the rows quickly by just clicking on the header of
a column. Clicking several times will toggle between ascending or
descending order. By holding down Shift and clicking on another column
header you can sort by several columns.
Row height
This drop-down list box lets you choose how high each row in the table
should be. Height is measured in number of lines. It can be useful to
increase the number of lines if there is a great deal of information in each
cell, as several lines makes the text wrap inside each cell.
Header height
This drop-down list box lets you choose how high the headers in the table
should be. Height is measured in number of lines. It can be useful to
increase the number of lines if there is a great deal of information in each
column header, as several lines makes the text wrap inside each cell.
Frozen columns
In a table with many columns you often need to scroll horizontally.
However, sometimes you may want certain columns to always be
displayed regardless of scrolling. This is achieved by freezing one or
more columns.
Place the columns you want to freeze to the far left of the table, then use
this drop-down list box to specify the number of columns you want to
freeze.
Grid
Select this check box to show grid lines in the table.
4.8.20
Table Columns Tab
4.8.20.1
Table Columns Tab
Edit > Properties > Table Columns tab
164
Visualizations
Option
Description
Available columns These columns are not included in the table.
Note: You can right-click on the Name header to get a pop-up menu
where you can select other attributes you would like to be visible.
Columns in table
These columns are included in the table. The order of this list
corresponds to the order the columns are shown in the Table
visualization.
Add >>
Select a column from the left list and press the Add >> button to move it
to the right list, and include it in the table.
<< Remove
Select a column from the right list and press the <<Remove button to
move it back to the available columns list, and remove it from the table.
Remove All
Removes all columns from the right list, and moves them to the available
columns list.
Move First
Select a column from the right list and press the Move First button to
move it to the top. This changes the order the columns are displayed in
the table.
Move Up
Select a column from the right list and press the Move Up button to
move it a step up. This changes the order the columns are displayed in
the table.
Move Down
Select a column from the right list and press the Move Down button to
move it a step down. This changes the order the columns are displayed in
the table.
Move Last
Select a column from the right list and press the Move Last button to
165
TIBCO Spotfire DecisionSite 9.1.1 for Lead Discovery - User's Manual
move it to the bottom. This changes the order the columns are displayed
in the table.
4.9
4.9.1
Working with Visualizations
Changing Visualization Axes
To change the column to be mapped to each axis, click on an axis selector, and select a column
name. For example, to see the Mendeleevian layout of the peroidic.csv example data set, select
P1 for the X-axis and P2 for the Y-axis.
Note: You can also select which column to use as an X, Y or Z-axis by right-clicking on the
Query Device representing that column, and selecting Set Property > Axis from the pop-up
menu.
4.9.2
Zooming and Panning
Zooming can be done in two ways: by using the zoom bars or by using the mouse.
Mouse Shortcuts
2D Scatter Plots, Bar Charts, Pie Charts, Line Charts, Profile Charts, and Heat Maps.
Action
Mouse maneuver
Comment
Zoom in
Ctrl + Right-click
The scroll wheel has the same function
Zoom out
Ctrl + Shift + Right-click
In 3D Scatter Plots, the zoom bars are used as in 2D. Additionally, the following means of
navigation are available.
166
Action
Mouse
action 1
Mouse
action 2
Rotate
Ctrl + drag using
the right mouse
button
Drag using the
middle mouse
button
Pointer
icon
Comment
Rotation is around
the visualization
center
Visualizations
Zoom
Shift + drag using Shift + drag using
the right mouse
the middle mouse
button
button
Moves in the
direction of view
Roll
Shift + Ctrl + drag Shift + Ctrl +
using the right
drag using the
mouse button
middle mouse
button
Rotation is in the
plane of the screen;
down-wards and
right cursor motion
rotate clockwise
Zoom in on a
specific marker
Click on a marker Ctrl + drag using
and use the mouse the middle mouse
wheel
button
Keeps the selected
marker in the same
place on screen
Note: Clicking the Reset Navigation button on the 3D tab of the Properties dialog will undo
all navigation adjustments.
Zoom bars
Dragging the end arrows of the zoom bars (along the edges of the visualization window) zooms
in on a portion of the visualization. Dragging the bar itself (by placing the mouse pointer on the
yellow bar and dragging) pans across different areas of the entire visualization.
Altering the length of the X-axis zoom bar
The pale yellow area represents the selected range of values, whereas the bright yellow area
represents the range of existing values within the selected range.
The zoom bar can be adjusted to encompass only the currently selected data.
► Setting the zoom bar span to the current selection:
1.
Double-click on the bright yellow area.
Response: The scatter plot and the zoom bar are now adjusted to focus on the selected
markers.
Tip: You can also right-click on the Zoom bar and select Zoom to Selection from the
pop-up menu. To zoom in on one side but not on the other, double-click on the left or
right drag box.
► Resetting the zoom bar span:
1.
Double-click on the center of the zoom bar.
167
TIBCO Spotfire DecisionSite 9.1.1 for Lead Discovery - User's Manual
Response: The zoom bar now expands to its full length.
Tip: You can also right-click on the Zoom bar and select Reset Zooming from the
pop-up menu.
Note: By double-clicking on the left or right drag box of the zoom bar, you can narrow
down the left or right span.
► Setting the zoom bar to a specific value:
1.
2.
Click on an end arrow of the zoom bar.
Type the desired value.
The scatter plot and the zoom bar are now adjusted to show the value you entered.
Note: Note that no "edit field" will appear in which to type the value. Simply type the
value after clicking, a temporary ToolTip will be displayed, and the slider will adjust
itself to the specified number.
► Setting the Data Range to Selected records:
1. Move the drag box of the zoom bar to narrow the selection.
2. Right-click on the zoom bar.
3. Select Data Range from Zooming from the pop-up menu.
The zoom bar expands to its full width, but with the Data Range set to encompass only the
selected records. Three dots are displayed to indicate that the range is not the original full range.
► To reset the Data Range:
1.
4.9.3
Right-click the zoom bar and select Reset Data Range.
Axis Labels
Axis labels are by default displayed along both the horizontal and vertical axes. These can be
adjusted in several ways.
► To adjust the axis label width/height:
1.
Position the mouse pointer over the axis. The mouse pointer changes, as seen below.
2. Press down the mouse button and drag the axis to the width or height desired.
Note: If the axis labels are hidden, simply grab the axis and drag it to make the labels visible
again.
168
Visualizations
Label options
By right-clicking in the axis label area, a pop-up menu appears. It contains several options:
Hide – Hides the vertical or horizontal axis labels. Drag the axis (see above) to make the labels
visible again.
Fewer Labels – Fewer labels are displayed on the axis.
More Labels – More labels are displayed on the axis.
Label Orientation – Sets the label text orientation to either Horizontal or Vertical (see below).
Properties – Opens the Properties dialog in which you can set Label spacing and density.
4.9.4
Applying Templates
If you open many data sets of a similar nature in DecisionSite Client, you may wish to create a
template of the usual visualizations you always create, certain query device settings you always
initially make, etc. For information on how to save a template see Saving Spotfire Files.
A template file is basically a standard Spotfire file but without any data content. When you
want to apply a template to a data set, you can therefore choose to apply the settings from either
a Template file (SFT), a Spotfire Analysis File (SFS) or a Spotfire XML File (XSF, which is
the same thing as an SFS file only in XML format).
► To Apply a Template:
1.
2.
3.
4.
4.9.5
4.9.5.1
Open your data set in DecisionSite Client.
Select File > Apply Template....
Select the template file you want to apply.
Click Open.
Response: The template is applied on your data.
Marking, Activating, and Highlighting Records
How to Mark, Activate and Highlight
In DecisionSite, there are three ways to interact with the data set: marking, activating and
highlighting.
169
TIBCO Spotfire DecisionSite 9.1.1 for Lead Discovery - User's Manual
Action
Marking
Activating
Highlighting
Indicator in
visualizations
How to do it
Hold down the left
Click on a single
mouse button and draw object.
a rectangle around one
or more objects (or
press Shift before you
press the button, and
drag for a lasso effect).
Hover with the mouse
pointer over an object.
Note: An "object" can be a single record (as in scatter plots) or an aggregation of records (such
as pie charts).
The effect of performing these actions varies with the tool and type of visualization. Go to the
sections describing each tool to find out more, or click the Help window's Back button to return
to where you were!
4.9.5.2
Marking
The purpose of marking records may be to view details, or to distinguish records in order to
copy, erase, or in other ways manipulate them.
► To mark one or more records:
1.
2.
Click and hold the left mouse button, and drag the mouse: the pointer will delineate a
rectangle.
Enclose the markers of interest in this rectangle. When the mouse button is released,
the marked objects will be given a different color and outline.
Note: Marking a pie or bar is equivalent to marking all the records that are included in
that pie or bar.
► To add more records to the marked set:
1.
2.
Press and hold Ctrl.
Click on markers you want to add, one by one. Alternatively, use the mouse to draw a
rectangle around several markers (while still pressing Ctrl).
Marking with the lasso
A set of graphical objects, be they pies, bars or scatter plot markers, can be "lasso selected", i.e.,
be surrounded by a line drawn in an arbitrary shape. Press the Shift key and the left mouse
button, then draw a line capturing the markers. Note that a straight line connects the beginning
and the endpoints of the lasso marquee. The line delineates the area that will be included in the
selection.
Note: For a record to be marked, its exact coordinates must be within the bounds of the
selecting line. Just slicing through part of an enlarged marker will not suffice.
Setting colors for marked objects
Marked records will be given an identifying color in all visualizations. You can define this
color through the Customize color button of the Properties dialog.
170
Visualizations
Unmarking
Re-marking any marked object(s) while Ctrl is pressed will unmark them. If Ctrl is not pressed,
only the new selection will be marked. Unmark all data by selecting Edit > Marked Record(s)
> Unmark; or by pressing [Ctrl+E]. Alternatively you can unmark everything by marking an
empty area of any visualization.
Message box when marking
If a set of markers is already marked, and you mark a new set, a message box will appear,
warning you that you will loose the previous marking. You can turn this feature off by checking
the box labeled Never show alert again. If, at a later time, you would like this feature back,
select Edit > Marked Record(s) > Unmark, and check the box in the dialog. You can also use
the Customize dialog.
4.9.5.3
Activating
Clicking on a single record will make a persistent circle surround the corresponding marker in
all scatter plot visualizations. A record thus chosen is referred to as active.
The arrow keys will cause the nearest record in the direction of the arrow to become active. The
Tab key will move the active record indicator to the next record in the data set. If you have a
group of records marked, using the keys will only cycle through these.
The details of an active record are presented in the Details-on-Demand window. The record will
continue showing details until another record is made active or a group of records marked with
the lasso or rectangle method.
4.9.5.4
Highlighting
Moving the mouse pointer close to or on top of a graphical object will highlight it. A thin circle
will cling to the marker until the pointer is moved a certain distance away.
Highlighting shows where in each visualization a data point lies, because the same record is
highlighted in each visualization.
4.9.5.5
Actions Involving the Marked Set
The following commands concern the set of marked records. They can all be found via the Edit
menu or in the right-click context menus of the visualizations.
Option
Description
Marked Record(s) >
Unmark
Ctrl+E. Unmarks all records in the data set.
Marked Record(s) >
Invert
Ctrl+I. Inverts the marking so that all unmarked records become
marked and vice versa.
Marked Record(s) >
Select
Ctrl+M. Sets query devices to include only the marked records. This
hides the unmarked records.
Marked Record(s) >
Undo Select
Shift+Ctrl+M. Undoes the previous selection.
Marked Record(s) >
Delete
Delete. Removes corresponding records from the data set. The action
is irreversible and immediately affects the loaded data set. However,
171
TIBCO Spotfire DecisionSite 9.1.1 for Lead Discovery - User's Manual
the data source (e.g., the file) will remain unchanged until you
explicitly overwrite it by saving.
Data > New Column Creates a new column. By default, marked records will get the value
Yes, and unmarked records the value No.
> From Marked
Records...
Note: Found under the Data menu.
4.9.5.6
Resetting Visualizations
After having zoomed in, selected, deselected and performed a number of manipulations on the
markers, pies and/or bars, the set of records shown in the visualizations may become
disarrayed. The command Reset to All in the Edit menu (Ctrl + R) will get the visualization
back in order again, resetting the query devices and restoring zoomed visualizations.
Deleted records will be gone, however, and can only be restored by closing the visualization
without saving it and then opening the original data set once again.
4.9.5.7
Copying Records
These commands under the Edit menu copy the data stored in the loaded data set, or a sub-set
of it, to the clipboard. The copied information can then be exported, pasted into a spreadsheet
program, such as Microsoft Excel or another program, e.g. Notepad.
Copy [Ctrl+C] copies the records corresponding to the markers, bars and pies marked with the
lasso or rectangle marking tool to the Windows clipboard in text format. It also copies an image
of the visualization to the clipboard, which can be pasted into other applications by using a
Paste Special option.
Copy Special > Marked Records copies the records corresponding to the markers, bars and
pies marked with the lasso or rectangle marking tool to the Windows clipboard in text format.
Copy Special > Selected Records copies only the records within the limits set by the query
devices to the Windows clipboard in text format.
Copy Special > All Records copies all records to the Clipboard. Data in all the records in the
data set is copied to the Clipboard in text format.
Copy Special > Visualization copies the active visualization display as a Windows Metafile
image. This image can be pasted into other Windows compatible applications such as MS
Word, Paint, PowerPoint etc. As Metafile images are vector-based graphics they can be
enlarged or shrunk at will without loosing detail. Axes, labels and grid lines are included in the
image. These images can be manipulated from within the new host applications.
4.9.5.8
Information About the Data Set
The record meter in the status bar at the bottom of the Spotfire DecisionSite gives continuous
information about visualization statistics. You can see at a glance what portion of all the data is
currently visible, marked, etc. The same information is displayed as text.
Colors should be read as follows:
Green – Records that are selected and marked.
Yellow – Records that are selected and unmarked.
Gray – Records that are selected, but lack a value required for representation on the current
axes, and hence are invisible.
172
Visualizations
The sum of the above makes up the set of selected records. The length of the record meter in
relation to the box in which it sits is an indication of the relative size of the current selection.
To display or hide the status bar, use the Status Bar command in the View menu.
4.9.6
Organizing the Desktop
4.9.6.1
Arranging Visualizations
There are several ways to reposition windows; the commands governing these functions all
reside in the Window menu:
Auto Hide Axis Selectors – when the visualization is small enough, this option automatically
hides the zoom bars and the axis selectors.
Hide Window Frame – hides the title bar, giving more space to the visualizations—only
available when several visualizations have been tiled.
Auto Tile – arranges all the windows on screen according to an internal algorithm. The active
visualization will be made the largest, and placed in the upper left-hand corner.
Cascade – arranges the visualization windows so that they partially overlap each other, leaving
each window accessible by clicking on the title bar.
Tile Horizontal – splits the window area horizontally, giving each visualization equal area.
Tile Vertical – splits the window area vertically, giving each visualization equal area.
Tip: An alternative way of organizing visualizations is to use a Trellis plot. This allows you to
split an existing plot into panes, and organize these in a grid. Note that this feature is currently
available only for scatter plots (2D and 3D), bar charts, profile charts and heat maps. See What
is a Trellis Plot? for more information.
4.9.6.2
Showing and Hiding Windows
Spotfire DecisionSite consists of several windows. It can be desirable to rearrange the
application's layout to organize visualizations and information for more effective analysis.
The View menu displays a list of the Spotfire DecisionSite windows. Each window can be
shown or hidden by selecting or clearing the check mark next to the name of the window,
respectively. The windows are listed and described below:
Toolbars – the row of clickable buttons right below the menus. See Toolbar Buttons for more
information.
Status Bar – the information field at the bottom of the application window. The status bar
displays information about pointer position, number and portion of records that are visible and
marked, etc.
Full Screen – by selecting this option, all Toolbars are hidden and the Visualization, Query
Device and Details-on-Demand window are maximized to fill the whole screen. By clicking on
the small icon (below) the Toolbars are returned. You can also go to Full Screen mode by
pressing F11.
Workbook – when this option is selected, each visualization is given a separate tab.
Details-on-Demand (Text) – the window where information about the marked records, the
highlighted scatter plot marker, bar or pie object, etc., appears.
Details-on-Demand (HTML) – information about the highlighted or marked scatter plot
marker(s), bar or pie object(s), etc., formatted according to the HTML templates stored in the
current SFS file.
Details-on-Demand (External Browser) – as above, but launches a separate browser.
Query Devices – the window that contains all the query devices.
Legend – the window that explains the significance of the current visualization settings, e.g.,
which columns are used for size, rotation, color, etc.
173
TIBCO Spotfire DecisionSite 9.1.1 for Lead Discovery - User's Manual
Guides Toolbar – the row of clickable buttons pertaining to the Guides pane.
Guides Pane – the browser window used to view Guides, and to run Spotfire DecisionSite
applications (plug-ins).
4.9.6.3
Moving and Resizing Windows
Spotfire DecisionSite has a certain default setup; the Guides pane appears on the left, while the
larger area in the centre is for the visualization(s). The right side is occupied by the Query
Device window and the Details-on-Demand window.
Since this may not be the most effective layout for all purposes, it is possible to move and
resize the windows.
To resize a window, click on a window border and drag it to the desired position.
To move a window, click on the title bar or gripper bar at the top of the window, and drag the
window to the desired position. Alternatively, press the left mouse key while pointing at the left
or right edge—there is a thin, 3 pixel band—to grab the window for repositioning.
4.9.6.4
Workbook Mode
Workbook mode can be used to put each visualization on its own tab. A click on a tab activates
the corresponding visualization and allows manipulation and modification of its attributes.
To put Spotfire DecisionSite into Workbook mode, select Workbook from the View menu.
You can change the order of the tabs by right-clicking on a tab and selecting Move >
First/Left/Right/Last from the pop-up menu.
Combining Workbook with Auto tile
With Windows > Auto Tile off, pages in the Workbook retain the size that they had been
given; decreasing the size of the application window will crop portions of some visualizations.
With the Auto Tile function on, clicking on a Workbook tab gives the chosen visualization
priority position and size.
4.9.6.5
Duplicate Visualization
By selecting Visualization > Duplicate Visualization you can create a copy of the currently
selected visualization. This is useful if you have created a visualization with different settings,
and you wish to create an identical copy in which you then want to change some aspect and
compare the two.
174
Visualizations
4.9.6.6
Customizing Visualizations
The Tools > Options > Visualization Settings tab allows you to control certain aspects of the
visualizations.
Hiding axis selectors
Axis selectors can be made to automatically disappear when the visualization size is less than a
certain threshold value. Click Auto Hide Axis Selectors and set threshold values to enable this
function. The Default button restores default threshold values and disables Auto-hide.
Controlling default settings for new visualizations
The Save button on the Visualization Settings tab of the Options dialog allows you to set the
preferred initial settings for new visualizations.
The settings of the current visualization are used as a template for initial visualizations of
similar type. In this context, 2D and 3D scatter plots are linked, i.e., default settings for 3D
visualizations will also apply to 2D scatter plots.
The following settings are saved for all visualizations:
• Color – e.g., categorical or continuous coloring, beginning and ending colors for
continuous coloring, marked and deselected marker color, etc., but not which column
governs coloring.
• Size – the size of markers (but not which column governs size).
• Labels – the label mode (None, Marked, All), the number of labels displayed and their
color, displacement, orientation, positioning and density.
• Gridtype – show grid or not.
• Append axis names to visualization title
• Show deselected – whether or not deselected records should be displayed.
In addition, marker shape is also saved for scatter plots, outline or no outline is saved for bar
charts, scale mode is saved for profile charts and line charts as well as the show marker option
for line charts.
No column-specific settings are saved, e.g., Rotate by is not saved since it refers to a specific
column. Settings from the 3D tab such as navigation, rendering and perspective are not saved;
neither are Data and Background tab settings as they are column specific.
The Reset button will remove the configuration that you have previously saved and restore the
default values.
4.9.6.7
Customizing Toolbars
Tools > Customize > Toolbars tab
You can tailor Spotfire DecisionSite's toolbars to allow you to rapidly access features that you
use regularly.
► To customize toolbars:
1.
2.
3.
4.
5.
Select Tools > Customize....
Go to the Toolbars tab.
Click New....
Enter a name for the new toolbar and click OK.
Make sure the new toolbar is selected in the list. Your toolbar should be visible as a
small box on your screen:
175
TIBCO Spotfire DecisionSite 9.1.1 for Lead Discovery - User's Manual
4.9.6.8
6.
7.
Go to the Commands tab.
Select a category of commands.
8.
9.
Drag any button to your new toolbar (or to any of the standard toolbars).
Click OK.
Fonts & Numbers Tab
► To change the fonts:
Select Tools > Options > Fonts & Numbers. This opens the Fonts & Numbers tab of the
Options dialog in which you can specify which font should be used for different categories of
the application:
• Annotations - the font used for the annotation when printing.
• Details on Demand - on screen.
• Headers and Footers - shown when printing.
• Legend - on screen, when printing or exporting.
• Query Devices - on screen.
• Title - when printing.
• Visualization - labels and texts in visualizations, on screen, when printing or exporting.
Select one or more categories and click on the Change Font button. This displays the Font
selection dialog in which you can select which font, font style and font size should be used for
the selected categories.
176
Visualizations
► To reset the fonts:
•
Select one or more categories and click on the Reset button, to reset the font for these
categories to the default font.
• Click on the Reset All button to reset all categories to the default font.
You can specify how you want DecisionSite Client to display number formatting for all Integer
type values and Decimal type values. You can set the Number of decimal digits, how to display
Negative numbers, and whether or not to use Thousands separators. The settings you make in
this dialog will be set as default, and take effect when you load a new data set in to DecisionSite
Client.
You can set other number formatting for specific columns later if you want to. See Number
Format for Columns.
► To set Number Formatting:
1.
Select Tools > Options > Fonts & Numbers.
2.
Click on either the Integers... or Decimals... button and select either None formatting
or a custom one under Number....
177
TIBCO Spotfire DecisionSite 9.1.1 for Lead Discovery - User's Manual
3.
4.
4.9.6.9
Specify the Number of decimal digits, how to display Negative numbers, and
whether or not to Use thousands separators.
Note: The symbol used for thousands separators and decimal separator is determined
by the Windows Locale setting.
Click OK.
Advanced Options Tab
The Advanced Options tab of the Tools > Options dialog provides some options for finetuning your Spotfire DecisionSite environment. Use the check boxes to enable or disable any of
the following features (the first four only take effect after Spotfire DecisionSite is restarted):
Option
Description
Show grippers on
docked windows
Displays a small banner in docked windows, which can be used
when dragging the window to a new position. Drag the banner to
move the docked window. Examples of docked windows are the
Details-on-Demand window and the Legend window.
When this option is selected, column names are displayed on a
Show full column
names in query devices separate row inside each query device. Clearing the check box will
display the column names and the values on the same row, in some
cases truncating the column name, but instead the query devices
will be more compact, thus displaying more query devices in the
window.
Show warning when
changing marked
records
Displays a dialog each time you mark a new set of records.
Use OpenGL hardware If you experience problems displaying 3D Scatter Plots, try turning
off the OpenGL acceleration.
acceleration
178
Visualizations
Use DirectX9 for
smooth line rendering,
if available
Enables the use of hardware-accelerated DirectX 9 for smooth line
rendering. (This setting only has effect if there is a DirectX 9
capable graphics card available in your computer.)
Ignore case in full text
search
This sets the default behavior for full-text search query devices.
This means that when you import a new data set or change a query
device into a full-text search, it will be either case sensitive or not,
depending on this setting.
However, you can also specify whether or not each individual fulltext search query device should be case sensitive by right-clicking
on it. In the pop-up menu that appears, select Set Property >
Search options > Ignore Case. By using this alternative, different
query devices can have different settings.
Use Regular
Expression in full text
search
This sets the default behavior for full-text search query devices.
This means that when you import a new data set or change a query
device into a full-text search, it will either use regular expressions
or not, depending on this setting.
However, you can also specify whether or not each individual fulltext search query device should use regular expressions by rightclicking on it. In the pop-up menu that appears, select Set
Property > Search options > Use Regular Expression. By using
this alternative, different query devices can have different settings.
Note: When you save the visualization, the settings for each query
device are saved in the SFS file and will remain when you open the
file again. However, since the case sensitivity and regular
expression settings are not available in versions older than
DecisionSite 7.1, the full-text search query devices in older SFS
files that are opened in DecisionSite 7.1 or later, will be based on
the default settings in the Advanced options tab.
Show Bar Chart
version 7.x toolbar
button
In DecisionSite 8.0 a new improved bar chart was introduced. For
legacy reasons it is still possible to create a version 7.x bar chart.
Select this check box and restart DecisionSite Client to display a
toolbar button which lets you create a version 7.x bar chart.
Export data using
column formatters
Select this option to use the current formatting of all columns upon
export. See Export Data for more information.
You can also set:
• The default width of the query device window
• Vertical or horizontal auto-tiling
• Default file location; this is the directory you want Spotfire DecisionSite to open when
you select File > Open. Entering a single period character in this field means that
Spotfire DecisionSite's Spotfire/DecisionSite/Data/ directory will be the default.
4.9.7
4.9.7.1
View Tip
What is View Tip?
View Tip is a tool for rapid assessment of potentially interesting visualizations. It suggests
visualizations based on the correlation between data in the columns, the number of unique
values, and the distribution of data. In some cases the View Tip also suggests colors where this
is appropriate.
179
TIBCO Spotfire DecisionSite 9.1.1 for Lead Discovery - User's Manual
View Tip is a convenient way of quickly getting to know a data set. As you browse through the
different miniatures plots, you realize that View Tip is a natural first step when you start
exploring unknown data.
To use the View Tip function:
Open the data set in Spotfire DecisionSite, and select View Tip... from the Visualization menu.
Click on an item in the Scatter plots or Histograms list, or use the arrow keys to quickly browse
either list.
When you have found an interesting visualization that you want to investigate further, click
Create View to generate the corresponding visualization in Spotfire DecisionSite.
Click Close.
Note: Selecting a Histogram will create a "Version 7.x Histogram".
4.9.7.2
View Tip Algorithms
Ordering of scatter plots
View Tip calculates the correlation between different combinations of columns, and orders the
suggested visualizations according to the degree of linear correlation.
The most common measure of correlation is the Pearson Product Moment Correlation (called
Pearson's correlation for short). When computed in a sample, it is designated by the letter r and
is sometimes called Pearson's r. Pearson's correlation reflects the degree of linear relationship
between two variables. Pearson's ranges from +1 to -1.
Positive correlation
A correlation of +1 means that there is a
perfect positive linear relationship between
variables. This scatter plot depicts such a
relationship. It is a positive relationship
because high scores on the X-axis are
associated with high scores on the Y-axis.
Negative correlation
A correlation of -1 means that there is a
perfect negative linear relationship between
variables. This scatter plot depicts such a
relationship. It is a negative relationship
because high scores on the X-axis are
associated with low scores on the Y-axis.
Zero-correlation
A correlation of 0 means there is no linear
relationship between the two variables, as
shown in this graph. Correlation is rarely, if
ever 0, 1, or -1.
180
Visualizations
With behavioral data, there is almost never a perfect linear relationship between two variables.
The more the points tend to fall along a straight line, the stronger the linear relationship. View
Tip calculates the absolute value for r, and then determines the rank of the scatter plots
accordingly.
181
TIBCO Spotfire DecisionSite 9.1.1 for Lead Discovery - User's Manual
5
5.1
Query Devices
What is a Query Device?
A query device works like a filter, imposing constraints on the loaded data set. For example, a
query device may exclude all records with values above a certain threshold. Only records that
comply with the query device settings are visible in visualizations. When manipulating a query
device, you can instantly see how the current setting affects the visible data. The visible data
(and any empty values for the active axis) is also referred to as selected.
When a data set is loaded, each column in the underlying data set becomes associated with one
query device. The type of device depends on the type of data in the column. Spotfire
DecisionSite has five types of query devices: range sliders, item sliders, full-text search, check
box query devices, and radio button query devices. (Also, the zoom bars work like range
sliders.)
Searching for a Query Device
When using a data set with many columns, you often have just as many query devices.
Sometimes it can be hard to find the query device you wish to manipulate by scrolling through
the query device panel. A quick way to find a certain query device is to use the search function
at the top of the query device panel. If you know the name of the column (Query Device) you
want, simply begin typing it into the search box and the desired query device should come into
focus. Any columns with names that do not match this are hidden from the query device panel.
As you enter text, the query device panel is continuously updated with the query devices that
begin with the current substring. To show all query devices again, just clear the search box. The
query device search expression is based on case-insensitive substring matching of the column
name. For example: Typing in "a" will match a column named "Apple" as well as a column
named "Pear" but it will not match a column named "Lemon".
You can also navigate between the query devices using your keyboard. F3+up arrow or
F3+down arrow will move you up or down one query device. F3+home or F3+end will move
you to the first or last query device, and F3+page up or F3+page down will move you up or
down one screen length among the query devices.
182
Query Devices
You can also navigate between the query devices using your keyboard. F3+up arrow or
F3+down arrow will move you up or down one query device. F3+home or F3+end will move
you to the first or last query device.
5.2
Range Sliders
Range sliders allow the selection of a range of values. The left and right drag box can be used to
change the lower and upper limit of the range, meaning that only records with values within the
chosen range are selected and therefore visible in the visualization. Labels above the slider
indicate the selected span. The range can also be adjusted with the arrow keys when the query
device is active: left and right arrows move the lower limit (left drag box), and up and down
arrow keys move the upper limit. The slider automatically jumps to values in the data set (not
necessarily the visible or selected records).
The currently selected interval of the range slider can be grabbed and moved to pan the selected
range—this provides a powerful way of sweeping over different "slices" of a data set. Click and
drag the yellow portion of the range slider to do this. Observing the reactions the other sliders to
such a sweep can give some interesting clues to correlation between parameters in the data set.
An important feature of the range slider is that the values are distributed on a linear scale
according to the values of the data. Thus if values are unevenly distributed, this will be reflected
in the range slider.
183
TIBCO Spotfire DecisionSite 9.1.1 for Lead Discovery - User's Manual
Note: This is not the case with item sliders, where values are evenly distributed along the range
of the slider, regardless of what values appear in the column.
Note: For more information on how strings are sorted in a query device please see Strings.
Adjusting the Range Slider span
The range slider can easily be adjusted to encompass only the currently selected data.
► Setting the range slider span to the current selection:
1.
Double-click on the center of the range slider.
2.
The range slider is now adjusted so as to show only the effective area:
3.
To reset the range slider, double-click on the center of it again. The range slider is then
reset to its maximum width.
► Setting the left range slider span:
1.
Double-click on the left drag box.
2.
The range slider is now adjusted:
3.
To reset the left range slider span, double-click on the left drag box of it again. The
range slider is then reset to its maximum width.
Note: This function also applies to the zoom bars functionality.
Sometimes you might wish to filter the data in a column using a smaller range than the full
range of the column. If so, you can set a range slider to encompass only a smaller range.
► Setting the Data Range to Selected records:
1.
184
The original Range Slider span is 0 to 40.
Query Devices
5.3
2.
Move the drag box to narrow down the selection.
3.
4.
Right-click on the Range Slider to bring up the Query Device pop-up menu.
Select Data Range > From Selected. The Range Slider expands to its full width, but
with the range 27 to 40. Three dots are displayed to indicate that the range is not the
original full range.
5.
To reset the span, right-click the Range Slider and select Data Range > Reset.
Item Sliders
In an item slider query device, data items are represented by their numerical values on a
continuous linear scale. However, the item slider selects only a single item at a time. The
selected value is displayed as a label above the slider. As a special case, all items are selected
when the slider handle is at the extreme left of the scale.
The item slider features two levels of granularity-a coarse grain slider for moving rapidly
between items, and a fine grain slider for moving more slowly between adjacent items.
Note: The scope of an item slider is dependent on the settings of other query devices. This
means that the item slider range constantly changes as you manipulate the query devices. Items
that fall outside of the current selection or zooming become unavailable and will be grayed out.
Note: For more information on how strings are sorted in a query device please see String.
If you are working with large data sets—consisting of perhaps several hundreds of thousands of
records—it can be quite tricky to get the slider to stop at the desired value. The solution to this
problem is to use the fine-resolution handle together with the keyboard.
To pin-point a certain entry with the item slider:
Click the upper handle of the slider, and drag the box to the approximate position of the entry
by keeping an eye on the currently selected value above the slider.
Fine tune with the fine resolution handle.
When the input focus is set on the slider (marked by a dotted line), you can use the arrow keys
on your keyboard to adjust the slider to the exact position of the entry. Up and right arrows
move to the next value, down and left to the previous one.
When the item slider drag box is moved to its leftmost position, all values for the slider are
selected. This is indicated by the label (All) above the slider.
185
TIBCO Spotfire DecisionSite 9.1.1 for Lead Discovery - User's Manual
5.4
5.4.1
Full-text Search
Full-text Search
The full-text search query device allows you to search for (sub)strings within columns. It also
allows you to search for a pattern by using Regular Expressions. For example, you can enter a
pattern that means "a letter followed by two digits".
By normal-text search, we refer to search strings that don't contain regular expressions. The
search can be made arbitrarily complex by use of logical operators AND (&) and OR (blank
space). Search expressions are evaluated from left to right.
Once the search string has been entered, press Enter on your keyboard to execute the search. All
records matching the search criteria will be shown in the visualization window.
The operators allowed in normal searches are:
white-space
logical OR
&
logical AND
""
search for the exact sub-string within double
quotes
The full-text search query device also supports Cut/Copy/Paste of text strings using the
CTRL+X, CTRL+C and CTRL+V.
You can specify whether a full-text search query device should use regular expressions or not,
by right-clicking on it. In the pop-up menu that appears, select or deselect Set Property >
Search Options > Use regular expression.
Case sensitivity
When importing a new data set or changing a query device into a full-text search, the resulting
full-text search query device(s) will be either case sensitive or not. This is determined by a
setting in the Tools > Options > Advanced options tab called Case sensitive full-text search.
If this check box is selected then searches done with the query devices will be case sensitive.
However, you can also specify whether or not each individual full-text search query device
should be case sensitive by right-clicking on it. In the pop-up menu that appears, select Set
Property > Search Options > Ignore case. By using this alternative, different query devices
can have different settings.
When you save the visualization, the settings for each query device are saved in the SFS file
and will remain when you open the file again. However, since the case sensitivity and regular
expression settings are not available in versions older than DecisionSite 7.1, the full-text search
query devices in older SFS files opened in DecisionSite 7.1 or later, will be based on the default
settings in the Advanced options tab..
Note: When a query device is changed into a full-text search query device, the "Show Empty
Values" option from the Properties dialog is automatically set to False. This means that empty
values are not included in the search result.
5.4.2
Using the Full-text Slider
The slider integrated in the full-text search query device is really just an item slider with one
important difference: the scope of the slider corresponds to the result of the full-text search.
This means that if you set the slider in its leftmost position (All), all items that match the search
criteria will be shown (which doesn't necessarily mean all the records in the data set).
Use the slider to select individual items among those that match the search criteria. Drag the
upper portion and the scrolling will be rapid. If the search has resulted in many hits, some will
not appear with the coarse selector. When in the appropriate region of hits, drag the fine-tuning
lower portion to locate the specific value you want.
186
Query Devices
As with other sliders, once activated they can be adjusted with the keyboard arrows. Keyboard
selection is always fine-grained, value by value.
Let's look at the example in the figure above. Note that the brackets must be preceded by a
backslash since brackets have a special meaning in regular expressions (see Regular
Expressions below).
carb ox & "pine \[inn\]" & zep
Spotfire DecisionSite will evaluate the search expression in the following way
(carb OR ox) AND ("pine [inn]") AND zep
In plain English this means: "Show me all items where the column Generic Name contains
names that include the sub-strings carb or ox, and also contains the full string pine [inn] as
well as the sub string zep.
This means that OXCARBAZEPINE [INN] would be matched, but not AMOXAPINE [U;INN]
or CARBAMAZEPINE [U;INN].
Note: The scope of a full-text slider is dependent on the settings of other query devices. This
means that the slider range constantly changes as you manipulate the query devices. Items that
fall outside of the current selection or zooming become unavailable and will be grayed out.
5.4.3
Introduction to Regular Expressions
Regular expressions constitute the standard pattern matching language, used heavily for
searching and parsing text in most UNIX and Perl software.
Regular expressions allow you to construct a template or pattern for what you're searching for.
You can then use your pattern template to determine whether a given text fragment matches
your pattern.
For example, suppose you wanted to find all records beginning with the letter n. You would
then want to construct a regular expression that would have the meaning "has a letter n as the
first character on the line". The regular expression for this is:
^n
The ^ in regular expression syntax means "beginning of line". Therefore ^n means "line
beginning with the letter n".
Next, we want to find records whose first word begins with n, and whose second word begins
with the letter g. Let's say we also don't care whether the letters are upper or lower case. Here is
the regular expression meaning "all lines whose first word begins with n and whose second
word begins with g":
^n.+\s+g.+
The three main components of the pattern are 'n', '\s', and 'g'. The n means the letter n, the g the
letter g, and the \s is a special character meaning "white space", or "any spaces", which could be
a space, a tab, or a line break. Notice that both the n and the g are followed by a period. The
period in regular expression syntax means "any character". Therefore, n. or g. means n followed
any character and g followed by any character, respectively.
Finally, notice the 3 plus signs. A plus sign (+) in regular expressions means "one or more" and
it always applies to the character immediately preceding it. Therefore, a+ means "one or more
a's", "\s+" means "one or more white spaces", etc. Since . means "any character", then, .+ means
"one or more of any character", and "n.+" means "the letter n followed by one or more letters.
187
TIBCO Spotfire DecisionSite 9.1.1 for Lead Discovery - User's Manual
Therefore, ^n.+\s+g.+ means "an n at the beginning of the line followed by one or more
characters followed by one or more spaces, tabs, etc., followed by a g, followed by one or more
characters".
For a more thorough tutorial on regular expressions, a good source is the O'Reilly & Associates
nutshell guide to either Sed & Awk or Perl. These are UNIX programming languages which are
based heavily on regular expression pattern matching, and the O'Reilly guide for each of these
languages contains a chapter devoted to regular expressions.
Microsoft's MSDN web site offers a complete reference to the symbols that can be used with
Spotfire DecisionSite full text query devices.
5.4.4
List of Regular Expression Symbols
Symbol
Description
Positions
^
Only match the beginning of a string.
"^T" matches the first "T" in "To Be Or Not To Be"
$
Only match the ending of a string.
"t$" matches the last "t" in "A cat in the hat"
\b
Matches any word boundary
"ly\b" matches "ly" in "probably not"
Literals
Alphanumeric
Matches alphabetical and numerical characters literally.
\n
Matches a new line
\f
Matches a form feed
\r
Matches carriage return
\t
Matches horizontal tab
\v
Matches vertical tab
\?
Matches ?
\*
Matches *
\+
Matches +
\.
Matches .
\|
Matches |
\{
Matches {
\}
Matches }
\\
Matches \
\[
Matches [
\]
Matches ]
\(
Matches (
\)
Matches )
Character Classes
[xyz]
188
Match any one character enclosed in the character set.
"[a-e]" matches "b" in "basketball".
Query Devices
[^xyz]
Match any one character not enclosed in the character set.
"[^a-e]" matches "s" in "basketball".
.
Match any character except \n.
\w
Match any word character.
Equivalent to [a-zA-Z_0-9].
\W
Match any non-word character.
Equivalent to [^a-zA-Z_0-9].
\d
Match any digit. Equivalent to [0-9].
\D
Match any non-digit. Equivalent to [^0-9].
\s
Match any whitespace character.
Equivalent to [ \t\r\n\v\f].
\S
Match any non-whitespace character.
Equivalent to [^ \t\r\n\v\f].
Repetition
5.5
{x}
Match exactly x occurrences of a regular expression.
"\d{5}" matches 5 digits.
(x,}
Match x or more occurrences of a regular expression.
"\s{2,}" matches at least 2 space characters.
{x,y}
Matches x to y number of occurrences of a regular
expression.
"\d{2,3}" matches at least 2 but no more than 3 digits.
?
Match zero or one occurrences. Equivalent to {0,1}.
"a\s?b" matches "ab" or "a b".
*
Match zero or more occurrences.
Equivalent to {0,}.
+
Match one or more occurrences.
Equivalent to {1,}.
Check Boxes
The Check box query device presents a set of check boxes—one for each unique value present
in the column. One or several boxes may be selected or cleared to determine which values are
to appear in the visualizations. If all records with a certain value are deselected by some other
query device the label of that value becomes red.
189
TIBCO Spotfire DecisionSite 9.1.1 for Lead Discovery - User's Manual
A check box query device applied to the column Subject of the Film database. Coloring is set to
categorical; ticking a check box causes all records of that particular color to show (unless they
are deselected by another query device).
By default Spotfire DecisionSite assigns check boxes to any column containing ten values or
less. Initially boxes all are selected, which makes all records in the data set visible. For quick
selecting or clearing of all the values, right click on the check boxes query device, and select
All or None from the pop-up menu.
Like radio buttons, check boxes provide options that are either On or Off. Check boxes differ
from radio buttons in that you typically use check boxes for independent or nonexclusive
choices.
5.6
Radio Button
In a radio button query device, a radio button represents each data item. Radio buttons, also
referred to as option buttons, represent a single choice within a limited set of mutually exclusive
choices. That is, in any group of option buttons, only one option in the group can be set at a
time. However an "All" option is always present among the radio buttons, which lets you select
all records. Items that are selected in the global context are marked with black labels, while
globally deselected items have red labels.
The radio buttons query device, like the check boxes, presents a list of all values stored in a
column, but allows only one value to be selected at any given time. When a new value is
selected, the old one is deselected.
5.7
Changing the Type of Query Devices
Spotfire DecisionSite makes an initial suggestion of what query device to use for each column
in the data set. The type of query device to use for the column can then be changed, with one
restriction: check boxes and radio buttons can only be used for columns having less than 500
unique values.
190
Query Devices
The query device pop-up menu. The currently selected query device is marked with a bullet.
► To change the type of query device:
•
•
5.8
Right-click the query device to make the pop-up menu appear. Select the appropriate
query device option from the pop-up menu, or
select the Columns tab of the Properties dialog. This tab contains a list of all the
columns in the data set. Mark a column and select the type of query device to use for
that column.
Moving Individual Query Devices
Working with data sets containing a large number of columns does not necessarily mean that
you need to manipulate them all at once. A more useful strategy is to select a few parameters, to
see how they interact with each other. For this reason you may want to regroup them and
rearrange their order, so that you do not have to scroll up and down to keep track of the
changes.
The initial order of the Query Devices depends on the structure of the data set loaded into
Spotfire DecisionSite or the SQL query that was used to acquire data. You can change this as
needed by rearranging columns in the originating spreadsheet program or writing the SQL
query in a certain order.
► To change the order of the query devices:
1.
Right-click on the query device to be moved. A pop-up menu will open.
191
TIBCO Spotfire DecisionSite 9.1.1 for Lead Discovery - User's Manual
2.
3.
5.9
Place the cursor over the Move option. A submenu will appear.
Choose the command that reflects the direction in which to move the device. The
options Up and Down move it one step upwards or downwards respectively. The
options To the top and To the bottom make the query device the topmost or
bottommost device respectively.
Sorting the Query Devices
The order of the query devices can be sorted in four ways: by original order, by annotation, by
name, or by type. For example, you can group all range sliders together, or sort the query
devices in alphabetical order.
► To sort the query devices:
1.
192
Right-click on a query device.
Query Devices
2.
Select Sort from the pop-up menu.
3. Select Original, by Annotation, by Name, or by Type.
Note: Sorting by Type means the type of Query Device, not the type of the column itself
(Integer, String, etc.).
5.10
Hiding a Query Device
Right-click on the query device to be hidden. From the Move sub-menu of the pop-up menu
that appears, choose Hide. Or deselect Show Query Device in the Columns tab of the
Properties dialog, while having the correct column marked. A hidden query device can only be
brought back by reselecting the Show Query Device option in the Columns tab.
193
TIBCO Spotfire DecisionSite 9.1.1 for Lead Discovery - User's Manual
To hide the Query devices window altogether, either clear the check mark next to Query
devices in the View menu or click on the small X beside the parallel bars at the edge of the
window.
5.11
Entering a Value for a Slider
A minimum or maximum value can be typed into a range slider, item slider or the full-text
search slider. There are two ways of doing this:
► To enter a minimum value:
1.
2.
Double-click on the number above the left drag box.
Type the desired minimum value, and press ENTER.
► To enter a minimum value:
1.
2.
194
Click on the left drag box.
Type the desired minimum value.
Query Devices
► To move the full-text search slider:
1.
2.
Click on the drag box.
Type the desired value.
Note the difference between entering a value in the full-text search field (which filters
out a subset of the data set, in this example all countries containing the letters "land"),
and entering a value on the drag box (which moves the slider, in this example the first
country containing the letters "Eng").
Note: Note that no "edit field" will appear in which to type the value. Simply type the value
after clicking, and the slider will adjust itself.
Note: An item slider or full-text search slider will adjust itself to the existing value nearest
possible to the value you typed, where as a range slider will adjust to the exact value you typed.
5.12
Indicators
The Query Devices can display two types of indicators: a paper clip icon which indicates that
the column has an annotation, and a letter 'e' which indicates that the column contains empty
values.
In order to see these indicators you must switch on this option. Do this by opening the Columns
tab of the Properties dialog. Then select the check box marked Show indicators in query
devices.
Annotating columns
See Annotating Columns for more information.
Empty values
By default, the query device shows records with null or empty values. When a column contains
empty values a black colored letter 'e' is displayed in the upper right corner of the query device.
You can choose to hide records with empty values by clearing the check box Show Empty
values from the Columns tab of the Properties dialog, or by deselecting the menu item Show
Empty Values from the query device pop-up menu. The 'e' will then turn red.
5.13
Changing Column Name
You can easily change the name of a column and its corresponding query device by doubleclicking on the query device.
► To change the column name:
1.
2.
5.14
Double-click on the name of the query device you wish to rename.
Type a new column name in the text field that appears, and press Enter.
Quick Access to Color and Size Properties
A quick way of setting the color or size property in the current visualization is to right-click on
the query device representing the column, and selecting the appropriate property from the Set
property sub menu that appears.
195
TIBCO Spotfire DecisionSite 9.1.1 for Lead Discovery - User's Manual
5.15
Initial Query Device Selection
Spotfire DecisionSite's default choice of query devices is based on the column content and the
number of unique values present in the data set for that attribute.
If a column contains 10 unique values or less, check boxes will be assigned as query device.
For columns containing more than 10 values, an item slider is chosen for alphanumeric (string)
attributes, such as names and descriptions. Range sliders are assigned to numeric columns like
date, time, and decimal or integer values.
196
Details-on-Demand and Legend
6
6.1
Details-on-Demand and Legend
Details-on-Demand
The Details-on-Demand window displays the actual values of marked or active records. For
objects that consist of multiple records (such as pies, bars, etc.) the Details-on-Demand window
displays information appropriate to that object, such as average value, number of values, etc.
Presenting the Details-on-Demand
There are three different ways in which the information can be presented:
• As plain text in the details frame (default).
• As an HTML document based on Microsoft Internet Explorer displayed in the Detailson-Demand window.
• As an HTML based document in an external browser.
The HTML based details information can be formatted using the templates in the Data and
Background tab of the Properties dialog. The bar chart and the pie chart have their own
HTML templates. Details for the other visualizations are controlled by a set of templates
working on active or marked records. The HTML based presentation can use all functions
provided by modern browsers, e.g., images, tables, links to the Internet and Java applets.
Further manipulation of the HTML template is described below.
6.2
Plain Text
By default, Details-on-Demand displays data in plain text. The details window is placed in the
lower right corner of the main window. It can of course be moved to another location if
desirable. The details for a single active record are presented in a vertical table, those for
several marked records in a horizontal table.
Adjusting column width
The width of the columns in the Details-on-Demand text display can be adjusted. By default the
width is as wide as the header of the column. To change the width, place the mouse pointer on
the separating line in the column header. The mouse pointer will change shape as shown in the
illustration below. Click-and-drag the separator to the desired position. If you double click on
the separator, the column width will collapse or expand to fit the longest value in the table.
197
TIBCO Spotfire DecisionSite 9.1.1 for Lead Discovery - User's Manual
Note: Columns can be completely hidden from view. To find a column that accidentally has
been minimized, move the separator along the column headers until it is changed into a double
separator as seen below, then click and drag to resize the hidden column.
Sorting values in columns
The values in all columns in the Details-on-Demand window can be sorted alphabetically
and/or numerically. You can use either increasing or decreasing sort order.
► To sort a Details-on-Demand column:
1.
Click on a column heading.
2.
The column is now sorted in increasing order. Click on the column heading again to
toggle between increasing and decreasing order. Note the small arrow beside the
column title, showing the sorted order.
3.
To revert to the original order, right-click in the Details-on-Demand window and select
Reset > Row Order from the pop-up menu.
Rearranging column order
The horizontal order of the Details-on-Demand columns can be rearranged.
198
Details-on-Demand and Legend
► To rearrange column order:
1.
2.
3.
6.3
Place the mouse pointer on a column heading.
Drag-and-drop the column heading to the left or right, to the desired place among the
other column headings.
To revert to the original order, right-click in the Details-on-Demand window and select
Reset > Column Order from the pop-up menu.
Locking the Details-on-Demand Window
The Details-on-Demand information can be locked to always show a certain category of
records; Selected, Marked or Active. This "lock function" is controlled by the Auto-Switch
option. (See Marking, Activating and Highlighting in the Visualizations chapter for more
information.)
By turning Auto-Switch on, the Details-on-Demand window automatically updates the Detailson-Demand window if you mark new records or make one record active.
However, if you turn Auto-Switch off, the Details-on-Demand window will only show
information about a certain category of your choice.
Example: You choose to display only Selected records by turning Auto-Switch off, and
selecting the Selected Records option. Then you click on a record, which makes it Active. This
will not cause the Details-on-Demand window to show information about that particular record,
but instead it continues to display information about the currently Selected records.
► To always show selected records:
1.
2.
Right-click in the Details-on-Demand window. A pop-up menu appears.
Clear the Auto-Switch option. (No checkmark should be shown to the left of the
option).
3.
Select Selected Records from the same pop-up menu.
Making a record active in the visualization will now have no effect on the Details-onDemand window. The Details-on-Demand window will always display information
about the currently selected records. If you use the Query Devices or zoom bars to
change the selected records, the information in the window will be updated.
Note: The Limit maximum number of records shown option that can be found in the Data
and Background tab of the Properties dialog applies only to the HTML Details-on-Demand, not
to the text Details-on-Demand.
199
TIBCO Spotfire DecisionSite 9.1.1 for Lead Discovery - User's Manual
6.4
HTML
Spotfire DecisionSite can display the data for active or marked records as an HTML formatted
document in the details frame. This is initialized by selecting View > Details on Demand
(Html).
Spotfire DecisionSite uses the HTML template specified for the data set to lay out the
information. If no template has been defined, the application will provide a default template for
the type of visualization that is active.
It is also possible to launch an external browser, such as Netscape or Internet Explorer, to view
the details of the data. To do so, select View > Details on Demand (External Browser).
6.5
Editing HTML Templates
The HTML templates used for formatting record details are accessed and edited through the
Data and Background tab of the Properties dialog box. There are six editable templates, one
each for:
• Pie – highlighted pie details.
• Bar – highlighted bar details.
• Active Marker – these are individual records in scatter plots, profile charts, line charts,
tables or heat maps that have been clicked on.
• Marked Records Header – the header part of the Details-on-Demand (DoD) shown for
marked records in all types of plots.
• Marked Records Body – the body part of the DoD shown for marked records in all
types of plots.
• Marked Records Footer – the footer part of the DoD shown for marked records in all
types of plots.
When some records have been marked or activated, the details of those records are presented
according to the three marked records templates.
The Edit... button brings up an edit box in which you can edit the selected template. In the
HTML editing window you have several possibilities for creating and modifying the template.
200
Details-on-Demand and Legend
The HTML Edit window for the Marked records Header.
The Load button allows you to browse for an external file and use it as the template. Here, you
can also load a template file that you previously have edited for the current or for a different
data set. The Save As... button saves the changes in an external HTML file that can be used to
format information in other DecisionSite sessions. The Default button will revert to the default
settings and remove any changes made to the open template. OK applies the editing changes to
the Details-on Demand window. Cancel removes any changes you have made since opening
the Edit window.
When a new data set is loaded into Spotfire DecisionSite, the program creates default HTML
templates that can be edited to suit your needs.
Tip: The HTML templates made for another data set will also be applied to the presently
loaded data set if you apply the previously created data set as a template (File > Apply
Template). In this case, not only the HTML Details-on-Demand, but also any visualization
settings, query device settings and general settings will be applied. See Applying Templates for
more information. For a template file to work properly, it should only be applied to data with a
structure similar to the one used to create the template.
Variables
In the HTML templates, variables that refer to the value of a specific column or to other
information can be used, which will then be replaced with current values from any active or
marked record:
HTML variable
Refers to
$(Name)
Value of a particular record in column 'Name'.
$Format(Name)
Value of a particular record in column "Name",
formatted according to the configured number
formatting for the column and the Windows locale.
$(DBDIR)
The full path to the location of the directory of the
current database (file), including a trailing backslash.
$(DBPATH)
The full path, including the file name, of the currently
loaded database.
201
TIBCO Spotfire DecisionSite 9.1.1 for Lead Discovery - User's Manual
$(DBFILE)
The name of the currently loaded database, including the
file extension (.skv, .csv, etc.).
$(DBNAME)
The name of the currently loaded database, excluding the
file extension.
Additional variables for displaying descriptive statistics about the data set are described below.
6.6
Descriptive Statistics for HTML Templates
The following variables may be added into the HTML template to display information about the
records.
6.7
Measurement
Variable
Explanation
VISIBLE
$(VISIBLE)
# of visible points
MARKED
$(MARKED)
# of marked points
SELECTED
$(SELECTED)
# of selected points
ALL
$(ALL)
# total
Editing HTML: An Example
There is a plethora of literature on HTML programming. This example is merely a short
demonstration of changing the colors and typeface of the displayed details.
► To alter the appearance of the Details-on-Demand presentation:
1.
2.
3.
4.
Load a data set. In this example we will use the periodic.csv data set.
Select Edit > Properties, then click on the Data and Background tab.
From the Template drop-down list in the middle of the tab, select Marked Records
Header and click on the Edit... button.
Add the following lines of code inside the header of the HTML page to present text in
a straight typeface:
<style>
td {font: 10pt 'Helvetica'}
</style>
5.
Note: This should be placed above the body of the template to affect the entire
presentation. Notice also the use of 'curly brackets'.
Further down in the body, change the background color of the body to light blue by
changing the color definition from #ffffff - white - to light blue:
bgcolor="#ddeeff"
6.
Add the following line of code above the titles to make the title line appear with a light
yellow background:
<tr bgcolor="#ffff77">
202
Details-on-Demand and Legend
7. Click OK.
Select View > Details-on-Demand (External Browser).
Each time you mark a number of records the details will be presented in a horizontal table in
your web browser.
6.8
Information About the Data Set
The record meter in the status bar at the bottom of the Spotfire DecisionSite gives continuous
information about visualization statistics. You can see at a glance what portion of all the data is
currently visible, marked, etc. The same information is displayed as text.
Colors should be read as follows:
Green – Records that are selected and marked.
Yellow – Records that are selected and unmarked.
Gray – Records that are selected, but lack a value required for representation on the current
axes, and hence are invisible.
The sum of the above makes up the set of selected records. The length of the record meter in
relation to the box in which it sits is an indication of the relative size of the current selection.
To display or hide the status bar, use the Status Bar command in the View menu.
6.9
Legend
The markers of various plots can be colored to indicate a certain parameter. By showing the
Legend window you can easily see what the color of a marker means. For Scatter Plots the
203
TIBCO Spotfire DecisionSite 9.1.1 for Lead Discovery - User's Manual
Legend also explains the significance of other visualization settings, that is, which columns are
used for size, rotation, etc.
For other plots the Legend displays information about their relevant parameters. For example,
in Bar Charts the Legend states what the height of the bars represents, and in Pie Charts the
Legend states if the size of a pie corresponds to a certain parameter.
Also, if the plot has any active Statistical Measures, these will be described in the Legend.
► To display the Legend window:
Select View > Legend.
204
Working with the Data
7
7.1
7.1.1
Working with the Data
Add Columns
Add Columns Overview
The Add Columns tool allows you to incorporate new columns into your current data set. Data
can be added from a file, from the clipboard or by being opened and conditioned using
advanced data import. The new columns are appended to the data set.
Note: When you are using the Add Columns tool, it is not possible to save the resulting data set
as linked data. Only embedded data is supported. See Saving Spotfire files for more
information.
7.1.2
7.1.2.1
Using Add Columns
Adding Columns from a File
Note: The matching of values in the selected ID columns is case sensitive. If existing record
IDs are missing in the file which is merged into the data set, the values in the new column will
be empty for these records. Records with IDs that do not exist in the original data set will not be
added at all.
► To add columns from a file to an open data set:
1.
2.
3.
4.
5.
6.
7.
Select Data > Add Columns....
Response: The Add Columns - Select Source dialog is opened.
Click the File radio button.
Click Browse... and open the file from which you want to add columns.
Comment: You can also type the path and file name directly in the text box.
Comment: Common formats like CSV, TXT, XLS, SKV, SFS, SFA or XSF can be
opened.
Click to select a Column match method. (In this step instruction it is assumed that
you select Manual.)
Comment: If Automatic is selected, identifier columns with identical names (not case
sensitive) must exist in both the old and the new data set. All columns with identical
names will be used as identifier columns (implicit primary key matching). The new
data set must also contain at least one new column. Clicking Finish in the first step of
the wizard will add all columns with names that do not exist in the current data set.
Clicking Next > will take you to the Add Columns - Select Columns dialog where you
can select which columns to add.
Manual allows you to select which columns to use in the matching of identifiers
(explicit primary key matching). Use this option if you want to make sure that the
matching is correct.
Click Next >.
Response: The Add Columns - Select Matching Columns dialog is displayed.
If you have selected a Microsoft® Excel file, a second dialog is opened where you can
choose the table or data sheet where the desired information is located. When you are
done with your selections, click OK to reach the Add Columns - Select Matching
Columns dialog.
Click to select a column from the Columns in new data set that you want to use to
map against your current data.
205
TIBCO Spotfire DecisionSite 9.1.1 for Lead Discovery - User's Manual
Comment: This should be some kind of ID column (preferably containing unique
identifiers). If a record in this column is missing in the current data set, the record will
not be added to the data set. For information about how non-unique values are
handled, see Details on how data are added.
Comment: If a column has already been used in a matching, it will not be available in
the Columns in new data set list. Select a column pair in the Matching columns list and
click on Remove to make the columns available in the two selection lists again.
8. Click to select a column from the Columns in current data set.
Comment: This should be some kind of ID column (preferably containing unique
identifiers). For information about how non-unique values are handled, see Details on
how data are added.
9. Click Add Match.
Comment: The selected column pair is moved to the Matching columns list box. If
desired, it is possible to use multiple key pairs. In this case, only records that have
identical values in all of the selected column pairs will be added to the data set. For
more information, see Details on how data are added.
10. Click Next >.
Response: The Add Columns - Select Columns dialog is displayed.
Comment: Clicking Finish in the second step of the wizard will perform the addition
of columns by adding all columns from the new data set that were not selected among
the Matching columns above to the current data set.
11. Click to select the columns to actually include in your data set.
Comment: If a column to include has the same name as one of the columns already in
the data set, it will be added with the suffix (1), (2), etc.
12. Click Finish.
Response: The new columns are added and query devices representing the new
columns are shown in Spotfire DecisionSite. (You may have to scroll down in the
Query Devices window to see the new query devices.)
7.1.2.2
Adding Columns from the Clipboard
Note: The matching of values in the selected ID columns is case sensitive. If existing record
IDs are missing in the file which is merged into the data set, the values in the new column will
be empty for these records. Records with IDs that do not exist in the original data set will not be
added at all.
► To add columns from the clipboard to an open data set:
1.
2.
3.
4.
206
Copy the columns that you want to add (e.g., from an Excel data sheet) together with
one or more ID columns to be used in the matching against the current data set.
Select Data > Add Columns....
Response: The Add Columns - Select Source dialog is opened.
Click the Clipboard radio button.
Click to select a Column match method. (In this step instruction it is assumed that
you select Manual.)
Comment: If Automatic is selected, identifier columns with identical names (not case
sensitive) must exist in both the old and the new data set. All columns with identical
names will be used as identifier columns (implicit primary key matching). The new
data set must also contain at least one new column. Clicking Finish in the first step of
the wizard will add all columns with names that do not exist in the current data set.
Clicking Next > will take you to the Add Columns - Select Columns dialog where you
can select which columns to add.
Manual allows you to select which columns to use in the matching of identifiers
(explicit primary key matching). Use this option if you want to make sure that the
matching is correct.
Working with the Data
5.
Click Next >.
Response: The Add Columns - Select Matching Columns dialog is displayed.
6. Click to select a column from the Columns in new data set that you want to use to
map against your current data.
Comment: This should be some kind of ID column (preferably containing unique
identifiers). If a record in this column is missing in the current data set, the record will
not be added to the data set. For information about how non-unique values are
handled, see Details on how data are added.
Comment: If a column has already been used in a matching, it will not be available in
the Columns in new data set list. Select a column pair in the Matching columns list and
click on Remove to make the columns available in the two selection lists again.
7. Click to select a column from the Columns in current data set.
Comment: This should be some kind of ID column (preferably containing unique
identifiers). For information about how non-unique values are handled, see Details on
how data are added.
8. Click Add Match.
Comment: The selected column pair is moved to the Matching columns list box. If
desired, it is possible to use multiple key pairs. In this case, only records that have
identical values in all of the selected column pairs will be added to the data set. For
more information, see Details on how data are added.
9. Click Next >.
Response: The Add Columns - Select Columns dialog is displayed.
Comment: Clicking Finish in the second step of the wizard will perform the addition
of columns by adding all columns from the new data set that were not selected among
the Matching columns above to the current data set.
10. Click to select the columns to actually include in your data set.
Comment: If a column to include has the same name as one of the columns already in
the data set, it will be added with the suffix (1), (2), etc.
11. Click Finish.
Response: The new columns are added and query devices representing the new
columns are shown in Spotfire DecisionSite. (You may have to scroll down in the
Query Devices window to see the new query devices.)
7.1.2.3
Adding Columns using Advanced Data Import
The Advanced Data Import option in the Add Columns tool can be used to add columns to a
data set from a different source than a file or the clipboard (e.g., from a database). It can also be
used if the delimiter or data type must be modified to retrieve the data properly.
Note: The matching of values in the selected ID columns is case sensitive. If existing record
IDs are missing in the file which is merged into the data set, the values in the new column will
be empty for these records. Records with IDs that do not exist in the original data set will not be
added at all.
► To add columns using advanced data import:
1.
2.
3.
Select Data > Add Columns....
Response: The Add Columns - Select Source dialog is opened.
Click the Advanced Data Import radio button.
Click to select a Column match method. (In this step instruction it is assumed that
you select Manual.)
Comment: If Automatic is selected, identifier columns with identical names (not case
sensitive) must exist in both the old and the new data set. All columns with identical
names will be used as identifier columns (implicit primary key matching). The new
data set must also contain at least one new column.
207
TIBCO Spotfire DecisionSite 9.1.1 for Lead Discovery - User's Manual
4.
5.
6.
7.
8.
9.
10.
11.
12.
13.
14.
208
Manual allows you to select which columns to use in the matching of identifiers
(explicit primary key matching). Use this option if you want to make sure that the
matching is correct.
Click Next >.
Response: The Import Data - Select Data Source dialog is displayed.
Click to select whether to add data from a File, a Database or the Clipboard or use
one of the Advanced options.
Click Next >.
Response: The Import Data - Data Conditioning dialog is displayed. (If you have
selected one of the Advanced options you may be Guided through other wizards prior
to reaching this dialog. See the online help for the wizard you are using for more
information).
If desired, select a data conditioning method from the drop-down list.
Comment: It is possible to pivot data using a Tall/Skinny => Short/Wide converter or
to use the Case normalizer to remove duplicate strings based on case insensitive
comparison. For more information about the conditioning methods, see Data
Conditioning.
Click Finish.
Response: The Add Columns - Select Matching Columns dialog is displayed.
Comment: If you have selected Automatic as the Column Match method you will go
straight to the Add Columns - Select Columns dialog where you can select which
columns to add.
Click to select a column from the Columns in new data set that you want to use to
map against your current data.
Comment: This should be some kind of ID column (preferably containing unique
identifiers). If a record in this column is missing in the current data set, the record will
not be added to the data set. For information about how non-unique values are
handled, see Details on how data are added.
Comment: If a column has already been used in a matching, it will not be available in
the Columns in new data set list. Select a column pair in the Matching columns list and
click on Remove to make the columns available in the two selection lists again.
Click to select a column from the Columns in current data set.
Comment: This should be some kind of ID column (preferably containing unique
identifiers). For information about how non-unique values are handled, see Details on
how data are added.
Click Add Match.
Comment: The selected column pair is moved to the Matching columns list box. If
desired, it is possible to use multiple key pairs. In this case, only records that have
identical values in all of the selected column pairs will be added to the data set. For
more information, see Details on how data are added.
Click Next >.
Response: The Add Columns - Select Columns dialog is displayed.
Comment: Clicking Finish here will perform the addition of columns by adding all
columns from the new data set that were not selected among the Matching columns
above to the current data set.
Click to select the columns to actually include in your data set.
Comment: If a column to include has the same name as one of the columns already in
the data set, it will be added with the suffix (1), (2), etc.
Click Finish.
Response: The new columns are added and query devices representing the new
columns are shown in Spotfire DecisionSite. (You may have to scroll down in the
Query Devices window to see the new query devices.)
Working with the Data
7.1.2.4
Adding Columns if Case Mismatches
Since the matching of values in the ID columns is based on a case-sensitive comparison, adding
a column where the IDs are in lower case to a data set where the IDs are in upper case will not
result in any values being added to the existing data. In this case, it can be useful to add a new
column with all values expressed in lower case (or upper case) prior to the merge of new
columns.
► To create an all lower case ID column in the current data set:
1.
Select Data > New Column > From Expression... from the menu bar in Spotfire
DecisionSite.
Response: The New Column from Expression - Enter Expression: Step 1(2) dialog is
displayed.
2. Click to select the column you want to convert to lower case.
3. In the Category drop-down list on the right, select Text Functions.
4. In the Function list box, select Lower.
5. Click Insert Function.
Response: The function Lower () is inserted into the Expression box.
6. Click Insert Columns to use the column selected in step 1 as an argument to the
function.
7. Click Next >.
Response: The New Column from Expression - Specify Column: Step 2(2) dialog is
displayed.
8. Type a suitable name for the new column.
9. Click Finish.
Response: The column is added to the data set.
10. Use this column to match against the ID column of the new data set in the Add
Columns wizard.
7.1.3
7.1.3.1
User Interface
Add Columns - Select Source Dialog
Option
Description
File
Click this radio button and enter a path and a file name in the text box
209
TIBCO Spotfire DecisionSite 9.1.1 for Lead Discovery - User's Manual
or click Browse... to locate a file containing the data that you want to
add.
Browse...
Opens the Choose file dialog where you can select which file to open.
Clipboard
Click this radio button to add columns from a data set on the
clipboard.
Advanced Data
Import
Click this radio button to add data from a source other than a file or
the clipboard (e.g., from a database). This option can also be used if
the delimiter or data type must be modified to retrieve the data
properly.
Clicking Next > will display the Import Data wizard. For more
information about the Import Data wizard, see Importing Data.
Automatic
Spotfire DecisionSite will automatically match columns with
identical names (implicit primary key matching). Note: If you have
columns with identical names that do not contain the same identifiers,
this option might result in that no data is added. In that case, it is
probably better to use the Manual option (see below), and match on
columns that contain correct identifiers.
Manual
Select this option if you want to be able to select which columns to
use in the matching of IDs (explicit primary key matching). Use this
option if you want to make sure that the matching is correct.
Next >
Takes you on to the next step of the wizard. If Automatic has been
selected as the Column match method you will go straight to the Add
Columns - Select Source dialog. If Manual has been selected you will
be Guided to the Add Columns - Select Matching Columns dialog.
Finish
Only available if the Automatic Column match method has been
selected. All columns in the new and old data set that have identical
names (not case sensitive) will be used as identifier columns. This
means that all values in all of the identifier columns must match for
the data to be added. All columns with names that do not exist in the
current data set will be added.
► To reach the Add Columns - Select Source dialog:
Select Data > Add Columns....
7.1.3.2
Add Columns - Select Matching Columns Dialog
This dialog is used to specify which columns should be used as keys in the merging of the new
columns with the columns in the original data set. Normally, one column pair containing IDs is
enough, but in some cases it may be necessary to use two or more column pairs to create unique
mappings between the two data sets.
Note: If the data types of your ID columns mismatch, click < Back and use the Advanced data
import option to specify your data types manually (or add a type definition row to your data set
prior to using the Add Columns tool).
210
Working with the Data
Option
Description
Show ToolTips
If selected, a ToolTip displaying the name and type of the column
together with the content of the first five unique records is shown
upon hovering over a column name with the mouse pointer.
Displaying ToolTips might take some time if you are connected to
a remote or slow data source. In that case, you might want to clear
the check box and avoid displaying ToolTips.
Columns in new data
set
Displays the columns in the new data set that are available for use
in a matching columns pair.
A column can only be used in a single column pair matching at a
time and will therefore be grayed out in this list box after it has
been included in the Matching columns list box.
Columns in current
data set
Displays the columns in the current data set that are available for
use in a column pair.
A column can only be used in a single column pair matching at a
time and will therefore be grayed out in this list box after it has
been included in the Matching columns list box.
Add Match
Select an ID column in both list boxes above and click Add Match
to add the pair to the Matching columns list box.
211
TIBCO Spotfire DecisionSite 9.1.1 for Lead Discovery - User's Manual
Remove
Select one or more column pairs in the Matching columns list box
and click this button to remove the pairs from the list. This will
return the columns to the list boxes of available columns above.
Matching columns
Displays the selected column pairs that specify how the merge
between the two data sets will be made. If more than one pair is
selected, only records that have identical values in all of the
selected column pairs will be added to the data set. For more
information, see Details on how data are added.
Finish
If Finish is clicked in the second step of the wizard, all columns in
the new data set that are not used as identifiers in the Matching
columns list will be added to the data set.
► To reach the Add Columns - Select Matching Columns dialog:
1.
2.
7.1.3.3
Select Data > Add Columns....
Make your choice in the Add Columns - Select Source dialog, make sure that you have
selected Manual as the Column match method, and click Next >.
Add Columns - Select Columns Dialog
The list box shows the columns available for import. All columns in the new data set are listed.
Per default, all new columns that are not included among the Matching columns in the previous
dialog will be selected. Click the name of the column you want to add. For multiple selection,
press Ctrl and click on the desired columns. You can also use Shift or drag the mouse over the
desired columns.
► To reach the Add Columns - Select Columns dialog:
1.
2.
3.
212
Select Data > Add Columns....
Make your choices in the Add Columns - Select Source dialog and click Next >.
Make your choices in the Add Columns - Select Matching Columns dialog and click
Next >.
Working with the Data
7.1.4
7.1.4.1
Theory and Methods
Details on How Data are Added
The merging is based on the selected ID fields of the current and the added data sets. The
matching of names is case sensitive. If existing record IDs are missing in the data which are
merged into the data set, the values in the new column will be empty for these records. Records
with IDs that do not exist in the original data set will not be added at all.
If multiple IDs exist in the data to be added, the value in the added column will be the first
record from the top in the data columns used for adding. See Example of adding columns with
multiple IDs for more information.
If multiple IDs exist in the current data set, all of the entries will receive the value from the
added column (the first in the column if there are multiple IDs in the column to be added (see
above)).
If several matching column pairs are selected in the Add Columns - Select Matching Columns
dialog, all values in the pairs must match for the data to be added. Multiple key pairs can be
used to create unique identifiers from several ID columns with multiple IDs.
Note: Empty values work in the same way as other values. Hence, if empty values exist in the
key column of the current data set and other records have empty values in the key for the
columns to be added, there is a major risk that values are added to the wrong records.
Therefore, it is advisable to not use columns containing empty values as key columns. See
Example of adding columns with empty values for more information.
7.1.4.2
Example of Adding Columns with Multiple IDs
Imagine that you have a data set with the following columns and records loaded into Spotfire
DecisionSite:
Last name
First name
Job title
Scott
Alice
Analyst
Ford
Henry
Analyst
Miller
John
Clerk
Smith
Jane
Clerk
Smith
George
Clerk
Note that there are two employees with the last name "Smith". Hence, the "Last name" column
does not contain unique identifiers.
Now you want to add information about the salary of each employee which is located in a
separate file or data sheet:
Last name
First name
Salary
Scott
Alice
3200
Miller
John
1300
Smith
Anastasia
4400
Smith
Jane
800
Smith
George
750
In this data set, the employee "Henry Ford" is missing and a person called "Anastasia Smith" is
included who was not a part of the original data set.
213
TIBCO Spotfire DecisionSite 9.1.1 for Lead Discovery - User's Manual
The Add Columns tool can add the Salary column with the following results, depending on
your selections in the Add Columns - Select Matching Columns dialog.
Matching columns:
Result:
Last name <-> Last name
All employees with the last name Smith get the value 4400
in the Salary column, since that was the first record for the
last name Smith in the new data set. Anastasia Smith will
not be added to the data set. No value is added for Henry
Ford (since he was not present in the new data set).
Last name <-> Last name
First name <-> First name
With both last name and first name used as key pairs, the
identification is unique and the correct salary is entered for
Jane and George Smith. This would be the correct way of
performing the merge.
7.1.4.3
Example of Adding Columns with Empty Values
If you have empty values in the ID column of the current data set and other records have empty
values in the ID column of the new data set, there is a major risk that values are added to the
wrong records. Take a look at this simple example where the current data set contains an empty
value:
Last name
First name
Job title
Scott
Alice
Analyst
Ford
Henry
Analyst
John
Clerk
Jane
Clerk
Smith
Now you want to add information about the salary of each employee which is located in a
separate file or data sheet:
Name
First name
Salary
Alice
3200
Ford
Henry
2800
Miller
John
1300
Smith
Jane
800
Note that there is another record that contains the empty value in this data set.
214
Working with the Data
Adding the column using Last name and Name as matching columns will produce the following
result:
The name Scott is missing in the new data set and Alice Scott will therefore not receive any
value in the Salary column. The person in the original data set where no last name was entered
(John) will be matched with the empty value in the new data set and, hence, receive the Salary
3200, even though this number has nothing to do with him. Selecting both last name and first
name as key columns would have produced empty values for both Alice Scott and John X,
which in this case would have been the correct procedure (unless it was possible to add the
correct last names to the data sets prior to import).
7.2
7.2.1
New Column by Binning
Different Binning Methods
Depending on the type of values in the columns (numeric or alphanumeric, continuous or
discrete) you may need to resort to different methods to rearrange the data. Spotfire
DecisionSite provides a variety of binning methods:
Specific Limits
This option allows you to explicitly enter the values of the limits to use for each bin. Enter the
value you wish to use for the limits of your bins and separate them with a semicolon. Do not
use a space character after the semicolon.
Even Intervals
The subranges suggested are equal in scope. This is the default method, dividing the value
range into equal intervals, and works for all data types except string. The current data range is
divided up into the desired number of bins. Empty values will be empty in the new column, and
when loading data sets from external sources (linked data) new values will be placed inside the
bin, or in the upper and lower bin respectively.
Even Distribution
The suggested division works for all data types and is made so that the bins each contain an
equal number of unique values. Extra values are placed in the final bins, so if you have four
values and you want three bins with one value in each bin, your final value will be placed in the
third bin. Empty values will be empty in the new column, and when loading data sets from
external sources (linked data) the even distribution will be recalculated.
Cherry Picking
This method works for all data types and allows you to manually select which value to put in
each bin. A list of all values in the column is shown. Cherry picking is useful when you want to
be very specific with how you group your values. It is not recommended to use cherry picking
when loading data sets from external sources (linked data) as the new values will become
empty values.
► To bin a column by Cherry Picking:
1.
2.
Select Data > New Column > By Binning....
Response: The New Column by Binning dialog is launched.
Select a Column to bin.
215
TIBCO Spotfire DecisionSite 9.1.1 for Lead Discovery - User's Manual
3.
4.
5.
6.
7.
8.
9.
Select Cherry Picking as method and click the Settings... button.
Response: The Cherry Picking dialog is launched.
To create a new bin, click New Bin.
Select the desired values in the Available values field, and click Add >> to add the
values to a bin.
Use the Rename Bin button (or F2) to rename bins.
When all values have been assigned a bin, click OK.
Type a New column name for the binned column or use the default name.
Click OK.
Based on Standard Deviation
This method works for numeric columns. The range is divided into sections as described by the
selected standard deviation multipliers. Bins are created using standard deviations +/- 0.5, 1, 2,
3, 6. In the example below, the range is divided into the following six subsections (µ denoting
the average value for the column and s the corresponding standard deviation):
lower limit -> (µ-3s)
(µ-3s) -> (µ-s)
(µ-s) -> µ
µ -> (µ+s)
(µ+s) -> (µ+3s)
(µ+3s) -> upper limit
Empty values will be empty in the new column, and when loading data sets from external
sources (linked data) the standard deviation will be recalculated.
Substring
This method works for all data types. It groups the records by the first or last characters of the
values in the column to be binned – the exact number of characters to take into account must be
supplied. Suppose the column to be binned contains family names, beginning with Adams and
ending with Winter. To bin the records according to the first letter in the name, use Divide by
Substring considering one character from the beginning. Bin names are generated from the
substring, and if Ignore case is used, the bin names are all formatted as upper case.
► To bin a column by substring:
1.
Select Data > New Column > By Binning....
Response: The New Column by Binning Dialog is launched.
2. Select a Column to bin.
3. Select the Substring radio button.
4. Decide whether to compare from the Beginning or End of the column value.
5. Set Positions to the number of characters that should be equal in each bin.
6. Select whether to Ignore case, that is whether "adams" and "Adams" would be
considered the same or not.
Note: If the Positions is three and Ignore case is selected, the bin name in this example
would be ADA.
7. Type a New column name for the binned column or use the default name.
8. Click OK.
Response: The Edit Bin Names dialog is launched.
9. Give the bins new names, if desired.
10. Click OK.
Empty values will be empty in the new column, and when loading data sets from external
sources (linked data) the new values will be placed in new bins, taking the substrings into
consideration.
216
Working with the Data
7.2.2
Performing Binning
► To perform binning:
1.
2.
3.
4.
5.
6.
Select Data > New Column > By Binning....
Response: The New Column by Binning dialog in launched.
Note: You can also reach this dialog by right-clicking in the Query Device window
and selecting New Column > By Binning....
From the drop-down list, select the name of the column that you want to bin.
Select the desired binning method and enter the respective values.
Type a New column name for the binned column or use the default name.
Click OK.
Response: The Edit Bin Names dialog is launched.
Enter the desired bin names and click OK to create the new column. This column can
now be used as any other Spotfire DecisionSite column.
217
TIBCO Spotfire DecisionSite 9.1.1 for Lead Discovery - User's Manual
7.2.3
7.2.3.1
218
User Interface
New Column by Binning Dialog
Option
Description
Column
Displays the available columns on which you can perform binning. The
values from this column will be sorted into several bins or categories
based on your selections.
Specific limits
Allows you to explicitly enter the desired values of the limits to use for
each bin. Enter the value you wish to use for the limits of your bins and
separate them with a semicolon.
Even intervals
Allows you to specify the desired number of bins and divides the value
range into equal intervals.
Even distribution
Allows you to specify the desired number of bins and divides the bins
so that each one contains an equal number of unique values.
Cherry picking
The Settings... button opens the Cherry Picking dialog where you can
manually select which value to put in each bin.
Working with the Data
Based on standard The range is divided into sections as described by the selected standard
deviation multipliers.
deviation
Substring
Groups the records by the first or last characters of the values in the
column to be binned.
Note: The exact number of characters to take into account must be
supplied.
New column name Here you supply the binned column with an appropriate name.
► To reach the New Column by Binning dialog:
Select Data > New Column > By Binning... or right-click in the Query Device window and
select New Column > By Binning....
7.2.3.2
Cherry Picking Dialog
Option
Description
Available values
The values available for use in the binning.
Click a value in the list to select it. To select more than one value, press
Ctrl and click the values in the list.
Add >>
Moves selected columns from the Available values field to the selected
bin in the Bins field.
<< Remove
Removes a column and brings it back to the Available values field.
New Bin
Creates a new bin into which you can add values from the Available
values field.
Rename Bin
Allows you to rename the bins with names of your choosing.
219
TIBCO Spotfire DecisionSite 9.1.1 for Lead Discovery - User's Manual
7.2.3.3
7.3
7.3.1
Edit Bin Names Dialog
Option
Description
Bin name
Displays the default names from the New Column by Binning dialog.
New name
Allows you to rename the bins with names of your own choosing.
Double-click on a bin to change the name.
Note: You are not required to change the names of the bins. If you feel
the default names are sufficient, simply click OK.
New Column from Marked Records
New Column from Marked Records Dialog
When you have found an interesting subset in the data, you can mark these records and then
create a new column indicating for each record whether it is part of the subset or not. By doing
so, you will be able to toggle the subset, and also the records excluded from the subset.
Note: Columns created from marked records cannot be saved in templates (SFT files) and
cannot be saved as linked data.
220
Working with the Data
Option
Description
Name
Type a suitable name for the column to be created.
Label for marked
records
Type a name for the value associated with marked records.
Type a name for the value associated with unmarked records.
Label for
unmarked records
► To reach the New Column from Marked Records dialog:
Select Data > New Column > From Marked Records... or right-click in the Query Device
window and select New Column > From Marked Records....
7.4
7.4.1
New Column from Expression
Calculating Columns
New columns can be computed from the current data set by using mathematical and logical
expressions. This chapter describes how to create and evaluate such expressions using the New
Column from Expression tool.
7.4.2
Workflow of the New Column from Expression Tool
Occasionally the columns included in a data set do not allow you to perform all necessary
operations, or to create the visualizations needed to fully explore the data set. Still, in many
cases the necessary information can be computed from existing columns. Spotfire DecisionSite
provides the option to calculate new columns by applying mathematical and logical operators to
existing values.
The following section explains the basic workflow of using the New Column from Expression
tool. More detailed explanations on how to use the user interface and specifications of the
various functions follows later in the chapter.
► How to use the New Column from Expression tool:
1.
2.
3.
4.
Start DecisionSite and load a data set.
Select Data > New Column > From Expression....
The first step of the wizard is displayed. You can also reach the tool by right-clicking a
query device.
If you have previously created a suitable expression, you may select it from the Recent
Expressions list and click the Insert button.
If you need to create a new expression, proceed to specify the expression by either
typing it directly into the Expression text area or by selecting columns and functions
from the lists.
By selecting columns and functions, and clicking the Insert Columns or Insert
Function buttons, you can gradually build the expression you want. You can always
modify the expression by editing the text in the Expression field, using cut&paste or
typing text.
5.
An example of an expression could be: [Exports m$]/[Population]
Verify that the result seems reasonable by looking at the Sample result field. This
field will display the result of applying the expression to the first row of the data set.
221
TIBCO Spotfire DecisionSite 9.1.1 for Lead Discovery - User's Manual
6.
If this field shows an error message, there is a problem with the expression. Moving
the mouse pointer over the field or clicking on it, will display an explanation of what is
wrong.
When you are satisfied, press the Next > button.
The second step of the wizard is displayed.
Fill in the new Column name if the default name is not acceptable.
Change the Column type if you want to.
Watch the preview and verify that the result is what you want. If not, click on the <
Back button to go back and modify the expression until the desired result is achieved.
10. Click on the Finish button.
11. The expression is now evaluated for each row in the data set and a new column is
created. A new query device will appear with the name of the new column you created.
7.
8.
9.
If the new column data still is not what you intended, delete the column from the
Properties dialog, and invoke the New Column from Expression... tool again.
7.4.3
7.4.3.1
User Interface Description
Enter Expression Dialog
The dialog can be resized to provide more space for editing and for the lists.
Columns
Select a column by clicking on it, and click the Insert Columns button to insert it to the
Expression field. You can also double-click on a column to insert it. You can select several
columns by pressing Ctrl or Shift.
222
Working with the Data
If you place the cursor at a specific location in the Expression field, the column will be inserted
there.
If you have many columns you can use the scrollbar to find them, or click on any column and
type in the first letter of the desired column name to jump to it.
You can see the Type of the selected column in the field below the list.
Category
Select a category of functions to limit the choices in the Function list.
• All
• Operators
• Math Functions
• Statistical Functions
• Text Functions
• Logical Functions
• Date & Time Functions
• Conversion Functions
Function
Select a function by clicking on it, and click the Insert Function button to insert it to the
Expression field. You can also double-click on a function to insert it.
If you place the cursor at a specific location in the Expression field, the function will be
inserted there.
If you have many columns you can use the scrollbar to find them, or click on any function and
type in the first few letters of the desired function name to jump to it.
Description
This field provides a brief description of the selected function. For more detailed descriptions,
please see Spotfire Expression Language (SXL).
Expression
This is the text field in which you build your expression. You can insert columns and functions
to it from the lists, or enter text as in any standard text editor.
Cut/Copy/Paste works in the field using standard Ctrl+X/Ctrl+C/Ctrl+V.
Highlighting a section of the expression, and inserting a new function will cause that function to
encompass the highlighted section within parenthesis.
Also, Undo/Redo functionality is available by pressing Ctrl+Z/Ctrl+Y respectively.
Recent expressions
This list contains the twenty most recent expressions you have created. You can select one of
these and click the Insert button to insert the expression into the Expression field. This will not
replace the entire content of the field, only insert the selected expression at the cursor position.
Sample result
This field displays the result of applying the current expression to the first row of the data set.
If this field shows an error message, there is a problem with the expression. Moving the mouse
pointer over the field or clicking on it, will display an explanation of what is wrong. Pressing
F5 will also display the error description. Pressing F4 will move the cursor to the position in the
expression where the error lies.
There are three kinds of error messages:
#EXPR! – there is a problem with the syntax of the expression.
#NUM! – the row evaluates to infinity or other illegal number.
223
TIBCO Spotfire DecisionSite 9.1.1 for Lead Discovery - User's Manual
#ARG! – there is a problem with one or many arguments.
7.4.3.2
Specify Column Dialog
The dialog can be resized to provide more space for editing and for the lists.
Column name
Enter the name for the new column in this field.
Column type
This drop down box lets you select which Type the new column should have:
• String
• Integer
• Decimal
• Date
• Time
• DateTime
Expression
This field displays the expression which will be used to evaluate the new column. You cannot
edit this field. Click the < Back button if you want to modify the expression.
Preview
This table provides a preview of how the first rows in the data set will be evaluated using the
current expression. It displays the columns that are used in the expression and the resulting
column. You can resize the window to show more rows.
Move the mouse pointer over the column headings to display a ToolTip stating the Type of the
columns.
224
Working with the Data
If the resulting column shows an error message, there is a problem with the expression for that
row. Moving the mouse pointer over the field or clicking on it, will display an explanation of
what is wrong.
There are three kinds of error messages:
#EXPR! – there is a problem with the syntax of the expression.
#NUM! – the row evaluates to infinity or other illegal number.
#ARG! – there is a problem with one or many arguments.
7.4.4
7.4.4.1
Spotfire Expression Language (SXL)
General Syntax
Spotfire DecisionSite uses an Expression Language which is described in this chapter. Some
notes on the general syntax are:
Variables, functions and keywords are case insensitive:
SUM(C1) = Sum(C1) = sum(C1)
Column references are case sensitive.
The default null handling behavior is that operations on null return null.
7.4.4.2
Data Types
The data types with built in language support are:
• Integer
• Real
• Boolean
• String
Integer
Integer values are written as a sequence of digits, possibly prefixed by a + or - sign. If used
where a decimal value was expected, they are automatically converted to a decimal value.
Note: Hexadecimal formatted values have a size limitation of 8 characters.
Examples:
0
101
-32768
+55
0xff
= 255
0x7ffffff
= 2147483647
0x80000000 = -2147483648
Real
Real values are written as standard floating point numbers with a period for a decimal point and
no thousands separator. The real values that can be specified range from
-1.79769313486231e+308 to 1.79769313486231e+308.
The exponent of real value constants may range from -307 to 308.
Math operations on real values that produce results that can't be represented by the real data
type generate numeric errors. In the resulting data set, these special cases will be filtered out
and replaced by null.
Examples:
225
TIBCO Spotfire DecisionSite 9.1.1 for Lead Discovery - User's Manual
0.0
0.1
10000.0
-1.23e-22
+1.23e+22
1E6
Boolean
True or false. Booleans are used to represent true and false values returned by comparison
operators and logical functions.
Examples:
true
false
1<5
String Literals
String literals are surrounded by double quotes or single quotes. A string literal can contain any
sequence of UNICODE characters. A double quote can't be used within the string unless it is
escaped. Backslash is used to escape special characters, so it must also be escaped.
The basic escaping rules are that only the characters defined below can be used after a \;
everything else will generate an error.
Escape sequence
Result
\uHHHH
Any Unicode character expressed as four
hexadecimal characters
\0ooo
A character in the range 0-255 expressed as
three octal digits 0-7
\b
\u0008: backspace (BS)
\t
\u0009: horizontal tab (HT)
\n
\u000a: linefeed (LF)
\f
\u000c: form feed (FF)
\r
\u000d: carriage return (CR)
\"
\u0022: double quote "
\'
\u0027: single quote '
\\
\u005c: backslash \
Examples:
"Hello world"
"25\"23"
"1\n2\n"
"C:\\TEMP\\image.png"
Column References
Accessing columns are done by either simply writing the column name, or enclosing the
column name in square brackets. The brackets are needed when the column name contains
characters other than letters, digits or _ (underscore), or if the column name begins with a digit.
If a column name is bracketed; any end brackets and backslashes in the column name must be
226
Working with the Data
escaped by \] or \\ respectively. The same backslash escaping rules as for strings are followed,
except that double quotes (") may not be escaped.
Examples:
Column1
[Column1]
[Binned Column1]
[1]
[!@#$%^&*()[\]\\]
Time, Date, TimeStamp
• Time – A time of day type, range 0:00 to 24:00.
• Date – Date type ranging from January 1st, 100 to December 31st, 9999.
• TimeStamp – A combination of Time and Date.
Mathematical operations on date, time and timestamp data types are supported in DecisionSite
9.0 and forward.
For example, it is possible to calculate how many days it differs between two date columns.
When a date, time or timestamp column is subtracted from another date, time or timestamp
column, the corresponding result column will show the number of days as a real (decimal)
column. For example, "2006-10-10 7.00 AM minus 2006-10-10 1.00 AM" equals 0.25 since 6
hours is a quarter of a day.
7.4.4.3
7.4.4.3.1
Operators
Operators Overview
Please select which type of Operators you are interested in:
Unary Operators (Operators with only one argument)
Binary Operators (Operators with two arguments)
Trinary Operators (Operators with three arguments)
Operator Precedence
7.4.4.3.2
Unary Operators
A unary operator takes one argument following the operator.
Operator
Description
- Arg1
Negates the argument. The argument and the
result are of type real.
! Arg1
Returns the logical Not of Arg1. The argument
and the result are of type boolean. See also
function Not.
Example:
!true -> false
!false -> true
7.4.4.3.3
Binary Operators
A binary operator takes two arguments, one preceding and one following the operator.
Operator
Description
Arg1 + Arg2
Adds the two arguments. The arguments and the result are of type
real. See operator & for string concatenation.
227
TIBCO Spotfire DecisionSite 9.1.1 for Lead Discovery - User's Manual
228
Arg1 – Arg2
Subtracts Arg2 from Arg1. The arguments and the result are of type
real.
Arg1 * Arg2
Multiplies the two arguments. The arguments and the result are of
type real.
Arg1 / Arg2
Divides Arg1 by Arg2. The arguments and the result are of type real.
Division by zero results in an error.
Example:
7/2 -> 3.5
0/0 -> #NUM!
-1/0 -> #NUM!
Arg1 & Arg2
Appends Arg2 to the end of Arg1. The arguments can be of any type,
but are converted to strings. The result is of type string. See also
function Concatenate.
Example:
"April " & (20+1) & "st" -> "April 21st"
null & "Ape"
-> #NULL!
Arg1 < Arg2
Returns true if Arg1 is less than Arg2. The arguments are of type real
and the result is of type boolean. The function is defined for
comparing normal numbers to each other and to ±Infinity. It is also
defined for comparing Infinity to -Infinity. Other combinations result
in errors or null.
Example:
1 < 2 -> true
1 < null -> #NULL!
1 < 1/0 -> true
1/0 < 1/0 ->#NUM!
-1/0 < 1/0 -> true
1 < 0/0 -> #NUM!
Arg1 > Arg2
Returns true if Arg1 is greater than Arg2. The arguments are of type
real and the result is of type boolean. See operator < for the definition
of valid arguments.
Arg1 <= Arg2
Returns true if Arg1 is less than or equal to Arg2. The arguments are
of type real and the result is of type boolean. See operator < for the
definition of valid arguments.
Arg1 >= Arg2
Returns true if Arg1 is greater than or equal to Arg2. The arguments
are of type real and the result is of type boolean. See operator < for
the definition of valid arguments.
Arg1 = Arg2
Returns true if Arg1 is equal to Arg2. The arguments can be of any
type, but must both be of the same type. The result is of type boolean.
If any argument is null, the result is null. See function IsNull for
comparing nulls. For arguments of type real, see operator < for the
definition of valid arguments.
Example:
"Hello" = "hello" -> false
"" = null -> #NULL!
null = null -> #NULL!
Arg1 <> Arg2
Returns true if Arg1 is not equal to Arg2. The arguments can be of
any type, but must both be of the same type. The result is of type
boolean. If any argument is null, the result is null. See function
IsNull for comparing nulls. For arguments of type real, see operator <
for the definition of valid arguments.
Working with the Data
Expr1, Expr2
7.4.4.3.4
Evaluates both expressions and returns Expr2. The expressions can
be any valid expression, including expressions that evaluate to null.
Trinary Operators
A trinary operator takes three arguments.
Operator
Description
Arg1? Arg2: Arg3
Returns Arg2 if Arg1=true, and Arg3 if
Arg1=false. Arg1 is of type boolean, usually
the result of a comparison. Arg2 and Arg3 can
be of any type, but must both be of the same
type or null. If Arg1 is null, the result is also
null. See also function If.
Example:
([Count] > 3)? "many": "few"
true? null: null -> #NULL!
true? 1: null -> 1
false? null: 2 -> 2
null? 1: 2 -> #NULL!
7.4.4.3.5
Operator Precedence
Below is a table showing the hierarchy of SXL operators with the highest precedence operator
shown first.
Expressions inside parentheses are evaluated first; nested parentheses are evaluated from the
innermost parentheses to the outer.
Operators in the same row in the chart have equal precedence
7.4.4.4
7.4.4.4.1
Operators
Type
Order of Evaluation
()
Parentheses
left to right
!
Not
right to left
-+
Unary minus and plus
right to left
*/%
Multiplicative
left to right
+-
Additive
left to right
&
Concatenation
left to right
< > <= >=
Relational
left to right
= <>
Equality
left to right
Functions
Math Functions
Function
Description
Abs(Arg1)
Returns the absolute value of Arg1. The argument
and the result are of type real.
ACos(Arg1)
Returns the arccosine of Arg1 as an angle expressed
in radians in the interval [0 ,π ]. Arg1 must be in the
interval [-1.0, 1.0], otherwise NaN is returned. The
229
TIBCO Spotfire DecisionSite 9.1.1 for Lead Discovery - User's Manual
argument and the result are of type real.
230
ASin(Arg1)
Returns the arcsine of Arg1 as an angle expressed in
radians in the interval
[- π /2 , π /2]. Arg1 must be in the interval [-1.0, 1.0],
otherwise NaN is returned. The argument and the
result are of type real.
ATan(Arg1)
Returns the arctangent of Arg1 as an angle expressed
in radians in the interval [-π /2 ,
π /2]. The argument and the result are of type real.
Ceiling(Arg1)
Rounds Arg1 up to the nearest natural number. The
argument and the result are of type real.
Example:
Ceiling(1.01) -> 2.0
Ceiling(-1.99) -> -1.0
Cos(Arg1)
Returns the cosine of Arg1 where Arg1 is an angle
expressed in radians. The argument and the result are
of type real.
Exp(Arg1)
Returns e (2.718281...) raised to the Arg1 power. The
argument and the result are of type real.
Floor(Arg1)
Rounds Arg1 down to the nearest natural number.
The argument and the result are of type real.
Example:
Floor(1.99) -> 1.0
Floor(-1.01) -> -2.0
Ln(Arg1)
Returns the natural logarithm of Arg1. The
arguments and the result are of type real. If Arg1 is
negative, the result is a NaN error. If Arg1 is zero,
the result is Infinity error.
Log(Arg1, Arg2)
Returns the logarithm of Arg1 expressed in the base
specified by Arg2. Equivalent to Ln(Arg1)/Ln(Arg2).
The arguments and the result are of type real. See
function Ln for the definition of valid arguments.
Log10(Arg1)
Returns the 10-based logarithm of Arg1. Equivalent
to Ln(Arg1)/Ln(10). The arguments and the result are
of type real. See function Ln for the definition of
valid arguments.
Mod(Arg1, Arg2)
Returns the reminder of the division of Arg1 by
Arg2, The arguments and the result are of type real.
If Arg2 is 0, the result is NaN.
Mod(Arg1, Arg2) is defined as:
Arg1 – Arg2*Floor(Arg1/Arg2)
PI()
Returns the numerical constant π .
The result is of type real.
Power(Arg1, Arg2)
Returns Arg1 raised to the Arg2 power. The
arguments and the result are of type real.
Example:
Power(10, 3) -> 1000
Power(10, -3) -> 0.001
Power(0, 0) -> 1
Working with the Data
7.4.4.4.2
Product(Arg1, ...)
Returns the product of the arguments. The arguments
and the result are of type real. Null arguments are
ignored and do not contribute to the product.
Example:
Product(-1) -> -1
Product(1.5, -2, 3) -> -9
Product(1, null, 3) -> 3
Product(null) -> #NULL!
Round(Arg1, Arg2)
Rounds Arg1 to the number of decimal places
specified by Arg2. The arguments and the result are
of type real, but for Arg2, only the integer part is
used. Note that Arg2 can be negative to round to
even 10s, 100s etc. 0.5 is rounded upwards to a
number with higher magnitude (ignoring the sign).
Example:
Round(PI(), 3) -> 3.142
Round(-0.5, 0) -> -1
Round(25, -1) -> 30
Sin(Arg1)
Returns the sine of Arg1 where Arg1 is an angle
expressed in radians. The argument and the result are
of type real.
Sqrt(Arg1)
Returns the square root of Arg1. The argument and
the result are of type real. If Arg1 is negative, the
result is a NaN error.
Sum(Arg1, ...)
Returns the sum of the arguments. The arguments
and the result are of type real. Null arguments are
ignored and do not contribute to the sum.
Example:
Sum(-1) -> -1
Sum (1.5, -2, 3) -> 2.5
Sum (1, null, 3) -> 4
Sum (null) -> #NULL!
Tan(Arg1)
Returns the tangent of Arg1 where Arg1 is an angle
expressed in radians. The argument and the result are
of type real.
Statistical Functions
Function
Description
Average(Arg1, ...)
Returns the average (arithmetic mean) of the
arguments. The arguments and the result are of type
real. Null arguments are ignored and do not
contribute to the average.
Example:
Average(-1) -> -1
Average (1.5, -2, 3.5) -> 1
Average (1, null, 3) -> 2
Average (null) -> #NULL!
Max(Arg1, ...)
Returns the largest of the arguments. The argument
and the result are of type real. Null arguments are
ignored.
231
TIBCO Spotfire DecisionSite 9.1.1 for Lead Discovery - User's Manual
Example:
Max(-1) -> -1
Max (1.5, -2, 3) -> 3
Max (1, null, 3) -> 3
Max (null) -> #NULL!
Min(Arg1, ...)
7.4.4.4.3
232
Returns the smallest of the arguments. The argument
and the result are of type real. Null arguments are
ignored.
Example:
Min(-1) -> -1
Min (1.5, -2, 3) -> -2
Min (1, null, 3) -> 1
Min (null) -> #NULL!
Logical Functions
Function
Description
And(Arg1, ...)
Returns the logical And of the arguments. If any
argument is false, the result is false. Otherwise, if any
argument is null, the result is null. If all arguments are
true the result is true. The arguments and the result are
of type boolean.
Example:
And(true, false, true) -> false
And(false, null) -> false
And(true, null) -> #NULL!
If(Arg1, Arg2, Arg3)
Returns Arg2 if Arg1=true, and Arg3 if Arg1=false.
Arg1 is of type boolean, usually the result of a
comparison. Arg2 and Arg3 can be of any type, but
must both be of the same type or null. If Arg1 is null,
the result is also null. See operator ? :
Example:
If([Count] > 3, "many", "few")
If(true, null, null) -> #NULL!
If(true, 1, null) -> 1
If(false, null, 2) -> 2
If(null, 1, 2) -> #NULL!
IsError(Expr1)
Returns true if Expr1 evaluates to an error, and false if
Expr1 evaluates to a proper value or null. Errors are
e.g. numeric errors
(NaN, ±Infinity), conversion errors and indexing
errors. Expr1 can be of any type and the result is of
type boolean.
Example:
IsError(0/0) -> true
IsError(null) -> false
IsError(Left("A", -1)) -> true
IsError(Real("Hello")) -> true (conversion)
IsNull(Arg1)
Returns true if Arg1 is null, false otherwise. Arg1 can
be of any type and the result is of type boolean.
Example:
Working with the Data
IsNull(0) -> false
IsNull(null) -> true
IsNull(0/0) -> #NUM!
7.4.4.4.4
Not(Arg1)
Returns the logical Not of Arg1. The argument and the
result are of type boolean. See also unary operator !
Example:
Not(true) -> false
Not(false) -> true
Or(Arg1, ...)
Returns the logical Or of the arguments. If any
argument is true, the result is true. Otherwise, if any
argument is null, the result is null. If all arguments are
false the result is false. The arguments and the result
are of type boolean.
Example:
Or(false, true, false) -> true
Or(true, null) -> true
Or(false, null) -> #NULL!
Xor(Arg1, Arg2)
Returns the logical Xor of the arguments. If exactly
one argument is true, the result is true, otherwise false.
If any or both arguments are null, the result is null.
The arguments and the result are of type boolean.
Example:
Xor(true, false) -> true
Xor(true, true) -> false
Xor(true, null) -> #NULL!
Text Functions
Function
Description
Concatenate(Arg1, ...)
Concatenates (appends) all the arguments into a string. The
arguments can be of any type, but are converted to strings. The
result is of type string. Null arguments are ignored.
Example:
Concatenate("April ", 20+1, "st")
-> "April 21st"
Concatenate(null, "Ape") -> "Ape"
Concatenate (null, null)
-> #NULL!
Find(Arg1, Arg2)
Returns the 1-based index of the first occurrence of the string
Arg1 in Arg2. If not found, 0 is returned. The search is casesensitive. The arguments are of type string and the result is of
type integer. If Arg1 is the empty string, 0 is returned.
Example:
Find("lo", "Hello") -> 4
Find("a", "Hello") -> 0
Find("", "Hello") -> 0
Find("", null) -> #NULL!
If(Find("Pri 1", [Col1])>0, "Important", "Not important")
Left(Arg1, Arg2)
Returns the first Arg2 characters of the string Arg1. Arg1 and
the result are of type string. Arg2 is of type real, but only the
integer part is used. If Arg2 > the length of Arg1, the whole
string is returned. If Arg2 is negative, an error is returned.
Example:
233
TIBCO Spotfire DecisionSite 9.1.1 for Lead Discovery - User's Manual
Left("Daddy", 3.99) -> "Dad"
Left("Daddy", 386) -> "Daddy"
Left("Daddy", -1) -> #ARG!
7.4.4.4.5
234
Len(Arg1)
Returns the length of the string Arg1. Arg1 is of type string and
the result is of type integer.
Example:
Len("Hello") -> 5
Len(null) -> #NULL!
Lower(Arg1)
Returns Arg1 converted to lowercase. Arg1 and the result are of
type string.
Mid(Arg1, Arg2, Arg3)
Returns the substring of Arg1 starting at index Arg2 with a
length of Arg3 characters. Arg1 and the result are of type
string. Arg2 and Arg3 are of type real, but only the integer part
is used. If Arg2 > Len(Arg1), an empty string is returned. Else,
if Arg2+Arg3 > Len(Arg1), Arg3 is adjusted to 1+Len(Arg1)Arg2. If either Arg2 or Arg3 is negative or if Arg2 is zero, an
error is returned.
Example:
Mid("Daddy", 2, 3) -> "add"
Mid ("Daddy", 386, 4) -> ""
Mid ("Daddy", 4, 386) -> "dy"
Mid ("Daddy", -1, 2) -> #ARG!
Mid ("Daddy", 2, -1) -> #ARG!
Right(Arg1, Arg2)
Returns the last Arg2 characters of the string Arg1. Arg1 and
the result are of type string. Arg2 is of type real, but only the
integer part is used. If Arg2 > the length of Arg1, the whole
string is returned. If Arg2 is negative, an error is returned.
Example:
Right("Daddy", 3.99) -> "ddy"
Right("Daddy", 386) -> "Daddy"
Right("Daddy", -1) -> #ARG!
Upper(Arg1)
Returns Arg1 converted to uppercase. Arg1 and the result are of
type string.
Date and Time Functions
Function
Description
AddDays(Arg1, Arg2)
Adds Arg2 number of days to Arg1. Arg2 is of type
Real and Arg1 is of type Date or TimeStamp. The
result is of the same type as Arg1.
Example:
AddDays(2002-03-04, -2) -> 2002-03-02
AddSeconds(Arg1, Arg2)
Adds Arg2 number of seconds to Arg1. Arg2 is of type
Real and Arg1 is of type Time or TimeStamp. The
result is of the same type as Arg1.
Example:
AddSeconds([Time col], 30)
AddSeconds([Time col], 0.010)
Date(Arg1, Arg2, Arg3)
Creates a Date. The arguments are year, month and day
and are of type Real. The year must be between 100
Working with the Data
and 9999. The month must be between 1 and 12. The
day must be between 1 and 31). See also conversion
functions.
Example:
Date(2003, 4, 9)
-> 2003-04-09
Date(2000, -1, 1) -> #ARG! (conversion error)
DateDiff(Arg1, Arg2)
Returns the difference in milliseconds in between two
Date, Time or TimeStamp values.
Example:
DateDiff([Time col 1],[Time col 2])
Day(Arg1)
Extracts the day from a Date or TimeStamp. The result
is of type Integer.
Example:
Day(2002-03-04)
-> 4
Days(Arg1, Arg2)
Returns the number of days between two dates. The
arguments can be either of type Date or of type
TimeStamp. If the arguments are of type TimeStamp,
the time part is ignored. The result is of type Integer.
Example:
Days(2002-03-04, 2002-03-02) -> 2
Hour(Arg1)
Extracts the hour from a Time or TimeStamp. The
result is of type Integer.
Example:
Hour(11:38:02)
-> 11
Millisecond(Arg1)
Extracts the millisecond part of a Time or TimeStamp.
The result is of type Integer.
Example: Millisecond([Time col])
Minute(Arg1)
Extracts the minute from a Time or TimeStamp. The
result is of type Integer.
Example:
Minute(11:38:02) -> 38
Month(Arg1)
Extracts the month from a Date or TimeStamp. The
result is of type Integer.
Example:
Month(2002-03-04) -> 3
Second(Arg1)
Extracts the second from a Time or TimeStamp. The
result is of type Integer.
Example:
Second(11:38:02) -> 2
Seconds(Arg1, Arg2)
Returns the number of seconds between two times. The
arguments can be either of type Time or of type
TimeStamp. The result is of type Integer.
Example:
Seconds(11:38:02, 11:37:00) -> 62
Time(Arg1, Arg2, Arg3)
Creates a Time. The arguments are hours, minutes and
seconds and are of type Real. The hours, minutes and
seconds must be valid (0-23, 0-59, 0-59). See also
conversion functions.
Example:
Time(14,4,0") -> 14:04:00
235
TIBCO Spotfire DecisionSite 9.1.1 for Lead Discovery - User's Manual
Time(10, -1, 1) -> #ARG! (conversion error)
7.4.4.4.6
236
TimeStamp(Arg1, Arg2)
Creates a TimeStamp. The arguments are a Date and a
Time. See also conversion functions.
Example:
TimeStamp([Date col], [Time col])
Year(Arg1)
Extracts the year from a Date or TimeStamp. The result
is of type Integer.
Example:
Year(2002-03-04) -> 2002
Conversion Functions
Function
Description
Date(Arg1)
Converts Arg1 to a date. If the conversion fails, an
error is returned. Arg1 can be of type String or
TimeStamp and the result is of type Date. If a
TimeStamp is specified, the time part is removed. See
also date & time functions.
Example:
Date("2003-03-21") -> 2003-03-21
Date("10") -> #ARG! (conversion error)
Date(null) -> #NULL!
Date(2003-03-21 11:37:00) -> 2003-03-21
Integer(Arg1)
Converts Arg1 to an integer number. If the conversion
fails, an error is returned. Arg1 can be of types
integer, real or string, and the result is of type integer.
Real numbers are truncated, i.e., only the integer part
is used.
Example:
Integer("-123") -> -123
Integer("-2.99") -> -2
Integer("0%") -> #ARG! (syntax error)
Integer(1e20) -> #ARG! (overflow)
Integer(null) -> #NULL!
Real(Arg1)
Converts Arg1 to a real number. If the conversion
fails, an error is returned. Arg1 can be of types
integer, real or string, and the result is of type real.
Example:
Real("1.23") -> 1.23
Real(2) -> 2.0
Real("0%") -> #ARG! (syntax error)
Real(null) -> #NULL!
SE(Arg1, Arg2)
Substitutes errors. Returns Arg1 if it is not an error,
Arg2 otherwise. Arg1 and Arg2 can be of any type,
but must both be of the same type or null. The result
is of the same type as the arguments.
Example:
SE(1, 2) -> 1
SE(null, 2) -> #NULL!
SE(0/0, 2) -> 2
SN(Arg1, Arg2)
Substitutes null values. Returns Arg1 if it is not null,
Working with the Data
Arg2 otherwise. Arg1 and Arg2 can be of any type,
but must both be of the same type or null. The result
is of the same type as the arguments.
Example:
SN(1, 2) -> 1
SN(null, 2) -> 2
SN(0/0, 2) -> #NUM!
7.4.4.5
String(Arg1)
Converts Arg1 to a string. This conversion never fails
except if Arg1 is null. Arg1 can be of any type and the
result is of type string.
Example:
String(1.23) -> "1.23"
String(null) -> #NULL!
Time(Arg1)
Converts Arg1 to a time. If the conversion fails, an
error is returned. Arg1 can be of type String or
TimeStamp and the result is of type Time. If a
TimeStamp is specified, the date part is removed. See
also date & time functions.
Example:
Time("11:37:00")
-> 11:37:00
Time("10")
-> #ARG! (conversion error)
Time (null)
-> #NULL!
Time(2003-03-21 11:37:00) -> 11:37:00
TimeStamp(Arg1)
Converts Arg1 to a time stamp. If the conversion
fails, an error is returned. Arg1 can be of type String
or Date and the result is of type TimeStamp. If a Date
is specified, the time part is set to 00:00:00. See also
date & time functions.
Example:
TimeStamp("2003-03-21 11:37:00")
-> 200303-21 11:37:00
TimeStamp("10") -> #ARG! (conversion error)
TimeStamp(null) -> #NULL!
TimeStamp (2003-03-21) -> 2003-03-21 00:00:00
Reserved Words
Import
Result
Template
Type
null
true
false
7.4.4.6
Errors and Null
An expression is considered valid if it is syntactically correct and all function, operator and
column references can be resolved. If an expression is not valid, it cannot be evaluated. This
will be indicated in the SXL UI as:
#EXPR!
237
TIBCO Spotfire DecisionSite 9.1.1 for Lead Discovery - User's Manual
When evaluating an expression, some operations produce errors or null values. Each function
and operator can choose how to handle arguments that are errors or null. The default behavior is
to propagate the first error or null value that is encountered. So, if a function takes two
arguments and the first is null and the second is an error, the default behavior is to return null.
Functions that handle errors and null in other ways are explained in their Descriptions.
Errors
For operations on arguments of type real, the result is sometimes not defined. This produces a
NaN (Not a Number) error. If the result of an operation is greater than the maximum real
number, an Infinity error (or -Infinity error) is produced. Many operations are well defined for
+/- Infinity and will work as expected, e.g., 2.5 < 1/0 returns true. When generated, these errors
are grouped together as numeric errors, displayed as:
#NUM!
If the argument for a function (or operator) is invalid, an error is also produced. For example,
functions expecting an index might produce an error because the index is negative and
conversion functions produce an error if the argument cannot be converted. When generated,
these errors are grouped together as argument errors displayed as:
#ARG!
The IsError(Arg1) function can be used to determine if a sub-expression results in an error.
The SE(Arg1, Arg2) function can be used to substitute errors with a certain value, e.g. null or 0.
When generating a result data set from the expression, errors are converted to null. Wrap the
expression with a call to the SN(Arg1, Arg2) function to override this behavior.
238
Error
Details
Example
Description
#NUM!
NaN
0/0 atan(2) sqrt(-1)
Not a Number, means
that the result is
undefined. All
subsequent math
operations on NaN
produce NaN.
#NUM!
Infinity
1/0 1e200*1e200
Infinity, means that
the number is too big
to store in the real data
type. Many math
operations treat this as
a "huge" number.
#NUM!
-Infinity
-1/0 -1e200*1e200
Negative infinity,
means that the number
is too big to store in
the real data type.
Many math operations
treat this as a "huge"
negative number.
#ARG!
Invalid Argument
Left("Hello", -1)
Mid("Hello", 0, 1)
Invalid argument. In
this case because
length must be
positive and position
cannot be zero.
#ARG!
Conversion
Real("Hello")
Conversion failed.
Working with the Data
Null
Null values are usually only generated when retrieving a column value from the data set or by
explicitly writing null in the expression. Results that are null, are displayed as:
#NULL!
The IsNull(Arg1) function can be used to determine if a sub-expression results in null. The
SN(Arg1, Arg2) function can be used to substitute null with a certain value, e.g., 0.
7.4.4.7
Compatibility
The old expression language in DecisionSite Client 7.1.1 and earlier, had a different syntax and
a different set of functions and operators. All the functionality of the old expression language is
present in the new expression language and mapping the old onto the new is described here.
Quoted column names are now bracketed instead: "Column 1" is now [Column 1]
String literals can now contain escaped characters such as quotes, backslashes, new lines etc:
"22\"", '22"', "1\n2\n", 'C:\\TEMP\\file.csv'
Constants are replaced by function calls: PI is now PI(), E is now EXP(1)
Concatenating strings is now supported via the & operator instead of +
Operator ^ is replaced by function POWER
Operator precedence is now correct: 1+2*3 is now evaluated as 1+(2*3) instead of (1+2)*3
Function Compatibility
The old functions and their new counterparts are listed below:
Old Function
New Function
Description
ADD
SUM
Now sums any number of
arguments. See also operator
+
Now only available as an
operator. See operator -
SUBTRACT
MULTIPLY
PRODUCT
Now multiplies any number of
arguments. See also operator *
Now only available as an
operator. See operator /
DIVIDE
MOD
MOD
EXP
POWER
See also operator ^
EXP
Equivalent to POWER(x,
2.718281...)
SQRT
SQRT
ABS
ABS
LOG(num, base)
Now requires a base argument
as well (not 10 by default).
See function LOG10 below.
LOG
LOG10
10 logarithm, replaces old
LOG(x) function
LN
LN
Natural logarithm
FLOOR
FLOOR
CEIL
CEILING
SIN
SIN
239
TIBCO Spotfire DecisionSite 9.1.1 for Lead Discovery - User's Manual
COS
COS
TAN
TAN
No longer supported. See
unary operator -
NEG
PI (constant)
PI()
Now a function like in Excel.
No longer supported. Use
EXP(1) instead.
E (constant)
MAX
MAX
MIN
MIN
TOUPPERCASE
UPPER
TOLOWERCASE
LOWER
Operator Compatibility
The old operators and their new counterparts are listed below:
Binary:
Old Operator
New Operator
Description
+
+
Adds numeric values. See
operator & for string
concatenation.
-
-
Subtract numeric values.
*
*
Multiply numeric values.
/
/
Divide numeric values.
No longer supported. See
function POWER.
^
+
&
Concatenate (append) strings
or lists.
New Operator
Description
-
Negates the argument.
Unary:
Old Operator
Examples
Here are some examples of how expressions would look using both the old and the new syntax.
We assume a data set with string column "S1" and numeric columns "N1", "N2" and "Binned
N1".
240
Old Expression
New Expression
N1 + 2 / N2
(N1 + 2) / N2
SUBTRACT(N1, "Binned N1")
N1 – [Binned N1]
N1 ^ 3 + EXP(N2, 0.5)
POWER(N1, 3) + POWER(N2, 0.5)
NEG(N1)
-N1
TOUPPERCASE(S1)
UPPER(S1)
'C:\" + S1 + '\' + N1 + '.txt'
'C:\\' & S1 & '\\' & N1 & '.txt'
Working with the Data
7.5
7.5.1
Column Normalization
Column Normalization Overview
The Column Normalization tool can be used to standardize the values in selected columns using
a number of different normalization methods. For example, this can be useful if you plan to
perform a clustering later on.
7.5.2
7.5.2.1
Using Column Normalization
Normalizing Values in Selected Columns
► To normalize columns:
1.
Select Data > Column Normalization....
Response: The Column Normalization dialog is displayed.
2. Select the Value columns that you want to normalize.
Comment: For multiple selection, press Ctrl and click on the desired columns or click
one column and drag to select the following ones.
3. Click a radio button to select whether to work on All records or Selected records.
4. Select a method to Replace empty values with from the drop-down list.
5. Select a Normalization method from the drop-down list.
6. Select the Overwrite previously added columns check box to overwrite columns
earlier added by this tool.
7. Click OK.
Response: The Column Normalization dialog is closed and the normalized columns
either replace the old columns or are added to the data set, depending on your selection
in the Overwrite check box.
Tip: You can also use the Column Normalization tool to replace empty values in columns
without performing any normalization.
7.5.2.2
Replacing Empty Values in Columns
If No normalization is selected as normalization method in the Column Normalization tool, you
can replace empty values in a data set with either a constant, averaged or interpolated values.
See Details on Interpolation for more information on how the interpolation option works for
row interpolation.
► To replace empty values in existing columns:
1.
2.
3.
4.
5.
6.
7.
Select Data > Column Normalization....
Response: The Column Normalization dialog is displayed.
Select the Value columns in which you want to replace the empty values.
Comment: For multiple selection, press Ctrl and click on the desired columns or click
one column and drag to select the following ones.
Click a radio button to select whether to work on All records or Selected records.
Select a method to Replace empty values with from the drop-down list.
Select No normalization as the Normalization method.
Select the Overwrite previously added columns check box to overwrite columns
created by this tool.
Click OK.
241
TIBCO Spotfire DecisionSite 9.1.1 for Lead Discovery - User's Manual
Response: The Column Normalization dialog is closed and data is added to the
previously empty fields of the columns in the data set according to the selected
replacement method.
7.5.2.3
Details on Interpolation
Empty values in the data set can be replaced with either a constant, averaged or interpolated
values. The row interpolation of the Column Normalization tool works like this:
If the first value is empty it is replaced with the first non-empty numerical value in the order the
columns were entered.
If the last value is empty it is replaced with the previous non-empty numerical value in the
order the columns were entered.
If an empty value is found between non-empty numerical values, the values are calculated as
the linear interpolation.
If all values in a row are empty, they will be replaced by zero.
Example:
A
null
null
1
1
1
1
null
C
2
null
null
null
2
2
null
Becomes:
A
C
2
2
3
3
1
2
1
2
1
2
1
2
0
0
242
B
3
3
3
null
null
3
null
B
3
3
3
3
3
3
0
D
4
4
4
4
4
null
null
D
4
4
4
4
4
3
0
Working with the Data
7.5.3
7.5.3.1
User Interface
Column Normalization Dialog
Option
Description
Value columns
The data columns you want to normalize. Click a column name in the
list to select it. To select more than one column, press Ctrl and click on
the column names in the list.
Work on: All
records
All records in the value columns are included in the calculations.
Work on: Selected
records
Only the selected records are included in the calculations.
This lets you filter out any records that you do not want to include in
the calculations, using the query devices and zooming.
Replace empty
values with
Defines how empty values in the data set should be replaced. From the
drop-down list, select a method.
Note: Empty value leaves the value empty as before. Constant allows
you to replace the empty values by any constant (type a number in the
text box). Row average replaces the value by the average value of the
entire row. Row interpolation sets the missing value to the
interpolated value between the two neighboring values in the row (see
Details on interpolation for more information). Similarly, Column
average and Column interpolation return the average/interpolation of
the corresponding column values.
Normalization
method
The method to use for the normalization. For more information about
the available methods, see the methods overview. The option No
243
TIBCO Spotfire DecisionSite 9.1.1 for Lead Discovery - User's Manual
normalization gives you the opportunity to replace empty values in a
column.
Overwrite
previously added
columns
Select this check box if you want to replace any previously added
columns from the Column Normalization tool. Clear the check box if
you wish to keep the old columns.
Normalized columns will have the same name as the ones they are
based on, followed by "(normalized)". If several sets of normalized
columns are saved, they will also be followed by an index number, (1),
etc.
► To reach the Column Normalization dialog:
Select Data > Column Normalization....
7.5.4
7.5.4.1
Theory and Methods
Column Normalization Methods Overview
The following normalization methods are available in the Column Normalization tool:
• Z-score calculation
• Divide by standard deviation
• Scale between 0 and 1
7.5.4.2
Column Normalization - Z-score
Assume that there are n records with seven variables, A, B, C, D, E, F and G, in the data view.
We use variable E as an example in the expressions. The remaining variables are normalized in
the same way.
The normalized value of ei for variable E in the ith record is calculated as
where
If all values for variable E are identical — so that the standard deviation of E (std(E)) is equal to
zero — then all values for variable E are set to zero.
7.5.4.3
Column Normalization - Divide by Standard Deviation
Assume that there are n records with seven variables, A, B, C, D, E, F and G, in the data view.
We use variable E as an example in the expressions. The remaining variables are normalized in
the same way.
The normalized value of ei for variable E in the ith record is calculated as
where
244
Working with the Data
If all values for variable E are identical — so that the standard deviation of E (std(E)) is equal to
zero — then all values for variable E are left unchanged.
7.5.4.4
Column Normalization - Scale Between 0 and 1
Assume that there are n records with seven variables, A, B, C, D, E, F and G, in the data view.
We use variable E as an example in the expressions. The remaining variables are normalized in
the same way.
The normalized value of ei for variable E in the ith record is calculated as
where
Emin = the minimum value for variable E
Emax = the maximum value for variable E
If all values for variable E are identical, so that Emin is equal to Emax, then all values for variable
E are set to zero.
7.6
7.6.1
Pivot Data
Pivot Data Overview
Pivoting, in its simplest form, means rotating a table. Mostly, though, it also includes
performing some form of aggregation, so that the new table is more compact than the original.
To better understand how the pivoting tool works, study one of the examples.
7.6.2
7.6.2.1
Using Pivot Data
Pivoting the Data Set
► To pivot the current data set:
1.
2.
3.
4.
5.
Select Data > Pivot Data....
Response: The Tall/Skinny => Short/Wide dialog is opened.
In the Identity list, select one or more columns.
Comment: Each unique value in the chosen column produces a row in the generated
table. You can choose more than one column. Doing so means that the new table will
have a separate row for each unique combination of values in the chosen columns.
In the Category list, select one or more columns.
Comment: Each unique value in the chosen column produces a new column in the
generated table. Selecting more than one column means that the new table will have a
separate column for each unique combination of values in the chosen columns.
In the Values list, select one or more columns.
Comment: The column selected under Values is the column from which the data is
pulled. It is possible to select more than one Value column. The values in the
generated table are always computed as the average of values in the original table,
unless the original values are strings. If so, values in the generated table will consist of
concatenated strings. To change the way the values are calculated, right-click on the
Method and select a different method from the list, or use Ctrl+click to select multiple
methods.
In the Other Columns list, select one or more columns.
245
TIBCO Spotfire DecisionSite 9.1.1 for Lead Discovery - User's Manual
6.
7.6.2.2
Comment: This option allows you to include an overall average of a particular
measurement, for each row in the generated table. For each column selected here, one
new column will be created in the new table. To change the way the measurements are
calculated, right-click on the Method and select a different method from the list, or use
Ctrl+click to select multiple methods.
Click OK.
Example of Pivoting
Pivoting a data set means changing it from a tall/skinny format to a short/wide format. Consider
the following tall/skinny table, based on a series of temperature measurements:
City
Month
Temp
London
February
4
New York
February
6
London
May
16
New York
May
19
London
August
28
New York
August
26
London
November
13
New York
November
11
As we add more observations, the table grows taller, but remains three columns wide. While
useful during data collection, this format may not be appropriate for certain types of
calculations or visualizations. For example, the entities that interest us are the different cities, so
we may want a representation with a single record for each city.
Tall/Skinny=>Short/Wide conversion lets us pivot this table, producing the following (note that
avg(Temp) is the average of a single cell):
City
avg(Temp)
for February
avg(Temp)
for May
avg(Temp)
for August
avg(Temp)
for
November
London
4
16
28
13
New
York
6
19
26
11
Each city is now represented by a single record, which makes this format very suitable for
Spotfire DecisionSite profile charts. This example demonstrates three steps:
• Creating a row for each unique value in City.
• Creating a column for each unique value in Month.
• Entering a value from Temp for each cell in the resulting grid.
In the Tall/Skinny => Short/Wide dialog, the following settings would be made:
• Identity: City
• Category: Month
• Values: Temp
246
Working with the Data
7.6.2.3
Example of Pivoting with Aggregation
Note: To understand this example, it is recommended to read Example of Pivoting first.
Apart from changing format from tall/skinny to short/wide, pivoting can be used to create a
more compact table. Consider the following table, based on a series of temperature
measurements:
City
Month
Day
Temp
London
February
1
5
London
February
15
8
London
May
1
15
London
May
15
22
New York
February
1
9
New York
February
15
7
New York
May
1
18
New York
May
15
24
Tall/Skinny=>Short/Wide conversion lets us pivot and aggregate this table, producing the
following:
City
avg(Temp) for February
avg(Temp) for May
London
6.5
18.5
New York
8
21
A smaller table has been created, summarizing the original table. In the Tall/Skinny =>
Short/Wide dialog, the following settings would be made:
• Identity: City
• Category: Month
• Values: Temp
7.6.3
7.6.3.1
User Interface
The Tall/Skinny => Short/Wide Dialog
This dialog allows you to configure how pivoting is performed.
247
TIBCO Spotfire DecisionSite 9.1.1 for Lead Discovery - User's Manual
248
Option
Description
Identity
Each unique value in the chosen column produces a row in the generated
table.
You can choose more than one column. Doing so means that the new
table will have a separate row for each unique combination of values in
the chosen columns.
Category
Each unique value in the chosen column produces a new column in the
generated table.
Selecting more than one column means that the new table will have a
separate column for each unique combination of values in the chosen
columns.
Values
The column selected under Values is the column from which the data is
pulled. It is possible to select more than one Value column.
The values in the generated table are always computed as the average of
values in the original table, unless the original values are strings. If so,
values in the generated table will consist of concatenated strings. To
change the way the values are calculated, right-click on the Method and
select a different method from the list, or use Ctrl+click to select
Working with the Data
multiple methods.
Other Columns
This option allows you to include an overall average of a particular
measurement, for each row in the generated table. For each column
selected here, one new column will be created in the new table. To
change the way the measurements are calculated, right-click on the
Method and select a different method from the list, or use Ctrl+click to
select multiple methods.
Method Selection List
Right-click on the Method to change the method of calculation for your column. Ctrl+click to
select multiple methods.
► To reach the Tall/Skinny => Short/Wide dialog:
Select Data > Pivot Data....
7.7
7.7.1
Depivot Data
Depivot Data Overview
Pivoting, in its simplest form, means rotating a table. While the Pivot Data tool transforms a
table from the tall/skinny variant to the short/wide form, the Depivot Data tool does the
opposite. While most tools in DecisionSite require that data is short and wide, there may be
occasions when you want to view data in a different form, such as a bar chart visualization
showing different years on the x-axis.
249
TIBCO Spotfire DecisionSite 9.1.1 for Lead Discovery - User's Manual
7.7.2
7.7.2.1
Using Depivot Data
Depivoting the Data Set
► To depivot the current data set:
1.
2.
3.
4.
5.
6.
7.
7.7.2.2
Select Data > Depivot Data....
Response: The Depivot (Short/Wide => Tall/Skinny) dialog is opened.
In the Available columns list, click to select the columns that you want to transform.
Comment: For multiple selection, press Ctrl and click on the desired columns in the
Available columns list. You can sort the columns in the list alphabetically by clicking
on the Name bar.
Click on the Add >> button to send the selected columns to the Columns to
transform list.
Comment: These columns should be the ones that contain the actual values and that
you want to combine into a new value column. For example, "Sales 2005", "Sales
2004" and "Sales 2003".
In the Available columns list, click to select the columns that you want to pass
through the depivoting process without any transformation.
Click on the Add >> button to send the selected columns to the Columns to pass
through list.
Comment: These columns can contain other categorical information, IDs, etc. For
example, "Region", "Name" or "Priority".
Type a new Category column name in the provided text field.
Comment: For instance, "Year" could be used when sales figures for several different
years are to be combined to a single column.
Select the data Type for the new column from the drop-down list.
Type a new Value column name in the provided text field.
Comment: For instance, "Sales" containing sales figures for several different years.
Select the data Type for the new column from the drop-down list.
Click OK.
Example of Depivoting
Depivoting a data set means changing it from a short/wide format to a tall/skinny format.
Consider the following short/wide table, containing sales data for a fictive company:
250
Name
Region
Sales 2003
Sales 2004
Sales 2005
Connelly
New Jersey
23
22
25
Fallon
New Jersey
34
37
38
Smiths
New York
21
30
32
Bergman
New York
35
35
35
Taylor
Texas
24
23
24
Roberts
Texas
31
30
29
Miller
Texas
29
32
33
Hanegan
Florida
24
26
25
Working with the Data
Suzuki
Japan
45
38
39
Takahashi
Japan
47
40
45
Olsen
Europe
26
25
29
Ottosson
Europe
25
24
26
Olsson
Europe
23
22
28
James
Florida
32
If you want to view how the sales figures from the different regions vary during the years in a
bar chart, the current format is not always optimal. By depivoting the data set to a tall/skinny
format with all sales figures in a single column, you will be able to create a suitable bar chart
with minimal effort.
Name
Region
Year
Sales
Connelly
New Jersey
Sales 2003
23
Connelly
New Jersey
Sales 2004
22
Connelly
New Jersey
Sales 2005
25
Fallon
New Jersey
Sales 2003
34
Fallon
New Jersey
Sales 2004
37
Fallon
New Jersey
Sales 2005
38
Smiths
New York
Sales 2003
21
Smiths
New York
Sales 2004
30
Smiths
New York
Sales 2005
32
Bergman
New York
Sales 2003
35
Bergman
New York
Sales 2004
35
Bergman
New York
Sales 2005
35
Taylor
Texas
Sales 2003
24
Taylor
Texas
Sales 2004
23
Taylor
Texas
Sales 2005
24
Roberts
Texas
Sales 2003
31
Roberts
Texas
Sales 2004
30
Roberts
Texas
Sales 2005
29
Miller
Texas
Sales 2003
29
Miller
Texas
Sales 2004
32
Miller
Texas
Sales 2005
33
Hanegan
Florida
Sales 2003
24
Hanegan
Florida
Sales 2004
26
251
TIBCO Spotfire DecisionSite 9.1.1 for Lead Discovery - User's Manual
Hanegan
Florida
Sales 2005
25
Suzuki
Japan
Sales 2003
45
Suzuki
Japan
Sales 2004
38
Suzuki
Japan
Sales 2005
39
Takahashi
Japan
Sales 2003
47
Takahashi
Japan
Sales 2004
40
Takahashi
Japan
Sales 2005
45
Olsen
Europe
Sales 2003
26
Olsen
Europe
Sales 2004
25
Olsen
Europe
Sales 2005
29
Ottosson
Europe
Sales 2003
25
Ottosson
Europe
Sales 2004
24
Ottosson
Europe
Sales 2005
26
Olsson
Europe
Sales 2003
23
Olsson
Europe
Sales 2004
22
Olsson
Europe
Sales 2005
28
James
Florida
Sales 2003
James
Florida
Sales 2004
James
Florida
Sales 2005
32
The resulting data set can easily be displayed as a bar chart showing the total sum of sales for
each year, categorically colored by region:
► How to do it:
1.
2.
252
Select Sales 2005, Sales 2004 and Sales 2003 as Columns to transform.
Select Region and Name as Columns to pass through.
Working with the Data
3.
4.
5.
7.7.3
7.7.3.1
Type Year as the Category column name and make sure String is the selected data
type.
Type Sales as the Value column name and select the data type Integer.
Click OK.
User Interface
Depivot (Short/Wide => Tall/Skinny) Dialog
Option
Description
Available columns The columns available for use in the depivot operation.
Click a column name in the list to select it. To select more than one
column, press Ctrl and click the column names in the list. Use one of
the Add >> buttons to send the selected column to either the Columns to
transform or Columns to pass through field, see below.
Enter text here
If you have a data set with many columns, you can right-click on the
header of the columns in the Available columns list box and select Show
Search Field from the pop-up menu. This will display a search field
where you can type a search string and limit the number of items in the
list. It is possible to use the wildcard characters * and ? in the search.
Add >>
Moves selected columns from the Available columns field to the field
next to the button.
253
TIBCO Spotfire DecisionSite 9.1.1 for Lead Discovery - User's Manual
<< Remove
Removes a column and brings it back to the Available columns field.
Remove All
Removes all columns from the selected columns fields.
Columns to
transform
The selected columns containing the values that you wish to combine
into a single column. The column names of these columns will be used
as category values in the resulting new category column. Typically, this
might be a number of columns containing the same type of data. For
example, sales figures for different years.
Keep NULL
values
Select this check box to transfer empty values to the depivoted data
view. If the check box is cleared, all records containing empty values
will be discarded.
Columns to pass
through
The selected columns containing information that should be transferred
to the depivoted data set without any transformation. This could be ID
columns, categorical information such as Region, Priority etc.
Category column
name (contains
old column
names)
Type a column name that summarizes the information provided in the
columns that you have selected to transform. For instance, "Year" could
be used when sales figures for several different years are to be combined
to a single column.
Value column
name
Type a column name that shows what type of information is included in
the new value column. For instance, "Sales" would be a good name for a
column containing sales figures for several different years.
Type
Specify the data type for the respective column. A column containing
names should be set to string, whereas a column containing figures
should be decimal or integer.
► To reach the Depivot (Short/Wide => Tall/Skinny) dialog:
Select Data > Depivot Data....
7.8
7.8.1
Transpose Data
Transpose Data Overview
The Transpose Data tool is used to rotate a data set, so that columns become records and vice
versa. Transposing may be necessary if you want to be able to use your data in a certain type of
visualization or if you just want to get a better overlook the data.
7.8.2
7.8.2.1
Using Transpose Data
Transposing Columns
Transposing a data set means rotating it, so that columns become records and vice versa.
► To transpose columns:
1.
2.
3.
254
Select Data > Transpose Data....
Response: The Transpose Data wizard step 1 is opened.
Select an identifier column from the drop-down list.
Comment: Each value in the selected column will become a column name in the
transposed data set
Select whether to create columns from All records or just Selected records.
Working with the Data
4.
5.
6.
7.
8.
9.
7.8.2.2
Comment: The transposed data set will have the same number of columns as the
number of records selected. The upper limit is 5000.
Click Next >.
Response: Step 2 of the wizard is shown.
Select the columns you want to include in the transposed data set, and click Add >> .
Comment: Each selected column will become a separate record in the transposed data
set.
Click Next >.
Response: Step 3 of the wizard is shown.
If required, select annotation columns.
Comment: Each transposed column will be annotated with the value of this column.
Click Finish.
Response: A message box appears, prompting you to save your previous data set.
Click Yes to save the previous data set.
Response: The new, transposed data set replaces the original data set.
Example of Transposing
Transposing a data set means rotating it, so that columns become records and vice versa.
Consider the following table, describing a series of meteorological observations:
Day
Temperature
Wind
Humidity
Monday
16
5
75
Tuesday
19
8
70
Wednesday
17
10
70
Thursday
24
9
65
Friday
26
2
75
Saturday
27
2
80
Sunday
25
4
80
As we add more observations, the table grows taller, but remains four columns wide. While
useful during data collection, this format may not be appropriate for certain types of
calculations or visualizations. By transposing this table, the following can be produced:
Transposed
columns
Tuesday
Wednesday
Thursday
Friday
Temperature
19
17
24
26
Humidity
70
70
65
75
► To produce this result:
1.
2.
3.
4.
In a visualization, select (using the query devices) the records Tuesday, Wednesday,
Thursday and Friday.
Launch the Transpose Data tool.
Select Day as identifier column.
Select Work on: Selected records.
255
TIBCO Spotfire DecisionSite 9.1.1 for Lead Discovery - User's Manual
5.
7.8.3
7.8.3.1
Select Temperature and Humidity as value columns.
User Interface
Transpose Data Wizard Step 1
Option
Description
Identifier column
Each value in the selected identifier column will become a column
name in the transposed data set.
Work on: All records Creates a column for each record in the data set. Note that this may
result in a very large number of columns.
Work on: Selected
records
Creates a column for each record selected in the data set.
► To reach the Transpose Data wizard:
Select Data > Transpose Data....
256
Working with the Data
7.8.3.2
Transpose Data Wizard Step 2
Option
Description
Available columns
The columns available for transposing. Only numerical columns are
displayed.
Value columns
The columns selected for transposing.
Add >>
Moves a column to the Value columns field.
<< Remove
Removes a column from the Value columns field.
► To reach the Transpose Data wizard:
Select Data > Transpose Data....
257
TIBCO Spotfire DecisionSite 9.1.1 for Lead Discovery - User's Manual
7.8.3.3
Transpose Data Wizard Step 3
Option
Description
Available columns
The columns available for annotation.
Annotation columns
The columns selected for annotation.
Add >>
Moves a column to the Annotation columns field.
<< Remove
Removes a column from the Annotation columns field.
► To reach the Transpose Data wizard:
Select Data > Transpose Data....
7.9
7.9.1
Hierarchical Clustering
Hierarchical Clustering Overview
The Hierarchical Clustering tool groups records and arranges them in a dendrogram (a tree
graph) based on the similarity between them.
7.9.2
7.9.2.1
Using Hierarchical Clustering
Initiating a Hierarchical Clustering
► To start a clustering:
1.
258
Select Data > Clustering > Hierarchical Clustering....
Response: The Hierarchical Clustering dialog is displayed.
Working with the Data
2.
Select the value columns on which to base the clustering from the Available columns
list and click Add >>.
Comment: For multiple selection, press Ctrl and click on the desired columns in the
Available columns list. Then click Add >> to move the selected columns to the
Selected columns list. You can sort the columns in the list alphabetically by clicking
on the Name bar.
3. Click a radio button to select whether to work on All records or Selected records.
4. Select a method to Replace empty values with from the drop-down list.
5. Select which Clustering method to use for calculating the similarity between clusters.
Comment: Click for information about available clustering methods.
6. Select which Similarity measure to use in the calculations.
Comment: Click for information about available similarity measures.
7. Select which Ordering function to use for displaying the results.
Comment: Click for information about available ordering functions.
8. Type a new Column name in the text box or use the default name.
Comment: Select the Overwrite check box if you want to overwrite a previously
added column using the same name. Clear the check box to keep old columns.
9. Select the Calculate column dendrogram check box if you want to create a column
dendrogram.
10. Click OK.
Response: The Hierarchical Clustering dialog is closed and the clustering is started.
The result is displayed according to your settings in the dialog.
7.9.2.2
Hierarchical Clustering on Keys
A structure key is a string that lists the substructures which form a compound. Clustering on
keys, then means grouping compounds with similar sets of substructures.
Clustering on keys is based only on the values within the key column, and not all the columns.
The key column should contain comma separated string values for all or some of the records in
the data set.
The procedure below only shows you how to cluster records based on a specific key column.
► To cluster on keys:
1.
2.
3.
4.
5.
6.
7.
8.
9.
If you have not already done it, you should first import the keys that you want to
cluster on into Spotfire DecisionSite.
Select Data > Clustering > Hierarchical Clustering on Keys....
Response: The Hierarchical Clustering on Keys dialog is displayed.
Select the Key column on which to base the calculations.
Comment: The key column could be any string column in the data set.
Click a radio button to select whether to work on All records or Selected records.
Select which Clustering method to use for calculating the similarity between clusters.
Comment: Click for information about available clustering methods.
Select which Similarity measure to use in the calculations.
Comment: Click for information about available similarity measures.
Select which Ordering function to use for displaying the results.
Comment: Click for information about available ordering functions.
Type a new Column name in the text box or use the default name.
Comment: Select the Overwrite check box if you want to overwrite a previously
added column using the same name. Clear the check box to keep old columns.
Click OK.
259
TIBCO Spotfire DecisionSite 9.1.1 for Lead Discovery - User's Manual
Response: The Hierarchical Clustering on Keys dialog is closed and the clustering is
started. A heat map and a row dendrogram visualization is created and information
about the clustering is added to the visualization as an annotation.
7.9.2.3
Adding a Column from Hierarchical Clustering
The ordering column which is added to the data set upon performing a hierarchical clustering is
used only to display the row dendrogram and to connect it to the heat map. In order to compare
the hierarchical clustering results to those of a K-means clustering, you must first add a
clustering column to your data set.
A clustering column contains information about which cluster each record belongs to, and can
be used to create a trellis plot.
► To add a clustering column:
1.
2.
3.
4.
Perform a hierarchical clustering and locate the Row dendrogram which can be found
to the left of the heat map.
Comment: For more information on how to create the row dendrogram, see Initiating a
hierarchical clustering.
If the cluster line is not visible (a dotted red line in the row dendrogram), right-click
and select View > Cluster scale from the pop-up menu to display it.
Comment: The cluster line will enable you to see how many clusters you are selecting
in the dendrogram.
Click on the red circle on the cluster slider above the dendrogram and drag it to control
how many clusters you want to include in the data column. You can also use the left
and right keyboard arrow keys to step through the different number of clusters.
Response: All clusters for the current position on the cluster slider are shown as small,
red circles in the dendrogram.
Comment: If you position the red circle at its rightmost position on the cluster slider,
you get one cluster for each record. If you position it at its leftmost position, you get a
single cluster that includes all records. The number of clusters is displayed as a
ToolTip which is shown when clicking and holding the left mouse-button on the red
circle on the cluster slider.
Select Add Cluster Column from the row dendrogram menu.
Response: A column with information about which cluster each record belongs to, is
added to the data set.
Comment: Records in the data set that are not included in the row dendrogram will
have empty values in the new clustering column.
Tip: You can also click on the Add Clustering Column button,
column from the last row dendrogram.
7.9.2.4
, to add a clustering
Marking and Activating Nodes in the Dendrogram
Marking nodes
To mark a node, click just outside it and drag to enclose the node within the frame that appears
and then release. You can also press Ctrl and click on the node to mark it. To mark more than
one node, press Ctrl and click on all the nodes you want to mark. To unmark all nodes, drag to
select an area outside the dendrogram.
When you mark a node or a number of nodes, the marked parts of the dendrogram are shaded in
the color used for marked records, by default green as shown below. The corresponding records
are also marked in the heat map and other visualizations.
260
Working with the Data
Note: It is only possible to mark nodes in the row dendrogram, not in the column dendrogram.
Activating nodes
To activate a node, click on it in the dendrogram. The node gets a black ring around it. Only
one node can be active at a time. The node remains active until another node is activated. It is
possible to zoom in on the active node in the dendrogram by selecting Zoom to Active from the
Hierarchical Clustering menu or from the dendrogram pop-up menu.
Highlighting nodes
Highlighting nodes in the dendrogram does not have any effect on the visualizations.
7.9.2.5
Zooming in the Dendrogram
You can zoom to a subtree in the row dendrogram, either by using the visualization zoom bar or
the Zoom to Active command in the pop-up menu. The pop-up menu is brought up by rightclicking in the dendrogram.
Double-clicking on a node will give the same results as the Zoom to Active command. Doubleclicking a white surface in the dendrogram (no node) will take back the zooming one step,
unlike the Reset Zoom command which takes you all the way back to the original zooming
position.
The dendrogram can also be shown in log scale. This only affects the display of the
dendrogram. The numbers in the cluster slider are not transformed into log values. Select View
> Log Scale from the pop-up menu to view the dendrogram this way.
7.9.2.6
Resizing the Dendrogram
It is possible to adjust how much of the space in the visualization will be occupied by the
dendrogram. This can be especially useful if the heat map contains a single column and the
dendrogram structure is complex.
► To resize the dendrogram:
First click on the dendrogram to make sure it is in focus. Then, press Ctrl and use the left or
right arrow key on the keyboard to make the dendrogram slimmer or wider.
Comment: You cannot make the dendrogram or the heat map completely disappear by resizing
them in the visualization.
261
TIBCO Spotfire DecisionSite 9.1.1 for Lead Discovery - User's Manual
7.9.2.7
Exporting a Dendrogram
Note: The Hierarchical Clustering tool allows the dendrograms to be saved with the Analysis.
However, it is also possible to export the dendrograms separately and import them again via the
Hierarchical Clustering: Dendrogram Import dialog.
► To export a dendrogram:
1.
Perform a hierarchical clustering.
Comment: For more information, see Initiating a hierarchical clustering.
2. Locate the dendrogram(s) in the created heat map visualization.
3. Select Export > Row Dendrogram or Column Dendrogram from the menu in the
top left of the heat map visualization.
Comment: The command Export > Column Dendrogram is only available if you
selected to create a column dendrogram during the calculation.
Response: A Save As dialog is displayed.
4. Type a File name and save the file as a DND file.
Comment: The entire tree structure is saved even if only part of it is visible at the
moment of saving.
Tip: To save the dendrogram and heat map as an image, use one of the Reporting tools of
Spotfire DecisionSite: PowerPoint® Presentation, Word Presentation or Export as Web Page.
7.9.2.8
Importing a Dendrogram
Note: The Hierarchical Clustering tool allows the dendrograms to be saved with the Analysis.
However, it is still possible to save the dendrograms separately and import them again via the
Hierarchical Clustering: Dendrogram Import dialog.
► To import a saved dendrogram:
1.
2.
3.
4.
5.
6.
7.
262
Select Data > Clustering > Hierarchical Clustering....
Response: The Hierarchical Clustering dialog is displayed.
Click Import....
Response: The Hierarchical Clustering: Dendrogram Import dialog is displayed.
Click the Browse... button by the Row dendrogram field.
Response: An Open File dialog is displayed.
Locate the previously exported Row dendrogram file (*.dnd) and click Open.
Comment: Only dendrograms associated with the active data set can be opened. If
there is a column missing in the data set, or if the names of the columns in the data set
have been changed since the dendrogram was saved, an error message will appear and
no dendrogram can be displayed.
Decide if you want to open a corresponding column dendrogram or not. Browse to
locate the Column dendrogram file similarly to steps 3-4 above.
Type a Column name or use the default one.
Comment: Select the Overwrite check box to overwrite a column with the same name
in the data set.
Click OK.
Comment: The column containing the hierarchical clustering order of the dendrogram
is added to the data set. A heat map visualization is created with the dendrogram(s)
displayed on the side(s).
Working with the Data
7.9.3
7.9.3.1
User Interface
Hierarchical Clustering Dialog
Option
Description
Available
columns
Displays all available data columns on which you can perform a
clustering. Click a column name in the list and click Add >> to move it
to the Selected columns list. To select more than one column, press Ctrl
and click the column names in the list, then click Add >>. You can
choose from all columns that contain real numbers or integers.
Note: You can right-click on the Name header to get a pop-up menu
where you can select other attributes you would like to be visible.
Enter text here
If you have a data set with many columns, you can right-click on the
header of the columns in the Available columns list box and select Show
Search Field from the pop-up menu. This will display a search field
where you can type a search string and limit the number of items in the
list. It is possible to use the wildcard characters * and ? in the search.
Selected columns
Displays the currently selected data columns on which you want to
perform a clustering.
Add >>
Adds the highlighted data column to the list of selected columns.
<< Remove
Removes the highlighted data column from the list of selected columns
and places them back in the list of available columns.
263
TIBCO Spotfire DecisionSite 9.1.1 for Lead Discovery - User's Manual
Work on: All
records
All records in the value columns are included in the calculations.
Work on:
Selected records
Only the selected records are included in the calculations.
This lets you filter out any records that you do not want to include in the
calculations, using the query devices and zooming.
Replace empty
values with
Defines how empty values in the data set should be replaced in the
clustering. Constant allows you to replace the empty values by any
constant (type a number in the text box). Row average replaces the
value by the average value of the entire row. Row interpolation sets the
missing value to the interpolated value between the two neighboring
values in the row. Column average returns the average of the
corresponding column values.
Clustering
method
The clustering method to use for calculating the similarity between
clusters. Click here for a description of the available methods.
Similarity
measure
The similarity measure to use for the clustering. Click here for a
description of the available similarity measures.
Ordering
function
The ordering function to use for the clustering. Click here for a
description of the available ordering functions.
Column name
The name of the new columns containing the results from the
hierarchical clustering.
Overwrite
Select this check box if you want to replace a previously added column
and plot (with the same name as the one typed in the Column name text
box) when you add a new column. Clear the check box if you wish to
keep the old column and plot.
Calculate column Select this check box to calculate a column dendrogram during the
clustering.
dendrogram
Import...
Opens the Hierarchical Clustering: Dendrogram Import dialog where you
can import row and column dendrogram files.
► To reach the Hierarchical Clustering dialog:
Select Data > Clustering > Hierarchical Clustering....
264
Working with the Data
7.9.3.2
Hierarchical Clustering on Keys Dialog
Option
Description
Key column
The data column on which to base the calculations. The key column
should contain comma separated string values for all or some of the
records in the data set.
Work on: All
records
All records in the value columns are included in the calculations.
Work on:
Selected records
Only the selected records are included in the calculations.
This lets you filter out any records that you do not want to include in the
calculations, using the query devices and zooming.
Clustering
method
The clustering method to use for calculating the similarity between
clusters. Click here for a description of the available methods.
Similarity
measure
The similarity measure to use for the clustering. Click here for a
description of the available similarity measures.
Ordering
function
The ordering function to use for the clustering. Click here for a
description of the available ordering functions.
Column name
The name of the new columns containing the results from the
hierarchical clustering.
Overwrite
Select this check box if you want to replace a previously added column
and plot (with the same name as the one typed in the Column name text
box) when you add a new column. Clear the check box if you wish to
keep the old column and plot.
Open...
Opens the Hierarchical Clustering: Dendrogram Import dialog where you
can open row dendrogram files. Column dendrograms are not available
when you are clustering on keys.
265
TIBCO Spotfire DecisionSite 9.1.1 for Lead Discovery - User's Manual
► To reach the Hierarchical Clustering on Keys dialog:
Select Data > Clustering > Hierarchical Clustering....
7.9.3.3
Hierarchical Clustering Dendrogram Import Dialog
Option
Description
Row dendrogram Click on the Browse... button to display an Open File dialog, where you
can select the row dendrogram to open. Only row dendrograms directly
associated with the open data set can be opened.
Column
dendrogram
Click on the corresponding Browse... button to display an Open File
dialog, where you can select the column dendrogram to open. The
column dendrogram option is not available when you are accessing this
dialog from the Hierarchical Clustering on Keys dialog.
Column name
The name of the new columns containing the results from the
hierarchical clustering.
Overwrite
Select this check box if you want to replace a previously added column
(with the same name as the one typed in the Column name text box)
when you add a new column. Clear the check box if you wish to keep the
old column.
► To reach the Hierarchical Clustering: Dendrogram Import dialog:
1.
2.
7.9.3.4
Select Data > Clustering > Hierarchical Clustering....
Click on the Open... button in the lower left part of the dialog to display the
Hierarchical Clustering: Dendrogram Import dialog.
The Row Dendrogram
The row dendrogram shows the similarity between rows and shows which nodes each record
belongs to as a result of the clustering. An example of part of a row dendrogram is shown
below.
The vertical axis of the row dendrogram consists of the individual records, and the horizontal
axis represents the clustering level.
266
Working with the Data
The individual records in the clustered data set are represented by the rightmost nodes in the
row dendrogram. Each remaining node in the dendrogram represents a cluster of all records that
lie to the right of it in the dendrogram. The leftmost node in the dendrogram is thus a cluster
that contains all records.
The row dendrogram is automatically displayed next to the heat map which is created upon
clustering. It can, however, be hidden or displayed by selecting View > Row dendrogram from
the Hierarchical Clustering menu.
7.9.3.5
The Column Dendrogram
The column dendrogram is drawn in the same way as the row dendrogram but shows the
similarity between the variables (the selected value columns). The variables in the clustered
data set are represented by the nodes at the lowest part of the column dendrogram.
To display the column dendrogram (if one has been calculated), select View > Column
Dendrogram from the Hierarchical Clustering menu. The column dendrogram can only be
displayed if it has been calculated (select this in the Hierarchical Clustering dialog).
Restricted functionality
The column dendrogram offers less interactivity than the row dendrogram. You cannot add the
results from the column dendrogram to the data set and so you cannot create visualizations
based on it. There is no cluster slider above the column dendrogram, no cluster line and no
horizontal zooming.
7.9.3.6
Row Dendrogram Menu and Toolbar
Toolbar
The row dendrogram toolbar is located directly above the row dendrogram. The row
dendrogram is automatically created upon clustering and it is located to the left of the heat map.
Click on the buttons in the toolbar to activate the corresponding functions.
Displays the Hierarchical Clustering menu.
Adds a new column to the data set with information about which cluster each record
belongs to. The position of the red circle on the cluster slider above the dendrogram
controls the number of clusters. The column can be used to create a trellis plot of the
clusters.
267
TIBCO Spotfire DecisionSite 9.1.1 for Lead Discovery - User's Manual
Hierarchical Clustering menu
Option
Description
Zoom to Active
Zooms to the selected subtree so that the active node in the row
dendrogram is displayed to the far left of the visualization.
Reset Zoom
Resets the horizontal zooming to its original size so the full width of
the row dendrogram is visible.
View >
> Log Scale
Displays the dendrogram in log scale. Affects only the display of the
dendrogram and not the actual numbers of the calculated similarity
measures.
> Toolbar
Displays or hides the row dendrogram toolbar. If the toolbar has been
hidden, right-click on the row dendrogram and select View > Toolbar
from the pop-up menu to display it again.
> Cluster Scale
Displays or hides the cluster scale (and cluster line) above the row
dendrogram. The cluster scale must be displayed if you want to select
the number of clusters to be included in the added cluster column.
> Column
Dendrogram
Displays or hides the column dendrogram (if one has been created).
> Row
Dendrogram
Displays or hides the row dendrogram.
> Include Empty
Relevant only when you have performed a clustering using selected
records. This produces a Hierarchical Clustering (order) column with
empty values for all of the remaining records. By marking or clearing
the Include Empty option you can determine whether or not to display
the records that were not a part of the clustering calculation in the heat
map. Obviously, no dendrogram can be displayed for these rows.
Remove
Dendrograms
Removes the dendrograms permanently from the visualization.
Add Cluster
Column
Adds a new column to the data set with information about which
cluster each record belongs to. The position of the red circle on the
cluster slider above the dendrogram controls the number of clusters.
The column can be used to create a trellis plot of the clusters.
Overwrite
Selects whether or not to overwrite a Hierarchical Clustering (cluster)
column, when using the Add cluster column function.
Export >
> Row
Dendrogram
Opens a dialog where you can select a file name and save your row
dendrogram.
> Column
dendrogram
Opens a dialog where you can select a file name and save your column
dendrogram.
Note: The Hierarchical Clustering tool allows the dendrograms to be saved with the Analysis.
However, it is still possible to export the dendrograms separately and then import them from
within the Hierarchical Clustering: Dendrogram Import dialog.
268
Working with the Data
7.9.3.7
Dendrogram Pop-up Menus
Right-click in the dendrogram to bring up the pop-up menu.
Row dendrogram pop-up menu:
Option
Description
Zoom to Active
Zooms horizontally so that the active node in the row dendrogram is
displayed to the far left of the visualization.
Reset Zoom
Resets the horizontal zooming to its original size so the full width of
the row dendrogram is visible.
View >
> Log Scale
Displays the dendrogram in log scale. Affects only the horizontal
distances in the dendrogram and not the actual numbers of the
calculated similarity measures.
> Toolbar
Displays or hides the row dendrogram toolbar. If the toolbar has been
hidden, right-click on the row dendrogram and select View > Toolbar
from the pop-up menu to display it again.
> Cluster Scale
Displays or hides the cluster scale (and cluster line) above the row
dendrogram. The cluster scale must be displayed if you want to select
the number of clusters to be included in the added cluster column.
> Column
Dendrogram
Displays or hides the column dendrogram (if one has been created).
> Row
Dendrogram
Displays or hides the row dendrogram.
> Include Empty
Relevant only when you have performed a clustering using selected
records. This produces a Hierarchical Clustering (order) column with
empty values for all of the remaining records. By marking or clearing
the Include Empty option you can determine whether or not to display
the records that were not a part of the clustering calculation in the heat
map. Obviously, no dendrogram can be displayed for these rows.
Remove
Dendrograms
Removes the dendrograms permanently from the visualization.
Add Cluster
Column
Adds a new column to the data set with information about which
cluster each record belongs to. The position of the red circle on the
cluster slider above the dendrogram controls the number of clusters.
The column can be used to create a trellis plot of the clusters.
Overwrite
Selects whether or not to overwrite a Hierarchical Clustering (cluster)
column, when using the Add cluster column function.
Column dendrogram pop-up menu:
Option
Description
Zoom to Active
Zooms so that the active node in the column dendrogram is displayed at
the top of the visualization.
Reset Zoom
Resets the zooming to its original size so the full width of the row
269
TIBCO Spotfire DecisionSite 9.1.1 for Lead Discovery - User's Manual
dendrogram is visible.
View >
> Log Scale
7.9.3.8
Displays the dendrogram in log scale. Affects only the horizontal
distances in the dendrogram and not the actual numbers of the
calculated similarity measures.
Cluster Slider in Dendrogram
The scale above the row dendrogram is the cluster slider. The numbers above the scale refer to
the number of clusters at different positions in the dendrogram. The numbers below the scale
refer to the calculated similarity measures. When you move the cursor over the scale, the
number of clusters and the similarity measure at that position are given in a ToolTip.
Upper scale
The upper scale assists you in selecting the number of clusters before creating a new clustering
column. Click on the red circle on the cluster slider and drag it to the horizontal position you
want. The selected clusters are indicated as red circles in the dendrogram. The total number of
clusters is shown in a ToolTip as long as you hold down the mouse button.
Lower scale
The lower scale shows the calculated similarity measure in the dendrogram. The position of a
node along the scale represents the similarity measure between the two subnodes in that node
(there are always exactly two subnodes in each node). In the figure below, the similarity
measure between the two subnodes in the active node is indicated by the dotted orange arrow.
The vertical distance has no mathematical meaning in the dendrogram.
Note: There is no cluster slider above the column dendrogram. You cannot create clusters in a
column dendrogram and you cannot export information about the column dendrogram as a new
column.
Tip: The cluster slider can also be moved by using the left and right arrows on the keyboard.
This increases or decreases the number of clusters in a stepwise fashion.
270
Working with the Data
7.9.4
7.9.4.1
Theory and Methods
Hierarchical Clustering Method Overview
Hierarchical clustering arranges objects in a hierarchy with a treelike structure based on the
similarity between them.
The graphical representation of the resulting hierarchy is called a dendrogram, or a tree graph.
This figure shows a small part of a dendrogram.
In Spotfire DecisionSite, the vertical axis of the dendrogram consists of the individual records
and the horizontal axis represents the clustering level. The individual records in the clustered
data set are represented by the rightmost nodes in the row dendrogram. Each remaining node in
the dendrogram represents a cluster of all records that lie below it to the right in the
dendrogram, thus making the leftmost node in the dendrogram a cluster that contains all
records.
Misapplication of clustering
Clustering is a very useful data reduction technique. However, it can easily be misapplied. The
clustering results are highly affected by your choice of similarity measure and other input
parameters. You should bear this in mind when you evaluate the results. If possible, you should
replicate the clustering analysis using different methods. Apply cluster analysis with care and it
can serve as a powerful tool for identifying patterns within a data set.
7.9.4.2
Hierarchical Clustering Algorithm
The algorithm used in the Hierarchical Clustering tool is a hierarchical agglomerative method.
This means that the cluster analysis begins with each record in a separate cluster, and in
subsequent steps the two clusters that are the most similar are combined to a new aggregate
cluster. The number of clusters is thereby reduced by one in each iteration step. Eventually, all
records are grouped into one large cluster.
► This is how it works:
1.
2.
3.
4.
5.
7.9.4.3
The similarity between all possible combinations of two records is calculated using a
selected similarity measure.
Each record is placed in a separate cluster.
The two most similar clusters are grouped together and form a new cluster.
The similarity between the new cluster and all remaining clusters is recalculated using
a selected clustering method.
Steps 3 and 4 are repeated until all records eventually end up in one large cluster.
Required Input for Hierarchical Clustering
When you start a clustering you need to specify a number of parameters.
271
TIBCO Spotfire DecisionSite 9.1.1 for Lead Discovery - User's Manual
The parameters are set in the Hierarchical Clustering dialog that you reach by selecting
Clustering > Hierarchical Clustering from the Data menu.
You need to answer the following questions:
•
•
•
7.9.4.4
Which clustering method should be used to calculate the similarity between clusters?
Which similarity measure should be used to calculate the similarity between records?
Which ordering function should be used for drawing the dendrogram?
Hierarchical Clustering Ordering Function
The ordering function controls in what vertical order the records (rows) are plotted in the row
dendrogram. The two subclusters within a cluster (there are always exactly two subclusters) are
weighted and the cluster with the lower weight is placed above the other cluster. The weight can
be any one of the following:
• Input rank of the records. This is the order of the records during import to
DecisionSite.
• Average value of the rows. For example, a record a with 5 dimensions would have the
average (a1+a2+a3+a4+a5 )/5. The average for a record a with k dimensions is calculated
as
Calculating the weight of a cluster
To calculate the weight w3 of a new cluster C3 formed from two subclusters C1 and C2 with a
weight of w1and w2, and each containing n1 and n2 records, you use the following expression:
7.9.4.5
Hierarchical Clustering References
Hierarchical clustering
Mirkin, B. (1996) Mathematical Classification and Clustering, Nonconvex Optimization and Its
Applications Volume 11, Pardalos, P. and Horst, R., editors, Kluwer Academic Publishers, The
Netherlands.
Sneath, P., Sokal, R. R. (1973) Numerical taxonomy, Second Edition, W. H. Freeman, San
Francisco.
General information about clustering
Hair, J.F.Jr., Anderson, R.E., Tatham, R.L., Black, W.C. (1995) Multivariate Data Analysis,
Fourth Edition, Prentice Hall, Englewood Cliffs, New Jersey.
7.9.4.6
7.9.4.6.1
Similarity Measures
Similarity Measures Overview
Spotfire DecisionSite contains several tools which calculate the similarity between different
records (e.g., Hierarchical Clustering, K-means Clustering and Profile Search). Calculating
similarities can be useful if you want to create lists of similar records which may possibly be
treated as a group or if you want to find the record that is most similar to another record. The
following similarity measures can be used to calculate the resemblance between records:
• Euclidean distance
• Correlation
272
Working with the Data
• Cosine correlation
• City block distance
• Tanimoto coefficient (only available for Profile Search and Hierarchical Clustering)
• Half square Euclidean distance (only available for Hierarchical Clustering)
Note: When used in clustering, some of the similarity measures may be transformed so that
they are always greater than or equal to zero (using 1 – calculated similarity value).
Dimensions
The term dimension is used in all similarity measures. The concept of dimension is simple if we
are describing the physical position of a point in three dimensional space when the positions on
the x, y and z axes refer to the different dimensions of the point. However, the data in a
dimension can be of any type. If, for example, you describe a group of people by their height,
their age and their nationality, then this is also a three dimensional system. For a record, the
number of dimensions is equal to the number of variables in the record.
7.9.4.6.2
Euclidean Distance
The Euclidean distance between two profiles, a and b, with k dimensions is calculated as
The Euclidean distance is always greater than or equal to zero. The measurement would be zero
for identical profiles and high for profiles that show little similarity.
The figure below shows an example of two profiles called a and b. Each profile is described by
five values. The dotted lines in the figure are the distances (a1-b1), (a2-b2), (a3-b3), (a4-b4) and
(a5-b5) which are entered in the equation above.
7.9.4.6.3
Correlation
The Correlation between two profiles, a and b, with k dimensions is calculated as
where
This correlation is called Pearson Product Momentum Correlation, simply referred to as
Pearson's correlation or Pearson's r. It ranges from +1 to -1 where +1 is the highest
correlation. Complete opposite profiles have correlation -1.
273
TIBCO Spotfire DecisionSite 9.1.1 for Lead Discovery - User's Manual
Profiles with identical shape have
maximum correlation.
Perfectly mirrored profiles have the
maximum negative correlation.
7.9.4.6.4
Cosine Correlation
The Cosine correlation between two profiles, a and b, with k dimensions is calculated as
where
The cosine correlation ranges from +1 to -1 where +1 is the highest correlation. Complete
opposite profiles have correlation -1.
Comparison between Cosine correlation and Correlation
The difference between Cosine correlation and Correlation is that the average value is
subtracted in Correlation. In the example below, the Cosine correlation will be +1 between any
combination of profiles a, b, and c, but it will be slightly less than that between profile d and
any of the other profiles (+0.974). However, the regular Correlation will be +1 between any of
the profiles, including profile d.
7.9.4.6.5
City Block Distance
The City block distance between two profiles, a and b, with k dimensions is calculated as
274
Working with the Data
The City Block distance is always greater than or equal to zero. The measurement would be
zero for identical profiles and high for profiles that show little similarity.
The figure below shows an example of two profiles called a and b. Each profile is described by
five values. The dotted lines in the figure are the distances (a1-b1), (a2-b2), (a3-b3), (a4-b4) and
(a5-b5) which are entered in the equation above.
In most cases, this similarity measure yields results similar to the Euclidean distance. Note,
however, that with City block distance, the effect of a large difference in a single dimension is
dampened (since the distances are not squared).
The name City block distance (also referred to as Manhattan distance) is explained if you
consider two points in the xy-plane. The shortest distance between the two points is along the
hypotenuse, which is the Euclidean distance. The City block distance is instead calculated as
the distance in x plus the distance in y, which is similar to the way you move in a city (like
Manhattan) where you have to move around the buildings instead of going straight through.
7.9.4.6.6
Tanimoto Coefficient
The Tanimoto coefficient between two rows, a and b, with k dimensions is calculated as
The Tanimoto similarity measure is only applicable for a binary variable, and for binary
variables the Tanimoto coefficient ranges from 0 to +1 (where +1 is the highest similarity).
7.9.4.6.7
Half Square Euclidean Distance
The Half square Euclidean distance between two profiles, a and b, with k dimensions is
calculated as
The Half square Euclidean distance is always greater than or equal to zero. The measurement
would be zero for identical profiles and high for profiles that show little similarity.
The figure below shows an example of two profiles called a and b. Each profile is described by
five values. The dotted lines in the figure are the distances (a1-b1), (a2-b2), (a3-b3), (a4-b4) and
(a5-b5) which are entered in the equation above.
275
TIBCO Spotfire DecisionSite 9.1.1 for Lead Discovery - User's Manual
7.9.4.7
Cluster similarity methods
7.9.4.7.1
Cluster Similarity Methods
A hierarchical clustering starts by calculating the similarity between all possible combinations
of two records using a selected similarity measure. These calculated similarities are then used to
derive the similarity between all clusters that are formed from the records during the clustering.
You select one of the following clustering methods:
• UPGMA
• WPGMA
• Single linkage
• Complete linkage
• Ward's method
7.9.4.7.2
UPGMA
UPGMA stands for Unweighted Pair-Group Method with Arithmetic mean.
Assume that there are three clusters called C1, C2 and C3 including n1, n2 and n3 number of
records. Clusters C2 and C3 are aggregated to form a new single cluster called C4.
The similarity between cluster C1 and the new cluster C4 in the example above is calculated as
where
sim = the similarity between the two indexed clusters and
7.9.4.7.3
WPGMA
WPGMA stands for Weighted Pair-Group Method with Arithmetic mean.
Assume that there are three clusters called C1, C2 and C3 including n1, n2 and n3 number of
records. Clusters C2 and C3 are aggregated to form a new single cluster called C4.
The similarity between cluster C1 and the new cluster C4 in the example above is calculated as
where
sim = the similarity between the two indexed clusters.
7.9.4.7.4
Single Linkage
This method is based on minimum distance. To calculate the similarity between two clusters,
each possible combination of two records between the two clusters is compared. The similarity
between the clusters is the same as the similarity between the two records in the clusters that are
most similar.
7.9.4.7.5
Complete Linkage
This method is based on maximum distance and can be thought of as the opposite of Single
linkage. To calculate the similarity between two clusters, each possible combination of two
records between the two clusters is compared. The similarity between the two clusters is the
same as the similarity between the two records in the clusters that are least similar.
276
Working with the Data
7.9.4.7.6
Ward's Method
Ward's method means calculating the incremental sum of squares. The similarity measure is
automatically set to Half square Euclidean distance when using Ward's method. This is not
configurable.
Assume that there are three clusters called C1, C2 and C3 including n1, n2 and n3 number of
records. Clusters C2 and C3 are aggregated to form a new single cluster called C4.
The similarity between cluster C1 and the new cluster C4 in the example above is calculated as
where
sim = the similarity between the two indexed clusters
7.10
7.10.1
Profile Search
Profile Search Overview
The Profile Search tool calculates the similarity to a selected profile for all records in the data
set and adds the result as a new column. The records are then ranked according to their
similarity to the master profile.
You can use an existing record from your data set or create an average profile from several
marked records. The built in profile editor makes it possible to edit the master profile.
7.10.2
7.10.2.1
Using Profile Search
Initiating a Profile Search
► To initiate a profile search:
1.
2.
3.
4.
5.
6.
Click to activate the profile that you want to use as master profile in one of the
visualizations or mark a number of profiles on which to base the master profile.
Comment: You can always edit the active or marked profile to obtain a master profile
entirely by your choice.
Select Data > Pattern Detection > Profile Search....
Response: The Profile Search dialog is opened.
Select the value columns on which to base the clustering from the Available columns
list and click Add >>.
Comment: For multiple selection, press Ctrl and click on the desired columns in the
Available columns list. Then click Add >> to move the columns to the Selected
columns list. You can sort the columns in the list alphabetically by clicking on the
Name bar.
Click a radio button to select whether to work on All records or Selected records.
Select a method to Replace empty values with from the drop-down list.
Select whether to use profile from: Active record or Average from marked records.
This is only an option if you have both marked records and an active record to begin
with.
277
TIBCO Spotfire DecisionSite 9.1.1 for Lead Discovery - User's Manual
7.
8.
9.
7.10.2.2
Response: The selected profile is displayed in the profile editor and the name of the
profile is displayed to the left above the profile in the editor.
Comment: You can edit the profile in the editor and type a new name for the edited
profile, if desired.
Select which Similarity measure you want to use for the profile search.
Comment: Click for information about the available similarity measures.
Type a Column name for the resulting column or use the default name.
Comment: Select the Overwrite check box to overwrite an old column with the same
name.
Click OK.
Response: The search is performed using the master profile displayed in the editor, and
the results are added to the data set as a new column. A new scatter plot is created
displaying the rank vs. the similarity, and an annotation containing information about
the calculation settings is added to the visualization.
Changing a Value in a Master Profile
Note: The starting profile does not restrict you in any way. You can easily change or delete
existing values in the profile to create any master profile of your choice.
► To change a value in a master profile:
1.
2.
Select the profile that you want to edit by activating a record in a visualization.
Select Data > Pattern Detection > Profile Search....
Response: The Profile Search dialog is opened. The active profile is displayed in the
profile editor.
3. Select the value columns on which to base the clustering from the Available columns
list and click Add >>.
Comment: For multiple selection, press Ctrl and click on the desired columns in the
Available columns list. Then click Add >> to move the columns to the Selected
columns list. You can sort the columns in the list alphabetically by clicking on the
Name bar.
4. Click Edit....
Response: The Profile Search: Edit dialog is opened.
5. Click directly in the editor to activate the variable that you want to change and drag the
value to obtain a suitable look on the profile.
Response: The new value is immediately displayed in the editor.
Comment: To set a value for a variable with a missing value, select the variable from
the Active column list and type a number in the Value text box.
6. Type a Profile name in the text box or use the default name.
7. Click OK.
Response: The Profile Search: Edit dialog is closed and the edited profile is shown in
the Profile Search dialog. The Edited radio button has been selected by default, but
you can return to the old profile by clicking Use profile from: Active record.
Tip: You can also use the fields below the editor to select an Active column in the profile and
edit its Value.
7.10.2.3
Removing a Value from Profile Search
► To remove a value from a master profile:
1.
2.
278
Activate the profile that you want to edit in a visualization.
Select Data > Pattern Detection > Profile Search....
Working with the Data
Response: The Profile Search dialog is opened. The active profile is displayed in the
profile editor.
3. Click Edit....
Response: The Profile Search: Edit dialog is opened.
4. Click on the value that you want to remove and press Delete.
Response: The value for the variable is removed in the display.
Tip: You can also use the fields below the editor to select an Active column in the profile and
remove its Value by pressing Delete.
7.10.2.4
Interpreting the Results of Profile Search
When a profile search has been performed, the selected profiles or records in the data set have
been ranked according to their similarity to the selected master profile. The value of the
selected similarity measure is added to the data set as a new column.
A new scatter plot can be created (optionally) displaying the Similarity plotted against the
Similarity rank. This means that the record that is most similar to the master profile will be
displayed in the lower, left corner of the visualization.
7.10.2.5
Adjusting the Scale of the Profile Editor
► To adjust the scale of the editor:
1.
Click on the Fit profile to screen button,
, in the Profile Search: Edit toolbar.
, to reset the scale.
2. Click on the Reset original profile scale button,
Tip: You can also select Fit to screen or Reset original scale from the pop-up menu which is
displayed by right-clicking in the edit window.
279
TIBCO Spotfire DecisionSite 9.1.1 for Lead Discovery - User's Manual
7.10.3
7.10.3.1
280
User Interface
Profile Search Dialog
Option
Description
Available
columns
The data columns that you can include in the search. Click a column
name in the list to select it, then click Add >> to move it to the Selected
columns list. To select more than one column, press Ctrl and click the
column names in the list. You can choose from any column that contains
decimal numbers or integers.
Note: You can right-click on the Name header to get a pop-up menu
where you can select other attributes you would like to be visible.
Enter text here
If you have a data set with many columns, you can right-click on the
header of the columns in the Available columns list box and select Show
Search Field from the pop-up menu. This will display a search field
where you can type a search string and limit the number of items in the
Working with the Data
list. It is possible to use the wildcard characters * and ? in the search.
Selected columns
Displays the currently selected data columns that you want to include in
the search.
Add >>
Moves selected columns from the Available columns list to the Selected
columns list.
<< Remove
Removes the selected columns and brings them back to the Available
columns field.
Move Up
Moves the selected columns up in the Selected columns list and
restructures the profile.
Move Down
Moves the selected columns down in the Selected columns list and
restructures the profile.
Work on: All
records
All records in the value columns are included in the calculations.
Work on:
Selected records
Only the selected records are included in the calculations.
This lets you filter out any records that you do not want to include in the
calculations, using the query devices and zooming.
Replace empty
values with
Defines how empty values in the data set should be replaced. Empty
value calculates the similarity between the two profiles based only on the
remaining part of the profile. The result is the same as if the missing
value in the profile had been identical with the value for that variable in
the master profile. Constant allows you to replace the empty values by
any constant (type a number in the text box). Row average replaces the
value by the average value of the entire profile. Row interpolation sets
the missing value to the interpolated value between the two neighboring
values in the profile.
Use profile from:
Active record
Click this radio button to use an active record as the master profile.
Use profile from:
Average from
marked records
Click this radio button to use an average calculated from marked profiles
as the master profile.
Use profile from:
Edited
Click this radio button to use an edited profile as the master profile.
Edit...
Opens the Profile Search: Edit dialog.
Similarity
measure
The similarity measure that you want to use when performing the search.
Column name
The name of the new columns containing the results from the profile
search.
Overwrite
Select this check box if you want to replace a previously added column
(with the same name as the one typed in the Column name text box)
when you add a new column. Clear the check box if you wish to keep the
old column.
Add rank column Select this check box to add a column containing the similarity rank to
the data set. In this column, the profile that is most similar to the master
profile is given the number 1, the second profile is given number 2, etc.
281
TIBCO Spotfire DecisionSite 9.1.1 for Lead Discovery - User's Manual
A new scatter plot can be created (optionally) displaying the Similarity
Create scatter
plot (similarity vs plotted against the Similarity rank. This means that the record that is
most similar to the master profile will be displayed in the lower, left
rank)
corner of the visualization.
► To reach the Profile Search dialog:
Select Data > Pattern Detection > Profile Search....
7.10.3.2
Profile Search Edit Dialog
Edit profile. Allows you to manually edit a single value in the active column by
clicking the value and dragging to the desired level.
Free hand drawing. Allows you to manually edit the values in the master profile by
clicking and dragging the values using the mouse pointer as a free hand drawing tool.
Fit profile to screen. Automatically adjusts the scale to show the entire profile in the
edit window.
Reset original profile scale. Resets the scale to the original value range. Variables
outside the range will no longer be visible in the editor.
282
Option
Description
Active column
Displays all columns available in the profile search.
Value
Displays the value of the active column. To change the value, type a
new number in the box.
Profile name
The name of the edited profile. The name is displayed in the top left
corner of the editorial window and it is also used in the default column
name for the result of the search.
Working with the Data
► To reach the Profile Search: Edit dialog:
1.
2.
7.10.3.3
Select Data > Pattern Detection > Profile Search....
Click Edit... below the displayed profile.
Profile Search Edit Pop-up Menu
The pop-up menu in the profile search editor includes the following options:
Option
Description
Delete
Deletes the value in the active column from the master profile.
Insert
Inserts a new value in the active column at the point of the right-click.
This option is only available if there is a missing value in the master
profile.
Fit to screen
Automatically adjusts the scale to show the entire profile in the edit
window.
Reset original
scale
Resets the scale to the original value range. Variables outside the range
will no longer be visible in the editor.
► To reach the Profile Search Edit pop-up menu:
Right-click in the profile editor.
7.10.4
7.10.4.1
Theory and Methods
Profile Search Method Overview
In a profile search, all profiles (data points or table rows) are ranked according to their
similarity to a master profile. The similarity between each of the profiles and the master profile
is calculated using one of the available similarity measures. A new data column with the value
of the selected similarity measure for each individual profile is added to the original data set as
well as a similarity to master profile rank column.
7.10.4.2
Required Input for Profile Search
You have to specify the following before you can start a profile search:
• Which master profile do you want to use?
• Which similarity measure should be used?
• Should empty values be excluded from the search?
Master profile
You can use an existing (active) profile as master profile or construct a new master profile as
the average of several marked profiles. It is possible to edit the master profile using the built in
editor before you start the search.
Similarity measures
The Profile Search tool can use a variety of similarity measures. Similarity measures express
the similarity between profiles as numbers, thus making it possible to rank the profiles
according to their similarity. For information about the various measures, go to the section
Similarity measures.
283
TIBCO Spotfire DecisionSite 9.1.1 for Lead Discovery - User's Manual
Excluding empty values
The Profile Search tool can exclude empty values from the calculations. See Excluding empty
values for more information.
7.10.4.3
Excluding Empty Values in Profile Search
The Profile Search tool can exclude empty values from the calculations. When you calculate the
similarity between the master profile and a profile that has a missing value, the variable with a
missing value is excluded from the comparison. The calculated similarity between the two
profiles is then based only on the remaining part of the profile. The result is the same as if the
missing value in the profile had been identical with the value for that variable in the master
profile.
Similarity measures based on the profile gradient
If you are using a similarity measure that compares the gradients of the profiles, a missing value
means that two gradients are excluded from the comparison. If we take an extreme example of a
profile where every other value is missing, then there would be no gradients left in the profile to
base the comparison on. Since excluding a missing value has the same effect as setting the
value of the profile to the same value as in the master profile, the profile in this extreme
example would then have the highest possible similarity with the master profile.
Missing values in the master profile
Any missing values in the master profile are always excluded from the search. If, for example,
the second variable in the master profile has no value then this variable is always excluded in
the comparison with the other profiles, even if you have not specified that you want to exclude
empty values.
284
Tools
8
8.1
8.1.1
Tools
Structure Analytics
Structure Analytics Overview
Structures are graphical representations of chemical structures, such as molecules or parts of
molecules. The Structure Analytics tools help you display structures by connecting to one or
more structure databases. This allows you to visually examine the compounds in your data set
by highlighting or marking records of interest. The tools also allow you to manage lists of
compound identifiers generated using structure search, or imported from a file.
Viewing structures:
•
•
•
Structure Viewer is a separate control window which can be used to display structures
of the marked, activated or highlighted compounds in the data set. It can also be used
to manage and compare lists from the various searches.
Structures in Table is a basic table visualization that includes structures from one or
more structure databases.
Structure Marker Labels can be used to display structures when the active visualization
is a scatter plot or a profile chart.
Searching for structures:
•
•
•
Structure Search allows you to browse for, draw, or import a structure or a part of a
structure, and search for it as a substructure, similar structures, etc.
R-group Search allows you to search for structures containing one or more R-groups.
List Search allows you to search for various lists of compound IDs.
Administrating structure tools:
•
•
•
8.1.2
8.1.2.1
8.1.2.1.1
Structure Connection is used to set up and manage your connections to structure
databases.
Add Structure Keys is used to import structure keys which can later be used to cluster
compounds based on their structure using the Hierarchical Clustering tool.
Advanced Preferences is used to specify which structure renderer and editor to use.
Structure Viewer
Using Structure Viewer
Browsing the Data Set for Structures
The Browse tab of the Structure Viewer tool can be used to display structures of compounds in
the data set. Whenever a set of compounds in a visualization has been marked, activated or
highlighted, the structures corresponding to these markers will appear in Structure Viewer. The
reverse is also true: when structures are marked, activated or highlighted the compounds in the
visualization corresponding to the structures will dynamically be marked, activated or
highlighted (if this has been specified in the Properties dialog).
285
TIBCO Spotfire DecisionSite 9.1.1 for Lead Discovery - User's Manual
► To browse the data set:
1.
If the Structure Viewer is not already open, select Tools > Structure Analytics >
Structure Viewer.
Response: The Structure Viewer is displayed.
Comment: If you have not previously connected to a structure database, you may be
prompted to do so now. When the connection is set up, you can start browsing for
structures. If you do not have a data set in DecisionSite, the Structure Viewer will be
empty until you open a data set or perform a search to populate the ID list in Structure
Viewer.
2. Go to the Browse tab.
3. Highlight, activate or mark compounds in a visualization or structures in Structure
Viewer.
Response: The structures corresponding to the compounds chosen in the visualization
appear in Structure Viewer, and the compounds in the visualization corresponding to
the structures in Structure viewer will be highlighted, activated or marked.
Note: Activating and marking have priority over highlighting. This means that as long as a
compound or a group of compounds are activated or marked, highlighting will not have any
effect. If you want to use highlighting, first make sure that no records are marked or activated.
8.1.2.1.2
Example: Creating a Table of Similar Structures
The following example demonstrates how different tools in DecisionSite for Lead Discovery
can be combined to perform a typical task. The goal is to produce a table visualization showing
a number of similar structures and some additional data. To achieve this, we will use the
Structure Viewer, Structure Search, and Structures in Table tools.
► To create a table of similar structures:
1.
Open the data set SAR.sfs in DecisionSite.
Comment: The file is included in the default installation, and can be found under
Data/DrugDiscovery/Structural Activity Relationship. The file
contains typical compound data.
2. Select Tools > Structure Analytics > Structure Connection....
Response: The Structure Connection dialog is displayed.
3. Select Connect to: ISIS Database or SDFile.
Response: The ISIS Connection: Connect dialog is displayed.
4. Click Browse....
5. Locate the file Benzo.db.
Comment: The file is included in the default installation, and can be found under
Data/DrugDiscovery/Structural Activity Relationship. The file
contains ISIS data.
6. Click Next >.
Response: The ISIS Connection: Configure dialog appears.
7. Click Finish, without altering the default settings.
8. Select Tools > Structure Analytics > Structure Viewer.
9. Go to the Browse tab in Structure Viewer.
10. Mark some compounds in a visualization.
Response: The structures corresponding to the marked compounds appear in Structure
Viewer.
11. Double-click one of the structures in Structure Viewer.
Response: The Structure Search dialog is displayed.
12. If desired, click Edit Structure.
286
Tools
13.
14.
15.
16.
17.
18.
19.
20.
21.
8.1.2.1.3
8.1.2.1.3.1
Response: Your structure editor (e.g., ISIS/Draw) is launched with the selected
structure.
In ISIS/Draw (or whatever editor you use), edit the structure.
Click the Spotfire DecisionSite button in the top left-hand corner.
Response: The edited structure is sent back to the Structure Search dialog.
In the Structure Search dialog, select Search for: Substructure and click OK.
Response: In Structure Viewer, a new ID list is added, containing the IDs of the
structures that share the chosen substructure.
In Structure Viewer, select some IDs in the ID list.
Click Menu > Add > New Data Set from Structure Database.
Response: The Add New Data Set from Structure Database dialog is displayed.
Select All compounds.
Select the columns that you want to include in the new data set and click OK.
Response: Since the data set is changed, the DecisionSite ID Column dialog will be
displayed.
In the DecisionSite ID Column dialog, select the ID column for the new data set and
click OK.
Select Tools > Structure Analytics > Structures in Table.
Response: A table visualization with structures and other ISIS data is created.
Working with the ID List
Working with the ID List
The ID lists in the Structure Viewer tool lets you keep track of groups of compounds. Two tabs
allow you to work with two types of lists. Each time you conduct a structure search or list
search or paste a set of IDs, the result is added as a new list in the Lists tab. This way, you can
always go back to a previous list of IDs. The Browse tab contains a single temporary list,
representing the current set of highlighted, active or marked records.
Only the 25 most recent lists are stored on the Lists tab. To save ID lists more permanently, add
the list to the portfolio, or export a list file.
If the Structure Viewer is not already open, select Tools > Structure Analytics > Structure
Viewer.
Action
Instruction
Create a list
Perform a search using the Structure Search or List Search tool.
Change list
Select a list from the drop-down list on the Lists tab.
Display structure
for a compound
ID
Click on a compound ID, or use Ctrl+Click to select multiple identifiers.
Copy a list
In the list, select the desired identifiers.
Right-click and select Copy.
Note that Ctrl + C cannot be used.
Paste a list
Copy a list of identifiers (each on a separate line) from another
application.
In Structure Viewer, right-click in the ID list on the Lists tab and select
Paste.
Note that Ctrl + V cannot be used.
Sort a list
Click on a list heading. Click again to reverse the order. To reset to the
287
TIBCO Spotfire DecisionSite 9.1.1 for Lead Discovery - User's Manual
original order, right-click and select Reset Sort Order.
Right-click and select Select All in ID List.
Select all
identifiers in a list
Mark a
compound in the
visualization
In the list, select the desired identifiers.
Right-click and select Mark in Visualization.
This can be set to happen automatically. See Structure Viewer Properties
dialog.
Rename a list
Add a list to the Lists tab and select it.
Right-click and select Rename ID List... This will launch the Rename
ID List dialog.
Tip: To avoid losing the list of IDs on the Browse tab as soon as you mark a new set, copy it
and paste it to the Lists tab.
8.1.2.1.3.2
Adding List Information to the Data Set
You can add the contents of the ID list (and also include additional columns from the structure
database) as new columns in the current data set.
► To add the list as new columns:
1.
2.
3.
4.
5.
6.
If the Structure Viewer is not already open, select Tools > Structure Analytics >
Structure Viewer.
Response: If you have not previously connected to a structure database, you will be
prompted to do so now. When the structure connection is set up, the Structure Viewer
tool is displayed.
Select Menu > Add > Columns to Data Set....
Response: The Add Columns to Data Set dialog is displayed.
Select whether to base the new columns on All compounds or just the Selected
compounds in the ID list.
Select the check box for the list-based columns you want to create, and/or click to
select additional columns from the structure database from the list.
In the Column name prefix text box, type a prefix for the new columns.
Click OK.
Response: The new columns are added to Spotfire DecisionSite.
Tip: You can also click on the Add Columns to Data Set button
data set.
8.1.2.1.3.3
to add columns to the
Adding an ID List to the Portfolio
The Lists tab in Structure Viewer stores a history of the 25 most recent lists (search results,
imported lists, etc). This is useful for storing results temporarily, but will not save them
permanently. The following procedure describes how to use the Portfolio to save your lists.
► To add the list to the Portfolio:
1.
288
If the Structure Viewer is not already open, select Tools > Structure Analytics >
Structure Viewer.
Response: If you have not previously connected to a structure database, you will be
prompted to do so now. When the connection is set up, the Structure Viewer tool is
displayed.
Tools
2.
Select an ID list from the drop-down list on the Lists tab, or go to the Browse tab if
you want to export the highlighted, active or marked records.
3. In the ID list, select the compounds you want to include in the new Portfolio list.
Comment: If you intend to add all the IDs in the list, it is not necessary to select them.
4. Select Menu > Add > List to Portfolio....
Response: The Add List to Portfolio dialog is displayed.
5. Select whether to add Selected compounds or All compounds.
6. Enter a List name and click OK.
Response: The list is added to the Portfolio.
Tip: You can also save lists as SDFiles, SAR tables or text files.
8.1.2.1.3.4
Importing Structure Database Data to DecisionSite
Note: If you are already working with a data set in DecisionSite, this will be closed before data
from the structure database are imported.
► To import a new data set from ISIS:
1.
If the Structure Viewer is not already open, select Tools > Structure Analytics >
Structure Viewer.
Response: If you have not previously connected to a structure database, you will be
prompted to do so now. When the connection is set up, the Structure Viewer tool is
displayed.
2. Perform a search against the structure database to fill the ID list with the compounds
that you wish to import.
Comment: Use the Structure Search or List Search tools.
3. Select Menu > Add > New Data Set from Structure Database....
Response: The Add New Data Set from Structure Database dialog is displayed.
4. Click to select and include the desired Structure Database columns.
Comment: You can press Shift or Ctrl and click to mark multiple compounds.
5. Click Add >>.
Response: The selected structure database columns are moved to the Import to Spotfire
list on the right.
Comment: To remove a structure database column from the selection, select it in the
Import to Spotfire list and click << Remove.
6. Click OK.
Response: A new data set, based on the current ID list, is imported into DecisionSite.
Tip: You can double-click on the columns to move them back and forth between the lists in the
dialog instead of using the Add >> and << Remove buttons.
8.1.2.1.4
8.1.2.1.4.1
Working with Structures
Copying Structures in Structure Viewer
You can copy a structure from Structure Viewer to the clipboard and paste it into other
applications.
► To copy a structure:
1.
If the Structure Viewer is not already open, select Tools > Structure Analytics >
Structure Viewer.
Response: If you have not previously connected to an ISIS database, you will be
prompted to do so now. When the ISIS connection is set up, the Structure Viewer tool
is displayed.
289
TIBCO Spotfire DecisionSite 9.1.1 for Lead Discovery - User's Manual
2.
3.
Right-click on the structure you want to copy in the Structures pane.
Select Copy from the pop-up menu.
Comment: The contents of this pop-up menu is controlled by ISIS. Please refer to the
ISIS documentation for more information about the available menu options.
4. Paste the structure in another application.
Tip: You can also export a structure as a MOL file.
8.1.2.1.4.2
Displaying Many Structures in Structure Viewer
You can view up to 6 x 6 structures at the same time in Structure Viewer.
► To display many structures:
1.
2.
3.
4.
8.1.2.1.4.3
If the Structure Viewer is not already open, select Tools > Structure Analytics >
Structure Viewer.
Response: If you have not previously connected to a structure database, you will be
prompted to do so now. When the connection is set up, the Structure Viewer tool is
displayed.
Select Menu > Properties.
Response: The Structure Viewer Properties dialog is displayed.
Click in the lower right corner of the cell layout that you want to display in the
Structures pane.
Click OK.
Response: The Structures pane displays the configured number of compounds (if more
than one compound is marked in the ID list).
Spawning Structure Viewer Windows
If you want to keep the structures visible while hiding the Structure Viewer tool, it is possible to
display structures in floating structure windows. The floating viewers always remain on top of
all other windows.
► To display structures in floating structure viewers:
1.
2.
If the Structure Viewer is not already open, select Tools > Structure Analytics >
Structure Viewer.
Response: If you have not previously connected to a structure database, you will be
prompted to do so now. When the connection is set up, the Structure Viewer tool is
displayed.
In the ID List, mark the compounds that you want to display.
Comment: Remember that marking more than a handful of compounds may obscure
your view of the visualizations.
.
Select Spawn Structures from the menu,
Response: The selected structures are displayed in tiled windows, starting with the first
window at the upper left corner of the screen.
Tip: Right-click on a structure window and select Close all structure windows or select Close
Spawned Structures from the Structure Viewer menu to close all of the spawned viewers at
once.
3.
290
Tools
8.1.2.1.5
Exporting Results
8.1.2.1.5.1
Exporting a Structure from Structure Viewer
A structure can be exported from Structure Viewer as a MOL file or as a sketch file. A MOL
file describes a single molecular structure which can contain disjoint fragments. Both formats
can be imported in, e.g., ISIS/Draw.
► To export a structure:
1.
If the Structure Viewer is not already open, select Tools > Structure Analytics >
Structure Viewer.
Response: If you have not previously connected to a structure database, you will be
prompted to do so now. When the connection is set up, the Structure Viewer tool is
displayed.
2. Click on a structure in the structures pane to select it for export.
3. Select Menu > Export > Structure....
Response: The Export Structure to File dialog is displayed.
4. Select a location from the Save in drop-down list.
5. Enter a File name and click Save.
Tip: You can also copy a structure to the clipboard and paste it into other applications.
8.1.2.1.5.2
Exporting a SAR Table from Structure Viewer
A Structure-Activity Relationship (SAR) Table combines chemical and biological data in a
spreadsheet.
Note: Microsoft® Excel must be installed on your PC to use this function.
► To export a SAR table:
1.
If the Structure Viewer is not already open, select Tools > Structure Analytics >
Structure Viewer.
Response: If you have not previously connected to a structure database, you will be
prompted to do so now. When the connection is set up, the Structure Viewer tool is
displayed.
2. Perform searches to populate the ID list.
3. Select an ID list.
4. In the ID list, select the compounds you want to include in the SAR table.
Comment: If you intend to add all the IDs in the list, it is not necessary to select them.
5. Select Menu > Export > SAR Table...
Response: The Export SAR Table dialog is displayed.
6. Select whether to export All compounds or Selected compounds.
7. Select the Structure database columns and Spotfire columns to include in the table.
Comment: You can press Shift or Ctrl and click to select multiple compounds.
8. Click Add >>.
Response: The selected structure database columns and Spotfire columns are moved to
the list on the right called Include in SAR table.
Comment: To remove an item from the SAR table, select it in the list Include in SAR
table and click << Remove.
9. Use the Move up and Move down buttons to change the order of the columns in the
SAR table.
10. Click OK.
Response: Microsoft® Excel is launched, displaying the exported SAR table.
291
TIBCO Spotfire DecisionSite 9.1.1 for Lead Discovery - User's Manual
Tip: You can also click on the Export SAR Table button
to bring up the dialog where the
SAR table export is configured.
Note: Once the SAR table has been exported to Microsoft® Excel, make sure the cells that
contain structures are not resized, or else sorting the table may not work properly.
8.1.2.1.5.3
Exporting an SDFile from Structure Viewer
Structure-data files (SDFiles) contain structures and data for any number of molecules. SDFiles
can be imported into ISIS for Excel or opened directly in Spotfire DecisionSite.
► To export an SDFile:
1.
If the Structure Viewer is not already open, select Tools > Structure Analytics >
Structure Viewer.
Response: If you have not previously connected to a structure database, you will be
prompted to do so now. When the connection is set up, the Structure Viewer tool is
displayed.
2. Perform searches to populate the ID list.
3. Select an ID list.
4. In the ID list, select the compounds you want to include in the SDFile.
Comment: If you intend to include all the IDs in the list, it is not necessary to select
them.
5. Select Menu > Export > SDFile....
Response: The Export SDFile dialog is displayed.
6. Select whether to export All compounds or Selected compounds.
7. Select the Structure database columns and Spotfire columns to include in the table.
Comment: You can press Shift or Ctrl and click to select multiple compounds.
8. Click Add >>.
Response: The selected structure database columns and Spotfire columns are moved to
the list on the right called Include in SDFile.
Comment: To remove an item from the SDFile, select it in the Include in SDFile list
and click << Remove.
9. Use the Move up and Move down buttons to change the order of the columns in the
SDFile.
10. Click OK.
Response: The Save File dialog is displayed.
11. Select a location from the Save in drop-down list box.
12. Enter a File name and click Save.
Tip: You can double-click on columns to move them back and forth between the lists in the
dialog instead of using the Add >> and << Remove buttons.
8.1.2.1.5.4
Exporting a List File from Structure Viewer
► To export a list:
1.
2.
3.
292
If the Structure Viewer is not already open, select Tools > Structure Analytics >
Structure Viewer.
Response: If you have not previously connected to a structure database, you will be
prompted to do so now. When the connection is set up, the Structure Viewer tool is
displayed.
Select an ID list.
In the ID list, select the compounds you want to include in the list.
Comment: If you intend to include all the IDs in the list, it is not necessary to select
them.
Tools
4.
Select Menu > Export > List File...
Response: The Export List File dialog is displayed.
5. Select whether to export All compounds or Selected compounds.
6. Click OK.
Response: The Save As dialog is displayed.
7. Select a location from the Save As dialog.
8. Enter a File name and click Save.
Tip: You can also copy the selected compounds in the ID list to the clipboard by selecting
Menu > Edit > Copy IDs.
8.1.2.2
8.1.2.2.1
User Interface
Structure Viewer User Interface
1. Toolbar
2. Menu
3. List selector
4. ID list
5. Structures pane
6. Connection
1. Structure Viewer toolbar
Includes shortcuts for some of the most common commands in the Structure Viewer menu.
2. Structure Viewer menu
The menu provides all commands required to work with Structure Viewer.
3. List selector
The list selector (on the Lists tab) lets you select an ID list to work with.
293
TIBCO Spotfire DecisionSite 9.1.1 for Lead Discovery - User's Manual
4. ID list
Lists the compounds that are found in searches against the structure database (Lists tab) or the
compounds that are highlighted, active or marked in the visualization (Browse tab). Click on an
ID to display its structure in the Structures pane.
5. Structures pane
Displays the structures for the selected compounds in the ID list. Double-click a structure to
launch Structure Search.
6. Connection
Displays the name of the database that you are currently connected to (Browse tab), or, the
name of the database against which the currently selected search was performed (Lists tab).
8.1.2.2.2
Structure Viewer Menu
The Structure Viewer menu is displayed by clicking
necessary for working with Structure Viewer.
Option
and contains all commands
Description
Edit >
> Copy IDs
Copies the compounds currently selected in the ID list to the
clipboard.
> Copy to List
Copies the compounds currently selected in the active ID list to
the Lists tab for temporary storage.
> Paste
Pastes a list of identifiers, creating a new list in Structure
Viewer. The copied list can be separated with commas or line
break.
Note that Ctrl + V cannot be used.
> Select All in ID List
Selects all records in the current ID list.
> Invert selection in ID
List
Inverts the selection so that all unselected records become
selected and vice versa.
> Mark in Visualization
Marks the records in the visualizations corresponding to the
selected IDs in the list.
> Rename ID List...
Brings up the Structure Viewer: Rename ID List dialog, which
allows you to change the default list name to a name of your
choice.
> Reset Sort Order
Resets the list to the order it had before being sorted.
Add >
294
> List to Portfolio...
Adds the selected compounds in the ID list to the Portfolio as a
new list. The Add to Portfolio dialog will prompt you to enter a
list name. The list is placed as the last item on the root level.
> New Data Set from
Structure Database...
Creates a new data set in Spotfire DecisionSite based on the
compounds in the current list. The data are imported from the
currently active structure database.
> Columns to Data Set...
Adds new columns to the data set. Brings up the Add New
Columns dialog where you can configure what information you
Tools
want to add from the ID list. Records that are not included in
the ID list get empty values in the new columns.
Export >
> Structure...
Exports the structure selected in the Structures pane as a file
(e.g., a MOL file).
> SAR Table...
Exports the compounds in the ID list as a Structure-Activity
Table in Microsoft® Excel. The SAR Table Export dialog will
let you select which structure database columns and Spotfire
columns to include. You must have Microsoft® Excel installed
on your PC to use this function.
> SDFile...
Exports the compounds in the ID list as an SDFile. The Export
SDFile dialog will let you select which structure database
columns and Spotfire columns to include.
> List File...
Exports the compound IDs for compounds in the ID list as an
LST file.
Spawn Structures
Opens floating structure viewer windows for the compounds
selected in the ID list, with each structure in a separate window.
Close Spawned Structures Closes all floating structure viewers.
Properties
8.1.2.2.3
Brings up the Structure Viewer Properties dialog where you can
control how many structures to display at a time in the
Structures pane.
Structure Viewer Pop-up Menus
ID List
Right-click in the ID list to bring up the following pop-up menu.
Option
Description
Copy IDs
Copies the compounds currently selected in the ID list to the clipboard.
Note that Ctrl + C cannot be used.
Copy to List
Copies the compounds currently selected in the active ID list to the
Lists tab for temporary storage.
Paste
Pastes the contents of the clipboard into the ID list. Note that Ctrl + V
cannot be used. (This command is only available in the pop-up menu of
the Lists tab.)
Select All in ID
List
Selects all compounds in the current ID list.
Invert Selection in
ID List
Inverts the selection in the ID list.
Mark in
Visualization
Marks the records selected in the ID list in the visualizations.
Note: You can set Structure Viewer to automatically mark selected
records in the Structure Viewer Properties dialog.
Rename ID List...
Allows you to change the default list name to a name of your choice.
Note: Appears only in the Lists tab.
295
TIBCO Spotfire DecisionSite 9.1.1 for Lead Discovery - User's Manual
Reset Sort Order
Resets the rows in the ID list to the original sort order.
Show All Columns If selected, all columns available in the structure database will be shown
in the ID list. Otherwise, only the IDs are shown.
Structures pane
There is another pop-up menu in the Structures pane. It contains the following commands:
Option
Description
Renderer >
The renderer is the 3rd-party program that is responsible for showing
structures in DecisionSite. For example, ISIS/Draw, MDL Draw, etc.
> Settings
Brings up the renderer settings dialog for the currently selected structure
renderer. The renderer settings is different for different renderers. For
example, if ISIS/Draw is used to render the structures you will be able
to change the settings for hydrogens and atom numbers in the
ISIS/Draw Settings dialog.
> Use Smooth
Drawing
If selected, the structures are rendered using anti-aliasing to soften the
edges. If you experience blurriness or difficulty of seeing details in your
structures, clear this setting to turn off the smooth drawing.
> [list of available
renderers]
The renderer currently selected is indicated by a dot. If you have access
to more than one renderer you can change which one to use to display
the structures in Structure Viewer by clicking on the desired renderer in
this list.
Structure >
> Structure
Search
Starts the Structure Search tool with the currently selected structure as
the search structure.
> R-group Search Starts the R-group Search tool with the currently selected structure as
the search structure.
Note: This tool is only available if you have access to an ISIS/Host
database.
> Export to File
Exports the selected structure as a file (e.g., a MOL file).
Properties
Brings up the Structure Viewer Properties dialog where you can control
how many structures to display at a time in the Structures pane.
Connection
The pop-up menu on the connection at the bottom of Structure Viewer (Browse tab) contains
commands to handle multiple connections for advanced users:
296
Option
Description
[list of available
connections]
If you have more than one structure database connection available you
will see a list of the ones currently open and be able to switch to another
connection here. The connection currently selected is marked with a
dot.
DecisionSite ID
Column
Opens the DecisionSite ID Column dialog, where you can select which
column in your data set to use as ID column in the connection to a
structure database.
Connection
Displays detailed information about the currently active connection,
Tools
8.1.2.2.4
Details...
e.g., the name of the ID columns in the database and in your data set.
This information is set up by your administrator for most types of
connections.
Open New
Connection...
Opens the Structure Connection dialog where you can select the
database or type of database from which structural information is to be
retrieved.
Structure Viewer Toolbar
Displays the Structure Viewer menu.
Searches the ISIS database for structures using substructure search or
similarity search.
Brings up the List Logic dialog where you can compare lists using Boolean
operators (OR, AND or ONLY).
Adds the compounds in the ID list to the Portfolio as a new list. The list is
placed as the last item on root level.
Brings up the Add Columns to Data Set dialog where you can specify which
columns you want to add from the ID list.
Exports the selected compounds in the ID list as a SAR table in Microsoft®
Excel.
8.1.2.2.5
Dialogs
8.1.2.2.5.1
Add List to Portfolio Dialog
Option
Description
Selected
compounds
Add only identifiers that have been selected in the list.
All compounds
Add all identifiers.
List name
Allows you to give the resulting portfolio list a name of your choice.
► To reach the Add List to Portfolio dialog:
•
Select Menu > Add > List to Portfolio... , or
•
click on the Add List to Portfolio button
.
297
TIBCO Spotfire DecisionSite 9.1.1 for Lead Discovery - User's Manual
8.1.2.2.5.2
Add New Data Set from Structure Database Dialog
Option
Description
Selected
compounds
Import data for the selected compounds in the current list only.
All compounds
Import data for all compounds in the current list.
Structure
database columns
Displays the available fields in the structure database that you are
currently connected to.
Import to Spotfire Displays the columns that you have selected to import to Spotfire
DecisionSite as a new data set.
Add >>
Adds the selected structure database columns to the list of what to
Import to Spotfire.
<< Remove
Moves selected columns from the list of what to Import to Spotfire back
to the list of structure database columns.
Move Up
Moves the selected rows in the Import to Spotfire list up one step. The
order of the columns in this list will determine the order of the columns
in the new data set.
Move Down
Moves the selected rows in the Import to Spotfire list down one step.
► To reach the Add New Data Set from Structure Database dialog:
Select Menu > Add > New Data Set from Structure Database....
298
Tools
8.1.2.2.5.3
Add Columns to Data Set Dialog
Option
Description
Selected
compounds
Add data for the selected compounds in the current list only.
All compounds
Add data for all compounds in the current list.
Records included
or not included in
list
Adds a new column with the value "Yes" for records included in the ID
list and "No" for remaining records in the data set.
Sort order
Adds a new column with the sort order of the records in the ID list. The
first record in the list gets the value "1", the second gets "2" and so on.
Records that are not included in the list get an empty value in the new
column.
Click on the column names of those columns you wish to add to the data
Columns from
structure database set. For instance, a similarity column might be included with the
similarity score from a previously performed similarity search. Records
not included in the list get an empty value in the new columns.
Column name
prefix
Allows you to give the resulting columns a name template of your
choice.
Note: Information will only be added to compounds that are already included in the data set.
New records will not be added.
299
TIBCO Spotfire DecisionSite 9.1.1 for Lead Discovery - User's Manual
► To reach the Add Columns to Data Set dialog:
8.1.2.2.5.4
•
Select Menu > Add > Columns to Data Set... , or
•
Click on the Add Columns to Data Set button
.
Rename ID List Dialog
Option
Description
List name
Allows you to give the resulting ID list a name of your choice.
► To reach the Rename ID List dialog:
•
•
8.1.2.2.5.5
300
Select Menu > Edit > Rename ID List..., or
right-click in the ID List and select Rename ID List....
Export SAR Table Dialog
Option
Description
Selected
compounds
Export data for the selected compounds in the current list only.
Tools
All compounds
Export data for all compounds in the current list.
Structure
database columns
Displays the available fields in the structure database that you are
currently connected to.
Spotfire columns
Displays the available columns in the current data set in Spotfire
DecisionSite.
Include in SAR
table
Displays the structure database columns and the Spotfire columns that
you have selected to export as a SAR table.
Add >>
Adds the selected structure database columns and/or Spotfire columns to
the list of what to Include in SAR table.
<< Remove
Moves selected columns from the list of what to Include in SAR table
back to the list of structure database columns and/or Spotfire columns.
Move up
Moves the selected rows in the Include in SAR table list up one step.
The order of the columns in this list determines the order of the columns
in the resulting SAR table.
Move down
Moves the selected rows in the Include in SAR table list down one step.
► To reach the Export SAR Table dialog:
8.1.2.2.5.6
•
Select Menu > Export > SAR Table..., or
•
click on the Export SAR Table button
.
Export SDFile Dialog
Note: SDFile export is supported only from structure databases that work with the MOL-file
structure format.
301
TIBCO Spotfire DecisionSite 9.1.1 for Lead Discovery - User's Manual
Option
Description
Selected
compounds
Export data for the selected compounds in the current list only.
All compounds
Export data for all compounds in the current list.
Structure
database columns
Displays the available columns in the structure database that you are
currently connected to.
Spotfire columns
Displays the available columns in the current data set in Spotfire
DecisionSite.
Include in SDFile
Displays the structure database columns and Spotfire columns that you
have selected to export as an SDFile.
Add >>
Adds the selected structure database columns and/or Spotfire columns to
the list of what to Include in SDFile.
<< Remove
Moves selected fields from the list of what to Include in SDFile back to
the list of structure database and/or Spotfire columns.
Move Up
Moves the selected rows in the Include in SDFile list up one step. The
order of the columns in this list determines the order of the columns in
the resulting SDFile.
Move Down
Moves the selected rows in the Include in SDFile list down one step.
► To reach the Export SDFile dialog:
Select Menu > Export > SDFile....
8.1.2.2.5.7
Export List File Dialog
Option
Description
Selected
compounds
Include the selected compounds/structures in the saved list only.
All compounds
Include the entire current list in the saved list.
► To reach the Export List File dialog:
Select Menu > Export > List File....
302
Tools
8.1.2.2.5.8
Renderer Settings Dialog
The renderer is the program that is responsible for the display of structures in Structure Viewer,
Structure Search and Structures in Table. Prior to DecisionSite 8.2, MDL ISIS/Draw was used
as the renderer for all tools, but in later versions of DecisionSite you may use other renderers as
well.
Note: Other structure renderers may display different type of settings, hence, the dialog you see
may look different from the examples shown here.
ISIS/Draw Settings:
Option
Description
Hydrogens
Determines whether or not hydrogens should be shown in the Structures
display. Choose between Off (no hydrogens are shown), Hetero (only
hydrogens on heteroatoms shown), Hetero/Terminal (only hydrogens
on heteroatoms or terminal atoms are shown), and All (all hydrogens
are shown).
Atom numbers
Determines whether or not atom numbers should be shown in the
Structures display. Choose between Off, On, and Atom-Atom Mapped
(only relevant in reactions where the query specifies exactly which
atoms in the reactants correspond to the atoms in the products).
MDL Draw Settings:
Option
Description
Hydrogens
Determines whether or not hydrogens should be shown in the Structures
display. Choose between Off (no hydrogens are shown), Hetero (only
303
TIBCO Spotfire DecisionSite 9.1.1 for Lead Discovery - User's Manual
hydrogens on heteroatoms shown), Hetero/Terminal (only hydrogens
on heteroatoms or terminal atoms are shown), and All (all hydrogens
are shown).
► To reach the Renderer Settings dialog:
1.
2.
8.1.2.2.5.9
In Structure Viewer, Structure Search or Structures in Table, right-click on a structure.
Select Renderer > Settings from the pop-up menu.
Structure Viewer Properties Dialog
This dialog is used to set the maximum number of structures to be shown in Structure Viewer at
the same time. Here, it is also possible to control how the ID list interacts with the
visualizations, by using the "auto-mark" function.
Option
Description
Auto-mark list
selection
Yes
Changes the set of marked records (in the visualizations) to reflect the
set of selected IDs in the ID list.
No
Does not change the set of marked records.
Structures grid
layout
Click the cell at the bottom-right corner of the desired cell
configuration. The blue area represents the chosen configuration.
► To reach the Structure Viewer Properties dialog:
Select Menu > Properties.
304
Tools
8.1.3
8.1.3.1
Structures in Table
Displaying Structures in a Table Visualization
The Structures in Table tool allows you to incorporate structure images from one or more
structure databases into a table visualization. This makes it possible to create an interactive
SAR (Structure-Activity Relationship) table.
► To launch the Structures in Table tool:
1.
Select Tools > Structure Analytics > Structures in Table.
Response: If you have not previously connected to a structure database, you will be
prompted to do so now. A new table visualization is created, showing a structure for
each compound in the data set. The structure column appears to the far left of the table,
and it will always be visible even if you scroll right in the visualization.
► To add structure columns to a Table:
1.
2.
3.
4.
Right-click on the table visualization.
Response: A pop-up menu is displayed.
Select Add Structure Column > [desired connection] from the pop-up menu.
Comment: If one or more structure database connections have been set up in the
current session, you will see the available connections in the submenu after Add
Structure Column. You can directly select one of them to use in the new structure
column. If you want to open a new connection, click Add Structure Column > With
New Connection... and select the desired connection from the drop-down list.
5. If desired, you can change the renderer used to display the structures from the pop-up
menu, and also change the connection (which database to run against).
Note: The new structure column does not provide a query device.
Tip: To freeze one or more table columns, select Edit > Properties, and in the Table tab set
the number of Frozen columns to 1 (or more).
8.1.3.2
Pop-up Menu
When you right-click in a table visualization you will see the table visualization pop-up menu,
and also some options that are specific to DecisionSite for Lead Discovery and the Structures in
Table tool. The following commands are used by Structures in Table (some of the commands
are available only if you right-click on a structure column):
Option
Description
Add Structure
Column >
Use this option to open another structure column in the current table
visualization. It is possible to display more than one structure column
and to use different connections and/or renderers.
> [list of available
connections]
All live structure database connections that you have opened during the
current DecisionSite session are shown in this list. Click to select the
connection that you want to use for the new structure column.
> With New
Connection...
Opens the Structure Connection dialog, where you can connect to a
different database. A new structure column will be opened with the
connection you specified in the Structure Connection dialog.
Connection >
Shows which database connection the structure column you have
clicked upon is using, and allows you to change the connection to a
different structure database.
> [list of available
All live structure database connections that you have opened during the
305
TIBCO Spotfire DecisionSite 9.1.1 for Lead Discovery - User's Manual
connections]
current DecisionSite session are shown in this list. The active
connection used by the structure column you have clicked upon is
marked with a dot.
> Details...
Displays detailed information about the currently active connection,
e.g., the name of the ID columns in the database and in your data set.
This information is set up by your administrator for most types of
connections.
> Open New...
Opens the Structure Connection dialog, where you can connect to a
different database.
Renderer >
The renderer is the 3rd-party program that is responsible for showing
structures in DecisionSite. For example, ISIS/Draw, MDL Draw, etc.
> Settings
Brings up the renderer settings dialog for the currently selected
structure renderer. The renderer settings is different for different
renderers. For example, if ISIS/Draw is used to render the structures
you will be able to change the settings for hydrogens and atom numbers
in the ISIS/Draw Settings dialog.
> Use Smooth
Drawing
If selected, the structures are rendered using anti-aliasing to soften the
edges. If you experience blurriness or difficulty of seeing details in your
structures, clear this setting to turn off the smooth drawing.
> [list of available
renderers]
The renderer currently selected is marked with a dot. If you have access
to more than one renderer you can change which one to use to display
the structures in Structure Viewer by clicking on the desired renderer in
this list.
Structure >
8.1.4
8.1.4.1
> Structure
Search
Starts the Structure Search tool with the currently selected structure as
the search structure.
> R-group Search
Starts the R-group Search tool with the currently selected structure as
the search structure.
Note: This tool is only available if you have access to an ISIS/Host
database.
> Export to File
Exports the structure you click upon in the table as a file (e.g., a MOL
file).
Structure Search
Searching for Compounds Using Structure Search
The Structure Search tool provides several search algorithms which retrieve molecules with
similarities to the master structure based on things such as substructure, isomers, bonds, exact
matches, etc. See the Structure Search dialog for more information regarding the individual
searches that can be performed. These search methods return a list of identifiers that can be
used in the Structure Viewer tool.
Note: What search methods are available depends on what type of structure connection you are
using. Searches for similarity, isomer, tautomer, parent, and flexmatch are possible only with
remote databases when you connect to ISIS databases.
306
Tools
► To search for compounds in the structure database:
1.
2.
3.
4.
5.
6.
In Structure Viewer or in a table visualization with structures, click to activate the
compound on which you want to base the search.
Right-click on the structure and select Structure > Structure Search... from the popup menu.
.
Comment: You can also click on the Structure Search button in Structure Viewer,
Response: The Structure Search dialog is displayed.
Select one of the alternatives under Search for.
If the Parameters... button becomes available, click on it to edit the parameters
available for the selected search method.
Comment: Only a few of the search methods have additional parameters available. For
example, if you select Similarity search, you must enter a threshold value in the
Similarity Search Parameters dialog. The higher the threshold, the shorter the hit list.
If required, click Edit Structure.
Response: Your selected structure editor is launched. Edit the structure and click the
button (for ISIS/Draw) or the
button (for MDL Draw). Please refer to
the documentation of your current structure editor for more details.
7. Select a Search domain.
Comment: See Search Domains in Structure Search for more information.
8. Click OK.
Response: Structures in the database that match the search criteria are displayed in
Structure Viewer. A new ID list is added.
Tip: You can also start the Structure Search tool by selecting Tools > Structure Analytics >
Structure Search.... Click Import Structure... to base the search on a previously saved
structure or click Edit Structure to draw a new search molecule to use in the search.
8.1.4.2
Search Domains in Structure Search
The Structure Search and the R-group Search allows you to specify a search domain.
Compounds outside the search domain will be ignored during a search. The following options
are available.
8.1.4.3
Option
Description
Entire database
Searches the entire structure database that you are currently connected
to. This is the default setting.
All data in the
data set
Searches among the compounds included in the data set currently open
in Spotfire DecisionSite only.
Selected data in
the data set
Searches among the compounds included in the data set and selected
using the query devices and zooming only.
Current selection
in Structure
Viewer
Searches among the compounds selected in the current ID list only. This
is the currently displayed list on the Lists tab, or the current list on the
Browse tab, depending on which is visible.
Examples of Search Molecules
Substructure
A substructure search will retrieve all structures where the substructure is wholly included.
Hence, it does not have to be a chemically stable structure to produce results. This is the most
common type of structure search.
307
TIBCO Spotfire DecisionSite 9.1.1 for Lead Discovery - User's Manual
Similarity
Performs a search for structures similar to the master structure. Enter a threshold value between
1 and 100. A high value means that only very similar records will be included in the resulting
list.
Exact Match
Performs a search for only those structures identical to the master structure.
Isomer
Isomers are different compounds having the same molecular formula. An isomer search
retrieves all molecules that are geometric isomers and stereoisomers of the master structure.
Examples are cis/trans isomers or chiral molecules.
Tautomer
Tautomers are isomers that are rapidly interconverted. A tautomer search retrieves molecules
that include the same atoms, but have double bonds and hydrogen atoms at different positions.
Examples are Keto/Enol forms of a molecule (RCHOH-CHO <----> RCO-CH2OH ), tautomers
that contain metal bonds and molecules that contain charges and radicals.
Parent
Retrieves molecules that are parent molecules of a salt query.
Example:
R-group
Retrieves molecules that contain structural fragments at specific sites within a molecule.
Additional settings can be changed in the R-group Search dialog. Example of an R-group query
in ISIS/Draw:
308
Tools
Flexmatch
Retrieves molecules that exactly match the master structure, except in the ways specified in the
Structure Search: Edit Flexmatch Parameters dialog.
8.1.4.4
8.1.4.4.1
User Interface
Structure Search Dialog
Note: Searches for similarity, isomer, tautomer, parent, and flexmatch are possible only with
remote databases. R-group searches are available for ISIS remote databases via the R-group
Search tool.
Option
Description
Search for:
Substructure
Performs a search for structures containing the substructure.
Search for:
Similarity
Performs a search for structures similar to the master structure. Open
the Similarity Search Parameters dialog and type a threshold value
between 1 and 100. A high value means that only very similar records
will be included in the resulting list.
309
TIBCO Spotfire DecisionSite 9.1.1 for Lead Discovery - User's Manual
Search for: Exact
Match
Performs a search for only those structures identical to the master
structure.
Search for: Isomer Retrieves molecules that are geometric isomers and stereoisomers of
the master structure.
Search for:
Tautomer
Retrieves molecules that include the same atoms, but have double
bonds and hydrogen atoms at different positions.
Search for: Parent
Retrieves molecules that are parent molecules of a salt query.
Search for:
Flexmatch
Retrieves molecules that exactly match the master structure, except in
the ways specified in the Flexmatch Search Parameters dialog.
Parameters...
Launches the Parameters dialogs where you can provide search
parameters for some of the search types.
Edit Structure
Launches your current structure editor, where you can edit the structure
before performing the search. The same thing is achieved by doubleclicking the structure. After editing the structure and sending it back to
DecisionSite, the Structure Search dialog is updated with the edited
structure.
Import Structure... Launches the Open dialog where you can select a structure file for use
in the search.
Search domain
Allows you to limit the search to a specified subset of the ISIS
database. See Search domains in Structure Search for more information.
List name
Allows you to give the resulting structure search list a name of your
choice.
Connected to
Displays the database you are currently running against.
By right-clicking on the database name you can display a pop-up menu
where it is possible to change to another database.
► To reach the Structure Search dialog:
Select Tools > Structure Analytics > Structure Search....
310
Tools
8.1.4.4.2
Flexmatch Search Parameters Dialog
Option
Description
Type of Charge Allows you to specify the type of charge you want to match, or you can turn
them both off so as not to match any specific charge.
Match
Type of Bond
Match
Allows you to specify the type of bond you want to match, or you can turn
them both off so as not to match any specific bond.
Match on
Allows you to select the item or substance on which you want to match.
► To reach the Flexmatch Search Parameters dialog:
1.
2.
8.1.4.4.3
Select Tools > Structure Analytics > Structure Search....
Select Search for: Flexmatch and click on the Parameters... button.
Similarity Search Parameters Dialog
Option
Description
Threshold value
Type a threshold value between 1 and 100. A high value means that
only very similar records will be included in the resulting list.
311
TIBCO Spotfire DecisionSite 9.1.1 for Lead Discovery - User's Manual
► To reach the Similarity Search Parameters dialog:
1.
2.
3.
8.1.4.4.4
Select Tools > Structure Analytics > Structure Search....
Select Search for: Similarity Search.
Click on Parameters....
Pop-up Menus
Structures pane
If you right-click on the structure in Structure Search or R-group Search you will see a pop-up
menu with the following commands:
Option
Description
Edit...
Opens the selected structure in your current structure editor.
Renderer >
The renderer is the 3rd-party program that is responsible for showing
structures in DecisionSite. For example, ISIS/Draw, MDL Draw, etc.
> Settings
Brings up the renderer settings dialog for the currently selected structure
renderer. The renderer settings is different for different renderers. For
example, if ISIS/Draw is used to render the structures you will be able
to change the settings for hydrogens and atom numbers in the
ISIS/Draw Settings dialog.
> Use Smooth
Drawing
If selected, the structures are rendered using anti-aliasing to soften the
edges. If you experience blurriness or difficulty of seeing details in your
structures, clear this setting to turn off the smooth drawing.
> [list of available
renderers]
The renderer currently selected is indicated by a dot. If you have access
to more than one renderer you can change which one to use to display
the structures in Structure Viewer by clicking on the desired renderer in
this list. R-group search supports ISIS/Draw as renderer only.
Structure >
> Export to File...
Exports the selected structure as a file (e.g., a MOL file).
> Import from
File...
Launches the Open dialog where you can select a structure file for use
in the search.
Connection
The pop-up menu on the connection at the bottom of the dialog contains commands to handle
multiple connections for advanced users:
312
Option
Description
[list of available
connections]
If you have more than one structure database connection available you
will see a list of the ones currently open and be able to switch to another
connection here. The connection currently selected is marked with a
dot.
DecisionSite ID
Column...
Opens the DecisionSite ID Column dialog, where you can select which
column in your data set to use as ID column in the connection to a
structure database.
Connection
Details...
Displays detailed information for the currently active connection. This
information is set up by your administrator for most types of
connections.
Tools
Open New
Connection...
8.1.5
8.1.5.1
Opens the Structure Connection dialog where you can select the
database or type of database from which structural information is to be
retrieved.
R-group Search
Performing an R-group Search
An R-group search is conducted using the R-group Search tool. The R-group search requires
that you define a root structure and preferably one or more R-group substituents in ISIS/Draw.
Below is a short example of how this is done. Please refer to the ISIS/Draw documentation for
more detailed information.
Note: R-group search is possible only with remote databases.
► To search for a structural fragment at a specific site in a
molecule:
1.
2.
3.
4.
In the visualization, mark the compound on which you want to base the search.
Comment: If desired, you can also draw the entire search molecule.
Select Tools > Structure Analytics > R-Group Search....
Response: The R-group Search dialog is displayed.
Click Edit....
Response: ISIS/Draw is launched.
Edit the structure by adding R-group labels to specific sites, or create a new root
structure.
Example:
5.
6.
. Click on the atom or bond
Comment: To add an R-group: Select the Atom tool,
where you wish to add the R-group. Select More... from the drop-down list (unless R1
is already visible in the list). Select the Query Atom tab. Select Rgroup... from the
Symbol list. Select R1 (or another symbol). Click OK twice.
Create the R-group substituents that you wish to allow on the R-group site.
Comment: Draw structural fragments that would fit on the root structure. Select
Chemistry > R-Query > Attachment. Enter the number of attachment points that you
require. (If an R-group is attached to two bonds on the root structure, you must
designate two attachment points.) Click on your substituent structure to specify the
attachment point where you want it to attach to the root structure.
Specify the R-group that the substituents belong to.
Example:
Comment: Select all the desired members. Click Chemistry > R-Query > Rgroup.
Click the name of the R-group to create (such as R1 or R2) and click OK.
313
TIBCO Spotfire DecisionSite 9.1.1 for Lead Discovery - User's Manual
7.
If desired, specify R-group conditions by clicking Chemistry > R-Query > R-Logic
and making your selections in the dialog.
Example:
Comment: R1 > 0 means that there must be at least one substituent on the root
structure.
button.
Click the
Comment: If Chem Inspector pops up to say that there are problems with transferring
the structure to Spotfire DecisionSite, change the Intended use drop-down list option
from Local mol query to Host Database > Molecule Query, close Chem Inspector
and try again.
9. Response: The edited structure is brought back to the R-group Search dialog.
10. If desired, select either of the check boxes to modify the search.
11. Comment: Only allow substitution at R-groups modifies your search by setting a
flag which says that you do not wish substitutions to occur anywhere but at R-groups.
Allow H substituents in R-groups modifies your search by setting a flag which says
that if an R-group is undefined, it can be substituted by a hydrogen. When the flag is
not set, the R-group can only be substituted by anything else other than hydrogen.
12. Select a Search domain.
Comment: See Search Domains in Structure Search for more information.
13. Type a List name for the resulting list in Structure Viewer.
14. Click OK.
Response: Structures in the database that match the search criteria are displayed in
Structure Viewer. A new ID list is added.
A complete R-group query might look something like this:
8.
Tip: You can also perform R-group searches using the Structure Search tool, but in that case
you need to draw any flags for whether or not other positions on the molecule may be
substituted yourself.
8.1.5.2
R-group Search Dialog
R-group search is used to retrieve molecules that contain structural fragments at specific sites
within a molecule.
314
Tools
Option
Description
Original query
structure
Displays the original query structure before any modification has taken
place.
Modified query
structure
Displays the modified structure on which the query will be performed.
Edit...
Launches ISIS/Draw, where you can edit the structure before performing
the search. The same thing is achieved by double-clicking the structure.
Note: You cannot use MDL Draw to edit R-group searches. Even if you
have specified that you want to use MDL Draw as editor in all tools,
ISIS/Draw will be launched for the R-group search, if it is available. If
you do not have ISIS/Draw installed on your computer, you will not be
able to reach the R-group Search tool.
Import...
Launches the Open dialog where you can select a structure file for use in
the search.
Modifies your search by setting a flag which says that you do not wish
Only allow
substitution at R- substitutions to occur anywhere but at R-groups.
315
TIBCO Spotfire DecisionSite 9.1.1 for Lead Discovery - User's Manual
groups
Modifies your search by setting a flag which says that if an R-group is
Allow H
substituents in R- undefined, it can be substituted by a hydrogen. When the flag is not set,
the R-group can only be substituted by anything else other than
groups
hydrogen.
The original
query has been
modified...
Displays the various modifications which have taken place, and the
reasons for doing so.
Search domain
Allows you to limit the search to a specified subset of the structure
database. See Search domains in Structure Search for more information.
List name
Allows you to give the resulting structure search list a name of your
choice.
Connected to
Displays the structure database you are currently running against.
By right-clicking on the database name you can display a pop-up menu
where it is possible to change to another database.
► To reach the R-group Search dialog:
Select Tools > Structure Analytics > R-group Search....
8.1.6
8.1.6.1
List Search
Using List Search
► To search for structures using a list or compound identifiers:
1.
2.
Select Tools > Structure Analytics > List Search....
Response: The List Search dialog is displayed.
Do one of the following:
Retrieve
structures
for...
Instruction
A list of
compound IDs
Select the Compound IDs radio button.
Enter a list of IDs, separated with carriage return, and click OK.
Compounds in a
list file
Select the Compounds in file radio button.
Enter the name of a list file, or click Browse... to locate one.
Click OK.
Selected data
Before launching the tool, use the query devices to select a group of
compounds.
In the List Search dialog, click Compounds selected in the data set,
then click OK.
All compounds
Click the All compounds in the structure database radio button.
Click OK.
Response: The structures that are found appear in the ID list and in the Structures pane
of Structure Viewer.
316
Tools
8.1.6.2
List Search Dialog
Option
Description
Compound IDs
Searches for your specified Compound IDs. Enter a list of compound
IDs, separated with carriage return.
Compounds in file Searches for compounds in a previously saved list file. Enter the name of
a list file, or click Browse...
Compounds
selected in the
data set
Searches for the compounds selected in the visualizations.
All compounds in
the structure
database
Retrieves all structures in the current structure database. Note that this
may be a very large number of structures. (This option is not available
for all connections.)
List name
Allows you to give the list search result a name of your choice.
Connected to
Shows the currently active connection against which the list search will
be performed.
If you are using multiple structure connections it is possible to switch to
another connection using the pop-up menu.
► To reach the List Search dialog:
Select Tools > Structure Analytics > List Search....
8.1.6.3
Details on List Search vs Item Search
Searching and comparing lists using List Search may result in different outcomes for lists,
depending on whether the list is saved in a list file (LST) or pasted/entered manually. This is
due to the fact that the two searches are performed a bit differently.
In ISIS Base, there are several different types of searches. Two of these are list search and item
search (ID search).
317
TIBCO Spotfire DecisionSite 9.1.1 for Lead Discovery - User's Manual
For list searches, the search is controlled by the content in the list. If there are incorrect IDs in
the list, that is, if the list contains IDs that are not a part of the ID column in the database, the
incorrect IDs will still be included in the resulting list. However, no structures will be available
for these IDs since they do not exist in the database.
For ID searches, each ID is searched for in the database, and only the records that actually exist
in the database will be included in the resulting list.
Spotfire's List Search works similarly to ISIS, so if, in the List Search dialog, you paste the
contents of a list in "Compound IDs" you may get a different result from when you open the list
via "Compounds in list file".
This can also affect you when you are using the List Logic tool together with Structure Viewer.
The List Logic tool always performs an item search, but if you save the list to an external file
and then import it into Structure Viewer via the "Compounds in list file" option in List Search,
you will also perform a list search. This means that the resulting list in Structure Viewer may
look different than it would if you exported the results from List Logic to Structure Viewer
directly.
Example:
Consider that you have an ISIS database containing the IDs 1, 5, 6, 7, etc. (i.e., the IDs 2, 3 and
4 are missing) and you perform any List Logic operation that will result in a list with the IDs 1,
2, 3 and 4. Selecting different outputs from your List Logic operation will produce the
following results after displaying the list in Structure Viewer:
8.1.7
8.1.7.1
Save new list
in
Intermediate
operation
Result in Structure Viewer
Structure Viewer
(none)
A list with the ID 1 is displayed,
together with the structure for this
molecule.
External list file
Use List Search, select the
Compounds in list file radio
button, and browse to open
the external list file.
A list with the IDs 1, 2, 3, 4 is
displayed, but since only the ID 1 is
represented in the database, this is the
only ID that can display a structure.
Add Structure Keys
Adding Structure Keys
A structure key is a string that lists the substructures which form a compound. When you
import keys from a structure database, this information is added to the data set as a new
column. The structure keys can then be used to cluster the compounds based on their structure,
using the Hierarchical Clustering on Keys tool.
► To add structure keys to the data set:
1.
2.
3.
4.
5.
318
Select Tools > Structure Analytics > Add Structure Keys....
Response: The Add Structure Keys dialog appears.
Select a Structure keys column.
Comment: If you cannot find a suitable structure keys column in the drop-down list,
you should contact your database administrator.
Select whether to add keys to all records or just to selected records in the data set.
Click OK.
Response: Structure keys are imported from your structure database and added to the
data set. In some cases, an annotation is added to the column in DecisionSite, listing
Tools
the available keys. This is used by the Hierarchical Clustering tool to help interpret the
structure keys.
Comment: The records not found in the database will have empty values in the new
column.
Tip: You can now cluster your compounds based on their structures.
8.1.7.2
Add Structure Keys Dialog
Option
Description
Structure keys
column
Select the structure database column which contains structure keys.
Note: If you cannot find a suitable structure keys column in the dropdown list, you should contact your database administrator.
Work on
Select whether to add structure keys for all records or just for selected
records.
Connected to
Displays the database you are currently running against.
By right-clicking on the database name you can display a pop-up menu
where it is possible to change to another database.
► To reach the Add Structure Keys dialog:
Select Tools > Structure Analytics > Add Structure Keys....
8.1.8
8.1.8.1
Structure Connection
Structure Connection Overview
Many tools in DecisionSite for Lead Discovery require access to structural data from a
database. The Structure Connection tools are used to determine what type of database to
connect to, and also to manage multiple connections. If you select to connect to a local or
remote ISIS database, or to an SDFile, the ISIS Connection tool will continue to guide you
through the process. For other types of connections your administrator may have set up links to
specific databases that you can select directly from the Structure Connection tool. Once you
have set up a connection, all the Structure Analytics tools in Lead Discovery can be used
without any further database configuration.
Note: A password may be required. Contact your database administrator for more information
about passwords.
319
TIBCO Spotfire DecisionSite 9.1.1 for Lead Discovery - User's Manual
8.1.8.2
Connecting to a Structure Database
► To connect to a database:
1.
Select Tools > Structure Analytics > Structure Connection....
Response: The Structure Connection dialog is displayed.
2. Select a connection from the Connect to: drop-down list.
Comment: The options available in this drop-down list depend on which connections
have been defined by your administrator.
3. Click OK.
Response: If you have selected ISIS Database or SDFile the ISIS Connection:
Connect dialog is displayed, where you select which ISIS database or SDFile to
connect to. See Connecting to an ISIS database for more information on how to
continue. If you have selected SDFile you will need to specify the SDFile to use and
configure it in the Configure SDFile Connection dialog. If you have selected
Embedded structure column in loaded data set you need to configure the structure
column and type in the Configure Structure Connection dialog.
If the configuration was done correctly, you can now launch any Structure Analytics
tool and work with the selected structure database.
Note: You can view all previously opened connections by clicking on Connections... in the
Structure Connection dialog. To close a connection, click to select the connection, then click
Disconnect.
8.1.8.3
Structure Connection Dialog
Note: Multiple connections might be useful to be able to view structures from different
databases simultaneously. However, when you are allowing many connections you must always
remember to check on which connection a search is performed. It is therefore recommended
that you not use multiple connections unless you really must.
320
Option
Description
Connect to
The database or type of database from which structural information
is to be retrieved. The options available in this drop-down list
depend on which connections have been defined by your
administrator.
<description>
The description below the Connect to drop-down list shows
information about the selected database connection. This information
should, in most cases, be provided by your administrator.
Tools
Connections...
Opens the Connections dialog, where you can manually close
previously opened connections during a session.
Cancel
Allows you to close this dialog without opening a new connection.
Note: The changes that you have applied in the Connections dialog
will not be undone when you click Cancel in this dialog. This allows
you to enter the Connections dialog and close connections without
having to open a new connection.
► To reach the Structure Connection dialog:
Select Tools > Structure Analytics > Structure Connection....
8.1.8.4
Connections Dialog
Option
Description
Disconnect
Closes the selected connection.
Details...
When available, displays a window with information about the selected
connection. For ISIS connections, the full path to the database file or
SDFile is shown, together with information about the selected ID columns
in the ISIS database and in DecisionSite.
OK
If you have closed one or more connections using the Disconnect button,
clicking OK will apply these changes.
Note: Once you have applied the changes by clicking OK, the connections
are closed and you must connect again if you want them to come back.
Clicking Cancel in the following Structure Connection dialog will not undo
the closure of connections in this dialog.
► To reach the Connections dialog:
1.
2.
Select Tools > Structure Analytics > Structure Connection....
Click on the Connections... button.
Comment: The Connections... button is only available if you have connected to at least
one structure database.
321
TIBCO Spotfire DecisionSite 9.1.1 for Lead Discovery - User's Manual
8.1.8.5
DecisionSite ID Column Dialog
This dialog is used to specify which column in the current data set in DecisionSite to use as ID
column. The information is used in the connection to a structure database.
► To reach the DecisionSite ID Column dialog:
This dialog is automatically displayed whenever an ID column needs to be specified for the
current data set. For example, this will happen after you have connected to an MDL Direct
database using the Structure Connection tool and try to run any of the structure analytics tools.
If you need to change the ID column once a connection has been set up, you can right-click on
the Connection at the bottom of either of the structure analytics tools and select DecisionSite
ID Column... from the pop-up menu.
8.1.8.6
Configure Structure Connection Dialog
This dialog is used when you have loaded a data set in DecisionSite containing a structure
column, and you have selected to set up a connection to this column. For example, this could be
the structure column of an opened SDFile, or a column of SMILES strings in a text file.
322
Option
Description
Structure column
The column in the data set that contains the structure information.
Structure format
The format of the structure column. Choose from MDL Molfile, MDL
Sketch file, MDL Chime String or SMILES.
ID column
The column in the data set that identifies the compounds.
Tools
► To reach the Configure Structure Column dialog:
1.
2.
3.
8.1.8.7
Select Tools > Structure Analytics > Structure Connection....
Select Embedded structure column in loaded data set.
Click OK.
Configure SDFile Connection Dialog
This dialog is shown when you have selected to set up a direct connection to an SDFile (not via
ISIS).
Option
Description
Structure column
The column in the SDFile that contains the structure information.
Structure format
The format of the structure column. Choose from MDL Molfile, MDL
Sketch file, MDL Chime String or SMILES.
ID column
(SDFile)
The column in the SDFile that identifies compounds.
ID column
(Spotfire)
The column in the data set that identifies compounds. This column must
contain the same type of compound identifiers as the ID column
(SDFile) field (see above).
► To reach the Connect to SDFile dialog:
1.
2.
3.
8.1.8.8
8.1.8.8.1
Select Tools > Structure Analytics > Structure Connection....
Select SDFile.
Click OK.
ISIS Connection
ISIS Connection Overview
The ISIS Connection tool establishes a connection with a local or remote ISIS database, or an
SDFile. Once you have done this, all the Structure Analytics tools in Lead Discovery can be
used without any further database configuration.
Note: A password may be required. Contact your ISIS database administrator for more
information about passwords.
323
TIBCO Spotfire DecisionSite 9.1.1 for Lead Discovery - User's Manual
8.1.8.8.2
Connecting to an ISIS Database
► To connect to an ISIS database:
1.
2.
3.
4.
5.
6.
7.
8.
9.
8.1.8.8.3
Select Tools > Structure Analytics > Structure Connection....
Response: If you have the possibility to connect to multiple structure connection
providers, the Structure Connection dialog is displayed.
Select Connect to: ISIS Database or SDFile.
Click OK.
Response: The ISIS Connection: Connect dialog is displayed.
Select an ISIS database from the drop-down list, or click Browse... to locate a new
one.
Comment: Your installation includes a local sample database, usually located under:
\Program Files\Spotfire\DecisionSite\Data\DrugDiscovery\Structural Activity
Relationship\Benzo.db.
Click Next >.
Response: The ISIS Connection: Configure dialog is displayed. You may also be
prompted for a database password. Please contact your ISIS database administrator for
more information.
Select a Structure field (ISIS).
Comment: This is the ISIS database field that contains structural information.
Select an ID field (ISIS).
Comment: This is the ISIS database field that uniquely identifies compounds. The
column recommended by Spotfire DecisionSite is selected by default and marked with
[Recommended] in the drop-down list.
Select an ID column (Spotfire) (only available if you have data in Spotfire
DecisionSite).
Comment: This is the column in your current data set that uniquely identifies
compounds. It should contain the same compound identifiers as the ISIS ID field.
Click Finish.
Response: If the configuration was done correctly, you can now launch any Structure
Analytics tool and work with the ISIS database.
Connecting to SDFiles
With DecisionSite 9.1 and forward it is possible to open or connect to an SDFile directly.
However, the connection though ISIS Connection is also available to support old workflows.
► To connect to an SDFile via ISIS Connection:
1.
2.
3.
4.
5.
6.
324
Select Tools > Structure Analytics > Structure Connection....
Response: If you have the possibility to connect to multiple structure connection
providers, the Structure Connection dialog is displayed.
Select Connect to: ISIS Database or SDFile.
Response: The ISIS Connection: Connect dialog is displayed.
Select an SDFile from the drop-down list, or click Browse... to locate a new one.
Click Next >.
Response: The ISIS Connection: SDFile Settings dialog is displayed, containing the
guessed field type for each field.
If you wish to change the field type of one or more fields, select those rows you wish
to change and click Change Type.
Select a field type. Note: The guessed type for date is ftext.
Tools
Comment: This drop-down list contains several types you can choose from: ftext,
vtext, long, real, and range. To restore the changed types to the originally guessed
types, click Restore Types. See Field Types for definitions of the various field types.
7. Click OK.
Response: The ISIS Connection: Configure dialog is displayed.
8. Click Finish.
Response: If the configuration was done correctly, the file can now be used as any
database file.
Tip: An SDFile that has been used in a connection is actually converted to a database (db) file.
This file can be found in the temporary directory on your computer (e.g., C:\Documents and
Settings\USER NAME\Local Settings\Temp\). It can be saved as an ordinary db file for future
use. This is especially useful if the conversion of the SDFile takes long time. You can also save
data that have been imported to DecisionSite in an Spotfire Analysis File (File > Save As...) and
use the ISIS Connection tool to connect the data set to the converted db file in a later session.
8.1.8.8.4
Importing an SDFile
SDFiles can be opened directly by Spotfire DecisionSite (File > Open...), but they can also be
imported as a part of a longer analysis sequence.
Below is a short example of how you can combine different structure analytics tools to retrieve
data from an SDFile and later also use that data as a data set in Spotfire DecisionSite.
► To import an SDFile as a data set in DecisionSite:
1.
2.
3.
4.
5.
6.
7.
8.1.8.8.5
Follow the steps in Connecting to SDFiles to set up a connection to the desired SDFile.
Select Tools > Structure Analytics > List Search....
Response: The List Search dialog is displayed.
Click on All compounds in the structure database (retrieve all).
Click OK.
Response: If the Structure Viewer is not already open, it will be displayed.
From the Structure Viewer menu, select Add > New Data Set from Structure
Database....
Select all columns.
Click OK.
SDFiles Field Types
Each field of an SDFile must have a field type in its definition. The field type instructs
ISIS/Base what type of data to store for the field. The following table shows the ISIS/Base
permitted field types with an explanation of the type of data they store. For more information
about the various field types, see MDL documents CTfile Formats and MDL ISIS/Base
Database Maintenance.
Field Type
Definition
Fixed text (FTEXT)
Text of a specified number of alphanumeric characters. A fixed-text
field can store any number of characters up to the maximum number
specified in its definition. However, no fixed-text field can contain
more than 80 characters. (For example, MDL-000001 is the
maximum number of characters that can be entered for a fixed-text
field that has been defined to have a 10 character length.)
Variable text
(VTEXT)
Alphanumeric text of an unlimited length (limited solely by
computer memory).
325
TIBCO Spotfire DecisionSite 9.1.1 for Lead Discovery - User's Manual
Integer (LONG)
For PC, the value of an integer may range from -2147483647 to
+2147483647.
Real (REAL)
A real number such as 1.50. The decimal-place precision of the
number varies with computer systems.
Range (RANGE)
A range of real-number values such as 2.0 - 3.5. The decimal-place
precision of the number varies with computer systems.
8.1.8.8.6
User Interface
8.1.8.8.6.1
ISIS Connection: Connect Dialog
Option
Description
Database
The ISIS database or SDFile from which structural information is to be
retrieved.
Browse...
Click here to browse for a file or database.
► To reach the ISIS Connection: Connect dialog:
1.
2.
326
Select Tools > Structure Analytics > Structure Connection....
In the Structure Connection dialog, select ISIS database or SDFile.
Tools
8.1.8.8.6.2
ISIS Connection: Configure Dialog
Option
Description
Structure field (ISIS)
The field in the ISIS database that contains the structure information.
ID field (ISIS)
The field in the ISIS database that identifies compounds. The
column recommended by Spotfire DecisionSite is selected by default
and marked with [Recommended] in the drop-down list.
ID column (Spotfire)
The column in the data set that identifies compounds. This column
must contain the same type of compound identifiers as the ISIS ID
Field (see above).
► To reach the ISIS Connection: Configure dialog:
1.
2.
3.
8.1.8.8.6.3
Select Tools > Structure Analytics > Structure Connection....
In the Structure Connection dialog, select ISIS database or SDFile.
In the ISIS Connection: Connect dialog, select a database and click Next >.
ISIS Connection: SDFile Settings Dialog
Option
Description
Fields
Displays the guessed field types for each of the fields.
327
TIBCO Spotfire DecisionSite 9.1.1 for Lead Discovery - User's Manual
Change Type
Allows you to change the field type of a field. You can select from
the following types: ftext, vtext, long, real, and range. See SDFiles
Field Types for definitions of the various field types.
Restore Types
Restores all changed field types to the originally guessed types.
► To reach the ISIS Connection: SDFile Settings dialog:
1.
2.
3.
4.
8.1.8.8.6.4
Select Tools > Structure Analytics > Structure Connection....
In the Structure Connection dialog, select ISIS database or SDFile.
Select an SDFile from the drop-down list, or click Browse... to locate a new one.
Click Next >.
ISIS Connection: Password Dialog
Note: Contact your administrator, or consult the ISIS/Base documentation for more information
on the parameters of this dialog.
8.1.8.8.6.5
Option
Description
Username
The predefined user name used to connect to the ISIS database.
Password
The password to the ISIS database.
Host Request Dialog
Note: Contact your administrator, or consult the ISIS/Base documentation for more information
on the parameters of this dialog.
8.1.8.8.6.6
Option
Description
(message string)
A message sent from the host. Typically a request for a password.
Database Password Dialog
Note: Contact your administrator, or consult the ISIS/Base documentation for more information
on the parameters of this dialog.
328
Tools
8.1.8.8.6.7
Option
Description
Database password
The password for this particular file. The password is probably
selected by the owner of the file in order to protect the file from
corruption.
Database Info Dialog
Note: Contact your administrator, or consult the ISIS/Base documentation for more information
on the parameters of this dialog.
8.1.9
8.1.9.1
Option
Description
User name
The name of a registered user.
Password
The password of the user.
Host
The name of the remote host server.
Service
The name of the host service.
Advanced Preferences
Adding Rules for Structure Analytics Tools
Advanced users can specify which structure renderer and editor to use (in some environments
other preferences may also be available), if other than the default tools for a specific type of
connection are desired. For example, if you have access to both ISIS/Host and MDL Direct
329
TIBCO Spotfire DecisionSite 9.1.1 for Lead Discovery - User's Manual
connections, you can specify that you always want to use ISIS/Draw to display and edit
structures and never use MDL Draw.
Note: If your administrator has already specified mandatory rules defining which renderer and
editor you should use, you will not be able to change those preferences with a rule. However, it
will still be possible to temporarily change the renderer for the structures shown in a specific
tool.
► To add rules:
1.
Select Tools > Structure Analytics > Advanced Preferences.
Response: The Advanced Preferences dialog is displayed.
2. Click on Add Rule... and select the type of rule that you want to specify from the
drop-down list.
3. Comment: You can specify which structure renderer and editor to use (in some
environments other preferences may also be available).
4. Response: The Renderer Rule dialog or the Editor Rule dialog is displayed.
5. Specify the Structure format for which the rule should apply.
6. Select the desired Renderer or Editor from the drop-down list.
7. Select whether the rule should be valid for All tools or just a Specific tool, selected
from the drop-down list.
8. Click OK.
Response: The rule is added to your Personal rules in the Advanced Preferences
dialog.
Click OK to close the Advanced Preferences dialog.
Note: For information on how to specify mandatory and recommended rules, see Spotfire
Developer Network.
8.1.9.2
8.1.9.2.1
User Interface
Advanced Preferences Dialog
This dialog is used by advanced users to specify which structure renderer and editor to use (in
some environments other preferences may also be available), if other than the default tools for a
specific type of connection are desired. For example, if you have access to both ISIS/Host and
MDL Direct connections, you can specify that you always want to use ISIS/Draw to display and
edit structures and never use MDL Draw.
Note: If your administrator has already specified mandatory rules defining which renderer and
editor you should use, you will not be able to change those preferences here. However, it will
still be possible to temporarily change the renderer for the structures shown in a specific tool.
330
Tools
Option
Description
Rules (applied in
the order shown)
This list box displays all rules that have been defined on your system.
There are three categories of rules: Mandatory, Personal and
Recommended. The Mandatory rules (if there are any available) have
been set up by your Spotfire DecisionSite administrator to ensure that
you will use a predefined editor, renderer or some other rule. When
mandatory rules have been specified for a certain item, you will not be
able to change the preferences for that item yourself.
Add Rule
Displays a menu where you can select to add a rule for your preferred
Renderer or Editor. There may also be other types of rules available,
depending on your environment.
Edit
Opens the Renderer Rule or Editor Rule dialog, where you can edit the
selected rule.
Delete
Deletes the selected rule.
Move Up
Moves the selected rule up within the Personal rules category. The rules
are applied from the top down, so the order of the rules defined is
important.
Move Down
Moves the selected rule down within the Personal rules category. The
rules are applied from the top down, so the order of the rules defined is
important.
Import...
Opens a dialog where you can browse to a previously exported Spotfire
preference file. After a file has been selected, the Import Rules dialog is
displayed where you can select which of the available rules that you
wish to import. Imported rules will by default be placed at the top of
your Personal rules category.
331
TIBCO Spotfire DecisionSite 9.1.1 for Lead Discovery - User's Manual
Export...
Opens the Export Rules dialog, where you can select to export one or all
of your personal rules to a file.
► To reach the Advanced Preferences dialog:
Select Tools > Structure Analytics > Advanced Preferences.
8.1.9.2.2
Editor Rule Dialog
The editor is the program that will be opened when you need to edit structures prior to a search
(Structure Search and R-group Search for ISIS databases). Prior to DecisionSite 8.2, MDL
ISIS/Draw was used as editor, but in later versions of DecisionSite you may use other editors as
well.
The Editor Rule dialog is used to specify which editor to use in different situations.
Note: If your administrator has defined some mandatory rules, you may not be able to use your
own preferences in the choice of renderer or editor, since mandatory rules have priority before
personal rules.
Option
Description
Structure format
The structure format that you wish the rule to apply to.
Editor
The editor you prefer to use.
Note: You cannot use MDL Draw to edit R-group searches. Even if you
specify that you want to use MDL Draw as editor in all tools,
ISIS/Draw will be launched for the R-group search, if it is available. If
you do not have ISIS/Draw installed on your computer, you will not be
able to reach the R-group Search tool.
Valid for: All tools Select this option to apply the editor rule for all structure tools.
Valid for: Specific
tool
332
Select this option if you just want to apply the editor rule for a specific
tool (select which tool from the drop-down list).
Tools
► To reach the Editor Rule dialog:
1.
2.
8.1.9.2.3
Select Tools > Structure Analytics > Advanced Preferences.
Click on Add Rule and select Editor... from the drop-down menu.
Renderer Rule Dialog
The renderer is the program that is responsible for the display of structures in Structure Viewer,
Structure Search and Structures in Table. Prior to DecisionSite 8.2, MDL ISIS/Draw was used
as the renderer for all tools, but in later versions of DecisionSite you may use other renderers as
well.
The Renderer Rule dialog is used to specify which renderer to use in different situations.
Note: If your administrator has defined some mandatory rules, you may not be able to use your
own preferences in the choice of renderer or editor, since mandatory rules have priority before
personal rules.
Option
Description
Structure format
The structure format that you wish the rule to apply to.
Renderer
The renderer you prefer to use.
Display Settings...
Opens the Renderer Settings dialog for the selected renderer. The
selected settings are saved with the rule, so it is possible to specify two
different rules with the same renderer, but with different display
settings.
Valid for: All tools Select this option to apply the renderer rule for all structure tools.
Valid for: Specific
tool
Select this option if you just want to apply the renderer rule for a
specific tool (select which tool from the drop-down list).
► To reach the Renderer Rule dialog:
1.
Select Tools > Structure Analytics > Advanced Preferences.
333
TIBCO Spotfire DecisionSite 9.1.1 for Lead Discovery - User's Manual
2.
8.1.9.2.4
Click on Add Rule and select Renderer... from the drop-down menu.
Import Rules Dialog
Click to select the rules that you wish to import.
► To reach the Import Rules dialog:
1.
2.
8.1.9.2.5
Select Tools > Structure Analytics > Advanced Preferences....
In the Advanced Preferences dialog, click Import....
Export Rules Dialog
Click to select the rules that you wish to include in the preferences file.
► To reach the Export Rules dialog:
1.
334
Select Tools > Structure Analytics > Advanced Preferences....
Tools
2.
3.
8.2
8.2.1
Make sure that you have added some Personal rules in the Advanced Preferences
dialog.
Click Export....
Portfolio
Portfolio Overview
The Portfolio tool allows records to be arranged into lists. You can also add annotations to both
lists and records.
You work with the same portfolio all the time. It is automatically saved when you make
changes to it. You can import and export contents to and from the Portfolio.
Records are identified using any column in your data set. The record identifier is selected in the
Portfolio: Options dialog.
8.2.2
8.2.2.1
8.2.2.1.1
Using Portfolio
Working with Lists
Working with Lists in Portfolio
This chapter shows you how to add, edit, compare and remove lists in the Portfolio.
8.2.2.1.2
Adding an Empty List to the Portfolio
► To add an empty list:
1.
2.
If the Portfolio tool is not already open, select Tools > Portfolio.
Click on the list (or the Portfolio root) beneath which you want to add the new list.
Comment: A new list is always added to the end of a current collection of lists or
records.
3. Select New > Empty List... from the Portfolio menu.
Response: The Portfolio: New List dialog is displayed.
4. Type a List name of the new list and click OK.
Response: The new list is added to the Portfolio below the selected list.
Comment: You can use cut & paste or drag & drop to paste records and annotations
into the new list.
Tip: You can also select Add New Empty List... from the pop-up menu or click on the Add
new empty list button,
8.2.2.1.3
, to add an empty list to the Portfolio.
Adding a New List of Records to the Portfolio
► To add a new list from marked records:
1.
2.
3.
4.
If the Portfolio tool is not already open, select Tools > Portfolio.
Mark the records you want to include in the new list.
Select New > Add New List from Marked Records from the Portfolio menu.
Response: The Portfolio: New List dialog is displayed.
Type a List name of the new list and click OK.
Response: The new list is added to the Portfolio as the last item on the root level.
Tip: You can also click on the Add new list from marked button,
to the Portfolio.
, to add a list of records
335
TIBCO Spotfire DecisionSite 9.1.1 for Lead Discovery - User's Manual
► To add a new list from search result:
1.
2.
3.
4.
If the Portfolio tool is not already open, select Tools > Portfolio.
Select Search from the Portfolio menu and enter your search string.
Response: The hits from your search are shown beneath the Search pane.
Select New > Add New List from Search Result from the Portfolio menu.
Response: The Portfolio: New List dialog is displayed.
Type a List name of the new list and click OK.
Response: The new list is added to the Portfolio as the last item on the root level.
Note: The new list only contains one copy of each record, even if the search found the
record in many different portfolio lists. If one of the search results is a list name, all of
the records included in that list will be added to the new list.
► To add marked records to the current list:
1.
2.
3.
8.2.2.1.4
If the Portfolio tool is not already open, select Tools > Portfolio.
Mark the records you want included in your current list.
Select New > Add Marked Records to List from the Portfolio menu.
Response: The records are added to the end of the current Portfolio list.
Adding a Grouped List to the Portfolio
Categorical data can be added as a grouped list to the Portfolio. An example of such a grouped
list would be one based on a column with the number of Oxygen atoms. The grouped list would
include underlying lists with records for each number of oxygen atoms.
► To add a grouped list:
1.
2.
3.
4.
5.
8.2.2.1.5
If the Portfolio tool is not already open, select Tools > Portfolio.
Mark the records you wish to include in the new list.
Select New > Grouped List... from the Portfolio menu.
Response: The Portfolio: New Grouped List dialog is displayed.
From the Group new list by field, select the column you wish to base the underlying
lists on.
Type a List name of the new list and click OK.
Response: The new grouped list is added to the Portfolio as the last item on the root
level.
Changing the Name of a List in the Portfolio
► To change the name of a list:
1.
2.
3.
336
If the Portfolio tool is not already open, select Tools > Portfolio.
Click to select the list whose name you want to change.
Select Rename... from the Portfolio menu.
Tools
Response: The Portfolio: Rename List dialog is displayed.
Edit the List name.
Click OK.
Response: The name of the list is updated in the Portfolio.
Tip: You can also right-click and select Rename... from the pop-up menu or press F2 to bring
up the Portfolio: Rename List dialog for a selected list.
4.
5.
8.2.2.1.6
Removing a List or Record from the Portfolio
► To remove a list or a record:
1.
2.
If the Portfolio tool is not already open, select Tools > Portfolio.
Click on the list or record you want to remove.
Comment: Removing a list also removes all underlying lists, records and annotations.
3. Select Delete from the Portfolio menu.
Response: The list or record is removed from the Portfolio.
Tip: You can also right-click on a list or record and select Delete from the pop-up menu or
press Delete on the keyboard to remove it from the Portfolio.
8.2.2.1.7
Adding a New Column from the Portfolio
This function can be used to express the location of records in the Portfolio. You can find out in
which marked lists your records are present. The information is added to your data set as a new
column showing the Portfolio Role for all records.
For each record, the names of the marked lists where the record appears are put together as
strings separated by a semicolon (;). Lists are referred to by the name you have given to them,
and not by the full path through the Portfolio. Records that are not present in any of the marked
lists get the value "Not included" in the new column.
Note: The records that you are studying in the Portfolio must be part of your current data set in
Spotfire DecisionSite. It is only the existing records that get a value in the new column. Any
other records, present either in the Portfolio or Spotfire DecisionSite, get an empty value.
► To add a new column from the Portfolio:
1.
2.
3.
4.
If the Portfolio tool is not already open, select Tools > Portfolio.
Click on the root list if you want to base the new column on the entire Portfolio.
Comment: You can restrict yourself to smaller sections of the Portfolio. Click to select
only the list(s) you want to include. Records that are not present below the selected
list(s) get the value "Not included" in the new column even if they are present in other
unselected lists within the Portfolio.
In the Portfolio: Options dialog, select the Overwrite old column check box if you
want to overwrite the last column added by the Portfolio tool.
Select Add New Column from the Portfolio menu.
Response: A new column is added to the data set.
Comment: Lists are referred to by the name you have given to them, and not by the
full path through the Portfolio. If you have lists with identical names in your Portfolio,
(which is allowed) you will have no way of separating these in the created column. If
you want a unique identification of each list, you must edit the names of the lists to
ensure that there are no duplicate names before the new column is added.
Tip: You can also click on the Add new column button,
8.2.2.1.8
, to perform this function.
Multiple Venn Comparison
Venn diagrams are used to visualize the various overlaps between different lists of data.
Traditional Venn Diagrams are convenient ways to visualize the relationship between two or
337
TIBCO Spotfire DecisionSite 9.1.1 for Lead Discovery - User's Manual
three lists. In Spotfire DecisionSite you can use the Portfolio in combination with the Pie Chart
visualization to generate an alternative visualization to Venn diagrams that allows you to
investigate the overlaps between any number of lists.
► To use the Portfolio for multiple Venn comparisons:
1.
2.
If the Portfolio tool is not already open, select Tools > Portfolio.
Create the lists that you want to compare in the Portfolio.
Tip: First create a main list that will contain all of the lists that you want to compare.
Then add the different lists containing the desired subsets to this list. The result could
be list names like "Greater than 2-fold change", "Unknown bioprocess" and "Unknown
molecular function", for example.
3. Click on the main list containing all of the subset lists (or press Ctrl and click on all
subset lists that you want to investigate).
Comment: Records that are not present below the selected lists get the value "Not
included" in the new column even if they are present in other unselected lists within
the Portfolio.
4. Select Add New Column from the Portfolio menu.
Response: A new column called Portfolio Role is added to the data set.
5. Select Visualization > New Pie Chart from the main DecisionSite menu bar.
Response: A new pie chart is created.
6. Select Portfolio Role as the column to be mapped on both axes.
7. In the Properties dialog of the Pie Chart, select to Color - By Portfolio Role.
8. Select Size - By records count.
9. Click the Labels - All records radio button.
10. Select the Pie records count check box.
Comment: This displays the number of records in each pie.
11. Make sure the Sector value and Sector percentage check boxes are cleared.
Response: Now you have created a pie chart with several pies where each pie
represents the number of records included in each list or combination of lists.
Examining the resulting visualization can quickly give you an overview of the size of the
various overlaps between your lists:
338
Tools
8.2.2.2
8.2.2.2.1
Working with Annotations
Working with Annotations in Portfolio
You can add annotations to lists and records, and to the Portfolio itself.
Annotations can be text strings, integers, real numbers or URLs.
8.2.2.2.2
Adding a New Annotation in the Portfolio
► To add a new annotation:
1.
2.
3.
4.
5.
6.
If the Portfolio tool is not already open, select Tools > Portfolio.
Click to select the object in the Portfolio where you want to add the annotation.
Select New > Annotation... from the Portfolio menu.
Response: The Portfolio: New Annotation dialog is opened.
Enter the Annotation.
Comment: Press Enter to get a line break in the annotation text.
Click Advanced >> to show optional settings.
Comment: The Advanced settings lets you enter both Type and Name for the
annotation. This could be useful if you have a URL annotation, for example. A short
description can be entered in the Name field to help remember the contents of the web
link. Click << Hide to hide the optional settings.
Click OK.
Response: The annotation is added to the selected object in the Portfolio.
Tip: You can also click on the Add new annotation button,
, to add an annotation. You
can double-click on a URL annotation in the Portfolio to open up the specified URL in a
separate browser.
339
TIBCO Spotfire DecisionSite 9.1.1 for Lead Discovery - User's Manual
8.2.2.2.3
Editing an Annotation in the Portfolio
► To edit an annotation:
1.
2.
3.
If the Portfolio tool is not already open, select Tools > Portfolio.
Click on the annotation you want to modify.
Select Edit... from the Portfolio menu.
Response: The Portfolio: Edit Annotation dialog is opened.
4. Edit the Annotation.
Comment: Press Enter to get a line break in the annotation text.
5. Click Advanced >> to show optional settings
Comment: The Advanced settings lets you edit both the Type and the Name of the
annotation. Click << Hide to hide the optional settings.
6. Click OK.
Response: The annotation is updated in the Portfolio.
Tip: You can also right-click and select Edit... from the pop-up menu or press F2 to bring up
the Portfolio: Edit Annotation dialog for a selected annotation.
8.2.2.2.4
Removing an Annotation from the Portfolio
► To remove an annotation:
1.
2.
3.
If the Portfolio tool is not already open, select Tools > Portfolio.
Click on the annotation you want to remove.
Select Delete from the Portfolio menu.
Response: The annotation is removed from the Portfolio.
Tip: You can also right-click on an annotation and select Delete from the pop-up menu or press
Delete on the keyboard to remove the annotation.
8.2.2.3
8.2.2.3.1
Importing and Exporting
Importing a Portfolio
You can import other portfolios into the Portfolio. An imported portfolio will appear as a list
within the Portfolio in Spotfire DecisionSite for Lead Discovery.
► To import a portfolio:
1.
2.
If the Portfolio tool is not already open, select Tools > Portfolio.
Select Import... from the Portfolio menu.
Response: The Open File dialog is opened.
3. From the Files of type drop-down list box, select the format of the portfolio you want
to import.
Comment: You can import files of formats SRP or LST. You can also import XML
files exported from the Portfolio.
4. Locate the portfolio you want to import and click on it.
5. Click Open.
Response: The imported portfolio appears as the last list on the root level in the
Portfolio.
Note: If you export the entire Portfolio from Spotfire DecisionSite for Lead Discovery and
import it again, it will appear as a list in the Portfolio, as will all other portfolios that are
imported.
340
Tools
8.2.2.3.2
Exporting the Portfolio
You can export the contents of the Portfolio in order to share your lists with other users or to
save an old list configuration.
► To export the Portfolio:
1.
2.
If the Portfolio tool is not already open, select Tools > Portfolio.
Click on the root list if you want to export the entire Portfolio.
Comment: You can also export parts of the Portfolio. Press Ctrl and click to select
only those parts you want to export.
3. Select Export Marked Contents... from the Portfolio menu.
Response: The Save File dialog is displayed.
4. Select a location from the Save in drop-down list box.
5. Select a format from the Save as type drop-down list box.
6. Enter a File name and click Save.
Note: If you export the entire Portfolio from Spotfire DecisionSite for Lead Discovery and
import it again, it will appear as a list in the Portfolio, as will all other portfolios that are
imported.
8.2.2.4
Cutting, Copying and Pasting in the Portfolio
► To cut, copy or paste objects in the Portfolio:
1.
2.
If the Portfolio tool is not already open, select Tools > Portfolio.
Click on the object you want to cut or copy.
Comment: Press Ctrl and click to select multiple objects in the Portfolio.
3.
4.
Click the Portfolio menu button,
, to display the Portfolio menu.
Select Cut.
Response: The selected object is removed from the Portfolio and placed on the
clipboard.
Comment: Select Copy to place a copy of the selected object on the clipboard.
5. Click on the list or record in the Portfolio where you want to paste the contents of the
clipboard.
Comment: Lists or records can only be pasted to lists. Annotations can be pasted to
lists or to records.
6. Select Paste from the Portfolio menu.
Response: The list, record or annotation that was placed on the clipboard is pasted into
the Portfolio.
Comment: Lists can also be pasted into tools outside of Portfolio, such as a text editor.
Tip: You can use drag and drop to move objects in the Portfolio. The commands Cut, Copy
and Paste are also available from the pop-up menu.
8.2.2.5
Searching the Portfolio
You can do a free text search of the Portfolio including lists, records and annotations. The
search is case insensitive and uses the wildcards ? and *.
► To search the Portfolio:
1.
If the Portfolio tool is not already open, select Tools > Portfolio.
2.
If the Search pane in the Portfolio is hidden, click on the Search button,
toolbar to display it.
Response: The Search pane is displayed.
, in the
341
TIBCO Spotfire DecisionSite 9.1.1 for Lead Discovery - User's Manual
3.
Enter your search string in the provided field.
Comment: Enter the full element name or add a wildcard symbol to the truncated name
to retrieve the search results.
4. Click Search.
Response: The total number of hits is shown below the Search pane. The first
appearance of the search string is highlighted in the Portfolio.
5. Use the Previous (<<) and Next (>>) buttons to step through all matches to the search
string in the Portfolio.
Response: Each found appearance of the search string is highlighted in the Portfolio,
one at a time, as you step through the result of the search.
Tip: If you want all records found during the search to be automatically marked in the
visualizations, select the Mark on search check box in the Portfolio: Options dialog.
8.2.2.6
8.2.2.6.1
Data Interaction in Portfolio
Marking in Portfolio
Do this in a visualization...
...and this happens in
Portfolio
Mark some records in a visualization.
Nothing happens in the Portfolio.
Do this in Portfolio...
...and this happens in all
visualizations
Click to select a list (or record) in the Portfolio.
You can press Ctrl and click to select multiple
objects in the Portfolio.
The corresponding records are marked
in the visualizations.
Note: To achieve this interaction, the records in the Portfolio must be part of the current data
set in Spotfire DecisionSite. Also, the Mark on browse check box must be selected in the
Portfolio: Options dialog. All records with the same record identifier will be marked, regardless
of whether the specific record was a part of the records used to create the list or not.
Tip: If you only want to mark the records from a selected list and still want to be able to browse
the other lists in the Portfolio, select the list and then choose Mark in Visualization from the
Portfolio menu. Make sure that the Mark on browse check box in the Portfolio: Options dialog
is cleared.
342
Tools
8.2.2.6.2
Activating in Portfolio
Do this in a visualization...
...and this happens in Portfolio
Activate a record in a visualization.
The ID of the active record is shown in the Search
pane in the Portfolio.
If the Search pane is hidden, click on the Search
button in the toolbar to display it.
You can now click on the Search button to search
for the active record within the Portfolio.
Note: You cannot activate lists or records in the Portfolio. When you click an object, it gets
marked.
8.2.3
8.2.3.1
User Interface
Portfolio User Interface Overview
This is the Portfolio user interface:
1. Portfolio menu
The Portfolio menu contains all menu commands required to work with the Portfolio.
2. Portfolio toolbar
Includes shortcuts for some of the most common commands in the Portfolio menu. Click here
for a description of the buttons.
3. Portfolio
This displays the contents of the Portfolio. You can toggle the display of subtrees in the
Portfolio by clicking the plus (+) or minus (-) sign beside a list. The left and right arrow keys on
the keyboard can also be used to collapse or expand a node. All subnodes can be
343
TIBCO Spotfire DecisionSite 9.1.1 for Lead Discovery - User's Manual
expanded/collapsed simultaneously by standing on the top node, e.g., Portfolio, and pressing
the multiplication sign (* or x) or the minus sign (-) on the numeric keypad.
4. Search
Via this pane, you can perform a full text search of the contents of the Portfolio. Enter a string
in the search field and click on Search. You can use the Back (<<) and Forward (>>) buttons to
browse the result from the search. The number of hits from the search are displayed right below
the field. You can use the wildcards ? and * in the search string.
8.2.3.2
Portfolio Menu
The Portfolio menu is displayed by clicking
working with the Portfolio.
and contains all commands necessary for
Option
Description
Undo
Undoes the last delete, edit, move, cut, copy, paste or import operation
in the Portfolio. You can only undo the last operation and not a series of
operations.
Cut
Removes the selected objects from the Portfolio and places them on the
clipboard.
Copy
Places a copy of the selected objects from the Portfolio on the clipboard.
Paste
Pastes the contents of the clipboard below the selected list in the
Portfolio.
Delete
Deletes the selected objects from the Portfolio.
New >
344
> Empty List...
Adds a new empty list to the Portfolio below the selected list.
> List from
Marked...
Adds a new list with the marked records to the Portfolio. The list is
placed as the last item on root level.
> Grouped List...
Adds a new grouped list with the marked records to the Portfolio. This
function first opens the Portfolio: New Grouped List dialog where the
new list is defined. The list is placed as the last item on root level.
> Annotation...
Adds a new annotation to the active object in the Portfolio. This
function first opens the Portfolio: New Annotation dialog where the
annotation is defined.
> Add New List
from Search
Result
Adds a new list containing the results from your free-text search using
the Search pane to the Portfolio. The list is placed as the last item on
root level.
Note: The new list only contains one copy of each record, even if the
search found the record in many different portfolio lists. If one of the
search results is a list name, all of the records included in that list will be
added to the new list.
> Add Marked
Records to List
Adds the marked records from your current visualization into the
Portfolio list.
Tools
Note: You can also right-click in the visualization and add your marked
records into your currently active Portfolio list.
8.2.3.3
List Logic...
Brings up the List Logic dialog where you can compare the marked lists
using Boolean operators (OR, AND or ONLY).
Add New Column
Adds a new column to the data set, with information about the location
of the records within the marked list(s) in the Portfolio.
Rename...
Lets you edit an annotation or the name of a list. This function brings up
either the Portfolio: Edit Annotation dialog or the Portfolio: Rename
List dialog depending on which object you have selected in the
Portfolio.
Import...
Imports a portfolio from a file. The imported portfolio is displayed as a
list and is placed as the last item on root level in the Portfolio.
Export Marked
Contents...
Exports the selected parts of the Portfolio as an SRP, XML or LST file.
Mark in
Visualization
Marks the records that belong to the selected Portfolio list in the
DecisionSite data set and visualizations.
Search
Displays or hides the Search pane, where you can perform a free text
search of the contents of the Portfolio including lists, records and
annotations.
Sort Alphabetic
Lets you sort the contents of your lists alphabetically.
Sort Numeric
Lets you sort the contents of your lists numerically.
Note: This sorting only applies to the leading digits.
Options...
Displays the Portfolio: Options dialog.
Help
Opens this help file to the Portfolio overview page.
Portfolio Pop-up Menu
To bring up the pop-up menu, right-click in the part of the Portfolio that shows its contents.
Option
Description
Add New Empty
List...
Adds a new empty list to the Portfolio beneath the selected list.
Add New
Annotation...
Adds a new annotation to the active object in the Portfolio. This
function first opens the Portfolio: New Annotation dialog where the
annotation is defined.
Add New List
from Search
Result
Adds a new list containing the results from your free-text search using
the Search pane to the Portfolio. The list is placed as the last item on
root level.
Add New List
from Marked
Records
Adds a new list with the marked records to the Portfolio. The list is
placed as the last item on root level.
Add Marked
Records to List
Adds the marked records from your current visualization into the
Portfolio list.
Note: You can also right-click in the visualization and add your marked
records into your currently active Portfolio list.
345
TIBCO Spotfire DecisionSite 9.1.1 for Lead Discovery - User's Manual
8.2.3.4
Edit...
Lets you edit an annotation or the name of a list. This function brings up
either the Portfolio: Edit Annotation dialog or the Portfolio: Rename
List dialog depending on which object you have selected in the
Portfolio.
Cut
Removes the selected objects from the Portfolio and places them on the
clipboard.
Copy
Places a copy of the selected objects from the Portfolio on the clipboard.
Paste
Pastes the contents of the clipboard below the selected list in the
Portfolio.
Delete
Deletes the selected objects from the Portfolio.
Undo
Undoes the last delete, edit, move, cut, copy, paste or import operation.
Only the very last operation can be undone.
Sort Alphabetic
Lets you sort the contents of your lists alphabetically.
Sort Numeric
Lets you sort the contents of your lists numerically.
Note: This sorting only applies to the leading digits.
Portfolio Toolbar
The Portfolio toolbar includes shortcuts for some of the most common commands in the
Portfolio menu. Click on the buttons on the toolbar to activate the corresponding functions.
This is the Portfolio menu selector. When you click on it, a menu is displayed. Click
here for a description of the available menu options.
Adds a new empty list to the Portfolio below the selected list.
Adds a new list with the marked records to the Portfolio. The list is placed as the
last item on root level.
Adds a new annotation to the selected object in the Portfolio. First, the Portfolio:
New Annotation dialog is opened. This is where the annotation is defined.
Brings up the List Logic dialog where you can compare the marked lists using
Boolean operators (OR, AND or ONLY).
Adds a new column to the data set with information about the location of the
records within the selected list(s) in the Portfolio.
Marks the records that belong to a selected list in the visualizations.
Displays or hides the Search pane, where you can perform a free text search of the
contents of the Portfolio including lists, records and annotations.
346
Tools
8.2.3.5
Portfolio: Options Dialog
Option
Description
Record identifier
Defines which column in the data set should be used as the identifier.
You can choose the identifier from any column that contains strings or
integers.
Mark on browse
Automatically marks records in the visualizations when browsing a list
using the mouse or arrow keys.
Mark on search
Automatically marks records in the visualizations when they are found
in a Search.
Overwrite old
column
Select this check box if you want to overwrite a previously added
column (from the Portfolio tool) when you add a new portfolio role
column. Clear if you do not wish to overwrite.
► To reach the Portfolio: Options dialog:
Select Options... from the Portfolio menu.
8.2.3.6
Portfolio: New Annotation Dialog
Option
Description
Annotation
The contents of your annotation are entered here. Press Enter to force a
line break in the annotation text.
Type
The type of annotation; can be String, Long, Real or URL. The type is
set to String as default.
Name
An alias for the annotation can be entered here. If filled in, the alias is
displayed before the contents of the Annotation field in the Portfolio.
347
TIBCO Spotfire DecisionSite 9.1.1 for Lead Discovery - User's Manual
Advanced >>
Shows the advanced settings.
<< Hide
Hides the advanced settings.
► To reach the Portfolio: New Annotation dialog:
8.2.3.7
•
•
Select New > Annotation... from the Portfolio menu or
select Add New Annotation... from the pop-up menu or
•
click on the Add new annotation button,
Portfolio: New Grouped List Dialog
Option
Description
Group new list by
Displays all available columns that you can choose to base your new
grouped list on. The grouped list will contain an underlying list for each
unique value in this column. Click on a column to select it.
List name
A name for the new list is entered here.
► To reach the Portfolio: New Grouped List dialog:
Select New > Grouped List... from the Portfolio menu.
8.3
8.3.1
List Logic
Comparing Lists Using List Logic
You can compare lists using Boolean operators. This lets you determine which records are
present or not in a certain combination of lists. The result is added as a new list, and you can
select where you want to put it.
Note: The List Logic function only compares records in the list and its sublists. Annotations
and names of sublists are not considered.
► To compare lists:
1.
348
If the List Logic tool is not already open, select Tools > List Logic....
Response: The List Logic dialog is displayed.
Tools
2.
3.
4.
5.
6.
7.
Select the desired List source.
Comment: You can choose a list from Portfolio, Structure Viewer, from the current
Data set, from an External file, or Create a new list.
Click to select the lists you want to compare and click Add >> to move them to the
Lists to compare pane.
Comment: You can only compare separate lists. In other words, you cannot compare
an underlying list with its parent list. When you select a list, all underlying lists are
automatically included in the selection.
Select one of the three methods of logical operation: OR (All lists), AND (Any of the
lists), or ONLY (This list only).
Enter a new List name.
Select where you want to save the result of the list comparison.
Click OK.
Response: In the case of Portfolio and Structure Viewer, the new list is added to the
selected source as the last item on the root level. An annotation with information about
how the list was created is automatically added to the new list. If External file is
selected, a save dialog will appear in which you can specify where you want the file to
be saved.
Tip: You can also click on the List Logic button
start the tool.
8.3.2
in the Portfolio or Structure Viewer to
List Logic Dialog
349
TIBCO Spotfire DecisionSite 9.1.1 for Lead Discovery - User's Manual
Option
Description
List source
Displays the sources from which you can select lists to be added.
Select a source from the List Source pane. Click a list name in the pane
to select it. To select more than one list, press Ctrl and click the list
names in the pane.
Lists to compare
Displays the lists that are to be compared.
Add >>
Adds the lists that have been selected in the List source pane to the Lists
to compare pane.
<< Remove
Removes a list from the Lists to compare pane.
All lists
Creates a new list containing only those records that are present in all of
the lists.
Any of the lists
Creates a new list containing all records that are present in any of the
lists. Each record will appear only once in the new list, even if that
record is present in several of the selected lists.
This list only
Creates a new list containing only those records that are present in the
selected list and not in any of the other lists.
List name
The name of the new list that is created.
Save new list in
Selects the location where the result of the list comparison will be
saved.
► To reach the List Logic dialog:
Select Tools > List Logic...., or click on the List Logic button
Viewer.
8.4
8.4.1
in Portfolio or Structure
Web Links
Web Links Overview
The Web Links tool enables you to send a query to an external web site to search for
information about marked records. The search results are displayed in a separate web browser.
The Web Links tool is shipped with a number of predefined web sites that are ready to use. You
can also set up new links to web sites of your choice.
8.4.2
8.4.2.1
Using Web Links
Sending a Query Using Web Links
Note: You need to have data in Spotfire DecisionSite to be able to send a query. The query is
sent for the marked records in the visualizations. If more than one record is marked, the records
are separated by the web link delimiter in the query.
► To send a query using Web Links:
1.
2.
3.
350
In a visualization, mark those records you want to search for information about.
Select Tools > Web Links....
Response: The Web Links dialog is displayed.
Click to select the link to the web site where you want the query to be sent.
Tools
4.
5.
8.4.2.2
Comment: Some web sites only allow you to search for one item at a time. If you do
not get any hits from a search, mark one record at a time in the visualizations and try
again.
Select the Identifier column that you want to use as input to the query.
Comment: You can choose from any column in your data set.
Click OK.
Response: The query is sent to the web site and the results are displayed in a new web
browser.
Setting Up a New Web Link
► To set up a new web link:
1.
2.
3.
4.
5.
6.
7.
8.4.2.3
Select Tools > Web Links....
Response: The Web Links dialog is displayed.
Click Options....
Response: The Web Links Options dialog is displayed.
Click New.
Response: A New web link is created and selected in the list of Available web links.
Comment: The Preview helps you see what the finished query will look like when it is
sent.
Edit the name of the new link in the Web link name text box.
Edit the URL to the web link.
Comment: A dollar sign within curly brackets {$} should be used as placeholder for
the ID. Anything you enter between the left bracket and the dollar sign will be placed
before each ID in the query. In the same way, anything placed between the dollar sign
and the right bracket will be placed after each ID in the query.
Enter the Delimiter to use to separate the IDs in a query.
Comment: The identifiers in a query with more than one record are put together in one
search string separated by the selected Delimiter. You can use AND, OR or ONLY as
delimiters.
Click OK.
Response: The new web link is saved and is displayed together with the other available
web links in the user interface.
Editing a Web Link
► To edit a web link:
1.
2.
3.
4.
Select Tools > Web Links....
Response: The Web Links dialog is displayed.
Click Options....
Response: The Web Links Options dialog is displayed.
Click on the web link you want to edit in the list of Available web links.
Response: The Web link name, URL and Delimiter for the selected web link are
displayed and can be edited directly in the corresponding fields.
Comment: All changes that are made are reflected in the Preview which helps you see
what the finished query will look like.
Make desired changes to the web link and click OK.
Response: The web link is updated according to your changes and the Web Links
Options dialog is closed.
351
TIBCO Spotfire DecisionSite 9.1.1 for Lead Discovery - User's Manual
8.4.2.4
Removing a Web Link
► To remove a web link:
1.
Select Tools > Web Links....
Response: The Web Links dialog is displayed.
2. Click Options....
Response: The Web Links Options dialog is displayed.
3. Click on the web link you want to remove in the list of Available web links.
Response: The Web link name, URL and Delimiter for the selected web link are
displayed in the corresponding fields.
4. Click Delete.
Response: All the fields are cleared.
Comment: You can delete many web links at a time if you select several web links in
the list of Available web links and click Delete. Press Ctrl and click on the web links
in the list to select more than one.
Tip: If you have deleted some of the default web links by mistake, you may retrieve them again
by clicking the Add defaults button. This adds all of the default links to the Available web
links list, regardless of whether or not the links already exist.
8.4.3
8.4.3.1
352
User Interface
Web Links Dialog
Option
Description
Web links
The available web links. The web links tool is shipped with a number of
default links, but you can edit or add new web links to the list via the
Web Links Options dialog. Click to select the link to which you want to
send a query for the marked records.
Identifier column
This is where you specify which identifier to use when you send a query
for marked records to a web site.
Options...
Opens the Web Links Options dialog.
Tools
► To reach the Web Links dialog:
Select Tools > Web Links....
8.4.3.2
Web Links Options Dialog
Option
Description
Available web
links
The available web links that are listed in the Web Links user interface.
Web link name
The name of the web link. Click on a web link in the list of Available
web links to edit the name in this field.
URL
The URL to the web link. Click on a web link in the list of Available
web links to edit the URL in this field.
A dollar sign within curly brackets is used as a placeholder for the ID in
the query. Anything you enter between the left bracket and the dollar
sign will be placed before each ID in the query. Likewise, anything
placed between the dollar sign and the right bracket will be placed after
each ID in the query. The preview shows you what the query will look
like.
Delimiter
The separator that should be used between the IDs in a query with more
than one record. Click on a web link in the list of Available web links to
edit the delimiter in this field.
Add defaults
Adds the default web links (that Spotfire DecisionSite Statistics is
shipped with) to the list of Available web links. The current links are
not updated, instead copies of the links are added. This allows you to
have two different versions of the default links. For example, one
version could contain your own personal settings.
353
TIBCO Spotfire DecisionSite 9.1.1 for Lead Discovery - User's Manual
New
Adds a New web link to the list of available web links and lets you edit
its name, URL and Delimiter in the fields to the right.
Delete
Deletes the selected web link(s) in the list of Available web links.
Preview
Shows you a preview of the URL with three IDs (Apple, Orange and
Pear) instead of the placeholder {$} (dollar sign within curly brackets).
► To reach the Web Links Options dialog:
Select Tools > Web Links... to display the Web Links dialog. Then click on the Options...
button to the lower left in the Web Links dialog.
8.5
8.5.1
8.5.1.1
Compound Details
IDdb3 Drug Search
Searching the IDdb3 Database
The IDdb3 Drug Search tool allows you to search the Investigational Drugs database (IDdb3)
using the active record in Spotfire DecisionSite or an entered drug name as search criterion.
Note: A subscription to IDdb3 is required in order to use this tool.
► To search IDdb3:
1.
2.
3.
4.
5.
6.
354
Activate a record by clicking on it in a visualization.
Select Tools > Compound Details > IDdb3 Drug Search....
Response: The IDdb3 Drug Search dialog is displayed.
Select the column on which to perform your search from the drop-down list.
Comment: You can also choose to perform a Search by drug name by typing any word
or name in the text box.
Click OK.
Response: The IDdb3 Drug Search dialog is closed and your request is sent to IDdb3.
If the IDdb3 web site does not recognize you from earlier, you will have to enter your
User name and Password in a Log In dialog.
Comment: Select the check box Remember the password to skip this dialog in the
future.
The search results are displayed in a separate web window.
Tools
8.5.1.2
IDdb3 Drug Search Dialog
Option
Description
Select Column
The columns available for searching are listed. Select the column in
which the value to search by is found (e.g., the molecule name) from the
drop-down list.
Search by drug
name
Type any search string to search the IDdb3 for drugs of that name. No
wildcards are allowed, and the search is performed as a perfect match to
the entered string.
► To reach the IDdb3 Drug Search dialog:
Select Tools > Compound Details > IDdb3 Drug Search....
8.6
8.6.1
Computation Services
Computation Services Overview
The Computation Services is built to allow you to add any specific type of computation or
"tool" to your analysis. Different types of statistical calculations can be added to the data set or
included in Guides for easy distribution to others.
The out-of-the-box version of Computation Services supports connection to R, S-PLUS and
SAS servers, but other types of connectors can also be added. For more information, see
Spotfire Developer Network.
Note: This help file does not contain any information regarding how to write your scripts. For
specific information on how to write scripts, see literature for the respective scripting language.
8.6.2
8.6.2.1
Using Computation Services
Computation Services Quick Reference
Action
Instruction
Start Computation Services
From the main menu bar of DecisionSite, select Tools >
Computation Services > SAS or R or S-PLUS or whatever
type of server you want to connect to.
355
TIBCO Spotfire DecisionSite 9.1.1 for Lead Discovery - User's Manual
Create a new configuration
In Computation Services, click File > New.
Write or paste a script in the Script field, add input and output
parameters and result handlers.
Test the configuration.
See Suggested Workflow or Example Configuration for more
information.
Open an earlier saved
configuration
In Computation Services, click File > Open....
Browse to locate the configuration of interest and click Open.
Add an input parameter
Select the parameter in the script and click on the Add as
Input Parameter button,
.
Select the Data type of the parameter from the drop-down
list.
Tip: You can also start by clicking Add on the Input
Parameters tab, edit the default parameter name and then
write the script that includes the parameter.
Add prompts
Add at least one input parameter.
Select the Data type of the parameter from the drop-down
list.
In the Input Parameters tab, select Prompt: [prompt type]
from the Value drop-down list.
Configure the prompt in the Prompt Settings dialog by
adding a label and other information.
Add an output parameter
Select the parameter in the script and click on the Add as
Output Parameter button,
.
Select the Data type of the parameter from the drop-down
list.
Tip: You can also start by clicking Add on the Output
Parameters tab, edit the default parameter name and then
write the script that includes the parameter.
Define what to do with the
results
Make sure that you have defined the output parameter that
you want to use as result.
On the Result Handling tab, click Add.
From the menu, select the type of result handler that you want
to use.
If applicable, configure the selected result handler to work on
the desired output parameter.
Add resulting columns to the Make sure that you have defined at least one output
parameter as the data type Dataset.
data set
On the Result Handling tab, click Add.
From the menu, select one of the following alternatives: Add
to Current Data Set (Automatic Key Matching), Add to
Current Data Set (Row by Row), Replace Current Data Set,
or Open in Other DecisionSite Instance.
Note: The result handlers for adding columns will only be
visible in the Add menu if you have defined at least one
output parameter of the type Dataset.
356
Tools
8.6.2.2
Add resulting output as a
file
Make sure that you have defined at least one output
parameter as the data type File.
On the Result Handling tab, click Add.
From the menu, select the Launch File option.
Note: The Launch File result handler will only be visible in
the Add menu if you have defined at least one output
parameter of the type File.
Test a configuration
In Computation Services, select Execute > Run.
Save a configuration
In Computation Services, select File > Save.
Incorporate a configuration
in a Guide
Test your configuration to make sure it is fully functional.
In Computation Services, select File > Send to Analysis
Builder.
In Analysis Builder, select the action Start Data
computation - SAS (or R, S-PLUS, etc.).
Click < Add Link.
Complete the Guide in Analysis Builder and Save it.
Tip: For more information about how to create Guides, see
Analysis Builder Overview.
Minimize Computation
Services
Click on the top right x-button. This will hide Computation
Services, but the current configuration will be remembered
when you reopen the tool.
Close Computation Services
In Computation Services, select File> Exit.
Suggested Workflow
► To create a new script configuration using Computation
Services:
1.
If Computation Services is not already open, select Tools > Computation Services >
SAS or R or S-PLUS, or whatever the type of computation server you are running
against.
2. Select File > Connector Settings... and specify the address to your Server.
3. Select whether to Keep session open until manually closed or not. See Connector
Settings dialog for more information about this option.
4. Create the script by either typing or pasting existing script code in the Script field of
Computation Services.
5. Add the desired input parameters to the Input Parameters tab and specify whether
they should be prompted or not.
6. Add the desired output parameters to the Output Parameters tab.
7. Specify how you want to present your results on the Result Handling tab.
8. Test the configuration by selecting Execute > Run.
9. View the Execution Log to see if there were any errors during execution.
10. If there were any problems, go back to fix them.
11. Select File > Send to Analysis Builder and add the Start Data computation - R
action (or whatever the type of computation you have created) to a suitable Guide.
357
TIBCO Spotfire DecisionSite 9.1.1 for Lead Discovery - User's Manual
8.6.2.3
Example Configuration
Below is the creation of a very simple configuration shown in detail to exemplify how you can
work with Computation Services. The workflow would be exactly the same for S-PLUS and
SAS servers.
Note: For information on how to write scripts, please refer to any literature for the respective
scripting language.
► Creating an R configuration which adds a user specified integer
to selected columns in the data set:
1.
2.
3.
4.
In DecisionSite, open the data set in which you want to modify columns.
Comment: It is not necessary to have data loaded in DecisionSite when defining or
running a configuration, but in this example the data is used for testing purposes
further down in this step instruction.
Select Tools > Computation Services > R.
Response: Spotfire Computation Services for R is displayed.
In Computation Services, select File > Connector Settings....
Response: The Connector Settings dialog is displayed.
Specify the address to your R Server by either typing in the text field (e.g.,
http://myRserver:9080) or selecting a predefined server from the list shown by clicking
7.
on
.
On the Input Parameters tab, type a suitable Prompt dialog title in the specified field.
In this example we use the text "Add Integer to Columns".
Comment: According to Spotfire UI Guidelines the title should be short and concise
and written using book title capitalization, without any closing punctuation.
On the Input Parameters tab, type a suitable Prompt dialog description in the
specified field. In this example we use the text "This is an example R-script calculation
which adds the integer provided below to all specified columns in the data set.".
Comment: The description is not necessary in all configurations, but it can be useful to
further explain what the configuration does, or to add more guidance to the end users
during execution.
In the Script field, type dataout <- x + datain.
8.
Comment: This is the actual script which will be computed on the R server. In this
example we want a user-specified integer, x, to be added to the values of the input
columns in the datain parameter, and finally the resulting columns in the dataout
parameter to be returned to the current data set as new columns.
Select the input parameter x in the script:
5.
6.
.
Click on the Add as Input Parameter button,
Response: The parameter x is added to the Input Parameters tab.
10. On the Input Parameters tab, from the Data type drop-down list, select Integer.
11. From the Value drop-down list, select Prompt: Integer.
9.
358
Tools
Response: The Prompt Settings: Integer dialog is displayed.
12. In the dialog, specify the Label that you want the end user of the configuration to see
upon execution. In this example we use the text "Integer to add to the selected
columns:".
Comment: Try to make the label as clear as possible to ensure that the end users of the
script understand what the input parameter should be. According to Spotfire UI
Guidelines, the label for a text field should use sentence-style capitalization and end
with a colon.
13. If desired, add a default value and/or min and max values to limit the allowed input
values.
14. Click OK.
15. In the Script field, select the input parameter datain and click on the Add as Input
.
Parameter button,
16. On the Input Parameters tab, from the Data type drop-down list, select Dataset.
17. From the Value drop-down list, select Prompt: Data set.
18. Response: The Prompt Settings: Data Set dialog is displayed.
19. In the dialog, specify the Label that you want the end user of the configuration to see
upon execution. In this example we use the text "Select a number of columns (max
7):".
359
TIBCO Spotfire DecisionSite 9.1.1 for Lead Discovery - User's Manual
20. Select the Data types of the columns that will be available for selection. In this
example we will add an integer to the values of the specified columns, so Integer and
Real are suitable data types.
21. If desired, add a Minimum number of columns (in this example we use 1) and a
Maximum number of columns (in this example we use 7).
22. Click OK.
23. In the Script field, select the output parameter dataout and click on the Add as Output
.
Parameter button,
24. On the Output Parameters tab, from the Data type drop-down list, select Dataset.
25. On the Result Handling tab click on Add.
26. From the Add menu select Add to current data set (row by row).
Response: The Add to Current Data Set (Row by Row) dialog is displayed.
Comment: This is just one of many result handlers available. See Result Handling tab
for more information about the other options.
27. In the dialog, make sure that dataout is selected as Output parameter and datain is
selected as Input parameter for matching of rows.
28. If desired, modify the Column name template to add a custom prefix and/or suffix to
the calculated columns.
29. Test the script by selecting Execute > Run.
360
Tools
Response: The prompt dialog is displayed with the title you provided in step 3.
Comment: What columns you see in the Available columns list depends on which data
set you have opened and which data types you specified in step 18. You can also rightclick on the Name header and select the Show search field option, if you want to
further limit the number of shown columns in this list.
30. In the dialog, type the desired integer and select the desired columns.
31. Click OK.
Response: The computation is performed and the resulting columns are added to the
data set.
32. Save the configuration or send it to Analysis Builder (File > Send to Analysis
Builder) to incorporate the action Start Data computation - R in a Guide. In the
latter case you should also remember to save the Guide.
8.6.2.4
General Concepts
The handling of forbidden characters in column names differs for different computation servers.
To avoid possible problems with forbidden characters in column names, Computation Services
temporarily translates the column names that are sent to a server in the following manner:
• Allowed characters are a-z, A-Z, 0-9. Any other characters will be temporarily
removed from the column names when the configuration is executed on the server.
• The column name cannot start with a number. If the available column name starts with
a number, the number will be removed.
• The column name may be a maximum of 32 characters long. If the available column
names are longer, they will be shortened and, if necessary, supplied with a suffix
number to be distinguished from other columns with the same name.
• All column names will be converted to lower case, since some computation servers do
not make any difference between upper and lower case characters.
The translation is initiated by each connector separately. Any columns that are sent to a server
as input parameters will be translated, provided they contain any of the forbidden characters.
When the columns are returned from the server as output parameters, they will receive their
original names again, if applicable. The translated column names will be used during the whole
computation server session.
Tip: If you are interested in seeing what the actual column name used in the computation
looked like, you can retrieve this information from the Execution Log.
361
TIBCO Spotfire DecisionSite 9.1.1 for Lead Discovery - User's Manual
8.6.3
8.6.3.1
User Interface
Computation Services User Interface Overview
This is the Computation Services user interface:
1. Computation Services menus
The File, Execute and Help menus contain menu commands used to work with Computation
Services.
2. Toolbar
Includes shortcuts for some of the most common commands in Computation Services. See
Computation Services toolbar for a description of the different buttons.
3. Script
This pane displays the contents of your current script. This is where you create a new script or
modify an existing script. Depending on what type of computation server you have selected, the
scripting language should be R, SAS, S-PLUS or some other type of script. This help file does
not contain any information regarding how to write your scripts.
4. Input Parameters
The Input Parameters tab contains the selected input parameters and handles any type of prompt
settings for these parameters.
362
Tools
The prompt settings determine what the end user of the configuration will see upon execution.
All defined prompts will be shown in a single prompt dialog. The title of the prompt dialog is
defined on the Input Parameters tab, along with a field with room for a more thorough
description of what the configuration does.
5. Output Parameters
The Output Parameters tab contains the selected output parameters.
6. Result Handling
The Result Handling tab is where you specify what kind of result you want to receive when
running the configuration.
7. Execution Log
The Execution Log tab contains a read-only text field displaying the progress of execution of a
configuration along with any errors.
► To reach Computation Services:
Select Tools > Computation Services > R or SAS or S-PLUS or whatever the type of your
current computation server.
8.6.3.2
Computation Services Menus
File menu:
Option
Description
New
Empties Computation Services, so that you can start a new configuration.
Any information you have currently open in the Script pane, or in any of
the tabs, will be cleared.
Open...
Opens an earlier saved configuration. This configuration contains the
actual script along with any defined input and output parameters, as well
as the specified result handlers and prompt settings.
Save
Saves the current configuration including the script, all input and output
parameters, as well as the specified result handlers and prompt settings to
an earlier specified file.
Save As...
Saves the current configuration including the script, all input and output
parameters, as well as the specified result handlers and prompt settings,
after you have provided a file name in the Save dialog.
Send to Analysis
Builder
Sends the current configuration to Analysis Builder as an available action,
so that the calculation can be incorporated in a Guide.
Connector
Settings...
Displays the Connector Settings dialog, which handles the connection to
the computation server.
Close All
Sessions
Closes all sessions currently open on the computation server. This option
may be necessary to use if you have selected the option to Keep session
open until manually closed in the Connector Settings dialog and you
encounter any problems due to data left on the server from earlier
computations.
Exit
Closes Computation Services.
363
TIBCO Spotfire DecisionSite 9.1.1 for Lead Discovery - User's Manual
Execute menu:
Option
Description
Run
Runs the current configuration.
Log Level >
Defines the level of details to be shown in the Execution Log tab when a
configuration is run. The log level is saved in the registry per user and
connector.
> Inform
Use this log level if you just want to view warnings and errors.
> Debug
Use this log level if you want to display all log information available.
Help menu:
8.6.3.3
Option
Description
Computation
Services Help
Launches the online help system.
Computation Services Toolbar
The Computation Services toolbar includes shortcuts for some of the most common commands
in the menus. Click on the buttons on the toolbar to activate the corresponding functions.
Empties Computation Services, so that you can start a new configuration. Any
information you have currently open in the Script pane, or in any of the tabs, will be
cleared.
Opens a configuration earlier saved using Computation Services. This configuration
contains the actual script along with any defined input and output parameters, as well
as the specified result handlers and prompt settings.
Saves the current configuration including the script, all input and output parameters, as
well as the specified result handlers and prompt settings to an earlier specified file.
Sends the current configuration to Analysis Builder as an available action, so that the
calculation can be incorporated in a Guide.
Adds the selected text in the script text area as an input parameter. Same functionality
as the Add button on the Input Parameters tab.
Adds the selected text in the script text area as an output parameter. Same functionality
as Add button on the Output Parameters tab.
Runs the current script configuration.
Displays the Connector Settings dialog, which handles the connection to the
computation server.
364
Tools
8.6.3.4
Input Parameters Tab
Option
Description
Prompt dialog title The text in this field is displayed as the title of the prompt dialog when
the configuration is executed. Maximum length is 80 characters.
Prompt dialog
description
The text entered here is also displayed in the prompt dialog. Typically,
this would be a description of what the configuration does or a more
thorough description of the parameters that the end user of the tool
should provide. Maximum length is 1000 characters.
Parameter name
A string matching a parameter in the script. If you have selected a
parameter in the Script field and then clicked on the Add as input
parameter button,
, the parameter name is already set to the selected
text. If no parameter was selected before you clicked Add, a default
parameter is added and you can edit the parameter name in the text box.
Note: Make sure you type a correct parameter name. The allowed
parameter names differ for the various scripting languages.
Data type
Select the data type of the parameter from the drop-down list. Not all
data types described in this help file is available for all types of
connectors.
Value
A drop-down list with the possibility to select either a constant or one of
the prompt types available for the selected data type.
Opens a dialog with the possibility to enter a constant when the constant
value is selected, and a prompt setting when a prompt value is selected.
Add
Adds the text selected in the Script field as an input parameter. Same
functionality as the Add as Input Parameter button on the toolbar.
Remove
Removes the selected input parameter.
Move Up
Moves the selected input parameter up one step. The position defines
the order in the prompt dialog.
Move Down
Moves the selected input parameter down one step. The position defines
the order in the prompt dialog.
365
TIBCO Spotfire DecisionSite 9.1.1 for Lead Discovery - User's Manual
8.6.3.5
Output Parameters Tab
Option
Description
Parameter name
A string matching a parameter in the script. If you have selected a
parameter in the Script field and then clicked on the Add as Output
Parameter button,
, the parameter name is already set to the selected
text. If no parameter was selected before you clicked Add, a default
parameter is added and you can edit the parameter name in the text box.
Note: Make sure you type a correct parameter name. The allowed
parameter names differ for the various scripting languages.
8.6.3.6
366
Data type
Select the data type of the parameter from the drop-down list.
Add
Adds the text selected in the Script field as an output parameter. Same
functionality as the Add as Output Parameter button on the toolbar.
Remove
Removes the selected output parameter.
Result Handling Tab
Option
Description
Result Handler
Displays all result handlers currently in use.
Add
Displays a list of the available result handlers. What result handlers are
available depends on the data types of your current output parameters.
The current version of Computation Services allows you to present your
Tools
results in the following manners:
View in Result Dialog
Add to Current Data Set (Automatic Key Matching)
Add to Current Data Set (Row by Row)
Replace Current Data Set
Open in Other DecisionSite Instance
Launch File
Remove
Removes the selected result handler.
Settings...
Displays the settings for the selected result handler.
If you remove an output parameter that has been used to define a result handler, the result
handler will turn red in the list. Either delete the incorrect result handler, or open the Settings...
for the result handler and change it to work on another output parameter. You can also add the
missing parameter again to fix the problems.
8.6.3.7
Execution Log Tab
The Execution Log shows detailed information about a configuration when it is run. The level
of details is set under the menu option Execute > Log Level. If desired, the resulting log can be
copied using the right-click menu and saved for future reference.
8.6.3.8
8.6.3.8.1
Prompt Dialogs
Prompt Settings: Boolean Dialog
Use this type of prompt for user input of the type yes/no. The resulting prompt will be a check
box which can be empty or selected.
367
TIBCO Spotfire DecisionSite 9.1.1 for Lead Discovery - User's Manual
According to Spotfire UI Guidelines the label for a check box should use sentence-style
capitalization and end without a full stop.
Resulting prompt for the example above:
8.6.3.8.2
Prompt Settings: Column Name Dialog
Use this type of prompt when you want user input in the form of a column name string.
Option
Description
Label
The text that will be displayed above the column name selection in the
prompt dialog when the configuration is executed. Try to make the label
as clear as possible to ensure that the end users understand what the
input parameter should be. According to Spotfire UI Guidelines the
label for a drop-down list should use sentence-style capitalization and
end with a colon.
Data types
Select the data types of the columns you want the end user to see upon
prompting for the specific parameter.
Regexp matching
Type any kind of regular expression to limit the available columns in
the prompt.
Example: If you type Exp in the Regexp matching field, only columns
containing 'Exp' somewhere in the column name will be visible, e.g.,
Experiment1, Experimental results, Expression, MyExperiments, etc.
See Introduction to Regular Expressions in the Query Devices chapter
for more information.
Resulting prompt for the example above:
368
Tools
8.6.3.8.3
Prompt Settings: Data Set Dialog
Use this type of prompt when you want user input in the form of one or more columns from the
current data set.
Option
Description
Label
The text that will be displayed above the column selection in the prompt
dialog when the configuration is executed. Try to make the label as
clear as possible to ensure that the end users of the script understand
what the input parameter should be.
Data types
Select the data types of the columns you want the end user to see upon
prompting for the specific parameter.
Minimum number The minimum number of columns that you want to use as input for the
selected parameter.
of columns
Maximum number The maximum number of columns that you want to use as input for the
selected parameter.
of columns
Resulting prompt for the example above:
The end user of the configuration will be presented with a column selector with all columns of
the specified data type in the Available columns field. The end user will also have the
369
TIBCO Spotfire DecisionSite 9.1.1 for Lead Discovery - User's Manual
possibility to choose whether to work on All records, Marked records or Selected records by
choosing the appropriate option from the Records selection drop-down list.
Tip: If there are too many columns to choose from in the Available columns list, it is possible
to right-click on the Name header and select Show search field from the pop-up menu. Then,
any search string can be used to limit the number of available columns.
8.6.3.8.4
Prompt Settings: File Dialog
Use this type of prompt when you want user input in the form of a file.
Note: If the resulting file is to be processed via one of the predefined Open, Edit or Print
options in the Launch File Dialog, the output parameter name used must end with the desired
file extension (example: outfile.txt). See Launch File Dialog for more information.
According to Spotfire UI Guidelines, the label for a text field should use sentence-style
capitalization and end with a colon.
Resulting prompt for the example above:
8.6.3.8.5
Prompt Settings: Integer Dialog
Use this type of prompt when you want user input in the form of an integer.
370
Option
Description
Label
The text that will be displayed above the input field in the prompt dialog
when the configuration is executed. Try to make the label as clear as
possible to ensure that the end users of the configuration understand
what the input parameter should be. According to Spotfire UI
Guidelines, the label for a text field should use sentence-style
capitalization and end with a colon.
Default value
If desired, type a value for default display in the prompt dialog.
Tools
Min value
If desired, type the lowest acceptable value that can be used as input. If
an end user tries to provide a lower value, an error message will be
displayed upon execution.
Max value
If desired, type the highest acceptable value that can be used as input. If
an end user tries to provide a lower value, an error message will be
displayed upon execution.
Resulting prompt for the example above:
8.6.3.8.6
Prompt Settings: List Dialog
Use this type of prompt when you want user input in the form of a string selected from a
predefined list.
Option
Description
Label
The text that will be displayed above the list selection in the prompt
dialog when the configuration is executed. Try to make the label as
clear as possible to ensure that the end users of the configuration
understand what the input parameter should be. According to Spotfire
UI Guidelines the label for a drop-down list should use sentence-style
capitalization and end with a colon.
Selectable option
The list item text as you want it to be displayed for the end users. Each
selectable option should be connected to a value to be used in the actual
calculations.
Value
The list item value used in the calculations, which is what lies behind
371
TIBCO Spotfire DecisionSite 9.1.1 for Lead Discovery - User's Manual
the selectable options shown in the drop-down list.
Add
Adds the current pair of selectable option/value to the list.
Remove
Removes the selected option from the list.
Move Up
Moves the selected option up in the list.
Move Down
Moves the selected option down in the list.
Set as Default
Sets the selected option as the default value shown to the end user upon
execution.
Resulting prompt for the example above:
8.6.3.8.7
Prompt Settings: Real Dialog
Use this type of prompt when you want user input in the form of a decimal number.
Option
Description
Label
The text that will be displayed above the input field in the prompt dialog
when the configuration is executed. Try to make the label as clear as
possible to ensure that the end users of the configuration understand
what the input parameter should be. According to Spotfire UI
Guidelines, the label for a text field should use sentence-style
capitalization and end with a colon.
Default value
If desired, type a value for default display in the prompt dialog.
Min value
If desired, type the lowest acceptable value that can be used as input. If
an end user tries to provide a lower value, an error message will be
displayed upon execution.
Max value
If desired, type the highest acceptable value that can be used as input. If
an end user tries to provide a lower value, an error message will be
displayed upon execution.
Resulting prompt for the example above:
372
Tools
8.6.3.8.8
Prompt Settings: String Dialog
Use this type of prompt when you want user input in the form of a string.
Option
Description
Label
The text that will be displayed above the text field in the prompt dialog
when the configuration is executed. Try to make the label as clear as
possible to ensure that the end users of the configuration understand
what the input parameter should be. According to Spotfire UI
Guidelines, the label for a text field should use sentence-style
capitalization and end with a colon.
Default value
If desired, type a text for default display in the prompt dialog.
Maximum string
length (1-999)
If desired, type the maximum length of the string to be used as input. If
an end user tries to provide a longer string, an error message will be
displayed upon execution.
Resulting prompt for the example above:
8.6.3.9
8.6.3.9.1
Result Handling Dialogs
Add to Current Data Set (Automatic Key Matching)
Use this result handler when you want the resulting columns to be added to your current data
set using an automatic primary key matching.
Note: This method requires that you actually have good primary keys available, that is, that
there is a column on the server with exactly the same name as one in your DecisionSite data set,
and that some of the values are matching. If not, you should probably use the Add to Current
Data Set (Row by Row) result handler instead.
373
TIBCO Spotfire DecisionSite 9.1.1 for Lead Discovery - User's Manual
Select the output parameter that you want to add to your DecisionSite data set from the dropdown list. Only output parameters defined as the data type Dataset are available in the list.
How it works:
For all column names that are identical in DecisionSite and on the server, the contents of the
columns will be compared. If the values are identical, new values are added to the rows where
there was a match. If the same value occurs in more than one place in the key column, the first
value will be used.
Tip: If your key columns have names that do not match, it is easy to change the names in
DecisionSite.
8.6.3.9.2
Add to Current Data Set (Row by Row)
Use this result handler when you want the resulting columns to be added to your current data
set using a row by row matching. This will make sure that the results are added to the correct
rows, even if the calculation has been performed using marked or selected records only.
Option
Description
Output parameter Select the output parameter that you want to add to your DecisionSite
data set from the drop-down list. Only output parameters defined as the
data type Dataset are available in the list.
374
Input parameter
for matching of
rows
Select the input parameter whose settings will be used in the matching
of rows to the existing data set.
Example: If several input parameters are available, but the x prompt
uses marked records only, it might be suitable to use the x input
parameter for matching of rows and, hence, not add anything to those
rows where the x input parameter was empty upon calculation.
Column name
Used for adding prefix and/or suffix to all calculated columns. Type
Tools
template
[prefix]*[suffix] in the text field, where * is the original input column
names.
Example: If 'Calculated * Result' is typed in the Column name template
field, and columns with the names 'Height' and 'Weight' are used in the
calculation, the resulting names added to DecisionSite will be
'Calculated Height Result' and 'Calculated Weight Result'.
Overwrite existing Select the check box if you want any columns with the same names as
specified in the Column name templates field to be overwritten upon
columns
execution.
8.6.3.9.3
Replace Current Data Set
Use this result handler when you want the result of the calculation to be a new data set in your
current DecisionSite Client instance. Any previous data set in DecisionSite will be closed when
the new data set is opened.
Select the desired output parameter from the drop-down list.
8.6.3.9.4
Open in Other DecisionSite Instance
Use this result handler when you want the result of the calculation to be a new data set in either
a new DecisionSite instance or another, currently running DecisionSite instance. Any previous
data set in the selected DecisionSite instance will be closed when the new data set is opened.
Option
Description
Output parameter Select the output parameter that you want to send as a new data set to
another DecisionSite instance from the drop-down list. Only output
parameters defined as the data type Dataset are available in the dropdown list.
Open in: new
DecisionSite
instance
Use this option to open the resulting data set in a new DecisionSite
instance.
375
TIBCO Spotfire DecisionSite 9.1.1 for Lead Discovery - User's Manual
Open in: new or
existing
DecisionSite
instance
8.6.3.9.5
Use this option to allow the end user of the configuration to select
whether to open the resulting data set in a new or in an existing
DecisionSite instance. If this option is selected, the Open Resulting
Data Set in DecisionSite dialog will be displayed upon execution.
Launch File
Use this result handler when you want the result of the calculation to be launched as a file in
another program.
Note: If the resulting file is to be processed via one of the predefined Open, Edit or Print
options in the Launch File Dialog, the output parameter name used must end with the desired
file extension (example: outfile.txt). The extension used should also be defined on the end user's
computer, see Tip below.
376
Option
Description
Output
parameter
Select the output parameter that you want to launch as a file in another
program from the drop-down list. Only output parameters defined as the
File data type are available in the list.
Execute method:
Open
Use this method to open the resulting file in its standard application.
Example: An XLS file will be normally opened by Microsoft Excel.
Note: To use this option, the selected output parameter name must
include a file extension connected to a known program.
Execute method:
Edit
Use this method to open the resulting file for editing in its standard
application. Example: An XLS file will be normally opened by Microsoft
Excel.
Note: To use this option, the selected output parameter name must
include a file extension connected to a known program.
Execute method:
Print
Use this method to print the resulting file from its standard application.
Note: To use this option, the selected output parameter name must
include a file extension connected to a known program.
Execute method:
Command line
Use this method if you want to specify which program to send the file to
or to run other custom commands. The following syntax can be used for
Tools
the command line: "%path%\%program name%" %1.
Example: "%PROGRAMFILES%\Windows
NT\Accessories\wordpad.exe" %1.
Tip: You can specify what program will be associated with a certain type of action for a
specific file type on your computer. See the online help for your operating system for more
information. (In Windows XP this is made in Windows Explorer, Tools > Folder Options. On
the File Types tab, select the file of interest and click Advanced. Add the selected actions
(Open, Edit, Print, etc.) to the list.)
8.6.3.10
8.6.3.10.1
Other Dialogs
Connector Settings Dialog
This dialog may look different depending on the type of computation server you are connecting
to. It is used to define what server to use and possibly also which other settings to use upon
script execution.
Note: No connection is made until you actually run the script. If you want to test the connection
when you set up the configuration, use the Test button (see below).
Option
Description
Server
Enter the address to the calculation server that you want to use.
Type "(local)" in this field if you want to run against a local SAS Base
client on your own computer.
Opens the Servers dialog where you can select from a list of predefined
calculation servers.
Username
Type the user name required to work against the calculation server. In
some cases this field may be missing.
Password
Type the password required to work against the calculation server. In
some cases this field may be missing.
Request timeout
(minutes)
If your computation takes a long time, you can increase the Request
timeout to prevent that the execution is interrupted before the
377
TIBCO Spotfire DecisionSite 9.1.1 for Lead Discovery - User's Manual
calculation is finished.
Prompt user for
login when
executing the
script
This option is available in the design phase of a configuration only.
Select this check box if you want the end users of the configuration to
log into the server upon execution. If this option is cleared, the
configuration will always use the connector settings provided during the
design phase.
Keep session open
until manually
closed
This option is available in the design phase of a configuration only.
Select this check box to use a single session on the server for all
Computation Services calculations run during a DecisionSite session.
This means that the data is built up and changed on the server as the
various configurations are run.
Note: When you use this option the different steps of a Guide with
many calculations will not be independent of one another. This may
increase the risk of errors upon execution if links in a Guide are clicked
in the wrong order or if requests times out.
Force singlequotation for
string parameters
Use this option to be able to run SAS configurations created with
DecisionSite 8.1.1. This option should normally be cleared.
Test
Validates the connection without closing the dialog.
► To reach the Connector Settings dialog:
1.
2.
8.6.3.10.2
If Computation Services is not already started, select Tools > Computation Services
> SAS, R or S-PLUS or whatever the name of the computation server you want to
connect to.
Select File > Connector Settings....
Servers Dialog
This dialog lists all servers currently defined as calculation servers for a specific connector.
Click on the server that you want to use upon configuration execution, then click OK.
8.6.3.10.3
Constant Definition Dialog
The constant definition dialog's appearance varies depending on what data type you are
defining a constant for. Just enter the value that you want to use in the calculation and click OK.
Example dialogs:
378
Tools
8.6.3.10.4
DecisionSite Data Set Definition Dialog
This dialog defines what data to use in the calculation when the Input: Data set option has been
chosen for an input parameter.
Click the appropriate radio button to select whether the calculation shall be performed on all
records, marked records or on records selected using the query devices or zooming only.
8.6.3.10.5
Computation Services Result Dialog
This is a dialog containing the results from a Computation Services calculation. It displays the
input parameters and the output parameters of the executed configuration. You can copy
selected results by using the pop-up menu in the dialog.
379
TIBCO Spotfire DecisionSite 9.1.1 for Lead Discovery - User's Manual
8.6.3.10.6
Open Resulting Data Set in DecisionSite Dialog
This dialog is presented when the creator of a Computation Services configuration has chosen
to open the result of a calculation in a DecisionSite instance other than the one running the
configuration.
380
Option
Description
Launch new
DecisionSite
instance
Select this option to launch a completely new DecisionSite instance
with the result of the calculation as a new data set.
Open in existing
DecisionSite
instance
Select this option to choose from a list of existing DecisionSite
instances. The data set currently open in the instance of your choice will
be replaced by the new data set.
Tools
8.7
Distance Calculator
You can calculate the distance between two markers in a 2D or 3D scatter plot by using the
Distance Calculator.
Click on the marker you want to use as the origin. Then move the mouse pointer over other
markers and the distance to the origin will be displayed in the Distance Calculator window.
The Distance Calculator also displays the distance from one marker to another along the
different axes.
More specifically the distances calculated are:
Note: The Distance Calculator only handles Real, Float and Integer types. If a column contains
other types, no values will be displayed in the Distance Calculator window.
► To reach the Distance Calculator:
Select Tools > Distance Calculator.
8.8
8.8.1
Administration Tools
Administration Tools Overview
The Administration section contains the tools needed to organize the DecisionSite environment.
These tools are only available for users with Administrator privileges. The Library provides
publishing of all analysis material for sharing with colleagues. Using the Library, you can
collaborate with colleagues in a distributed environment and organize your analysis material.
See the Library Help for more information.
DecisionSite
Administrator
The DecisionSite Administrator can be reached by selecting Tools >
Administration > DecisionSite Administrator. This will open a
Microsoft® Internet Explorer window where Administrators can
manage user privileges. Refer to the DecisionSite Administrator Help
for more information.
DecisionSite
Library
The Library can be accessed for various purposes. By selecting Tools >
Administration > DecisionSite Library, the main view of the Library
is opened. This will open a Microsoft® Internet Explorer window with
the Library. Use this view to open Library items and to administrate it.
Refer to the Library Help for more information.
DecisionSite
Library
Administrator
The DecisionSite Library Administrator can be reached by selecting
Tools > Administration > DecisionSite Library Administrator. This
will open a Microsoft® Internet Explorer window where
Administrators can edit who is allowed to create new Library Sections,
configure DecisionSite Library and Poster settings. See DecisionSite
Analytic Server - Installation and Upgrade manual for more
information.
Server Usage
Server usage statistics can be reached by selecting Tools >
Administration > Server Usage. This will open the log file
381
TIBCO Spotfire DecisionSite 9.1.1 for Lead Discovery - User's Manual
dssaccess.sfs in DecisionSite, for an easy analysis and overview. This
file contains information about all logins and logouts from all
DecisionSite Clients to the DecisionSite Analytics Server.
It shows which user logged in/out and when. The log is always
enabled, and it is unaffected by Log Configuration File settings.
382
Guides
9
9.1
Guides
What is the Guides Pane?
The Guides pane is a web browser, fully integrated into the Spotfire DecisionSite environment.
It is used to connect to the Spotfire DecisionSite Analytics Server, providing access to Guides
as well as a location for a customized start page.
The Guides Pane is closed by default when you launch Spotfire DecisionSite. You can close
and open it by clicking the Guides Pane button to the far left of the Guides Toolbar. The button
on the right directs the page to the current start page.
The Guides Toolbar
The Guides Toolbar is used to open the Guides pane or to launch your own custom start page.
This start page is configurable by right-clicking in the Guides Pane.
The toolbar can be made visible or hidden by selecting View > Guides Toolbar.
Guides
The Guides pane is primarily used to run Guides. It contains preconfigured Guides which can
be run with a single click, but it can also show any custom made Guides for yourself or for
others. See Guides below for more information.
9.2
Guides
A Guide is a convenient way to guide colleagues through a series of analysis steps in the
DecisionSite environment. Using a Guide, information on how to perform frequent tasks, stepby-step instructions, and quick access to tools is assembled in a user friendly way. The Guides
are easily designed in Analysis Builder.
Guides are shown in the Guides pane. In the Guides pane you will find the link Open Guide
from Library... and the preconfigured Guides in your DecisionSite application.
The easiest way to run a Guide is to click the link of the Guide in the Guides pane. If the Guide
you are interested in is not there, you can either run it from the Library or from a file:
• To run a Guide from the Library, either click on Open Guide from Library... in the
Guides pane or select Guides > Run from Library... from the menu.
• To run a Guide from a file, select Guides > Run from File... from the menu.
383
TIBCO Spotfire DecisionSite 9.1.1 for Lead Discovery - User's Manual
When you have started the Guide, follow the instructions in the Guides pane. You can
go back in a Guide to a previous step by clicking on them in the flight view of the
Guide.
Example of a Guide as seen when run in the Guides pane.
Creating Guides
TIBCO Spotfire provides an application called Analysis Builder, where you can create your
own Guides or edit a Guide file without having to write a single line of code. Analysis Builder
is started by selecting Guides > Create and Edit Guide from the menu.
9.3
Guides Pane Options
If you right-click in the Guides pane a pop-up menu appears. Select Options... to display the
Guides Pane Options dialog.
Page viewed when starting DecisionSite
By default, the Guides pane displays a list of your available guides. You can also select to show
another web page as your start page.
To do this, type in the URL of the custom start page in the Address field (or click Browse...).
This does not change which DecisionSite Analytic Server you are connected to, but merely
provides a way to access other pages from DecisionSite.
The Custom Start Page will be displayed each time you start Spotfire DecisionSite. Finally,
click OK to make the changes take effect.
If the new Custom Start Page is not on your local intranet or among the Trusted Spotfire
sites (see below), a pop-up dialog will appear in which you are asked if you would like to add
the URL to the list of trusted sites.
Trusted Spotfire Sites
Only sites on your local intranet, or present in the list of Trusted Spotfire sites, are allowed to
access Spotfire DecisionSite using scripts or active content . Each time you enter a new
384
Guides
Custom Start Page you will be prompted whether or not you want to add that site to the list of
Trusted Spotfire sites.
If you want to remove a site from the list, select it and then click on the Remove button.
Some sites in the list may be grayed out and cannot be removed. These are sites that are
predefined for your installation and needed by Spotfire DecisionSite.
9.4
9.4.1
Run from Library...
Open Guide from Library
The Library introduces convenient sharing of analysis material. The Open Guide from
Library... link in the Guides pane allows you to access Guides located in the Library with a
single click. Using this link, Guides located in the Library can be run in the Guides pane as any
other Guide.
► To open Guides from Library
1.
2.
9.4.2
Click Open Guide from Library... in the Guides pane or select Guides > Run from
Library....
Response: The Open Guide from Library Dialog is shown.
In the Open Guide from Library Dialog, locate the Guide you want to open and click
Open.
Response: The Guide is opened in the Guides pane.
Open Guide from Library Dialog
This dialog lets you select and open a Guide that is located in the Library. To find a Guide,
either look through a Library Section's content, or search for the Guide.
Note: Only Guides created with Analysis Builder are available to be opened and edited in
Analysis Builder.
385
TIBCO Spotfire DecisionSite 9.1.1 for Lead Discovery - User's Manual
Library tab
options
Description
Library
All Guides, folders and Library Sections are listed on this tab.
Note: Only Library Sections that you have access to are listed.
Open
Select the Guide you want and click Open to open it in the Guides
pane (or in Analysis Builder if you have reached this dialog from
there). You can also double-click the Guide to open it.
Search tab
options
Description
Search tab
Use Search to search for the item you want to open.
Search for:
Enter the search string in the Search for: field and click Search. See
Searching in the Library for information about search strings.
If you click a folder in the Search result, you will be redirected to the
Library View under the Library tab.
Look in:
Select which Library Section you want to perform your search in.
Either one or all Library Sections can be searched. Only Library
Sections you have access to are listed.
► To reach the Open Guide from Library dialog:
• Click Open Guide from Library in the Guides pane, or
• select Guides > Run from Library... from the menu, or
• in Analysis Builder, click Guide > Open from Library....
Note: Opening a Guide in Analysis Builder will open the Guide for editing in Analysis Builder
and not to the Guides pane as in the previous cases.
386
Guides
9.5
9.5.1
Create and Edit Guide
Analysis Builder Overview
With the Analysis Builder you can capture your commonly performed analysis processes into
Guides. Creating your own Guides does not require your having to write a single line of code.
9.5.2
9.5.2.1
Using Analysis Builder
Guides Created with Analysis Builder
Guides created with the Analysis Builder can contain text and links. However, the Guides can
also be extended with any number of complex tasks if you have programming experience or
access to a person with these types of skills. An example of a Guide created with Analysis
Builder is presented below:
1. Contents and Title
This is the flight view which is automatically added at the top of every Guide page. It includes
the Contents link followed by the Guide title. The Contents link closes the Guide and goes back
to the main page of the Guides pane. The title of your Guide can be configured via Guide >
Properties in Analysis Builder.
2. Text and Links
This is the main part of the Guide, which you can design via Analysis Builder. You can add text
and links to the Guide.
3. Back and Next
These are navigation links which are automatically added at the end of every Guide page. The
first page of the Guide gets a Next link, following pages get a Back and a Next, and the last page
of the Guide gets a Back and a Back to Contents link (same function as the Contents link in the
flight view).
9.5.2.2
Suggested Workflow
► To create a new Guide using Analysis Builder:
1.
2.
Open a data set in Spotfire DecisionSite and start to perform your analysis the way that
you want it to be done in the Guide.
If the Analysis Builder tool is not already open, click Guides > Create and Edit
Guide.
387
TIBCO Spotfire DecisionSite 9.1.1 for Lead Discovery - User's Manual
3.
4.
5.
6.
9.5.2.3
388
Create the Guide in Analysis Builder by adding links and text to the Guide contents
list. By adding actions (links) to your Guide simultaneously when you perform the
analysis, you can make sure that you capture the settings used this very moment. This
way you can also add links that update the same visualization to several places in the
Guide
Test the Guide by selecting Guide > Run. The Guide will be displayed in the Guides
pane. Note that if you are testing Guide steps that include opening a data set, you will
clear the current Actions in DecisionSite list. Make sure that you have added all steps
of your current analysis to the Guide before testing the parts of the Guide that involve
switching data sets.
When you are finished with the Guide, select Guide > Save As... or publish it to the
Library with Guide > Publish to Library....
You can now send the Guide to a colleague or to your IT department for extended
functionality or deployment.
Analysis Builder Quick Reference
Action
Instruction
Start Analysis Builder
From the main menu bar of DecisionSite, select Guides >
Create and Edit Guide.
Create a new Guide
In Analysis Builder, click Guide > New.
Edit the Guide by adding text and links.
Open a Guide from the
Library
In Analysis Builder, click Guide > Open from Library....
Browse the Library to locate the Guide that you want to edit.
Edit the Guide by adding or removing text and links.
See Open from Library for more information.
Edit an existing Guide
In Analysis Builder, click Guide > Open....
Browse to locate the Guide that you want to edit.
Edit the Guide by adding or removing text and links.
Tip: Run the Guide prior to editing to populate the Actions in
DecisionSite list.
Add text to a Guide
In Analysis Builder, click Add > Text.
Enter the text that you want to add in the Text Properties
dialog.
Click OK to close the dialog.
Add new actions to the
Actions in DecisionSite list
Open a data set, run a tool or create a visualization in Spotfire
DecisionSite.
All actions that you have performed on your current data set
are logged and included in the Actions in DecisionSite list.
Add links to a Guide
Make sure you have performed the action you want to add as
a link in DecisionSite.
Select the item or items you want to add to your Guide in the
Actions in DecisionSite list.
Click < Add Link.
See How the Actions in DecisionSite list works for more
information.
Guides
Update an existing
visualization
Add a link that creates a visualization.
Add the action for the specific visualization to a new link.
Add a hyperlink to a Guide
Double-click on a text item or select Add > Text to add a
new text item. This will display the Text Properties dialog.
Select the word that you want to create a hyperlink from.
Click on the Hyperlink button,
9.5.2.4
.
Test a Guide
In Analysis Builder, select Guide > Run.
Comment: The Guide will be displayed in the Guides pane
as any other Guide.
Save a Guide
In Analysis Builder, select Guide > Save.
Publish a Guide to the
Library
In Analysis Builder, select Guide > Publish to Library.
See Publish to Library for more information.
Add a new page to a Guide
In Analysis Builder, select Add > New Page.
Comment: A flight view linking back to Contents as well as
Next [page] and Back links are automatically added to each
page in the Guide.
Minimize the Analysis
Builder
Click on the top right x-button. This will hide the Analysis
Builder, but both the Guide contents list and the Actions in
DecisionSite list will be remembered when you reopen the
tool.
Close the Analysis Builder
In Analysis Builder, select Guide > Exit.
How the Actions in DecisionSite List Works
Adding Links to a Guide
All actions in the right list called Actions in DecisionSite can be added as a link to the Guide.
Click to select an action in the list (use Ctrl to select several actions), and then click the < Add
Link button to create a link in the Guide.
Adding Actions to the List
Actions are automatically logged in the Actions in DecisionSite list as you perform them in
DecisionSite. First load data and perform the analysis as you would normally do. Your data, the
visualizations you create, and the tools you start will appear as actions in the list.
Tip: To edit a previously created Guide, start by running the Guide in DecisionSite. This will
furnish the list of actions with the data, visualizations and tools used in the Guide.
Automatic Logging
You do not have to turn on Analysis Builder in order for your actions to be logged. It is done
automatically when you load data in DecisionSite Client, even if you have not started Analysis
Builder. However, if you log out from the server, no actions will be logged while you are
disconnected.
Clearing the List of Actions
The list of actions will be emptied if you close your data via File > Close in DecisionSite.
Note: The Actions in DecisionSite list will be cleared if you open a new data set. Since you can
only have one data set open at a time in Spotfire DecisionSite, the previous data will be closed
389
TIBCO Spotfire DecisionSite 9.1.1 for Lead Discovery - User's Manual
when you open the new data set. If you log out from the server, the Analysis Builder will be
closed and the Actions in DecisionSite list will be cleared.
9.5.2.5
Settings Captured in Links
All actions that you have performed on your current data set are included in the Actions in
DecisionSite list. See How the Actions in DecisionSite list works for more information about
the Actions in DecisionSite list.
Note: The Analysis Builder will log all actions that you perform in DecisionSite, even if it has
not been started. The Actions in DecisionSite list will be cleared if you open a new data set.
Information links
If an information link is added via the Information Library or the Information Builder, the
created Guide will include a reference to the information link or the actual query, respectively.
If the information link is prompted, the end users of the Guide will see the prompts and be able
to make their own selection. There is, however, no reference to the server that the Information
Link is located on, so if you intend to distribute your Guide containing information links to
users who work on a different server to your own, you must copy the Information Model to
their server. For more information on copying data layers, see the chapter "Information
Designer" of the Spotfire DecisionSite Analytics Server - Administrator's Guide, and contact
your DecisionSite Analytics Server administrator.
If you want the end user of the Guide to be able to choose a different information link, you
should instead include a link that starts the tool Information Library. To make the action Start
Information Library appear in the Actions in DecisionSite list, start the tool once more after
opening the information link that you used when creating the Guide and select Cancel in the
Information Library dialog.
Open data (saved with Guide)
If a data set has been opened by some other means than by opening an information link, you
will have the option to save the data with the Guide. This means that the data set that you are
currently using will be a part of the Guide file. This can be useful for reference data that are
never changed or if you want to create a prototype Guide where some IT personnel will later on
modify your Guide to open data from a data source that is currently not supported by Analysis
Builder.
The data set that is saved with the Guide is the currently available data. That means that if you
have added or removed columns from the original data set prior to adding the link to your
Guide, the embedded data will contain the modified data set.
If you want to save the data from an information link with the Guide, e.g., for testing purposes,
you can first open the information link, save the data as an Analysis in DecisionSite, open the
Analysis with the data and add the new action Open data (saved with Guide) to your Guide.
Visualizations
The visualizations appear in the Actions in DecisionSite list when they are created, but the
actual settings for the visualization are retrieved when a link is added to the Guide contents list.
All properties are saved with the specific visualization. For example, you can specify that a
scatter plot should be created with two defined columns on the axes and with the markers
colored by a third column. Query device settings (filtering), transformed columns and
background images are also included in the link. It is also possible to add steps to the Guide
where the end user of the Guide is prompted to specify which settings to use. See Prompting
Guide users for input for more information.
Set query device filters
Adding this action in a link will set all query devices and also the selected properties of the
Columns tab to the current state. This means that you can apply log scale, show or hide empty
values, specify query device types and filter on specific columns without having to add a new
390
Guides
visualization. This way, you can create several links in the Guide that update your
visualizations, thus creating a "bookmark" kind of function.
Note: If the data set that the end user of a Guide is using differs from the one that you were
using while creating the Guide, there might be occasions when the query device settings will
not be applicable.
Tools
In the current version of Analysis Builder, settings are not always saved with the tools. The
various tool links will, in some cases, open the tool to the end users of the Guide, but they will
have to make the calculation selections and click OK in the tool dialog for themselves. If you
want the end users to use some specific settings in one of those tools, you should state this
information as text in the Guide.
A number of tools, e.g., the New Column from Expression tool, can be run silently (without
input from the end user). When a link is added to such a tool, you can set the Tool Option to
specify whether you want the link to run the tool using the settings that you specified in the
current analysis, or if you want to display the dialog to the end user of the Guide.
To add a tool which you have created using Computation Services you must first open the
configuration in Computation Services and select File > Send to Analysis Builder. This will
create the action Start Data computation in the Actions in DecisionSite list, which can be
included in your Guide as any other action.
Multiple action links
It is possible and also often recommended to include several actions in a single link. For
example, if you want the Guide to open an information link and also display one or more
visualizations upon clicking the link, you can combine these actions to one link. Make sure you
have performed all actions that you want to include. Then click to select all of the actions that
should be included and click < Add Link. The actions will be performed in the order that they
appear in the Actions in DecisionSite list, i.e., the order you performed them in your analysis.
9.5.2.6
Running Guides Locally
While you are developing a Guide, or if you create Guides that are for your own use only, you
may want to run a Guide locally on your own computer, without giving other users access to it
on the server.
► To run a Guide locally:
1.
In the main menu bar of DecisionSite, select Guides > Run from File....
Response: An Open dialog is displayed.
2. Browse to the Guide file that you want to run.
Comment: Spotfire Guide files (SFG) or HTML files may be opened.
3. Click Open.
Response: The Guide that you have selected is opened in the Guides pane. Follow the
instructions in the Guide as usual.
Tip: If you want to test the Guide during development, select Guide > Run in Analysis
Builder. This will immediately display the Guide inside the Guides pane. It is not necessary to
save the Guide prior to testing.
9.5.2.7
Prompting Guide Users for Input
All properties are saved with their respective visualization when you add that visualization to
the Guide. However, there may be occasions when you want the end user of the Guide to be
able to specify which columns to use on different axes, which column to color the markers by,
etc., upon running the Guide.
391
TIBCO Spotfire DecisionSite 9.1.1 for Lead Discovery - User's Manual
► To prompt for input to visualizations:
1.
In the Actions in DecisionSite list, click to select the visualizations that you want the
new link to create.
Comment: See How the Actions in DecisionSite list works for more information on
how to populate the list.
2. Make sure that Edit > Show Add Link Dialogs is selected with a check mark.
3. Click < Add Link.
Response: The Link Properties dialog is displayed
4. Click on the visualization action that you want to add prompting to in the Actions
performed when clicking the link list.
Response: The Prompts... button is activated.
Comment: Prompting is not supported for multiple color bands in pie charts.
5. Click Prompts....
Response: The Prompt for... dialog is displayed.
Comment: This dialog varies depending on which type of visualization that you have
selected.
6. Select the check box for the things that you want the user to specify.
Comment: Each selected object will result in the appearance of a setting selection in a
dialog which is presented to the end user of the Guide.
7. If desired, change the Title for input field in prompt dialog to a different title.
Comment: This is the title that the end user of the Guide will see above the selected
setting.
8. Click OK.
Response: In the Link Properties dialog, the visualization action is updated with the
information [Settings modified].
9. Repeat steps 4-7 if you want to create a multiple action link with several prompt steps.
10. Click OK.
Response: The link is added to the Guide contents list.
► To prompt for input to tools:
1.
2.
3.
4.
5.
6.
7.
8.
392
In the Actions in DecisionSite list, click to select the tool that you want the new link to
start.
Comment: See How the Actions in DecisionSite list works for more information on
how to populate the list.
Make sure that Edit > Show Add Link Dialogs is selected with a check mark.
Click < Add Link.
Response: The Link Properties dialog is displayed
Click on the tool action that you want to add prompting to in the Actions performed
when clicking the link list.
Response: The Prompts... button is activated.
Click Prompts....
Response: The Tool Option dialog is displayed.
Select the Display the tool dialog, so the user can provide input radio button.
Comment: For many of the tools in DecisionSite, this is the only alternative available.
The number of tools that can be run silently (without input from the end user of the
Guide) will increase in coming releases of Analysis Builder.
Click OK.
Response: The Tool Option dialog is closed.
Click OK.
Response: The link is added to the Guide contents list.
Guides
9.5.2.8
Open and Publish Guides to the Library
The Library introduces convenient publishing of analysis material. Guides can be published to
the Library for sharing with your colleagues. Located in the Library, the Guide can be opened
by anyone with read access.
► To open Guides from Library in Analysis Builder:
1.
2.
In Analysis Builder, select Guide > Open from Library....
In the Open from Library Dialog, locate the Guide you want to open and click Open.
Response: The Guide is opened in Analysis Builder.
Note: Only Guides created with Analysis Builder can be opened.
► To publish Guides to the Library:
1.
2.
3.
4.
5.
6.
9.5.2.9
In Analysis Builder, select Guide > Publish to Library....
In the Publish to Library Wizard Step 1(2), browse to the location where you want to
publish the Guide.
In the Guide Title text box, enter the name of the Guide and click Next >.
Please enter properties of your Guide in Publish to Library Wizard Step 2(2).
Click Finish.
Response: Your Guide is published to the Library.
In the Publish to Library Guide Published step, decide if you want to email your
colleagues about your new Library Guide. Click Close when done.
Deploying Guides to a Server
There are two ways of distributing a Guide to your colleagues. Simplest way is to publish your
Guide to the Library via the Guide > Publish to Library menu alternative. See Publish to
Library for more information. The other alternative is to deploy your Guide to the server.
To deploy a Guide on the server, you need access to Spotfire DecisionSite Developer and you
also need administrators rights on the DecisionSite Analytics Server. In Spotfire DecisionSite
Developer you find the application DecisionSite Builder, where you can incorporate your
Guides into custom DecisionSite applications or extensions.
See Spotfire DecisionSite Developer for more information on deployment, or contact your
Spotfire DecisionSite Administrator.
9.5.3
9.5.3.1
User Interface
Analysis Builder User Interface Overview
This is the Analysis Builder user interface:
393
TIBCO Spotfire DecisionSite 9.1.1 for Lead Discovery - User's Manual
1. Analysis Builder menus
The Guide, Edit, Add, Format and Help menus contain menu commands required to work with
the Analysis Builder.
2. Toolbar
Includes shortcuts for some of the most common commands in the Analysis Builder. See
Analysis Builder toolbar for a description of the different buttons.
3. Guide contents
This window contains the contents of your current Guide. This is where you create a new Guide
or modify an existing Guide. Text is added by double-clicking were it says Double-click to edit
text or by selecting Add > Text from the menu. Links to actions are added from the Actions in
DecisionSite list, see below.
You can move text items, comments, links and page breaks in the Guide contents list to the
desired position using a simple drag-and-drop operation.
4. Actions in DecisionSite
This list contains all actions that you have performed in DecisionSite during the latest session.
A session is defined as the time from when you have opened your current data set until you
close it. The Analysis Builder does not have to be started to log the events. Closing the data set
will clear the action list.
Select one or more actions from this list and click < Add Link to include the action (or
combined action) in the Guide. If you want to add an action that is currently not available in the
action list, first perform the action in DecisionSite and it will immediately show up in the list.
5. < Add Link
Select one or more actions from the Actions in DecisionSite list and click this button to include
the action (or combined action) in the Guide. The link will by default include the settings used
in DecisionSite at the very moment you add the link.
394
Guides
6. How to add links?
This link opens this help file to a page with tips on how to add links to a Guide.
► To reach the Analysis Builder:
Select Guides > Create and Edit Guide.
9.5.3.2
Analysis Builder Toolbar
The Analysis Builder toolbar includes shortcuts for some of the most common commands in the
menus. Click on the buttons on the toolbar to activate the corresponding functions.
Creates a new, empty Guide. This resets the Guide contents window but not the
Actions in DecisionSite list.
Opens a dialog where you can select a previously saved Guide file (SFG) that you
can continue to work on or modify and save as a new Guide.
Saves the current Guide as an SFG file.
Launches the current Guide in the Guides pane. It is not necessary to save the Guide
prior to using this command in Analysis Builder. Therefore, it is useful for iterative
testing of the design of the Guide.
Note: If you are testing Guide steps that include opening a data set, you will clear the
current Actions in DecisionSite list! Make sure that you have added all steps of your
current analysis to the Guide before you test the parts of the Guide that involve
switching data sets.
Adds a new text element below the currently selected item, or, if no item is selected,
at the bottom of the Guide contents list. The Text Properties dialog is displayed with
the default text "Enter text here".
Creates a new page in the Guide. The beginning of the new page is labeled -----Page
Break----- in the Guide contents list.
Adds a number before the selected text, link or comment item. Subsequently
following text, link or comment items on the same Guide page get the next number
(2, 3...), if this button is selected.
Adds a bullet before the selected text, link or comment item.
Indents the selected text, link or comment item.
9.5.3.3
Text Properties Dialog
The Text Properties dialog is used to enter and edit the text of a text element. Multiple
paragraphs can be written within the same text element, bold formatting and hyperlinks can be
applied to selected text.
395
TIBCO Spotfire DecisionSite 9.1.1 for Lead Discovery - User's Manual
Applies bold formatting to the selected text. Also available using the short
command Ctrl+B.
Opens the Hyperlink Properties dialog, where you can create a hyperlink to an
external web page from the selected text. Also available using the short command
Ctrl+K.
► To reach the Text Properties dialog:
The Text Properties dialog is displayed when a new text element is added to the Guide in
Analysis Builder, e.g., via Add > Text. It can also be displayed by double-clicking on a
previously entered text element.
9.5.3.4
Hyperlink Properties Dialog
The Hyperlink Properties dialog is used to insert hyperlinks to external web pages in the Guide.
To add links that perform actions in DecisionSite (opens data, creates visualizations, etc.), see
How the Actions in DecisionSite list works.
396
Option
Description
Text to display
The text that will be displayed as a hyperlink (green and
underlined).
Guides
URL to external web
page
The address to the external web page where you want to go when
clicking on the hyperlink. The address must begin with either http://
or file://.
► To reach the Hyperlink Properties dialog:
9.5.3.5
1.
In the Text Properties dialog, select the word that you want to create a hyperlink from.
2.
Click on the Hyperlink button,
.
Link Properties Dialog
The Link Properties dialog is specific to each link in your Guide. Here, you can edit the link
text and view which actions will be performed upon clicking the link. This is especially useful
if you have created links performing multiple actions.
Option
Description
Text to display
Edit the default text to display a link text of your choice in the new
Guide.
Actions performed
when clicking the
link
Displays the actions that are part of the current link. If multiple
actions are included in the link, the actions are ordered in a numbered
list where the action first performed is number 1.
Prompts...
Displays the Prompt for... dialog, if the selected action is a
visualization, or the Tool Option dialog, if the selected action is a
tool.
Close all previous
visualizations before
performing the
actions in this link
Adds an action with the title Close all visualizations to the top of the
list of actions in this dialog. This means that all visualizations that
were open when the end user of the Guide clicked on this link will be
closed. This can be used to prevent the desktop from being cluttered
with visualizations.
Don't show this
dialog again
Select this check box if you do not want to see this dialog
automatically upon adding new links. To display it again, select Edit
> Show Add Link Dialogs....
397
TIBCO Spotfire DecisionSite 9.1.1 for Lead Discovery - User's Manual
► To reach the Link Properties dialog:
The Link Properties dialog is automatically displayed when a new link is added to the Guide in
Analysis Builder. If the check box Don't show this dialog again has been selected earlier, the
dialog for a specific link can be displayed by double-clicking the link in the Guide contents list.
9.5.3.6
Prompt for... Dialog
The Prompt for... dialog is specific to each visualization in a link. If you have selected a scatter
plot (as in the example below) the dialog will be called Prompt for Scatter Plot (or whatever the
title of the visualization is) and the column names of the selected axes. This dialog allows you
to decide for which properties the end user of the Guide should provide input.
Note: Only properties that you have used in your current version of the plot will be available.
Hence, if you want the end user of the Guide to be able to select by which column to color by,
you must make sure that you have selected some column in the Properties dialog of the
visualization (in DecisionSite). Also note that prompting is not supported for multiple color
bands in pie charts.
Option
Description
Prompt user for
Select the check box for each of the properties that you want the end
user of the Guide to be able to specify upon running the Guide.
Note: If you want the end user of the Guide to use exactly the same
settings as your current visualization, you should not allow any
prompting at all.
Title for input field
in prompt dialog
Enter a descriptive title to be shown in the Settings for... dialog of the
selected visualization. This is what the end user of the Guide will see
above the drop-down list for each selected property.
► To reach the Prompt for... dialog:
1.
398
Create visualizations and edit their properties in DecisionSite (Edit > Properties in
main application).
Guides
2.
3.
4.
9.5.3.7
Add a link that creates one or more visualizations to the Guide.
In the Link Properties dialog of the desired link, click to select the visualization that
you want to add prompting for.
Click Prompts....
Settings for... Dialog
The Settings for... dialog is displayed when running a Guide that includes prompted steps. It is
specific to each visualization in a link. If you have selected a heat map, the dialog will be called
Settings for Heat Map.
This dialog allows the end user of a Guide to select to certain properties for a specific
visualization at run-time of the Guide. Only the properties specified by the creator of the Guide
will be available.
This dialog varies depending on both the type of visualization and the selections that you have
made in the Prompt for.. dialog.
Example:
A data set containing height, weight and eye color of a group of men and women is opened in
DecisionSite and two visualizations are created; The first visualization is a scatter plot with
height on the X-axis and weight on the Y-axis, and the markers are colored by eye color and
sized by gender. The second visualization is a table showing all available columns in the data
set.
399
TIBCO Spotfire DecisionSite 9.1.1 for Lead Discovery - User's Manual
A Guide created using Analysis Builder can be edited to prompt its end user to specify certain
visualization settings as indicated below:
Settings in Properties dialog for
visualization (in DecisionSite):
The Properties dialog of a scatter plot.
Settings and titles specified in the Prompt Resulting Settings for... dialog
for... dialog:
displayed upon running Guide:
Here, the scatter plot properties that were
set to something other than [None], that
is, Color and Size, together with the axisselections, are shown as possible prompts.
The creator of this Guide has determined
that the size should always be set by
gender as she specified when she created
the original scatter plot, so this check box
is not selected in the Prompt for... dialog.
The resulting Settings for... dialog
shows the three selected prompt lists
upon running the Guide. The titles of
the lists are the ones entered by the
Guide creator in the Prompt for...
dialog.
In this case, the only setting that had been
modified was the columns displayed in
the table. Hence, this is the only item
available for prompting in the Prompt
for... dialog.
The Properties dialog of a table
visualization.
400
If the selected prompt item is a list of
columns, the resulting Settings for...
dialog will contain two list boxes
where the end user of the Guide can
move columns from Available
Columns to Used Columns using the
arrows >> and <<, and also sort the
columns with the up and down arrows.
Guides
► To reach the Settings for... dialog during development of a
Guide:
1.
2.
3.
9.5.3.8
Add one or more prompt steps to a visualization link using the Prompt for... dialog.
Select Guide > Run from the Analysis Builder menu.
Step through the Guide to locate the edited visualization link and click on it.
Guide Properties Dialog
The Guide Properties dialog controls important properties like the title and ToolTip of the
Guide after it has been deployed to a server. It is recommended that you fill in all fields of the
Guide Properties to facilitate efficient administration of Guides on the server.
Option
Description
Title
The title of your Guide as it will be displayed in the Guides pane
when it is published to a server. The title is also displayed in the
flight view when you are running the Guide. It is important that the
title is informative with regards to what the Guide really does.
If the Guide will be published to a server, no characters other than az, A-Z, 0-9, ! $ ( ) , - . ; _ { } ~ and blank spaces should be used in
this field due to restrictions in DecisionSite Builder.
Description
A description of the functions of the Guide. The description can
make it easier for the server administrator to group similar Guides
together and remove duplicates, etc.
ToolTip
A short description of the Guide to be displayed as a ToolTip when
you hover with the mouse pointer over the Guide title in the Guides
pane. Example: "Creates a bar chart by binning data into even
intervals"
Keywords
Keywords specific to the contents of the Guide. Keywords are
separated by semicolon, i.e., if you write "bar chart binning" it will be
interpreted as a single keyword. To produce two keywords the words
must be separated with semicolon. Hence, "bar chart ;binning" will
result in the two keywords "bar chart" and "binning".
401
TIBCO Spotfire DecisionSite 9.1.1 for Lead Discovery - User's Manual
Author
The name of the Guide author. The default value is the user name that
you used when logging in to DecisionSite Analytics Server. The
author name can be especially important to your IT personnel if they
want to perform any changes to your Guide and want to check with
you that their changes are correct.
Company
The company for which you have created the Guide. This is
commonly used in the package name of the Guide resource when the
Guide is deployed to a server. If the Guide will be published to a
server, no characters other than a-z, A-Z, 0-9, ! $ ( ) , - . ; _ { } ~ and
blank spaces should be used in this field due to restrictions in DS
Builder.
Don't show this
dialog when saving
Guide
Select this check box if you do not want to see this dialog
automatically when you are saving your Guides.
► To reach the Guide Properties dialog:
In Analysis Builder, click Guide > Properties.
9.5.3.9
Tool Option Dialog
Option
Description
The tool will be run silently (without any input from the end user of
Run the tool, using
the settings from this the Guide) using the same settings that you used in your calculation.
analysis
Display the tool
dialog, so the user
can provide input
The tool is started, but the end user of the Guide must provide input
and click OK in the tool dialog for any calculation to be performed.
► To reach the Tool Option dialog:
1.
2.
3.
Run a tool in DecisionSite.
Add a Run-the-tool link to the Guide.
In the Link Properties dialog of the desired link, click to select the tool that you want
to add prompting for.
4. Click Prompts....
Note: In the current version of Analysis Builder, not all tools have the possibility to be run
silently.
402
Guides
9.5.3.10
Open Guide from Library Dialog
This dialog lets you select and open a Guide that is located in the Library. To find a Guide,
either look through a Library Section's content, or search for the Guide.
Note: Only Guides created with Analysis Builder are available to be opened and edited in
Analysis Builder.
Library tab
options
Description
Library
All Guides, folders and Library Sections are listed on this tab.
Note: Only Library Sections that you have access to are listed.
Open
Select the Guide you want and click Open to open it in the Guides
pane (or in Analysis Builder if you have reached this dialog from
there). You can also double-click the Guide to open it.
Search tab
options
Description
Search tab
Use Search to search for the item you want to open.
Search for:
Enter the search string in the Search for: field and click Search. See
Searching in the Library for information about search strings.
If you click a folder in the Search result, you will be redirected to the
Library View under the Library tab.
Look in:
Select which Library Section you want to perform your search in.
Either one or all Library Sections can be searched. Only Library
Sections you have access to are listed.
► To reach the Open Guide from Library dialog:
•
•
Click Open Guide from Library in the Guides pane, or
select Guides > Run from Library... from the menu, or
403
TIBCO Spotfire DecisionSite 9.1.1 for Lead Discovery - User's Manual
• in Analysis Builder, click Guide > Open from Library....
Note: Opening a Guide in Analysis Builder will open the Guide for editing in Analysis Builder
and not to the Guides pane as in the previous cases.
9.5.3.11
9.5.3.11.1
Publish to Library Wizard
Publish to Library Wizard: Step 1(2)
This wizard helps you to publish a Guide in the Library. Using the Library, your colleagues can
use your Guide from a Library Section.
This step lets you specify where in the Library your Guide should be published. Navigate in the
Library by double-clicking on Library Sections and folders.
Note: Only Guides created with Analysis Builder are available.
404
Options
Description
New Folder
Creates a new folder where you can publish your Guide. A dialog
will prompt you for the new folder name.
Note: The New Folder button is only displayed inside a Library
Section.
Members
Lists all users with at least read access to the current Library Section.
Each Library Section has its own set of access permissions.
Note: The Members button is only displayed inside a Library
Section.
Guide title
The name of the Guide as it will be displayed in the Library. This title
will be displayed as a link in the Guides pane. It is important that the
title is informative with regards to what the Guide actually does.
Note: The title can be 50 characters at the most, and the following
characters are not supported:
\/:*?"<>+|$&+=@#%:;,{[]}^'~´
Guides
Next >
Proceeds to Publish to Library Wizard: Step 2(2) where properties
can be edited further.
► To reach the Publish to Library Wizard Step 1(2) dialog:
In Analysis Builder, click Guide > Publish to Library....
9.5.3.11.2
Publish to Library Wizard: Step 2(2)
This dialog lets you enter all properties of the Guide. By using detailed properties, the
organization and search capabilities in the Library are greatly enhanced.
Option
Description
Guide title
The name of the Guide as it will be displayed in the Library. This is
the title you provided in the previous step.
Description
A description of the functions of the Guide. The description can make
it easier for the server administrator to group similar Guides together
and remove duplicates, etc.
Note: The description can be at most 650 characters. (Certain
Unicode characters may take up 6 character spaces in this regard.)
Keywords
Keywords specific to the contents of the Guide. Keywords are
separated by semicolon, i.e., if you write "bar chart binning" it will be
interpreted as a single keyword. To produce two keywords the words
must be separated with semicolon. Hence, "bar chart;binning" will
result in the two keywords "bar chart" and "binning".
Keyword are used to enhance organization and search capabilities.
Use keywords for precise searches.
ToolTip
A short description of the Guide to be displayed as a ToolTip when
you hover with the mouse pointer over the Guide title in the Guides
pane. Example: "Creates a bar chart by binning data into even
405
TIBCO Spotfire DecisionSite 9.1.1 for Lead Discovery - User's Manual
intervals"
Author
The name of the Guide author.
Company
Here you can specify the company that owns the Guide.
Finish
Click Finish to publish your Guide and proceed to the Publish to
Library: Guide Published dialog where you can find information on
notify your colleagues.
► To reach the Publish to Library Wizard: Step 2(2) dialog:
1.
2.
9.5.3.11.3
In Analysis Builder, click Guide > Publish to Library....
In the Publish to Library Wizard: Step 1(2), select Library location, enter a title, and
click Next >.
Publish to Library: Guide Published
As soon as you have saved your Guide in the Library, a dialog window will appear with a
confirmation that your Guide is published. This dialog will also include a hyperlink to the
Library folder containing the Guide you just published, which you can click on to view the final
result.
Example of a confirmation from DecisionSite Library about a published item.
Option
Description
Link
Click on the link to open the Library folder containing your published
Guide.
Close
Closes the notification dialog
► To reach the Publish to Library Guide Published dialog:
1.
2.
3.
9.5.3.12
9.5.3.12.1
In Analysis Builder, click Guide > Publish to Library....
In the Publish to Library Wizard: Step 1(2), select Library location, enter a title , and
click Next >.
Enter properties in Publish to Library Wizard: Step 2(2) and click Finish.
Menus
Analysis Builder Guide Menu
The Guide menu contains commands used when working with Guide files:
406
Guides
Option
Description
New
Creates a new, empty Guide. This resets the Guide contents window
but not the Actions in DecisionSite list.
Open...
Opens a dialog where you can select a previously saved Guide file
(SFG) that you can continue to work on or modify and save as a new
Guide.
Save
Saves the current Guide as an SFG file.
Save As...
Saves the current Guide to a name and location that you specify.
Open from
Library...
Opens the Open from Library dialog. This opens a Guide from the
Library.
Publish to Library... Opens the Publish to Library Wizard. Publishes the current Guide to
the Library for sharing.
9.5.3.12.2
Run
Launches the current Guide in the Guides pane. It is not necessary to
save the Guide prior to using this command in Analysis Builder.
Therefore, it is useful for iterative testing of the design of the Guide.
Note: If you are testing Guide steps that include opening a data set,
you will clear the current Actions in DecisionSite list! Make sure that
you have added all steps of your current analysis to the Guide before
you test the parts of the Guide that involve switching data sets.
Properties
Opens the Guide Properties dialog.
Exit
Closes Analysis Builder. If the current Guide has been modified, you
will be prompted to save the Guide.
Analysis Builder Edit Menu
The Edit menu contains commands used when working with Guide files:
Option
Description
Move Up
Moves the currently selected text, comment, link or Page Break in the
Guide contents list up one step.
Move Down
Moves the currently selected text, comment, link or Page Break in the
Guide contents list down one step.
Delete
Deletes the selected text, comment, link or Page Break from the Guide
contents list. You can also press Delete on your keyboard to perform the
same function.
Text Properties Displays the Text Properties dialog. Comments are directly opened for
editing by double-clicking on the comment.
9.5.3.12.3
Link
Properties
Displays the Link Properties dialog.
Show Add
Link Dialogs
Shows or hides the Link Properties dialogs that are displayed when you add
a link from the Actions in DecisionSite list.
Analysis Builder Add Menu
The Add menu contains the following commands:
407
TIBCO Spotfire DecisionSite 9.1.1 for Lead Discovery - User's Manual
9.5.3.12.4
Option
Description
Text
Opens the Text Properties dialog where you can enter a new text which will
be inserted below the currently selected item, or, if no item is selected, at
the bottom of the Guide contents list. The Text Properties dialog is
displayed with the default text "Enter text here".
New Page
Creates a new page in the Guide. The beginning of the new page is labeled ----Page Break----- in the Guide contents list.
Comment
Adds a new text box with text in italics below the currently selected item,
or, if no item is selected, at the bottom of the Guide contents list. The new
comment item is displayed with the default text "Click to add comment".
The purpose of comments is normally to indicate that something in this
Guide should be changed or added by the IT department of the Guide
creators company. Therefore, comments should normally be removed
before the Guide is deployed to all users.
Analysis Builder Format Menu
The Format menu contains the following commands:
9.5.3.12.5
Option
Description
Numbered
Adds a number before the selected text, link or comment item.
Subsequently following text, link or comment items on the same Guide
page get the next number (2, 3...), if this button is selected.
Bulleted
Adds a bullet before the selected text, link or comment item.
Indented
Indents the selected text, link or comment item.
Analysis Builder Help Menu
The Help menu contains the following command:
9.5.3.12.6
Option
Description
Analysis
Builder Help
Opens this help file to the Analysis Builder Overview topic.
Analysis Builder Pop-up Menu
The pop-up menu which is displayed upon right-clicking on an item in the Guide contents list
contains the following commands:
408
Option
Description
Move Up
Moves the currently selected text, comment, link or Page Break in the
Guide contents list up one step.
Move Down
Moves the currently selected text, comment, link or Page Break in the
Guide contents list down one step.
Delete
Deletes the selected text, comment, link or Page Break from the Guide
contents list. You can also press Delete on your keyboard to perform the
same function.
Guides
Text Properties Displays the Text Properties dialog. Comments are directly opened for
editing by double-clicking on the comment.
Link
Properties
9.6
9.6.1
Displays the Link Properties dialog.
Publish to Library
Publish to Library Overview
The Publish to Library tool allows you to publish custom Guides and Analysis Builder Guides
to the Library. By publishing your Guides, colleagues can use them in a convenient way.
To publish Analyses and Posters, see Publishing Analyses to Library and Publishing Posters to
Library.
► To publish Guides to the Library:
1.
2.
3.
4.
5.
9.6.2
9.6.2.1
Select Guides > Publish to Library.
In Publish to Library Wizard Step 1(3), select if you want to publish a custom made
Guide or a Guide created with Analysis Builder. Click Next >.
Select the location in the Library for your Guide in Publish to Library Wizard Step
2(3). Click Next >. Navigate in the Library by using double-click on Library Sections
and folders.
Enter properties of your Guide in Publish to Library Wizard Step 3(3). Click Finish.
In the Publish to Library Wizard Guide Published dialog, select if you want to notify
your colleagues. In this dialog you can send an email with a link to the Guide.
Response: Your Guide is published to the Library in the specified location. Anyone
with read access to that Library Section can now use the Guide.
Publish to Library Wizard
Publish Guide to Library Wizard: Step 1(3)
This wizard helps you to publish a Guide in the Library. Using the Library, your colleagues can
use your Guide from a Library Section.
Both custom made Guides and Guides created with Analysis Builder can be published with the
Publish to Library Wizard.
409
TIBCO Spotfire DecisionSite 9.1.1 for Lead Discovery - User's Manual
Option
Description
To publish a Guide created with Analysis Builder, click Browse... to
Guide saved in file
from Analysis Builder locate the SFG file containing the Guide.
(SFG File)
Tip: You can publish Analysis Builder Guides directly in Analysis
Builder.
Guide with custom
developed code
(Source code folder)
To Publish a custom made Guide, click Browse... to locate the folder
in which it is stored. Custom made Guides are Guides not created
with Analysis Builder.
Next >
Proceeds to Publish Guide to Library Wizard: Step 2(3).
► To reach the Publish Guide to Library Wizard: Step 1(3) dialog:
Select Guides > Publish to Library... from the menu.
9.6.2.2
Publish Guide to Library Wizard: Step 2(3)
This step lets you specify where in the Library your Guide should the published. Navigate in
the Library by using double-click on Library Sections and folders.
410
Guides
Options
Description
New Folder
Creates a new folder where you can publish your Guide. A dialog
will prompt you for the new folder name.
Note: The New Folder button is only displayed inside a Library
Section.
Members
Lists all users with at least read access to the current Library Section.
Each Library Section has its own set of access permissions.
Note: The Members button is only displayed inside a Library
Section.
Guide title
The name of the Guide as it will be displayed in the Library. This title
will be displayed as a link in the Guides pane. It is important that the
title is informative with regards to what the Guide actually does.
Note: The title can be 50 characters at the most, and the following
characters are not supported:
\/:*?"<>+|$&+=@#%:;,{[]}^'~´
Next
When you have selected a location where you want to publish your
Guide, click Next to continue to Publish to Library Wizard: Step 3(3).
► To reach the Publish Guide to Library Wizard: Step 2(3) dialog:
1.
2.
9.6.2.3
Select Guides > Publish to Library... from the menu.
Select which type of Guide you want to publish in Publish Guide to Library Wizard:
Step 1(3) and click Next >.
Publish Guide to Library Wizard: Step 3(3)
This dialog lets you to enter all properties of the Guide. By using detailed properties, the
organization and search capabilities in the Library are greatly enhanced.
411
TIBCO Spotfire DecisionSite 9.1.1 for Lead Discovery - User's Manual
412
Option
Description
Guide title
The name of the Guide as it will be displayed in the Library. This is
the title you provided in the previous step.
Description
A description of the functions of the Guide. The description can make
it easier for the server administrator to group similar Guides together
and remove duplicates, etc.
Note: The description can be at most 650 characters. (Certain
Unicode characters may take up 6 character spaces in this regard.)
Keywords
Keywords specific to the contents of the Guide. Keywords are
separated by semicolon, i.e., if you write "bar chart binning" it will be
interpreted as a single keyword. To produce two keywords the words
must be separated with semicolon. Hence, "bar chart;binning" will
result in the two keywords "bar chart" and "binning".
Keyword are used to enhance organization and search capabilities.
Use keywords for precise searches.
ToolTip
A short description of the Guide to be displayed as a ToolTip when
you hover with the mouse pointer over the Guide title in the Guides
pane. Example: "Creates a bar chart by binning data into even
intervals"
Author
The name of the Guide author.
Company
Here you can specify the company that owns the Guide.
Start page
If you are publishing a custom made Guide you need to specify which
file that is the start page of the Guide.
Note: Only visible if you selected to publish a custom Guide in
Publish to Library Wizard: Step 1(3).
Finish
Click Finish to publish your Guide and proceed to the Publish to
Library: Guide Published dialog where you can find information on
Guides
notify your colleagues.
► To reach the Publish Guide to Library Wizard: Step 3(3) dialog:
1.
2.
3.
9.6.2.4
Select Guides > Publish to Library... from the menu.
Select which type of Guide you want to publish in Publish Guide to Library Wizard:
Step 1(3) and click Next >.
Specify the location in the Library in Publish Guide to Library Wizard: Step 2(3) and
click Next >.
Publish Guide to Library: Guide Published
As soon as you have saved your Guide in the Library, a dialog window will appear with a
confirmation that your Guide is published. This dialog will also include a hyperlink to the
Library folder containing the Guide you just published, which you can click on to view the final
result.
Example of a confirmation from DecisionSite Library about a published item.
Option
Description
Link
Click on the link to open the Library folder containing your
published Guide.
Copy Link
Copies the link to the clipboard for later use. Using the link, the
Guide can easily be referenced in email discussions or from web
pages or portals. Using the links retrieved with Copy Link,
Guides can be accessed from any web environment using the
URL and name supplied.
Send Email
Launches a new email with your default email client.
Close
Closes the notification dialog
If you want to send an email notification, click on the Send Email button. This opens an email
dialog where you may enter:
• To: The email address of one or more recipients, separated by comma or semicolon.
• From: Your own email address, mandatory.
• Subject: The subject of the email.
• Comment: Any additional text you wish to appear in the email.
► To reach the Publish Guide to Library Wizard: Guide Published
dialog:
1.
Select Guides > Publish to Library... from the menu.
413
TIBCO Spotfire DecisionSite 9.1.1 for Lead Discovery - User's Manual
2.
3.
4.
414
Select which type of Guide you want to publish in Publish Guide to Library Wizard:
Step 1(3) and click Next >.
Specify the location in the Library in Publish Guide to Library Wizard: Step 2(3) and
click Next >.
Edit the Guide properties in Publish Guide to Library Wizard: Step 3(3) and click
Finish.
Saving and Exporting Data
10
10.1
Saving and Exporting Data
Saving SFS files
Save your Analysis by selecting Save As... in the File menu. Make sure that Spotfire Analysis
File (*.sfs) is selected in the Save as type list box.
How the data is stored
If the data was loaded from a source other than the clipboard, you will get an option on how to
save the actual data used in the Spotfire DecisionSite session. There are two options available:
• Saving a link to the data in a dynamic report file (Linked) – no actual data is stored in
the SFS file, merely a reference describing how to retrieve, and how to view the data.
• Saving the data in a static report file (Embedded) – the actual data used in the session
is saved in the SFS file. This is the only option available if the data was loaded from
the clipboard.
For a number of reasons, saving the data as an SFS file with Linked data should be the
preferred method, since it:
• Ensures data integrity – avoids inconsistencies.
• Reduces the file size – essential if you want to distribute the data.
• Ensures that the data is up-to-date.
However, since a link only references its data source, the dynamic SFS file is not good if the
actual data is removed or damaged.
Files with column names that contain characters that could be interpreted as column separators,
e.g., comma, semicolon, tab, etc., should always be saved with linked data to prevent Spotfire
DecisionSite from finding the wrong column separators when reopening the file. If you must
save the data embedded within the file, you can prevent the problem by saving the data as a
TXT, SKV, or CSV file and opening it with the import agent. Column names should never
contain characters that can be interpreted as column separators.
The saved link includes the file name if the data was imported from a text file, or the ODBC
data source name and the SQL query used if the data was retrieved from a database using
ODBC.
The way the data was saved has some implications on how the Analysis can be used and how it
will behave:
• If the data itself is saved in the Analysis, the session becomes static. In other words, if
the source for the data is updated, the Analysis will still show the old data. If only a
link to the data was saved, the Analysis reflects all changes made to the data source
each time the file is opened.
• If the Analysis is to be distributed, the recipients must have access to the data source to
be able to link to the data. Static report files containing the actual data create no
distribution problems.
• A static SFS file is considerably larger than a dynamic SFS file, since the latter only
contains a link to the data.
415
TIBCO Spotfire DecisionSite 9.1.1 for Lead Discovery - User's Manual
10.2
10.2.1
Spotfire Files
SFS Files
All information and settings in a Spotfire DecisionSite session can be saved as a Spotfire
Analysis File. This file has the file extension .sfs, and contains information such as:
• Current settings of the query devices, both selected values and the query device types
• Visualizations
• Coloring schemes
• Information on how to regenerate derived columns, i.e., those created by calculation
and binning
• Attached background image files
• Data (either as a reference to a data source, or embedded in the Spotfire Analysis File)
By saving your current session as an Spotfire Analysis File, you can pick up your work later
exactly where you left it off.
The handling of Spotfire Analysis Files differs depending on whether you include the data set
in the Analysis (static SFS file), or reference the data with a link (dynamic SFS file).
10.2.2
SFT Files
SFT (Template) files are like Spotfire Analysis Files but are used as templates for quickly
applying a whole range of visualization settings to a new data set.
► To create a template:
1.
2.
Open a data file.
Make the required visualization settings (query devices, coloring, multiple
visualizations, etc).
3. Select File > Save As...
4. Enter a name for the template.
5. From Save as type, select Spotfire Template Files.
6. Click OK.
For a template file to work properly, it should only be applied to data with the same column
names as the data set used to create the template. If applied to a data set with different column
names, only those settings that are independent of column name will be used (e.g., visualization
types, fixed color, fixed shape, size and jittering, but not query device settings, Color by, etc.).
Note: Columns created from marked records cannot be saved in templates (SFT files).
► To apply a template:
1. Open a data file.
2. Select File > Apply Template.
3. Select an SFT file.
4. Click OK.
You can use any SFS file in the same way as a template file, applying the settings in the
Spotfire Analysis File to your loaded data set. Use the procedure described above, but select an
Spotfire Analysis File instead of SFT.
Note: The Spotfire Interactive Report Settings dialog allows you to save your visualization
settings only in Spotfire DecisionSite version 7.x. In newer versions, all settings are always
included in a template.
416
Saving and Exporting Data
10.2.3
SFA Files
In their most simple form, SFA (Spotfire Application) files are identical to Spotfire Analysis
Files. You can save your Analysis as an SFA file and open that file again just like an Spotfire
Analysis File. The only difference is that when you open an SFA file, the resulting Analysis is
not automatically associated with that same file. You can only save it by using Save As and
enter a name. This helps you avoid accidentally over-writing the application file.
However, SFA files can also incorporate an application that is launched when opening the file.
This application, implemented using scripts and possibly involving a visible user interface,
could for instance establish database connections and perform preprocessing. The benefit is that
you can fetch the data, preprocess it, and get exactly the initial visualization that you want—all
by just double-clicking a file icon.
Please contact the Spotfire Central for more information on how to integrate code in SFA files.
10.2.4
Version 8.0 and Prior
For legacy reasons you can also save your Analysis as Spotfire DecisionSite 8.0 and version 7
files. There are two kinds of files used in older versions of Spotfire DecisionSite, SFS and XSF
files.
Spotfire File, version 8.0 (*.sfs)
The 8.0 file is actually an 8.1 file with the possibility to be opened in a DecisionSite 8.0
environment. Data will always be embedded if you select this option (linked data is not
supported).
Spotfire File, version 7 (*.sfs)
This format saves a binary SFS file in the same format as version 7.3 and is only recommended
for files that must be backward compatible with Spotfire DecisionSite version 7. Linked data is
not supported.
XSF Files, version 7 (*.xsf)
XSF files store exactly the same information as SFS files, but in an XML based format. Since
the files are in text format rather than binary, they can be searched from a file system. XML
also makes the structure of the content more clear.
10.2.5
Spotfire DecisionSite Mapping Files (SFM Files)
The Spotfire DecisionSite mapping file (*.sfm) format first establishes a coordinate system,
which relates the data set's coordinate system to that of the polygon set being defined. After
that, a number of polygons are defined. A polygon is defined by a fill color, an origin point, a
border color, the number of points and the X, Y, and Z coordinates of the points.
The Z coordinates are ignored, but they must be included. The format of the file as follows
(with variables in italics):
COORDSYS xmin xmax ymin ymax zmin zmax
ADD
POLY fillcolor xorigin yorigin zorigin
!yes
numberofpoints
x1 y1 z1
x2 y2 z2
...
A sample file could look as follows:
417
TIBCO Spotfire DecisionSite 9.1.1 for Lead Discovery - User's Manual
COORDSYS 0.0 1.0 0.0 1.0 0.0 1.0
ADD
POLY LimeGreen 0.0 0.0 -0.02 0.0
!yes
5
0.677419 0.976261 0.0
0.680645 0.977745 0.0
0.680645 0.983680 0.0
0.677419 0.985163 0.0
0.677419 0.988131 0.0
The env.sfm file in the Spotfire DecisionSite distribution serves as an example of this
background map format.
To map a data file to a Spotfire mapping file:
In your visualization, select the two axes from the data that serve as coordinates.
In the Data and Background tab in the Properties dialog, select an SFM file which has a
coordinate system matching the coordinates in the axes file.
10.3
10.3.1
Publish Analysis to Library
Publishing Analyses to the Library
Using the Library, you and your colleagues can collaborate on the same Analysis, keeping
everyone up to date. When publishing your Analysis, everything you save in a DecisionSite file
(SFS) is stored in the Library.
Note: The Open from Library functionality is not available if you are working offline (without
a connection to a server).
► How to publish an Analysis to the DecisionSite Library:
1.
2.
Start DecisionSite and open a data set.
Select File > Publish Analysis to Library....
Response: The first step of the wizard is displayed.
Comment: This step lets you specify where in the Library your Analysis should be
published. Navigate in the Library by using double-click on Library Sections and
folders to the location you want publish your Analysis to. Only Analyses, folders, and
Library Sections are visible in this view.
3. Enter the name of your Analysis in Analysis title as it will be displayed in the Library.
Comment: It is important that the title is informative with regards to what the Analysis
actually does. The title can be 50 characters at the most, and following characters are
not supported:
\/:*?"<>+|$&+=@#%:;,{[]}^'~'
4. Click Next >.
Response: The second step of the wizard is displayed.
Comment: This dialog lets you enter properties of the Analysis. By designating
detailed properties, the organization and search capabilities in the Library are greatly
enhanced.
5. Enter a Description of the functions of the Analysis.
6. Enter Keywords specific to the content of the Analysis.
Comment: Keywords are separated by a semicolon, i.e., if you write "primary
screening; quality" this will be two keywords, "primary screening" and "quality".
7. Use the Data content radio buttons to specify how you want to include your Analysis
data. The options are:
"Linked (Load data from the data source)" Use this option when your data resides in a data
source always accessible to all users with read access of your published Analysis.
418
Saving and Exporting Data
"Embedded (Save the current data set in the Analysis)" Use this option when your data cannot
be accessed by all users.
8. Click Finish.
Response: The Analysis is published and the confirmation dialog for the wizard is
displayed. This dialog also includes a hyperlink to the Library folder containing the
Analysis you just published, which you can click on to view the final result.
10.3.2
Publish Analysis to Library Wizard: Step 1(2)
This wizard helps you to publish your Analysis to the Library. Using the Library, you and your
colleagues can collaborate on the same Analysis, keeping everyone up to date. Everything you
save in your DecisionSite file (SFS) is stored in the Library.
This step lets you specify where in the Library your Analysis should be published. Navigate in
the Library by using double-click on Library Sections and folders.
Library tab
options
Description
New folder
Creates a new folder where you can publish your Analysis. A dialog
will prompt you for the new folder name.
Delete
Deletes a selected item permanently from the Library.
Properties
Use Properties to edit the properties of selected Library items such
as folders.
Members
Displays a list of all users with at least read access to the current
Library Section. Each Library Section has its own set of access
permissions.
Analysis title
The name of the Analysis as it will be displayed in the Library. It is
important that the title is informative with regards to what the
Analysis actually does.
Note: The title can be 50 characters at the most, and the following
characters are not supported:
419
TIBCO Spotfire DecisionSite 9.1.1 for Lead Discovery - User's Manual
\/:*?"<>+|$&=@#%;,{[]}^'~´
Next
Select the folder in which you want to publish your Analysis, and
click Next to proceed to Publish Analysis to Library: Step 2(2). You
can also select an existing Analysis if you want to overwrite it.
► To reach the Publish Analysis to Library: Step 1(2) dialog:
Click File > Publish Analysis to Library....
10.3.3
Publish Analysis to Library Wizard: Step 2(2)
This dialog lets you enter all properties of the Analysis. By using detailed properties, the
organization and search capabilities in the Library are greatly enhanced.
420
Option
Description
Analysis title
The name of the Analysis as it will be displayed in the Library. This
is the title you provided in the previous step.
Description
A description of the functions of the Analysis. The description could
contain detailed information about the Analysis enabling quick
overviews.
Keywords
Keywords specific to the content of the Analysis. Keywords are
separated by a semicolon, i.e., if you write "primary screening;
quality" this will be two keywords, "primary screening" and
"quality".
Keywords are used to enhance organization and search capabilities.
Data content
Use the Data content radio buttons to specify how you want to
include your Analysis data. The options are:
"Linked (Load data from the data source)" Use this option when your
data resides in a data source always accessible to all users with read
access of your published Analysis.
Saving and Exporting Data
"Embedded (Save the current data set in the Analysis)" Use this
option when your data cannot be accessed by all users.
The "Linked (Load data from the data source)" option might be
disabled. This happens when it is impossible to maintain a link.
Click Finish to publish your Analysis. When your Analysis is
published, the Publish Analysis to Library: Analysis Published dialog
is shown.
Finish
► To reach the Publish Analysis to Library: Step 2(2) dialog:
1.
2.
10.3.4
Click File > Publish Analysis to Library....
In the Publish Analysis to Library: Step 1(2), select Library location, enter a title, and
click Next >.
Publish Analysis to Library: Analysis Published
As soon as you have saved your Analysis in the Library, a dialog window will appear with a
confirmation that your Analysis is published. This dialog will also have a hyperlink to the
Library folder containing the Analysis you just published, which you can click on to view the
final result.
Option
Description
Link
Click on the link to open the Library folder containing your
published Analysis.
Copy Link
Copies the link to the clipboard for later use. Using the link, the
Analysis can easily be referenced in email discussions or from web
pages or portals. Using the links retrieved with Copy Link,
Analyses can be accessed from any web environment using the
URL and name supplied.
Send Email
Launches a new email with your default email client.
Close
Closes the notification dialog
If you want to send an email notification, click on the Send Email button. This opens an email
dialog where you may enter:
• To: The email address of one or more recipients, separated by comma or semicolon.
• From: Your own email address, mandatory.
• Subject: The subject of the email.
• Comment: Any additional text you wish to appear in the email.
421
TIBCO Spotfire DecisionSite 9.1.1 for Lead Discovery - User's Manual
► To reach the Publish to Library Wizard: Analysis Published
dialog:
1.
2.
3.
10.4
10.4.1
Click File > Publish Analysis to Library....
In the Publish Analysis to Library: Step 1(2), select Library location, enter a title and
click Next >.
Edit the Analysis properties in Publish Analysis to Library: Step 2(2) and click Finish.
Publish Poster to Library
Publishing Posters to the Library
Publishing a DecisionSite Poster of your Analysis enables your colleagues to participate in your
decision process from a Microsoft® Internet Explorer window.
Note: The Library functionality is not available if you are working offline (without a
connection to a server).
Note: To open this tool and publish DecisionSite Posters, a license is required. Please contact
your DecisionSite Administrator for more information.
► How to publish a Poster to the DecisionSite Library:
1.
2.
Start DecisionSite Client and open a data set.
Create the visualizations you want, and adjust the query devices to filter out data the
way you want it in your Poster.
3. Select File > Publish Poster to Library....
Comment: You need a DecisionSite Poster license to see this option.
Response: The first step of the wizard is displayed. A dialog about unsupported
features may appear. Please see below for more information.
4. Use the dialog to specify which parts of the Analysis you want to include in the Poster.
Select the Visualizations you want to include.
Comment: See Poster Visualizations for more information. The visualizations in the
Poster can be displayed either as a vertical list of large plots, or tiled smaller plots next
to each other.
5. Select whether or not you wish to Use list layout as default view mode.
Comment: If the visualizations in DecisionSite Client are tiled, the Publish Poster to
Library tool will try to emulate the layout by default. The person looking at the
published Poster can switch between Tiled and List layout.
6. Select the Query Devices you want to enable data filtering with.
Comment: See the Poster Query Devices for more information.
7. Select which type of Details-on-Demand you want to present; either Table or Web
search.
Comment: See Poster Details-on-Demand for more information.
8. When your Poster is designed, click Next >.
Response: The second step of the wizard is displayed.
9. Select the Library Section and folder you want the Poster to be published in.
10. Enter a Poster title as it will be displayed in the Library.
Comment: It is important that the title is informative with regards to what the Analysis
actually does. The title can be 50 characters at the most, and the following characters
are not supported:
\/*?"<>+|$&=@#%:;,{[]}^'~´`
11. Click Next >.
Response: The third step of the wizard is displayed.
422
Saving and Exporting Data
12.
13.
14.
15.
10.4.2
Comment: This dialog lets you enter properties of the Poster. By designating detailed
properties, the organization and search capabilities in the Library are greatly enhanced.
Enter a Description of the purpose of the Poster.
Enter Keywords specific to the content of the Poster.
Comment: Keywords are separated by a semicolon, i.e., if you write "primary
screening; quality" this will be two keywords, "primary screening" and "quality".
Use the Data content radio buttons to specify how you want to include your Poster
data. The options are:
"Linked (Load data from the Information Link)" Use this option when your data
resides in an Information Link accessible to all users with read access to your
published Poster.
"Embedded (Save the current data set in the Poster)" Use this option when your data
cannot be accessed by all users.
Click Finish.
Response: The Poster is published and the confirmation dialog for the wizard will
appear, asking if you want to send an email notification to your colleagues. This dialog
also includes a hyperlink to the Library folder containing the Poster you just published,
which you can click on to view the final result.
Publish Poster to Library Wizard: Step 1(3)
Using this wizard you can publish a DecisionSite Poster of your Analysis, enabling your
colleagues to participate in the decision process from a Microsoft® Internet Explorer window.
Use Spotfire DecisionSite Client to create the visualizations you want, and adjust the query
devices to filter out the data you want in your Poster. Launch the Publish Poster wizard by
selecting File > Publish Poster to Library....
Note: Your need a license for DecisionSite Posters to use this feature.
Use the dialog to specify which parts of the Analysis you want to include in the Poster.
Option
Description
Visualizations
Select the visualizations of your Analysis you want to include in
423
TIBCO Spotfire DecisionSite 9.1.1 for Lead Discovery - User's Manual
your Poster. See Poster Visualizations for more information.
Visualization default
layout
The visualizations in the Poster can be displayed either as a
scrollable list of large plots, or tiled smaller plots next to each other.
Select which default layout you want.
A exclamation mark icon means that some aspect of that
visualization is not supported in DecisionSite Posters. Move the
mouse cursor over the icon to display more information.
Query devices
Select the Query Devices you want to enable data filtering with. See
Poster Query Devices for more information.
Details-on-Demand
Select which type of Details-on-Demand that you want to present;
either Table or Web search. See Poster Details-on-Demand for more
information.
Next
When your Poster is designed, click Next > to proceed publishing.
For information about which features can be included in a DecisionSite Poster, see Poster
Supported Features.
► To reach the Publish Poster to Library – Step 1(3) dialog:
Click File > Publish Poster to Library....
10.4.3
Publish Poster to Library Wizard: Step 2(3)
In this step you specify where in the Library your DecisionSite Poster should be published.
Navigate in the Library by using double-click on Library Sections and folders.
424
Options
Description
New Folder
Creates a new folder where you can publish your Poster. A dialog
will prompt you about the new folder name.
Delete
Deletes a selected item permanently from the Library.
Saving and Exporting Data
Properties
Use Properties to edit the properties of selected Library items such
as folders.
Members
Lists all users who have at least read access to the current Library
Section. Each Library Section has its own set of access
permissions.
Poster title
The name of the Poster as it will be displayed in the Library. It is
important that the title is informative with regards to what the
Poster actually does.
Note: The title can be 50 characters at the most, and the following
characters are not supported:
\/:*?"<>+|$&=@#%;,{[]}^'~´`
Next
Select the folder in which you want to publish your Poster and
click Next to proceed to Publish Poster to Library – Step 3(3). You
can also select an existing Poster if you want to overwrite it.
► To reach the Publish Poster to Library – Step 2(3) dialog:
1.
2.
10.4.4
Click File > Publish Poster to Library....
Design your DecisionSite Poster in Publish Poster to Library – Step 1(3) and click
Next >.
Publish Poster to Library Wizard: Step 3(3)
This dialog lets you enter properties of the Poster. By using detailed properties, the organization
and search capabilities in the Library are greatly enhanced.
You also specify how the data should be handled here. See Poster data for more information.
Option
Description
Poster title
The name of the Poster as it will be displayed in the Library. This
is the title you provided in the previous step.
Description
A description of the functions of the Poster. The description could
425
TIBCO Spotfire DecisionSite 9.1.1 for Lead Discovery - User's Manual
contain detailed information about the Poster enabling a quick
overview.
Keywords
Keywords specific to the content of the Poster. Keywords are
separated by a semicolon, i.e., if you write "primary screening;
quality" this will be two keywords, "primary screening" and
"quality".
Keywords are used to enhance organization and search capabilities.
Data content
Use the Data content radio buttons to specify how you want to
include your Poster data. The options are:
"Linked (Load data from the Information Link)" Use this option
when your data resides in an Information Link accessible to all
users with read access to your published Poster.
"Embedded (Save the current data set in the Poster)" Use this
option when your data cannot be accessed by all users.
The "Linked (Load data from the Information Link)" option will be
disabled unless an Information Link was used to open the data. See
Poster Data for more information.
Finish
Click Finish to publish your Poster. When your Poster has been
published, Publish Poster to Library Wizard: Poster Published is
shown, in which you can send emails inviting colleagues to join
your analysis.
► To reach the Publish Poster to Library – Step 2(2) dialog:
1.
2.
3.
10.4.5
Click File > Publish Poster to Library....
Design your DecisionSite Poster in Publish Poster to Library Wizard: Step 1(3) and
click Next >.
Edit the Poster properties in Publish Poster to Library Wizard: Step 2(3) and click
Next >.
Publish Poster to Library: Poster Published
As soon as you have published your Poster in the Library, a dialog will appear asking if you
want to send an email notification to your colleagues. This dialog will also have a hyperlink to
the item you just published, which you can click on to view the final result.
426
Option
Description
Link
Click the link to open your Poster and view the result.
Copy Link
Copies the link to the clipboard for later use. Using the link, the
Poster can easily be referenced in email discussions or from web
Saving and Exporting Data
pages or portals. Using the links retrieved with Copy Link, Posters
can be accessed from any web environment using the URL and
name supplied.
Send Email
Opens a dialog from which you can send an email with a link to the
Poster.
Close
Closes the notification dialog
If you want to send an email notification, click on the Send Email button. This opens an email
dialog where you may enter:
• To: The email address of one or more recipients, separated by comma or semicolon.
• From: Your own email address, mandatory.
• Subject: The subject of the email.
• Comment: Any additional text you wish to appear in the email.
Example of Poster notification email.
► To reach the Publish Poster to Library Wizard: Poster Published
dialog:
1.
2.
3.
Click File > Publish Poster to Library....
Design your DecisionSite Poster in Publish Poster to Library Wizard: Step 1(3) and
click Next >.
In the Publish Poster to Library Wizard: Step 2(3), select Library location, enter a title,
and click Next >.
427
TIBCO Spotfire DecisionSite 9.1.1 for Lead Discovery - User's Manual
4.
10.4.6
10.4.6.1
Edit the Poster properties in Publish Poster to Library Wizard: Step 3(3) and click
Finish.
Poster Content
Poster Visualizations
You can include one or several visualizations in your Poster. The visualizations in the Poster
can be displayed either as a vertical list of large plots, or tiled smaller plots next to each other.
Select whether or not you wish to Use list layout as default view mode.
If you choose to include several visualizations and not use the list layout as default, you can
create a layout for how they should be displayed: horizontally, vertically, or a combination of
the two. The default layout will try to mimic the layout as seen in DecisionSite.
Note: Not all visualizations available in Spotfire DecisionSite can be used in a Poster. Please
see Poster Supported Features for more information.
► How to include visualizations:
1.
2.
Select a visualization from the Visualizations drop-down list.
Mark a cell in the layout section (below the drop-down list) by clicking on it.
3.
Click on the
button to add the new visualization below the marked cell, or
click on the
cell.
button to add the new visualization adjacent to the marked
► How to remove visualizations:
10.4.6.2
1.
Mark a cell in the layout section (below the drop-down list) by clicking on it.
2.
button to remove the visualization from the layout section.
Click on the
The visualization will be placed in the Visualizations drop-down list, from where you
can add it again later if you wish.
Poster Query Devices
You can include one or several query devices in your Poster. If you choose to include several
query devices, you can sort them in any order you like. It is recommended that you include only
those query devices that are needed, so as to keep the Poster simple and straightforward.
A query device that has been set to specific values in DecisionSite will keep these settings when
the Poster is opened. Note that the entire data set will still be transferred to the Poster, so no
data will be lost.
► How to include query devices:
1.
2.
3.
4.
5.
6.
Select the query device you want to add from the Query devices drop-down list.
Click on the query device in the layout section, beneath which you want the new query
device to be inserted.
Click on the Add button to include the new query device.
Repeat steps 1 to 3 for each query device you want to include.
If you want to remove a query device, select it from the list by clicking on it, and then
click on the Remove button (or press the Delete key). Tip: Press Ctrl+A to select all
query devices, or use Ctrl+Click or Shift+Click to select several query devices at
once.
If you want to change the order of the included query devices, select one by clicking
on it, and move it up or down by clicking on the
428
or
button.
Saving and Exporting Data
10.4.6.3
Poster Details-on-Demand
There are two kinds of Details-on-Demand windows that can be included in the Poster: Table or
Web Search. Select the one you want from the drop-down list.
Table
This option includes a standard Details-on-Demand window in which the information about
marked records in the visualization is displayed in a table.
Web Search
The Web Search Details-on-Demand can be configured to send a query to an external web site
to search for information about marked records. For example, you can link to a search engine
such as Google, or an MDL ISIS database in order to view molecular structures.
You can create several customized Details-on-Demand web searches, which will appear in the
drop-down list. Either you select a pre-configured one from the drop-down list, or you select
the Add new... option which lets you configure a new Web Search Details-on-Demand.
Note: The DecisionSite administrator can setup preconfigured ISIS Direct Details-on-Demand
options from the Library Administrator tool. Such options will appear in the drop-down menu
automatically for all Poster authors, and can easily be selected when publishing a new Poster.
Please see the DecisionSite Installation and Upgrade manual for information on how to do this.
A Web Search Details-on-Demand can be set to A Web Search Details-on-Demand can also be set to
show the search results directly in the Poster.
show links for the selected records, which launches a
This is useful for molecular structures among
separate browser search window when clicked.
other things.
Whether the search results should be displayed directly in the details-on-demand window of the
Poster, or displayed in a new browser window, can be switched from within the Poster. You
cannot configure this aspect from the Publish Poster... wizard.
► To create a new custom Web Search:
1.
2.
3.
Select Add new... from the drop-down list. A dialog appears.
Edit the URL to the web link.
Comment: For example, open www.google.com and make a search for "replaceme".
Then copy the entire URL "http://www.google.com/search?hl=en&ie=UTF8&oe=UTF-8&q=replaceme" and paste it into the Web Search field.
Enter a dollar sign within curly brackets {$} as a placeholder for the ID variable that
will be inserted from the Poster.
Comment: For example, replace the "replaceme" variable above with {$} so that the
URL reads "http://www.google.com/search?hl=en&ie=UTF-8&oe=UTF-8&q={$}".
429
TIBCO Spotfire DecisionSite 9.1.1 for Lead Discovery - User's Manual
4.
5.
6.
Comment: Anything you enter between the left bracket and the dollar sign will be
placed before each ID in the query. Similarly, anything placed between the dollar sign
and the right bracket will be placed after each ID in the query.
Select the ID column which contains the information you want to use as input to the
web search.
Note: If you intend to link to an ISIS database, use the column with the Compound ID.
Enter a Name for the custom Details-on-Demand you have just configured. This is the
name which will appear in the drop-down list.
Click OK.
► To configure a previously created Web Search:
1.
2.
3.
4.
10.4.6.4
Select the Web Search you want from the drop-down list.
Click on the Configure... button.
The dialog opens and you can configure the web search.
Click OK when you are done.
Poster Supported Features
Not all functionality available in Spotfire DecisionSite Client can be used in a Poster. When
you create a Poster and your Analysis contains unsupported features, a notification dialog will
be displayed with information about unsupported features.
Note: Only unsupported features used in your Analysis are shown.
Option
Description
Visualizations not included
All unsupported visualizations in your Analysis are listed
here with the details of the reason. You will not be able to
use these visualizations in your Poster.
Columns that contain
unsupported features
Each column with a formatting not supported is listed here.
The columns can be used in the Poster. However, no
formatting will be applied. Also, some binned columns
from older versions are not supported.
The table below explains which features and settings can be transferred to a Poster.
430
Saving and Exporting Data
Note: Since version 8.0, DecisionSite Client includes a new type of Bar Chart, which replaces
Bar Charts and Histograms version 7.x. Bar Charts and Histograms of version 7.x must be
converted to 8.x bar charts in DecisionSite Client before being published as a Poster.
Note: All Spotfire DecisionSite users can launch Spotfire DecisionSite Client from within a
Poster. This will provide full DecisionSite functionality.
Tip: Move the mouse pointer over the visualization template in the Create Poster dialog to
display a ToolTip text which states any unsupported properties of the visualization.
Aspect
Supported Comment
Visualizations
Note: All available coloring options are not
supported. See 2D Scatter Plot Markers below for
more information.
2D Scatter Plot
Yes
3D Scatter Plot
No
Bar Chart
Yes
Bar Chart version 7.x
No
Needs to be converted to Bar Chart 8.x in
DecisionSite Client.
Histogram version 7.x
No
Needs to be converted to Bar Chart 8.x in
DecisionSite Client.
Line Chart
No
Profile Chart
Yes
Pie Chart
Yes
Heat Map
Yes
Table
No
Heat maps using a mixture of color ranges and
categorical values, which became possible with
DecisionSite Client 9.0, are not supported by
DecisionSite Posters. Change the coloring to a
traditional continuous range prior to publishing the
Poster, if needed.
General Visualization
Properties
Labels will always appear in the Poster. Horizontal
or Vertical labels can be set, but no other label
settings will be transferred.
X and Y-axis labels
Yes
X and Y-axis grid
Yes
Visualization
Annotations
Yes
Marked Records
Yes
Data Range
Yes
Margins
No
Margins will not be transferred to the Poster, but
ToolTips are available on labels that are
abbreviated.
HTML Details-onDemand
No
You can create a custom Web Search when
publishing the Poster.
Only if the data set is embedded in the Poster.
431
TIBCO Spotfire DecisionSite 9.1.1 for Lead Discovery - User's Manual
Statistical Measures
No
Show Deselected
No
Trellis
Yes
Zoom
Yes
Query Devices
Range Sliders
Yes
Check Boxes
Yes
Radio Buttons
Yes
Item Slider
Yes
Full Text Search
Yes
Simple Search will be interpreted as Regular
Expression.
Yes
Shown as a tooltip icon in the Poster query
devices.
Column
Column Annotations
Column
Transformation
Original Scale
Yes
Log Scale
Yes
Also note that Categorical Coloring on a
transformed column is not supported. In such a
case the coloring will be changed to Fixed color.
Other Scale...
No
Will be transformed to Original Scale, and the
selection is set to All.
2D Scatter Plot
Properties
X and Y-axis Column
Yes
Background Image
Yes
Background Image
Position
Yes
Must be a BMP, PNG or JPG image.
2D Scatter Plot
Markers
432
Fixed Color
Yes
Continuous Color
Yes/No
Note: Only continuous color schemes with two
gradients, ranging from "min" to "max" are
supported by Posters. Three color gradients or
advanced coloring is not supported. See Advanced
Color below for more information.
Categorical Color
Yes
Categorical Coloring on a transformed column is
Saving and Exporting Data
not supported. In such a case the coloring will be
changed to Fixed color.
Advanced Coloring
No
The scatter plot in Posters only supports purely
categorical color schemes, or continuous color
schemes with one range (from "min" to "max"). If
there is a mixture of ranges and categorical values
in the scatter plot, or if it uses more than one color
range, or if the scatter plot uses one color range
with starting/ending points that are not "min" and
"max" respectively, then the coloring is not
supported. This will give a warning when trying to
publish the scatter plot. The scatter plot can still be
published as a Poster, but the colors will most
likely be wrong.
Shape
Yes
Squares, Circles and Triangles are supported. All
other markers will be transformed to filled squares.
Size
Yes
Size By
Yes
Drawing Order
No
Jitter
Yes
Rotate
No
Line Connection
Yes
Bar Chart Properties
X-Axis Column
Yes
Background Image
Yes
Must be a BMP, PNG or JPG image.
Bar Chart Bars
Fixed Color
Yes
Categorical Color
Yes
Show deselected
No
Width
Yes
Outline Bars
Yes
Labels
No
Stacked bars
Yes
Side-by-side bars
Yes
100% stacked bars
No
100% side-by-side bars
No
Drop empty bars
Yes
Categorical Coloring on a transformed column is
not supported. In such a case the coloring will be
changed to Fixed color.
No text labels above the bars, however, bar chart
tool tips displays the information found in
DecisionSite Client bar labels.
433
TIBCO Spotfire DecisionSite 9.1.1 for Lead Discovery - User's Manual
Binning
Yes
Sort bars
Yes
The number of bins in DecisionSite Client will be
the same in DecisionSite Posters.
Profile Chart Properties
Numeric Columns
Yes
Supported although not together with Date,
DateTime, Time.
Date, DateTime, Time
Columns
Yes
Supported although not together with Numeric.
Same Scale for All
Yes
Only supported when all columns are of the same
type of scale, that is, either Original scale or Log
scale.
String Columns
Yes
Background Image
Yes
Must be a BMP, PNG or JPG image.
Profile Chart Profiles
Fixed Color
Yes
Continuous Color
Yes
Categorical Color
Yes
Individual Scale
Yes
Same Scale
Yes
Labels
No
Line Width
No
Line Width By
No
Break on Empty
Yes
Categorical Coloring on a transformed column is
not supported. In such a case the coloring will be
changed to Fixed color.
Pie Chart Properties
X-Axis Column
Yes
Y-Axis Column
Yes
Background Image
Yes
Pie Chart Pies
434
Fixed Color
Yes
Categorical Color
Yes
Show deselected
No
Average Color
Yes
Number of Color Bands
No
Size
Yes
Not on String Columns
Saving and Exporting Data
Fixed Size
Yes
Size by Records Count
Yes
Size by Average
Yes
Only for Numeric columns.
Size by Sum
Yes
Only for Numeric columns.
Labels
No
DecisionSite Posters uses ToolTips to display this
information instead.
Jitter
No
Heat Map Properties
Column colors
Yes
Color range
Yes
Advanced colors
No
Show deselected
Yes
Row labels
Yes
Dendrogram
Yes
If the heat map uses a mixture of continuous color
ranges and categorical values it cannot be
published by the Poster Designer.
Differences between DecisionSite Client and DecisionSite Posters:
Bar Charts:
• In DecisionSite Client labels are used to display information about bars. In
DecisionSite Posters this information is displayed using ToolTips when hovering over
a bar.
Pie Charts:
• In DecisionSite Client labels are used to display information about sectors. In
DecisionSite Posters this information is displayed using ToolTips when hovering over
a sector.
• In DecisionSite Client, marking is displayed as a continuous line around the edge of a
pie. In DecisionSite Posters, marking is indicated as separate lines beside each sector
that has records included in the marking.
Heat Maps:
• Cluster node similarity ToolTip is not supported.
• The dendrogram menu is not supported.
• Cannot zoom in column dendrogram.
Number Formatting:
• Combining scientific notation and parentheses negative format will force negative
format to default.
• Combining the parentheses negative format and default number of decimals will force
two decimals. To avoid this, set the number of decimals explicitly in DecisionSite
Client.
• Combining the thousands separator and default number of decimals will force two
decimals. To avoid this, set the number of decimals explicitly in DecisionSite Client.
Shared Ranges:
• Some plots that use Shared Ranges look different in Posters compared to DecisionSite
Client. In DecisionSite Client 9.0 and forward, shared ranges are only shared between
435
TIBCO Spotfire DecisionSite 9.1.1 for Lead Discovery - User's Manual
•
10.4.6.5
columns of compatible types. In Posters, as well as in earlier versions of DecisionSite
Client, shared ranges could be applied to a mixture of column types.
Compatible types are:
A) Numeric columns: integer, real
B) String columns
C) Date columns: date, timestamp
D) Time columns
In other words, if two incompatible columns use the same color scheme, their color
ranges will be calculated individually in DecisionSite Client 9.0, but DecisionSite
Posters will still use shared ranges.
Poster Data
You can choose from two kinds of data links. One choice is to embed the data into the Poster.
That way, the data is stored within the Poster, and will not be altered if you later change the
original data set.
The other alternative is only available if you have imported data into Spotfire DecisionSite by
use of Information Links. If created in this way, you can choose to save the Poster with an
active data link to the original data so that the Poster will always be based on the latest data, and
will be (automatically) updated every time a user opens the Poster. If the range of the data
should become larger after the publishing date, the entire data set will still be opened in the
Poster regardless of the initial query device settings, etc.
Note: It is not possible to use the linked data option if you have added a column (binned, add
columns, calculation, etc.) to a data set imported via Information Links. Also, information about
which records are currently marked cannot be stored in a Poster with linked data, this is only
possible using embedded data.
10.4.6.6
Poster Background Images
Scatter Plots, Bar Charts, Profile Charts and Pie Charts can display a background image behind
the markers, which can be useful when working with geographical maps, etc.
BMP, PNG and JPG images that are used as background images in DecisionSite Client can be
published in a Poster; other formats are invalid. Position properties set in DecisionSite Client
are carried over to the Poster to align the image properly.
Background Images are particularly useful when running Spotfire Map Interaction Services.
This product gives users an easy way of linking data that includes both longitudinal and
436
Saving and Exporting Data
latitudinal information to geographic images and data. It also provides a means to dynamically
interact with geographic data within Spotfire DecisionSite.
10.5
10.5.1
Microsoft PowerPoint Presentation
Exporting Visualizations to PowerPoint
The Microsoft® PowerPoint® Presentation tool exports the selected visualizations to
PowerPoint®. Each visualization is added as a new slide along with the annotation, legend and
title.
Tip: Also note, other Export options can be found under the File menu.
► To export visualizations to PowerPoint®:
1.
2.
3.
Create visualizations in Spotfire DecisionSite.
If necessary, edit the titles and annotations of the visualizations.
Select File > Export > Microsoft® PowerPoint® Presentation....
Response: The Microsoft® PowerPoint® Presentation dialog is displayed.
4. Click to select the visualizations you want to export.
Comment: To select all visualizations click Select All. For multiple selection, press
Ctrl and click on the desired visualizations or click one visualization and drag to select
the subsequent ones.
5. Select if you want to Create a new presentation or Add to an open presentation.
6. If desired, select a different type of Picture format.
Comment: The visualization can be exported in a EMF, JPG or PNG format.
7. If desired, change the Font size of the exported labels.
8. Click OK.
Response: If Create a new presentation is chosen, PowerPoint® is started and the
selected visualizations are shown in a new presentation. If Add to an open presentation
is chosen, the selected visualizations are appended to the end of an open presentation.
Note: Microsoft® PowerPoint® must be installed on the machine for this tool to be used.
437
TIBCO Spotfire DecisionSite 9.1.1 for Lead Discovery - User's Manual
10.5.2
Microsoft PowerPoint Presentation Dialog
Option
Description
Select
visualizations
The list box shows the titles of all visualizations available for
PowerPoint® export. Click a visualization name to include the
visualization in the PowerPoint® presentation. For multiple selection,
press Ctrl and click the desired visualizations.
Select All
Click this button to select all available visualizations.
Create a new
presentation
This exports the Spotfire DecisionSite visualizations to a new
PowerPoint® presentation.
Add to an open
presentation
This appends pictures of the selected visualizations as new slides at the
end of an open presentation. If several presentations are open, select one
from the drop-down list box.
Picture format
Select a visualization output format from the drop-down list. Choose
from PNG, JPG, or EMF formats.
Font size
Select whether to use a Small, Normal, Large or Extra Large font size
when exporting to PowerPoint®. The selection made here affects all
labels in the visualization, including the axis labels and the legend.
The image in the dialog shows what the PowerPoint® presentation might look like.
► To reach the Microsoft® PowerPoint® Presentation dialog:
Select File > Export > Microsoft® PowerPoint® Presentation....
438
Saving and Exporting Data
10.6
10.6.1
Microsoft Word Presentation
Exporting Visualizations to Word
The Microsoft® Word Presentation tool exports the selected visualizations to Microsoft®
Word. Each visualization is added to a new page in a Word document, along with the
annotation, legend and title.
Tip: Also note, other Export options can be found under the File menu.
► To export visualizations to Word:
9. Create visualizations in Spotfire DecisionSite.
10. If necessary, edit the titles and annotations of the visualizations.
11. Select File > Export > Microsoft® Word Presentation....
Response: The Microsoft® Word Presentation dialog is displayed.
12. Click to select the visualizations you want to export.
Comment: To select all visualizations click Select All. For multiple selection, press
Ctrl and click on the desired visualizations or click one visualization and drag to select
the following.
13. If desired, select a different type of Picture format.
Comment: The visualization can be exported in a EMF, JPG or PNG format.
14. If desired, change the Font size of the exported labels.
15. Click OK.
Response: Word is started and a new document including the selected visualizations is
displayed.
Note: Microsoft® Word must be installed on the machine for this tool to be used.
10.6.2
Microsoft Word Presentation Dialog
439
TIBCO Spotfire DecisionSite 9.1.1 for Lead Discovery - User's Manual
Option
Description
Select
visualizations
The list box shows the titles of all visualizations available for Word
export. Click a visualization name to include the visualization in the
Word report. For multiple selection, press Ctrl and click the desired
visualizations.
Select All
Click this button to select all available visualizations.
Picture format
Select a visualization output format from the drop-down list. Choose
from PNG, JPG, or EMF formats.
Font size
Select whether to use a Small, Normal, Large or Extra Large font size
when exporting to Word. The selection made here affects all labels in
the visualization, including the axis labels and the legend.
The image in the dialog shows what the Word report might look like.
► To reach the Microsoft® Word Presentation dialog:
Select File > Export > Microsoft® Word Presentation....
10.7
10.7.1
Export as Web Page
Exporting Visualizations as a Web Page
The Export as Web Page tool exports the current visualizations as an HTML file and a set of
images. You can also include the legend, annotations, the SQL query involved and information
on the currently marked records.
Tip: Also note, other Export options can be found under the File menu.
► To export visualizations as a web page:
1.
2.
3.
4.
5.
6.
7.
440
Create the desired visualizations and set the query devices. If you want to mark any
records, do so now.
If you use multiple visualizations, then organize these so that they are all visible and of
the right proportions.
Comment: The visualizations will be included in the report just the way you see them
in the visualization area. If the visualizations are tiled, then they will appear tiled in the
report. Use Window > Auto Tile to automatically organize your visualizations.
Select File > Export > Web Page....
Response: The Export as Web Page dialog is displayed.
Enter a report header. This text will appear at the top of the report.
Check the options you wish to include in the report.
Select a graphic file format for the exported images.
Click Save As...
Response: You will be prompted to select a file name and folder for the report. The
report is now saved as an HTML file in the directory you specified. A subdirectory
with the same name as the HTML file is created in which all the pictures are stored. To
send the report to someone, you need to copy both the HTML file and its
corresponding subdirectory. If you selected to View report after saving option, your
report will be displayed in a browser.
Saving and Exporting Data
10.7.2
Export as Web Page Dialog
Option
Description
Report header
This text will appear at the top of the report.
Legend
Select this box to include the legend in the report.
Annotations
Select this box to include visualization annotations in the report. Note
that column annotations are not included.
SQL Query
Select this box to include the SQL query (corresponding to the current
query device settings) in the report.
Table of marked
record(s)
Select this box to include a table with the currently marked records.
Output format
Select a graphics file format for the images included in the report.
View report after
saving
Select this box if you want to launch the report in your default browser
after it has been saved.
Save As...
Click here when you have made the desired settings. You will be asked
to specify a name and folder for the generated HTML file.
► To reach the Export as Web Page dialog:
Select File > Export > Web Page....
441
TIBCO Spotfire DecisionSite 9.1.1 for Lead Discovery - User's Manual
10.8
10.8.1
Export SDFile
SDFile Export Dialog
This dialog is used to export the current data set as an SDFile. In contrast to the SDFile Export
tool that can be reached from the Structure Viewer, you cannot select any columns that exist in
the structure connection unless they are also available in the data set.
Option
Description
Molfile structure
column
Displays the available structure columns. Select the one you wish to
export. If no structure column is available in the actual data set (for
example, if you have set up a structure connection to an ISIS database
and this has been shown with Structures in Table) you will not be able to
export the structures using this tool. Use the Export SDFile functionality
from the Structure Viewer instead.
Select this check box to make sure that the column names of the created
Force DB
compliant column SDFile are database compliant.
names
442
Records to export
Select whether to export data for All, Marked or Selected records only.
Available data set
columns
Displays the available columns in the current data set in Spotfire
DecisionSite.
[Enter text here]
Type any text to search for a specific column in the list.
Columns to
include in SDFile
Displays the columns that you have selected to export as an SDFile.
[Enter text here]
Type any text to search for a specific column in the list.
Add >
Adds the selected columns to the list of Columns to Include in SDFile.
Saving and Exporting Data
< Remove
Moves selected columns from the list of Columns to Include in SDFile
back to the list of Available data set columns.
Move Up
Moves the selected rows in the Columns to include in SDFile list up one
step. The order of the columns in this list determines the order of the
columns in the resulting SDFile.
Move Down
Moves the selected rows in the Columns to include in SDFile list down
one step.
► To reach the Export SDFile dialog:
Select File > Export > SDFile....
10.9
Exporting Details-on-Demand
Spotfire DecisionSite provides the possibility to export the information about the active or the
marked markers. If the Details-on-Demand (HTML) option is selected under the View menu,
the File > Export > Details-on-Demand option is available. Selecting it will launch an external
browser, Netscape or Internet Explorer, in which the details of the records will be presented.
Tip: Also note, other Export options can be found under the File menu.
10.10 Export Current Visualization
► To save an image of the current visualization to a file:
1.
Select File > Export > Current Visualization.
2.
3.
Enter the title to be included at the top of the image.
Enter the size of the exported image. If you check Preserve aspect ratio, the heightwidth ratio of the exported image will be the same as that of the visualization on
screen.
4. Click OK.
5. Select a location, name and format for the file. The formats available are Windows
BMP, JPEG and PNG.
Tip: The current visualization can be copied to the Windows Clipboard as a vector graphic
(Windows Metafile) to be pasted into another application. This is accomplished through the
Copy Special > Visualization option under the Edit menu. In the Metafile format each block
of text, marker, line, etc. is an independent object that can be manipulated.
443
TIBCO Spotfire DecisionSite 9.1.1 for Lead Discovery - User's Manual
10.11 Export Database Queries
The current query device settings can be exported as a SQL database query. This is done by
selecting the Export > SQL Query... option from the File menu. When you do this, a dialog
containing the query appears. The query can be edited at this stage by clicking in the edit box
and entering or erasing text. By clicking Save As... the query can be saved to the file system.
Tip: Also note, other Export options can be found under the File menu.
10.12 Export Legend Image
This option will place an image of the legend describing the columns that are used for size,
color, rotation, etc. on the Windows Clipboard.
To make this option available you must first display the Legend in Spotfire DecisionSite. There
are three ways to do this:
• Select Legend command from the View menu
• Use the keyboard shortcut [Ctrl + L]
•
444
Click the
button on the toolbar
Saving and Exporting Data
The legend in Spotfire DecisionSite (above) and the bitmap exported (below)
When you select the File > Export > Legend option, a Save As... dialog opens and you can
browse to where you want to save the legend image; you are able to choose BMP or JPG
format.
10.13 Export Data
All the data loaded into memory and used by Spotfire DecisionSite can be exported using this
option. Records that have been removed by deleting marked markers will of course not be
among the exported data. All other records—even those not currently portrayed in
visualizations or those deselected by query devices—will be exported. The format of the data is
as comma separated values (.csv).
When you select the File > Export > Data option, a Save As... dialog opens and you can
browse to the location where you want to save the file, and save it under any viable name you
wish. Available formats are TXT (tab separated columns), CSV (default list separator), SKV
(semicolon), Spotfire Text Data Format and two versions of Microsoft ADO Persisted Record
set (XML and ADTG binary format).
To export as Persisted Record set you need MDAC 2.5 or later installed on your computer. You
can also open Persisted Record sets in DecisionSite Client via File > Open... and selecting All
Files (*.*).
Note: Data are per default exported exactly the way they are currently displayed. This means
that the export of a formatted Date, Time or DateTime column may result in data loss. For
example, if a Date column is formatted to be displayed as "Day of week, Monday first (day
name)", the exported data will not contain the information about year and month which was
originally in the data, but only the string showing day of week. Optionally, you can turn off this
setting and always export the original data from the Advanced tab of the Tools > Options
dialog.
445
TIBCO Spotfire DecisionSite 9.1.1 for Lead Discovery - User's Manual
Tip: You can export data directly from the Table visualization by right-clicking and selecting
Export Data....
Also note, other Export options can be found under the File menu.
10.14 Printing
► To print the document with the current Print Layout settings:
6. Select File > Print...
7. Select a printer from the drop-down list.
8. Optionally, click Properties and adjust your printer settings.
9. Click OK.
Use the Print Preview option on the File menu to see how your printout will appear with the
current Print Layout settings.
Print Layout
Spotfire DecisionSite printouts may contain any of the information available in the
visualizations.
To control which information to include select Print Layout Options... from the File menu.
446
Option
Explanation
Header
The printed document will have a header stating
Date, File name, Time.
Include title
Select this check box to include a title, and enter a
title in the text field.
Include visualization
Deselect this check box if you do not want to print
the visualization.
Keep aspect ratio
Select this option if you want to keep the aspect ratio
of the visualization when printed on paper.
Auto fit to page
Select this option if you want the printed
visualization to automatically resize to cover as
much of the page as possible.
Footer
The printed document will have a footer stating the
text you enter in this field.
Include query
Selecting this option provides information on the
filtering you have done using the query devices.
Include Details-on-Demand
Selecting this option includes the Details-on-demand
information in the printed document.
Include legend
Selecting this option includes the legend in the
printed document.
Force single page layout
Selecting this option causes as much information as
possible to fit onto one page, and only prints that.
Frame around areas
Selecting this option displays frames around the
various includes sections.
Annotation
This tab provides an option to include the
visualization annotation.
Quick Reference
11
11.1
11.1.1
Quick Reference
Menus
File Menu
Option
Hotkey
Description
Open
Ctrl+O
Opens an existing document. A browse dialog
opens where you can search for files in various
formats to open in Spotfire DecisionSite.
You can also enter a URL in the File name field,
and access data from a web server.
Applies settings from an SFT or SFS file. HTML
templates for presenting Details-on-Demand will
be imported from the external SFS file.
Apply Template...
Save
Ctrl+S
Saves the active document. If the document has
never been saved before, this will open the same
dialog as Save As...
Save As...
F12
Saves the document with another name, in another
format, or in another location.
Close
Closes the active document. You will be prompted
for saving changes.
Open from Library...
Opens an item from the DecisionSite Library. A
Library dialog opens where you can browse the
Library for an Analysis, Guide, or Poster you
want to open. See Open From Library for more
information.
Publish Analysis to
Library...
Publishes the current Analysis to the Library. A
dialog opens in which you specify details on how
to publish. See Publishing Analyses to Library for
more information.
Publish Poster to
Library...
Publishes a DecisionSite Poster to the Library. A
dialog opens that allows you to design your
Poster. See Publishing Posters to Library for more
information.
Import >
> Import Data...
> Open Information Link
Ctrl+D
This allows you to import data in any supported
format (ODBC, text files, clipboard, etc), and to
apply data conditioning. See Importing Data for
more information.
Launches the Information Library where you can
open information links and retrieve the data. To
access the online help for this application, you
must first start the application by selecting it from
the menu.
Export >
447
TIBCO Spotfire DecisionSite 9.1.1 for Lead Discovery - User's Manual
> Details-on-Demand
HTML
Exports information about marked or active
objects as text.
> Current Visualization...
Exports the current visualization. An image of the
currently active visualization is exported as a JPG
or BMP image file. A Save As dialog is opened
and you can navigate to where you want to save
your image.
> SQL Query...
Exports the settings of the query devices as an
SQL query.
> Legend...
Exports the legend. An image of the legend, the
description of which columns are used for size,
color, etc. is exported as a JPG or BMP image file.
A Save As dialog is opened and you can navigate
to where you want to save your image.
> Data...
Exports data as Tab Separated Values. A Save
As... dialog opens and you can save all the records
in the data set as tab separated text.
> Microsoft®
PowerPoint®
Presentation...
Exports the selected visualizations to
PowerPoint®. See Exporting Visualizations to
PowerPoint.
> Microsoft® Word
Presentation...
Exports the selected visualizations to Microsoft®
Word. See Exporting Visualizations to Word.
> Web Page...
Exports the visualization as a Web Page.
Print Layout Options...
Changes the report layout.
Print Preview
Displays full pages. Shows a preview of the
visualization as it will be printed with the settings
that will apply.
Print...
Switch DecisionSite >
Ctrl+P
Prints the active visualization. A Print dialog is
opened where you can choose printer and printer
settings.
Switch to another DecisionSite.
Login to DecisionSite >
448
> Log Out
Log out of the current DecisionSite Analytics
Server.
> Log into Server...
Log into a DecisionSite Analytics Server.
> Change Password...
Change your current password to a new one.
> Unlock New License...
Opens the Add Software tool, where Spotfire
Administrators can enter a product key to unlock
more features to Spotfire DecisionSite.
# Most recent files
The four most recently opened documents can be
opened from the list.
Exit
Quit the application. You are prompted to save
open documents.
Quick Reference
11.1.2
Edit Menu
Option
Hotkey
Description
Copy
Ctrl+C
Copies the records corresponding to the
markers, bars and pies marked with the lasso or
rectangle marking tool to the Windows
clipboard in text format. It also copies an image
of the visualization to the clipboard, which can
be pasted into other applications by using a
Paste Special option.
Copy Special >
> Marked Records
Copies the set of marked records to the
Clipboard. Data in all the records that have been
marked is copied to the Clipboard in text format.
> Selected Records
Copies the selected records to the Clipboard.
Data in the records that fulfill all query device
constraints is copied to the Clipboard in text
format.
> All Records
Copies all records to the Clipboard.
> Visualization
Copies the current visualization to the
Clipboard. An image in vector graphics format
of the active visualization is copied to the
Clipboard. This image can be pasted into
another application as a Windows Metafile.
Paste
Ctrl+V
Inserts Clipboard contents. The contents of the
clipboard are pasted into a new Spotfire
DecisionSite visualization. The Clipboard
should contain data as text in one of the formats
recognized by Spotfire DecisionSite.
Reset to All
Ctrl+R
Resets all query devices and zoom bars to show
all records. Color, size, marking and other
properties are unaffected.
Mark Selected
Ctrl+A
Marks all visible (selected) records. Records not
selected by the current query device settings are
not marked.
> Unmark
Ctrl+E
Resets the set of marked records. Unmarks all
marked records.
> Invert
Ctrl+I
Inverts the set of marked records. Marks all
unmarked records and unmarks the set of
marked records.
> Select
Ctrl+M
Sets the selection to the marked records. Creates
a temporary filter so that only the marked
records are visible.
> Undo Select
Ctrl+Shift+M
Undoes all record selections without resetting
the query devices.
> Delete
Del
Deletes the set of marked records. The marked
records are removed from the data set in
Marked Record(s)
449
TIBCO Spotfire DecisionSite 9.1.1 for Lead Discovery - User's Manual
Spotfire DecisionSite's memory. This operation
cannot be undone but does not affect the
original data unless that file is intentionally
overwritten with the diminished data.
Properties
11.1.3
Ctrl+Enter OR
Alt+Enter
Set document properties. The Properties dialog
opens in which parameters governing the
appearance of the visualization can be set,
annotations made, etc.
View Menu
Checkmarks in front of the options indicate that they are active; selection toggles this status.
Option
Show or hide the toolbar.
Status Bar
Show or hide the status bar.
Workbook
Show visualizations with tabs.
F11
Full screen mode, on/off.
Details-on-Demand
(Text)
Show or hide text Details-on-Demand.
Details-on-Demand
(HTML)
Show or hide HTML Details-on-Demand.
Details-on-Demand
(External Browser)
Launches an external browser displaying the
Details-on-Demand.
Query Devices
Show or hide the query devices.
Legend
450
Description
Toolbars...
Full Screen
11.1.4
Hotkey
Ctrl+L
Show or hide the Legend.
Guides Toolbar
Show or hide the Guides toolbar.
Guides
Show or hide the Guides pane.
Getting Started
Show or hide the Getting Started welcome screen.
Visualization Menu
Option
Hotkey
Description
New Scatter Plot
Ctrl+1
Creates a new scatter plot visualization. A twodimensional visualization is created. See Scatter
Plots.
New 3D Scatter Plot
Ctrl+2
Creates a new scatter plot visualization. A threedimensional visualization is created. See Scatter
Plots.
New Bar Chart
Ctrl+4
Creates a new bar chart visualization. See Bar
Charts.
New Pie Chart
Ctrl+5
Creates a new pie chart visualization. See Pie
Charts.
New Line Chart
Ctrl+6
Creates a new bar chart visualization. See Line
Charts.
New Profile Chart
Ctrl+7
Creates a new bar chart visualization. Profile
Quick Reference
Charts.
New Heat Map
Ctrl+8
Creates a new heat map visualization. See Heat
Maps.
New Table
Ctrl+9
Creates a new table visualization. See Tables.
Invokes the View Tip Dialog. Thumbnail views of
visualizations are presented and can be quickly
analyzed.
View Tip...
Duplicate Visualization
11.1.5
Ctrl+U
Creates a duplicate of the selected visualization.
Data Menu
Option
Description
Add Columns...
Allows you to incorporate new columns into your current
data set. See Add Columns Overview.
New Column >
> By Binning...
Allows you to sort your data into different groups or bins
using different methods. See the Different Binning
Methods.
> From Marked Records...
Creates a new column from the currently marked records.
See New Column from Marked Records.
> From Expression...
Allows you to add a new column calculated from other
columns in your data set. See Workflow of the New
Column from Expression Tool.
Normalization...
Allows you to normalize your data in various ways and to
do fold change calculations. See Normalization Overview.
Column Normalization...
Allows you to standardize the values in selected columns
using a number of different normalization methods. See
Column Normalization Overview.
Row Summarization...
Allows you to combine values from multiple samples into
a single column. See Performing a Row Summarization.
Pivot Data...
Allows you to rotate and aggregate your data in order to
use it in a better way. See Pivoting the Data Set.
Depivot Data...
Allows you to transform your data to a tall and skinny
format. See Depivoting the Data Set.
Transpose Data...
Rotates your data set so that columns become records and
vice versa. See Transpose Data Overview.
Clustering >
> Hierarchical Clustering...
Arranges records in a dendrogram (a tree graph) based on
the similarity between them. See Hierarchical Clustering
Method Overview.
> Hierarchical Clustering on
Keys...
Groups compounds with similar sets of substructures. See
Hierarchical Clustering on Keys.
> Self-Organizing Maps...
Groups records using an algorithm based on neural
networks. See Self-Organizing Maps Overview.
> K-means Clustering...
A non-hierarchical clustering, which groups records into a
451
TIBCO Spotfire DecisionSite 9.1.1 for Lead Discovery - User's Manual
defined number of clusters based on their similarity. See
K-means Clustering Overview.
> Principal Component
Analysis...
Reduces the dimensionality of a data set without
significant loss of information. See Understanding PCA.
Pattern Detection >
11.1.6
> Treatment Comparison...
Provides methods for distinguishing between different
treatments for an individual record. See Treatment
Comparison Overview.
> Profile Search...
Calculates the similarity to a selected profile for all
records in the data set and adds the result as a new
column. See Profile Search Overview.
> Coincidence Testing...
Compares two columns and investigates whether or not
the seeming similarity between the two distributions is a
coincidence. See Coincidence Testing Overview.
Tools Menu
Option
Description
Structure Analytics >
452
> Structure Viewer
Launches the Structure Viewer tool which allows you to
examine chemical structures from an ISIS database and
manage lists of compound identifiers generated by this tool.
See Structure Viewer Overview.
> Structures in Table
Launches the Structures in Table tool which allows you to
incorporate structure images from an ISIS database into a
table visualization. See Displaying Structures in a Table
Visualization.
> Structure Search...
Launches the Structure Search tool which provides several
search algorithms which retrieve molecules with similarities
to the master structure. See Searching for Compounds Using
Structure Search.
> R-group Search
Launches the R-group Search tool which helps you to
perform searches for molecules with specified or unspecified
R-groups. Note: You need to have ISIS/Draw installed on
your computer to reach this tool. See Performing an R-group
Search.
> List Search...
Launches the List Search tool which allows you to search for
structures using a list or compound identifiers. See Using
List Search.
> Add Structure Keys...
Launches the Add ISIS Keys tool which allows you to
import keys from an ISIS database; this information is added
to the data set as a new column. See Adding Structure Keys.
> Structure Connection...
Launches the ISIS Connection tool where you can connect
to a local or remote Integrated Scientific Information System
(ISIS) database. See ISIS Connection Overview.
> Advanced Preferences
Launches a dialog where you can view and edit rules
regarding which structure editor and renderer you prefer to
use in your structure analytics tools. See Advanced
Quick Reference
Preferences.
Portfolio
Launches the Portfolio tool where you can arrange records
into lists. See Portfolio Overview.
List Logic...
Launches the List Logic tool where you can compare lists
using Boolean operators. See Comparing Lists Using List
Logic.
Web Links...
Enables you to send a query to an external web site to search
for information about marked records. See Web Links
Overview.
Compound Details >
> IDdb3 Drug Search...
Allows you to search the Investigational Drugs database
(IDdb3) using the active record in Spotfire DecisionSite or
an entered drug name as search criterion. See Searching the
IDdb3 Database.
Computation Services
Allows you to connect to a calculation server and add any
type of statistical or mathematical calculations to your
analysis. This can be a server running R, SAS, S-PLUS or
custom servers.
Distance Calculator
Calculates the distance between two markers in a scatter
plot.
Decision Tree...
Explaining the behavior of one column as a function of other
columns in a data set. See Decision Tree Overview.
Statistics >
> Box Plot
Helps to visualize key statistical measures, such as median,
mean and quartiles. See Box Plot Overview.
> Summary Table
Displays statistical information numerically. See Summary
Table Overview.
> Normal Probability Plot...
Helps you to investigate to what extent a data set exhibits
normal distribution. See Normal Probability Plot Overview.
> Profile Anova...
Provides a method for locating records where there is a
significant difference between one group of columns and
another group. See Profile Anova Overview.
> Column Relationships...
Helps you to investigate the relationships between different
column pairs. See Column Relationships Overview.
Create Information Link
Launches the Information Builder tool where you can create
and open information links. This tool has its own help file.
To see Information Builder help, start the tool and select
Help.
Information Designer
Launches the Information Designer tool where you can set
up database connections. This tool has its own help file. To
see Information Designer help, start the tool and select Help.
Administration >
> DecisionSite Administrator
Only available for users with Administrator privileges.
Launches the DecisionSite Administrator tool where you can
manage DecisionSite users and groups. You can organize
users into groups, define profiles for the individual user and
453
TIBCO Spotfire DecisionSite 9.1.1 for Lead Discovery - User's Manual
group, and assign licenses to groups and users. To see
DecisionSite Administrator help, start the tool and select
Help.
11.1.7
> DecisionSite Library
Only available for users with Administrator privileges.
Starts DecisionSite Library which provides easy-to-access
publishing of Analyses, Guides, and Posters. See What is
DecisionSite Library.
> DecisionSite Library
Administrator
Only available for users with Administrator privileges.
Edit who is allowed to create new Library Sections,
configure DecisionSite Library and Poster settings.
> Server Usage
Only available for users with Administrator privileges.
Opens the log file dssaccess.sfs in DecisionSite, for an easy
analysis and overview. This file contains information about
all logins and logouts from all DecisionSite Clients to the
DecisionSite Analytics Server.
It shows which user logged in/out and when. The log is
always enabled, and it is unaffected by Log Configuration
File settings.
Customize...
Customize menu and toolbars. A dialog box opens with four
tabs on which you can choose appearances and customize
toolbars, commands and menus.
Options...
The Options dialog lets you specify visualization settings
such as fonts, axis labels, default file location and much
more. Here you can also choose to save personal settings.
Select Language...
The Select Language dialog lets you change the language of
the main menus and the online help, if you have access to
any language pack.
Note: The dialog texts and any submenus will still be
displayed in English.
Guides Menu
Option
Description
Data Analysis >
454
> Pivot results
Starts the Guide Pivot results in the Guides pane.
> Review HTS data
Starts the Guide Review HTS data in the Guides pane.
> Key-based clustering
Starts the Guide Key-based clustering in the Guides
pane.
> Rule of 5
Starts the Guide Rule of 5 in the Guides pane.
> Create SAR Table using
Information Link
Starts the Guide Create SAR Table using Information
Link in the Guides pane.
> Structure similarity scores
Starts the Guide Structure similarity scores in the
Guides pane.
Quick Reference
> Explore categories
Starts the Guide Explore categories in the Guides pane.
> Venn logic
Starts the Guide Venn logic in the Guides pane.
> Group data using hierarchical Starts the Guide Group data using hierarchical
clustering in the Guides pane.
clustering
Tutorials >
11.1.8
> Explore a film database
Starts the Tutorial Explore a film database in the Guides
pane.
> Find interesting stocks
Starts the Tutorial Find interesting stocks in the Guides
pane.
Run from File...
Launches an Open dialog where you can Browse to the
Guide file that you want to run. See Running Guides
Locally.
Run from Library...
Opens an item from the DecisionSite Library. A Library
browser opens where you can browse the Library for an
Analysis, Guide, or Poster you want to open. See Open
From Library.
Create and Edit Guide
Opens the Analysis Builder tool where you can create and
edit Guides. See Analysis Builder overview.
Publish to Library...
Publishes the current Analysis to the Library. A dialog
opens in which you specify detail on how to publish. See
Publish Analysis to Library.
Window Menu
Option
Hotkey
Description
Close
Ctrl+F4
Closes the active visualization.
Close All
Closes all visualizations.
Auto Hide Axis Selectors
Hides axis selectors. When hidden this gives
greater room for the visualizations.
Hide Window Frame
Hides window frame. With multiple
visualizations displayed, greater room is
available for the visualizations when frame and
title bar are hidden.
Auto Tile
Auto tiles the visualizations. Arranges all the
open visualizations to fill the visualization
window.
Cascade
Arranges windows so they overlap. Each
window is staggered so that all title bars are
accessible.
Tile Horizontal
Arranges visualizations as non overlapping
horizontal tiles.
Tile Vertical
Arranges visualizations as non overlapping
vertical tiles.
455
TIBCO Spotfire DecisionSite 9.1.1 for Lead Discovery - User's Manual
Pressing the key representing the number in
front of the visualization title, activates that
visualization.
(#) Visualizations
11.1.9
Help Menu
Help menu
11.2
Option
Hotkey
Description
Help Topics
F1
Launches the online Help, where you can search
for specific topics or subjects.
PDF Manuals
Opens a web page where you can download
printable manuals in PDF format.
What's New
Lists all the new features and latest information
for Spotfire DecisionSite.
Ask Spotfire Support
Opens the Support web page with information
on how to contact Spotfire support.
Support Diagnostics...
Use this tool to verify that everything that is
needed to run DecisionSite has been installed,
and has the correct version. For example,
Internet Explorer version, Operating System
version, correct DLLs, etc.
Structure Analytics
Diagnostics...
Launches the Structure Analytics Diagnostics
tool. If you should run in to any problems with
the configuration and set up of your Structure
Analytics tools, you can retrieve information
about what went wrong here.
About Spotfire DecisionSite
Displays program information, version number
and copyright. License information is also
found here.
Query Device Pop-Up Menu
Right-clicking in the query device window brings up a pop-up menu to let you modify query
devices, generate new columns, change the kind of query device used, alter scale
transformations, etc.
456
Option
Description
Check Boxes
If the column contains less than 500 unique values you can choose
to have check boxes as query device. Values deselected by other
query device constraints have red labels.
Radio Buttons
If the column contains less than 500 unique values you can choose
to have radio buttons as query device. Only one of the values may
be selected at a time.
Range Slider
Range sliders can be used to select numeric data.
Item Slider
Item sliders can be used to select alphanumeric data.
full-text search
Full-Text Search can search a string for any combination of
characters using Boolean logic.
Quick Reference
None
Select none of the records with values in this column.
All
Select all records with values in this column.
Data Range
Select all records with values in this column.
From Selected
Changes the data range to span only the selected records. Three
small dots are displayed at the end of the slider to indicate that the
current data range is not the full range.
Reset
Resets the data range to its original full width.
Show Empty Values
Display records even though values are empty (null).
Show Full Name
The query device is given another row with the entire name of the
column.
Sort
Sorts the order of the Query Devices.
Original
Resets the original order.
by Annotation
Sorts alphabetically by Annotation.
by Name
Sorts alphabetically by Name.
by Type
Sorts by type of Query Device.
Move
Moves the query device.
To the Top
Moves the query device to the top of the window.
Up
Moves the query device up one position in the window.
Down
Moves the query device down one position in the window.
To the Bottom
Moves the query device to the bottom of the window.
Hide
Makes the query device invisible. Selecting the Show Query Device
option on the Columns tab of the Properties dialog box makes the
device visible again.
New Column
By Binning
Create a new column by binning, a dialog box allows you to choose
column to be binned and then a wizard Guides you through the
binning process.
From
Expression
Create a new column from mathematically operations on data, a
wizard guides through the construction of the expression.
From Marked Records Create a new column. Each record is given a value indicating
whether it is marked or not.
Set Property
Color
The colors of the markers, pies or bars are governed by the values of
the records in the column. If there are less than 20 items in the
column the coloring will be set to categorical, otherwise it will be
continuous.
Size
The sizes of the markers, pies or bars are governed by the values of
the records in the column.
Axis
X
Set the X-axis to the column represented by the current Query
Device.
Y
Set the y-axis to the column represented by the current Query
457
TIBCO Spotfire DecisionSite 9.1.1 for Lead Discovery - User's Manual
Device.
Z
11.3
Set the Z-axis to the column represented by the current Query
Device.
Original Scale
All changes to the scale of the column are removed.
Ln(1+x) Scale
Logarithm base e scale [ln(x+1)].
Log Scale
Logarithm base 10 scale [log10 (x)].
Exp Scale
Exponential scale base e [ex].
Exp10 Scale
Exponential scale base 10 [10x].
Inverse Scale
Inverse scale [1/x].
Reverse Sorting
Reverse scale
Edit Annotation...
Go to the dialog that lets you edit the annotation for this column.
Visualization Pop-up Menu
If you right-click in a visualization you will bring up a pop-up menu with shortcuts to some of
the most used commands. The pop-up menu is slightly different in some of the visualizations.
Right-clicking on an item label (marker label, bar label, etc.) will also display the Copy Special
option which allows you to copy either the value of the label, or, if you are using structure
marker labels, the chemical structure.
Scatter plots
Option
Hotkey
Description
Zoom >
> Zoom to Selection
Zooms to the selected records.
> Reset Zooming
Resets the zoom bars to the original state (no
zooming).
Trellis...
Opens the Properties dialog to the Trellis tab,
where you can split the visualization to display
different subsets of your data.
Marked Record(s) >
> Delete
Del
Deletes the set of marked records. The marked
records are removed from the data set in Spotfire
DecisionSite's memory. This operation cannot be
undone but does not affect the original data unless
that file is intentionally overwritten with the
diminished data.
> Unmark
Ctrl+E
Resets the set of marked records. No records will
be marked after you have executed this operation.
> Invert
Ctrl+I
Inverts the set of marked records. Marks all
unmarked records and unmarks the set of marked
records.
> Select
Ctrl+M
Sets the selection to the marked records. Creates a
temporary filter so that only the marked records are
visible.
> New Column...
458
Opens the New Column from Marked Records
Quick Reference
dialog, where you can add a new column showing
whether records are included in the marked group
or not.
> Create New Portfolio
List
Creates a new list with the marked records to the
Portfolio. The list is placed as the last item on root
level.
> Add to Portfolio List
Adds the marked records from the visualization
into your currently active Portfolio list.
Annotate...
Opens the Properties dialog to the Annotations tab,
where you can provide the visualization with a
description of your choice.
Copy
Ctrl+C
Copies the records corresponding to the markers,
bars and pies marked with the lasso or rectangle
marking tool to the Windows clipboard in text
format. It also copies an image of the visualization
to the clipboard, which can be pasted into other
applications by using a Paste Special option.
Duplicate Visualization
Creates a duplicate of the selected visualization.
Structure Marker
Labels >
Allows you to specify a structure column to use in
the labels. Once structure marker labels are used,
you also have the option to right-click on a
structure label and select Structure Search, Rgroup Search or Export to File directly from the
pop-up menu. You can also use Copy Special >
Copy Structure to copy that specific structure as an
image or as a structure element (depending on the
application where you paste your structure.
> Connection
Allows you to change the connection used to
display the structures into a different structure
database.
> Renderer
Allows you to specify which renderer to use for
drawing the structures in the labels. Here, you also
have the option to change the settings for the
selected renderer, or to turn off smooth drawing of
structures.
> Remove
Reverts to use the column specified on the Scatter
Plot Properties Markers tab in the labels instead of
the structures.
Reset Navigation
Available for 3d scatter plots only. Resets the
visualization to the original view.
Properties
Alt+Enter
Opens the Properties dialog n which parameters
governing the appearance of the visualization can
be set, annotations made, etc.
Hotkey
Description
Bar charts
Option
Zoom >
> Zoom to Selection
Zooms to the selected records.
459
TIBCO Spotfire DecisionSite 9.1.1 for Lead Discovery - User's Manual
> Reset Zooming
Resets the zoom bars to the original state (no
zooming).
Trellis...
Opens the Properties dialog to the Trellis tab,
where you can split the visualization to display
different subsets of your data.
Marked Record(s) >
> Delete
Del
Deletes the set of marked records. The marked
records are removed from the data set in Spotfire
DecisionSite's memory. This operation cannot be
undone but does not affect the original data unless
that file is intentionally overwritten with the
diminished data.
> Unmark
Ctrl+E
Resets the set of marked records. No records will
be marked after you have executed this operation.
> Invert
Ctrl+I
Inverts the set of marked records. Marks all
unmarked records and unmarks the set of marked
records.
> Select
Ctrl+M
Sets the selection to the marked records. Creates a
temporary filter so that only the marked records are
visible.
> New Column...
Opens the New Column from Marked Records
dialog, where you can add a new column showing
whether records are included in the marked group
or not.
> Create New Portfolio
List
Creates a new list with the marked records to the
Portfolio. The list is placed as the last item on root
level.
> Add to Portfolio List
Adds the marked records from the visualization
into your currently active Portfolio list.
Sort
> Descending
Sorts the bars from the highest to the lowest bar.
> Ascending
Sorts the bars from the lowest to the highest bar.
> Reverse
Reverses the current sort order.
> Reset
Resets the sorting to the original order.
Annotate...
Opens the Properties dialog to the Annotations tab,
where you can provide the visualization with a
description of your choice.
Copy
Ctrl+C
Creates a duplicate of the selected visualization.
Duplicate Visualization
Properties
460
Copies the records corresponding to the markers,
bars and pies marked with the lasso or rectangle
marking tool to the Windows clipboard in text
format. It also copies an image of the visualization
to the clipboard, which can be pasted into other
applications by using a Paste Special option.
Alt+Enter
Opens the Properties dialog n which parameters
governing the appearance of the visualization can
be set, annotations made, etc.
Quick Reference
Pie charts
Option
Hotkey
Description
Zoom >
> Reset Zooming
Resets the zoom bars to the original state (no
zooming).
Trellis...
Opens the Properties dialog to the Trellis tab,
where you can split the visualization to display
different subsets of your data.
Marked Record(s) >
> Delete
Del
Deletes the set of marked records. The marked
records are removed from the data set in Spotfire
DecisionSite's memory. This operation cannot be
undone but does not affect the original data unless
that file is intentionally overwritten with the
diminished data.
> Unmark
Ctrl+E
Resets the set of marked records. No records will
be marked after you have executed this operation.
> Invert
Ctrl+I
Inverts the set of marked records. Marks all
unmarked records and unmarks the set of marked
records.
> Select
Ctrl+M
Sets the selection to the marked records. Creates a
temporary filter so that only the marked records are
visible.
> New Column...
Opens the New Column from Marked Records
dialog, where you can add a new column showing
whether records are included in the marked group
or not.
> Create New Portfolio
List
Creates a new list with the marked records to the
Portfolio. The list is placed as the last item on root
level.
> Add to Portfolio List
Adds the marked records from the visualization
into your currently active Portfolio list.
Annotate...
Opens the Properties dialog to the Annotations tab,
where you can provide the visualization with a
description of your choice.
Copy
Ctrl+C
Creates a duplicate of the selected visualization.
Duplicate Visualization
Properties
Copies the records corresponding to the markers,
bars and pies marked with the lasso or rectangle
marking tool to the Windows clipboard in text
format. It also copies an image of the visualization
to the clipboard, which can be pasted into other
applications by using a Paste Special option.
Alt+Enter
Opens the Properties dialog n which parameters
governing the appearance of the visualization can
be set, annotations made, etc.
461
TIBCO Spotfire DecisionSite 9.1.1 for Lead Discovery - User's Manual
Line charts
Option
Hotkey
Description
Zoom >
> Reset Zooming
Resets the zoom bars to the original state (no
zooming).
Trellis...
Opens the Properties dialog to the Trellis tab,
where you can split the visualization to display
different subsets of your data.
Marked Record(s) >
> Delete
Del
Deletes the set of marked records. The marked
records are removed from the data set in Spotfire
DecisionSite's memory. This operation cannot be
undone but does not affect the original data unless
that file is intentionally overwritten with the
diminished data.
> Unmark
Ctrl+E
Resets the set of marked records. No records will
be marked after you have executed this operation.
> Invert
Ctrl+I
Inverts the set of marked records. Marks all
unmarked records and unmarks the set of marked
records.
> Select
Ctrl+M
Sets the selection to the marked records. Creates a
temporary filter so that only the marked records are
visible.
> New Column...
Opens the New Column from Marked Records
dialog, where you can add a new column showing
whether records are included in the marked group
or not.
> Create New Portfolio
List
Creates a new list with the marked records to the
Portfolio. The list is placed as the last item on root
level.
> Add to Portfolio List
Adds the marked records from the visualization
into your currently active Portfolio list.
Same Scale for All
Sets all line charts to use the same scale. (Same as
the 'One for all' scale mode option in the Properties
dialog.)
Cascade All
Sets the Scale and Position of all columns so that
each of them will occupy a separate slot of the
window height.
Maximize All
Set the Scale and Position on every column so they
utilize the whole height of the window.
Show Markers
Displays (or hides) markers in the line chart.
Annotate...
Opens the Properties dialog to the Annotations tab,
where you can provide the visualization with a
description of your choice.
Copy
462
Ctrl+C
Copies the records corresponding to the markers,
bars and pies marked with the lasso or rectangle
marking tool to the Windows clipboard in text
Quick Reference
format. It also copies an image of the visualization
to the clipboard, which can be pasted into other
applications by using a Paste Special option.
Creates a duplicate of the selected visualization.
Duplicate Visualization
Properties
Alt+Enter
Opens the Properties dialog n which parameters
governing the appearance of the visualization can
be set, annotations made, etc.
Hotkey
Description
Profile charts
Option
Zoom >
> Zoom to Selection
Zooms to the selected records.
> Reset Zooming
Resets the zoom bars to the original state (no
zooming).
Trellis...
Opens the Properties dialog to the Trellis tab,
where you can split the visualization to display
different subsets of your data.
Marked Record(s) >
> Delete
Del
Deletes the set of marked records. The marked
records are removed from the data set in Spotfire
DecisionSite's memory. This operation cannot be
undone but does not affect the original data unless
that file is intentionally overwritten with the
diminished data.
> Unmark
Ctrl+E
Resets the set of marked records. No records will
be marked after you have executed this operation.
> Invert
Ctrl+I
Inverts the set of marked records. Marks all
unmarked records and unmarks the set of marked
records.
> Select
Ctrl+M
Sets the selection to the marked records. Creates a
temporary filter so that only the marked records are
visible.
> New Column...
Opens the New Column from Marked Records
dialog, where you can add a new column showing
whether records are included in the marked group
or not.
> Create New Portfolio
List
Creates a new list with the marked records to the
Portfolio. The list is placed as the last item on root
level.
> Add to Portfolio List
Adds the marked records from the visualization
into your currently active Portfolio list.
Same Scale for All
Sets all profile charts to use the same scale. (Same
as the 'All columns use same scale' scale mode
option in the Properties dialog.)
Annotate...
Opens the Properties dialog to the Annotations tab,
where you can provide the visualization with a
description of your choice.
463
TIBCO Spotfire DecisionSite 9.1.1 for Lead Discovery - User's Manual
Copy
Ctrl+C
Copies the records corresponding to the markers,
bars and pies marked with the lasso or rectangle
marking tool to the Windows clipboard in text
format. It also copies an image of the visualization
to the clipboard, which can be pasted into other
applications by using a Paste Special option.
Duplicate Visualization
Creates a duplicate of the selected visualization.
Structure Marker
Labels >
Allows you to specify a structure column to use in
the labels. Once structure marker labels are used,
you also have the option to right-click on a
structure label and select Structure Search, Rgroup Search or Export to File directly from the
pop-up menu. You can also use Copy Special >
Copy Structure to copy that specific structure as an
image or as a structure element (depending on the
application where you paste your structure.
> Connection
Allows you to change the connection used to
display the structures into a different structure
database.
> Renderer
Allows you to specify which renderer to use for
drawing the structures in the labels. Here, you also
have the option to change the settings for the
selected renderer, or to turn off smooth drawing of
structures.
> Remove
Reverts to use the column specified on the Scatter
Plot Properties Markers tab in the labels instead of
the structures.
Properties
Alt+Enter
Opens the Properties dialog n which parameters
governing the appearance of the visualization can
be set, annotations made, etc.
Hotkey
Description
Heat maps
Option
Zoom >
> Reset Zooming
Resets the zoom bars to the original state (no
zooming).
Trellis...
Opens the Properties dialog to the Trellis tab,
where you can split the visualization to display
different subsets of your data.
Marked Record(s) >
464
> Delete
Del
Deletes the set of marked records. The marked
records are removed from the data set in Spotfire
DecisionSite's memory. This operation cannot be
undone but does not affect the original data unless
that file is intentionally overwritten with the
diminished data.
> Unmark
Ctrl+E
Resets the set of marked records. No records will
be marked after you have executed this operation.
Quick Reference
> Invert
Ctrl+I
Inverts the set of marked records. Marks all
unmarked records and unmarks the set of marked
records.
> Select
Ctrl+M
Sets the selection to the marked records. Creates a
temporary filter so that only the marked records are
visible.
> New Column...
Opens the New Column from Marked Records
dialog, where you can add a new column showing
whether records are included in the marked group
or not.
> Create New Portfolio
List
Creates a new list with the marked records to the
Portfolio. The list is placed as the last item on root
level.
> Add to Portfolio List
Adds the marked records from the visualization
into your currently active Portfolio list.
Show Deselected
Shows (or hides) deselected records in the heat
map.
Annotate...
Opens the Properties dialog to the Annotations tab,
where you can provide the visualization with a
description of your choice.
Copy
Ctrl+C
Copies the records corresponding to the markers,
bars and pies marked with the lasso or rectangle
marking tool to the Windows clipboard in text
format. It also copies an image of the visualization
to the clipboard, which can be pasted into other
applications by using a Paste Special option.
Duplicate Visualization
Creates a duplicate of the selected visualization.
Reset Navigation
Available for 3d scatter plots only. Resets the
visualization to the original view.
Alt+Enter
Opens the Properties dialog n which parameters
governing the appearance of the visualization can
be set, annotations made, etc.
Hotkey
Description
> Delete
Del
Deletes the set of marked records. The marked
records are removed from the data set in Spotfire
DecisionSite's memory. This operation cannot be
undone but it does not affect the original data
unless that file is intentionally overwritten with the
diminished data.
> Unmark
Ctrl+E
Resets the set of marked records. No records will
be marked after you have executed this operation.
> Invert
Ctrl+I
Inverts the set of marked records. Marks all
previously unmarked records and unmarks the set
of marked records.
Properties
Table visualizations
Option
Marked Records >
465
TIBCO Spotfire DecisionSite 9.1.1 for Lead Discovery - User's Manual
> Select
Ctrl+M
Sets the selection to the marked records. Creates a
temporary filter so that only the marked records are
visible.
> New Column...
Opens the New Column from Marked Records
dialog, where you can add a new column showing
whether records are included in the marked group
or not.
> Create New Portfolio
List
Creates a new list with the marked records to the
Portfolio. The list is placed as the last item on root
level.
> Add to Portfolio List
Adds the marked records from the visualization
into your currently active Portfolio list.
Copy
Ctrl+C
Copies the set of marked records to the Clipboard.
Data in all the records that have been marked is
copied to the Clipboard in text format.
Copy Special >
> Copy Value
Copies the cell value that you right-clicked upon.
> Copy Visualization
Copy the current visualization to the Clipboard. An
image in vector graphics format of the active
visualization is copied to the Clipboard. This
image can be pasted into another application as a
Windows Metafile.
Duplicate Visualization
Creates a duplicate of the selected visualization.
Export Data...
Opens a dialog where you can select a folder to
save the exported data to, specify a file name and
determine the type and encoding to use for the new
file.
Add Structure Column
Allows you to add a structure column to the table,
so that it behaves like a Structures in Table
visualization.
Properties
Alt+Enter
Opens the Properties dialog n which parameters
governing the appearance of the visualization can
be set, annotations made, etc.
If you are running DecisionSite for Lead Discovery you will have access to more options on the
pop-up menu. See Structures in Table pop-up menu for more information.
11.4
Toolbar Buttons
The following tables describe the toolbar and shortcuts that you can use to create, open, close,
save, and manipulate your visualizations. Look up the action you want to take, and perform one
of the alternatives shown.
Most actions can be performed with hot-keys from the keyboard (Keyboard Shortcut), from the
menu (Menu Command, or Mouse), or by clicking a toolbar button (Toolbar). The menus can
be reached by pressing the Alt key in combination with the underlined letter key. Subsequent
underlined letter keys activate the menu items.
466
Quick Reference
Hotkey
Menu
Command, or
Mouse
Open an existing file or import a
database.
Ctrl+O
File > Open
Import data from file, clipboard or
database, and perform data
conditioning.
Ctrl+D
File > Import Data...
Save the present visualization in the
same format as when opened .
Ctrl+S
File > Save
Print the active visualization.
Ctrl+P
File > Print
Copy the marked records to the
clipboard as text.
Ctrl+C
Edit > Copy
Paste the clipboard contents into
Spotfire DecisionSite.
Ctrl+V
Edit > Paste
Reset all query devices and zoom bars. Ctrl+R
Edit > Reset to All
Create a new 2D scatter plot.
Ctrl+1
Window > New
Scatter Plot
Create a new 3D scatter plot.
Ctrl+2
Window > New 3D
Scatter Plot
Create a new bar chart.
Ctrl+4
Window > New Bar
Chart
Create a new pie chart.
Ctrl+5
Window > New Pie
Chart
Create a new line chart.
Ctrl+6
Window > New Line
Chart
Create a new profile chart.
Ctrl+7
Window > New
Profile Chart
Create a new heat map.
Ctrl+8
Window > New Heat
Map
Create a new table.
Ctrl+9
Window > New Table
Auto-tile visualizations.
Window > Auto Tile
Place all visualizations so they
partially overlap each other.
Window > Cascade
Place all visualizations next to each
other.
Window > Tile
Vertical
Place all visualizations under each
other.
Window > Tile
Horizontal
Open the Properties dialog.
Ctrl+Enter
OR
Alt+Enter
Edit > Properties
Display legend in separate window.
Ctrl+L
View > Legend
Toolbar
Button
467
TIBCO Spotfire DecisionSite 9.1.1 for Lead Discovery - User's Manual
Export the active visualization as an
image (BMP or JPG) to disk.
File > Export >
Current Visualization
Open browser and display values for
the currently marked records.
File > Export >
Details
Show the Guides pane.
Ctrl+W
View > Spotfire
DecisionSite
Go to Start page.
11.5
11.5.1
Mouse Shortcuts
Mouse Shortcuts – Scatter Plots and Line Charts
Mouse over marker
A thin ring highlights the marker and all markers containing the record in other visualizations.
Left-click on marker
Activates a record. A persistent ring surrounds the object. Information about the record
corresponding to the marker that was clicked displays in the Details-on-Demand window.
Left-drag
Marks the records that are inside the 'rubber band box' delineated by the pointer's diagonal
movement. These markers will be given another color. A table of details will be displayed in
the Details-on-Demand window. If no markers are surrounded all previously marked objects
will be unmarked.
Shift + left-drag
Marks records using the lasso tool. Draw an arbitrary shape around the markers you want to
mark. If none are surrounded all objects will be unmarked.
Ctrl + left-drag
Adds markers to the set of marked records using the rectangle 'rubber band box' tool.
Ctrl + Shift + left-drag
Adds markers to the set of marked records using a lasso function.
Ctrl + Shift + left-drag
Adds markers to the set of marked objects using a lasso function to the set of marked records.
Mouse wheel
Zooms in and out in the visualization.
Ctrl + right-click
Zooms in from the visualization.
Ctrl + Shift + right-click
Zooms out from the visualization.
468
Quick Reference
Right-click in visualization
Brings up the visualization context pop-up menu.
11.5.2
Mouse Shortcuts – 3D Scatter Plots
Mouse over marker
Identical to 2D scatter plots
Left-click on marker
Identical to 2D scatter plots.
Ctrl + drag using the right mouse button
(or drag using the middle mouse button)
Rotation around the visualization center.
Shift + drag using the right mouse button
(or Shift + drag using the middle mouse button)
Zooms in the direction of the view.
Ctrl + Shift + drag using the right mouse button
(or Ctrl + Shift + drag using the middle mouse button)
Rotation in the plane of the screen; downwards and right cursor motion rotates clockwise.
Mouse wheel
(or Ctrl + drag using the middle mouse button)
Zooms in and out in the visualization.
Right-click in visualization
Brings up the visualization context pop-up menu.
11.5.3
Mouse Shortcuts – Bar Charts and Pie Charts
Mouse over object
An outline highlights the object and corresponding objects in similar visualizations.
Left-click on object
Activates an object. A persistent outline surrounds the object. Information about the bar or pie
that was clicked displays in the Details-on-Demand window.
Left-drag
Marks the pies or bars that are inside the rectangle delineated by the diagonal movement of the
pointer. If no bars are surrounded all objects will be unmarked.
Shift + left-drag
Enables marking of bars or pies with the lasso tool. Draw an arbitrary shape around the objects
you want to mark. If none are surrounded all objects will be unmarked.
Ctrl + left-drag
Adds bars or pies to the set of marked objects using the rectangle 'rubber band box' tool.
469
TIBCO Spotfire DecisionSite 9.1.1 for Lead Discovery - User's Manual
Ctrl + Shift + left-drag
Adds bars or pies to the set of marked objects using a lasso function to the set of marked
records.
Mouse wheel
Zooms in and out in the visualization.
Ctrl + right-click
Zooms in from the visualization (only works for pie charts when an axis different than None
has been selected).
Ctrl + Shift + right-click
Zooms out from the visualization (only works for pie charts when an axis different than None
has been selected).
Right-click in visualization
Brings up the visualization context pop-up menu.
11.5.4
Mouse Shortcuts – Profile Charts
Mouse over profile
A thin contour highlights the profile (record), as well as all markers associated with the record
in other visualizations.
Left-click on profile
Activates A persistent contour surrounds the profile. Information about the profile appears in
the Details-on-Demand window.
Left-drag
Marks the profiles that are fully or partially inside the 'rubber band box' delineated by the
pointer's diagonal movement. These profiles will become thicker. A table of details will be
displayed in the Details-on-Demand window. If no profiles are surrounded all previously
marked objects will be unmarked.
Shift + left-drag
Enables marking of profiles with the lasso tool. Draw an arbitrary shape around the profile you
want to mark. If none are surrounded all profiles will be unmarked.
Ctrl + left-drag
Adds profiles to the set of marked profiles using the rectangle 'rubber band box' tool.
Ctrl + Shift + left-drag
Adds profiles, by using a lasso function, to the set of marked records.
Mouse wheel
Zooms in and out in the visualization.
Ctrl + right-click
Zooms in from the visualization.
470
Quick Reference
Ctrl + Shift + right-click
Zooms out from the visualization.
Right-click in visualization
Brings up the visualization context pop-up menu.
471
TIBCO Spotfire DecisionSite 9.1.1 for Lead Discovery - User's Manual
12
Glossary
The glossary only contains brief definitions of the terminology used in Spotfire DecisionSite.
Links to more information are available when applicable.
API
The term API stands for Application Programmer's Interface, and is a set of functions available
to programmers. These functions cover a wide range of tasks, such as graphics, multimedia,
fonts, disk access, memory management, etc.
This functionality allows strong integration with legacy systems and novel applications.
Bar Charts
A visualization displaying the data as bars. The value from each record is added to the bar's
total value/ Y-axis height.
Binning
The process of grouping values with similar properties together in a way that each Bin contains
values that, in some important respect, are similar. Not to be confused with clustering, which
means grouping similar records.
Bitmap
A file format for graphics. The format is used in Spotfire DecisionSite when copying the
graphical presentation of a decision tree to the clipboard.
Browser
A program able to display pages encoded in HTML.
Categorical Coloring
Markers, bars or pie charts are assigned distinct colors depending on their values.
Centroids
The centroids are the center points of clusters. How initial centroids are chosen is determined in
the K-means Clustering dialog.
Check Boxes
A Query Device enabling toggling of each data value, to control which will be shown in the
visualization and which will not.
Clustering
A technique for grouping objects on the basis of their similarity for a specified set of
characteristics. The main objective of a cluster analysis is that objects within a cluster should be
more similar to each other than they are to objects in other clusters. Spotfire DecisionSite
Statistics offers three different kinds of clustering: Hierarchical Clustering, K-means Clustering
and Self-Organizing Maps.
Column
Corresponding fields in a set of records constitute a column. (Records go by the name 'rows', in
spreadsheet programs).
472
glossary
Continuous Coloring
Coloring whereby the values in the column determine the shade displayed. The (dissimilar)
Begin and End colors selected in the Customize dialog represent the minimum and maximum
values in a column. The markers representing records having intermediate values are colored
with a blend of the two; depending on their value.
Control
A control is a graphical object (for example an icon, a button or a window) in the user interface
that represents the properties or operations of other objects.
CSV
Comma-Separated Values. This is a standardized way to save data sets. Each data record is
stored as text, using the default list separator as column separator, and a line feed and return
character to mark the end of each record. The default list separator is a property of the Regional
Settings of your Windows system.
Data Column
A property in a data set. Each column in your data set is represented by a query device in
Spotfire DecisionSite.
Data Conditioning
Any kind of processing performed prior to visualizing or analyzing the data, such as
normalization, pivoting, de-pivoting, etc. These features can be accessed upon data import
through the Import Data option. It is also possible to use either of the data conditioning tools
from the Data menu after retrieving your data.
Data Source
A database, a file, or the clipboard.
DecisionSite Navigator
The precursor to the Guides pane. A browser window integrated into the Spotfire DecisionSite
environment, able to communicate with the Spotfire DecisionSite visualization engine.
Delimiter
This is a separator between data values, for example between columns in a data table or
between IDs in a search string.
Dendrogram
A dendrogram is a branching diagram which represents a hierarchy of categories based on the
degree of similarity or number of shared characteristics.
Deselected Records
The records that do not fulfill the constraints of the query devices.
Details-on-Demand
A window that shows the data in a marked record. The information can be displayed as plain
text, HTML styled text in a window or as styled text in an external HTML browser.
Docked Window
By default, the Query Device window, the Details-on-Demand window, and the Legend
window are docked; they stick to one of the outer borders of the Spotfire DecisionSite main
window but can be moved.
473
TIBCO Spotfire DecisionSite 9.1.1 for Lead Discovery - User's Manual
De-pivoted Data
Another word for Tall/Skinny data.
Distance Measures
A type of similarity measures.
Empty Values
Empty values are values that are missing in your data set (has a null value). If you intend to use
any type of clustering tool, all empty values need to be replaced or else the clustering will not
work. There are several replacement methods but all empty values in a column must be
replaced using the same method.
Full-text Search Query Device
A query device with which any string of characters can be located in the column under
investigation. Boolean logic can be used to refine the search.
Glyph
One of the shapes representing a data record in a 3D scatter plot.
Graphical User Interface - GUI
This is the graphical presentation of the application that you see on the screen.
HTML
Hyper Text Markup Language. At its simplest, a language for formatting text. One of the
primary reasons for the success of HTML and the World Wide Web is the ability to use links
within or between documents.
Identifier Column
The identifier column is the column that contains IDs for the records that are used in a certain
calculation. The IDs should be unique for all records in the data set (see also Short/Wide).
ISIS
Integrated Scientific Information System from MDL.
ISIS/Draw
A desktop application from MDL, used for creating and editing models of chemical structures.
Item Slider
A query device with which to select a specific value in a range.
Jitter
An option that displaces the visualization objects randomly in the display window, to make
overlapping records visible.
Lasso Function
Enclosing a set of markers with the mouse pointer while pressing Shift on the keyboard. This
marks the records. The resulting encircling can have any shape.
List
A node in a portfolio where you can add records, annotations and other lists.
474
glossary
Marker
One of the shapes representing a data record in a scatter plot. The 3D shapes are also called
glyphs.
Marked Record
A marker in a scatter plot becomes marked when captured using the lasso or rectangle method
(left mouse button pressed while moving pointer). Marked records are given a definable color
to distinguish them from the rest of the data.
Menu Bar
The row of commands visible at the upper border of a Windows program. Clicking any of the
menu titles will display sub menus with additional choices.
Menu Item
One of the options available in the menu presented by one of the commands in the menu bar.
MOL File
This is a file format used for chemical structures. Each file contains only one structure.
Navigate Menu
The Navigate menu used to be located in the top left corner of the DecisionSite Navigator.
From here you could reach various tools and resources, or log into and log out of the network.
In DecisionSite 8.1 the corresponding functions can be reached via the main menus in
DecisionSite.
Node
A node is a circle in a decision tree that represents either a record or a cluster of records.
Null Value
Empty value. Cell with no value.
ODBC
Open DataBase Connectivity, a common method of accessing databases.
Pie Chart
A visualization showing data in aggregated "pie segments", which can be split, drilled down
into and taken apart.
Pivoted Data
Another word for Short/Wide data.
Pop-up Menu
Menus that are available of you right-click directly in the graphical user interface. The content
of the menu depends on where you click.
Portfolio
A portfolio is a data file in XML-format that can be viewed in the Portfolio tool and which
makes it possible to work with genes or experimental results in a structured way.
Profile
Synonymous to a record (data point) in Spotfire DecisionSite.
475
TIBCO Spotfire DecisionSite 9.1.1 for Lead Discovery - User's Manual
Profile Chart
A visualization type where column names are plotted along the X-axis, and the value in each
column on the Y-axis. This means that each record is presented as a line.
Properties
The dialog box enabling changes to query devices, visualization objects—markers, pies, bars,
backgrounds and HTML code. Located in the Edit menu. Accessible with [Alt+Enter] Edit >
Properties and a toolbar button.
Query Device
A tool that selects data having certain values for visualization. There are five kinds of query
devices: range sliders, item sliders, full-text searches, check boxes and radio buttons.
Query Device Window
The window where the query devices are located. By default, this window is placed in the upper
right corner.
Range Slider
A Query Device used to select a range of data. The default device for numerical data. A range
slider enables narrowing, broadening and moving the interval of the selected data of the
designated column.
Record
One entry or line in a database or data set. Sometimes called a row.
Sampling
In previous versions of DecisionSite, subsets of data could be extracted using a sampling tool.
This is no longer supported.
SAR Table
Structure-Activity Relationship table. The SAR table combines structural and other data about
compounds into a single spreadsheet.
Scatter Plot
A visualization type showing the records as markers in a two-dimensional or three-dimensional
diagram.
SDFile
This is a file format used for exporting ISIS data. Structure-data files contain structures and data
for any number of molecules. SDFiles can be imported into ISIS for Excel.
Selected Records
The records explicitly chosen for display by manipulating the query devices and zoom bars. Do
not confuse with the Marked Records. The option "Work on: Selected records" in the
calculation dialogs means that only the records selected via the query devices are included in
the calculations.
Selecting Data
Using the query devices to control which data is visualized.
476
glossary
SFS
The file extension that Spotfire DecisionSite applies when saving data set in its proprietary
format.
Short/Wide
A data table format with relatively few rows and many columns, suitable for analysis. The
identifier column in a short & wide data table has a unique value for each row, in other words,
all data associated with a specific ID is available on one row in the table.
Similarity Measure
Methods for calculating the similarity between data.
SQL
Structured Query Language, a common language used for formulating queries when
investigating databases.
Tall/Skinny
A data table format with many rows and relatively few columns, commonly used for
automatically generated data, but often not suitable for analysis. The identifier column in a tall
& skinny data table contains multiple values, which means that the same ID and information
associated with it appear on many rows. .
Toolbar
The bar at the top of the application or tool window that contains buttons that are shortcuts to
frequent commands on the menus.
Tools
The tools provide the special functions of your DecisionSite, such as clustering or structure
analytics. You reach the tools via the Data and Tools menus.
Trellis plot
A way of splitting a visualization into panes and organizing these in a grid layout.
Visualization
A graphical presentation of data in Spotfire DecisionSite, e.g., scatter plot, pie chart, etc. The
query devices control which data is displayed.
Web link
A link to an external web site that lets you send a query about marked records.
Zoom Bar
The bars along the edges of the visualization window. By manipulating them it is possible to
zoom in on details of the visualization.
477
TIBCO Spotfire DecisionSite 9.1.1 for Lead Discovery - User's Manual
13
Index
2
2D scatter plots
color
creating
customize markers
jitter
labels
line connection
rotation
scale
shapes
size
zooming
115
60
115, 117
119
75, 110, 168
120
114
99
117
114
166
3
3D scatter plots
axes
color
creating
dimensions
jitter
labels
line connection
navigation
panning
perspective
rendering
rotation
scale
shape
size
zooming
3D Tab
113
115
60
111, 112
119
75, 110, 168
120
113
166
112
111
114
99
117
114
166
111
A
Accessing data
from file
from IDdb3
from the clipboard
from web links
using advanced data import
Actions in DecisionSite
how the list works
properties included with links
user interface description
Activating
how to
interaction with Portfolio
nodes in dendrogram
troubleshooting
Add Columns
details on adding data
from file
from the clipboard
if ID case mismatches
478
205
354
206
350
207
389
390
393
169, 171
343
260
13
213
205
206
209
overview
205
Select Columns dialog
212
Select Matching Columns dialog
210
Select Source dialog
209
using advanced data import
207
Add Columns to Data Set dialog
299
Add ISIS Keys
dialog
319
how to
318
Add List
to Portfolio dialog
297
Add New Data Set from ISIS dialog
298
Add to Current Data Set (Automatic Key Matching)
dialog
373
Add to Current Data Set (Row by Row) dialog 374
Adding
annotation to Portfolio
339
background image
77
MapInfo background files
78
server upon logging in
6
structures to a table
305
Adding items to a Guide
how the Actions list works
389
links to actions in DecisionSite
389
Adding list to Portfolio
empty list
335
from Structure Viewer
297, 300
grouped list
336
list of records
335
Adding new columns
by binning
217
dialog in Structures
299
from an expression
221
from hierarchical clustering
260
from Portfolio
337
from Structures
288
troubleshooting
13
using the Add Columns tool
205
Adjusting slider span
183
Advanced options
178
Advanced Preferences in Structure Analytics
dialog
330
how to add rules
329
Aggregation
example of depivoting
250
example of pivoting
247
pivoting and aggregation
28
Short/Wide => Tall/Skinny
250
Tall/Skinny => Short/Wide
26, 247
Algorithm
hierarchical clustering
271
normalization
244
view tip
180
Analysis Builder
Index
deploying guides
how the Actions list works
menus
overview
properties included with links
quick reference
running guides locally
toolbar
user interface
workflow
Annotations
in Portfolio
in Transpose Data
on columns
on visualizations
Tab in Properties dialog
Anomalies
Appearance
of Line charts
Append
Axes name
Application files
Applying
templates
Arranging visualizations
Auto
fit to page on printing
hide axis selectors
tile
Auto-switch
Average
data and background tab
Axes
3D tab
bar chart columns
bars tab
data and background
lines tab
markers tab
pies tab
profile tab
tab for scatter plots
Axis
labels
scale
selectors in visualizations
393
389
406, 407, 408
387
390
388
391
395
393
387
339, 340, 347
254, 258
99
72
72
12
145
72
417
169
173
446
173
173, 178
199
80, 81
111
140
133
75
145
114, 148
141
150
110
168
99
173
B
Background images and files
adding an image
adding MapInfo files
image files and maps
positioning
SFM files
Bar chart
bar chart columns
color
reference line
77
78
77
78
79, 417
140
134
94
visualization
61
Bars
bar charts
61, 134, 140
bars tab
133
Binary operators
227
Bind to
108
Binning
different methods
215
in bar charts
133
performing
217
Bookmarks
29
Boolean operators
comparing lists in the Portfolio
348
Break on deselected
149
Browsing structures
for active, highlighted or marked records
285
troubleshooting
13
Brushing
170
Buttons
in Analysis Builder
395
in Computation Services
364
in DecisionSite main toolbar
466
in hierarchical clustering visualization
267
in Portfolio
346
in Profile Search Edit dialog
282
in Structure Viewer
297
C
Calculating
columns using an expression
221
distance between markers
381
hierarchical clustering
258
normalized columns
241
using statistical computation servers
355, 357
Cascade
173
Case
of ID values for Add Columns
209
Case sensitivity
25
Categorical coloring
2D scatter plots
115
Categorical Coloring Dialog
124
heat maps
154
Category columns
26
Changing
a value in a master profile for Profile Search 278
a web link
351
axis labels width and height
168
column name
195
content of annotation in Portfolio
340
fonts
176
name of list in Portfolio
336
number formatting
176
perspective in 3D scatter plot
112
query device order
191
query device type
190
visualization axes
9, 166
visualization type
11
Check box query devices
189
479
TIBCO Spotfire DecisionSite 9.1.1 for Lead Discovery - User's Manual
Cherry picking
215
Choosing records
activating
171
highlighting
171
marking
170
Circle
shape and rotation of markers
117
City block distance
274
Clicking markers
171
Clipboard
adding columns from
206
importing data set from
23
Clone visualization
174
Closing
415
Cluster line
261
Cluster slider
270
Clustering
column dendrogram
267
description of hierarchical clustering
258, 271
description of Hierarchical Clustering dialog 263
on keys
259
performing a hierarchical clustering
258
row dendrogram
266
troubleshooting
13
Clusters
calculating similarity between
276
Color expression
129
Color range
116, 153
Coloring
bands
143
bar charts
134
categorical
115
continuos
115
customizing
115
fixed
115
heat maps
153
histograms
134
line charts
148
overlapping ranges
116
pie charts
143
profile charts
152
scatter plots
115
trellis headings
108
Column
adding from clipboard
206
adding from file
205
adding using advanced data import
207
calculating new
221
format
97
from hierarchical clustering
260
from Portfolio
337
from Structure Viewer
288
name
195
normalizing
241
order for table
163, 164
problems when adding
13
separators
32
480
width for table
Column dendrogram
Column Normalization
dialog
launching
overview
theory
Columns
adding from clipboard
adding from file
adding using advanced data import
annotating
delimiters
heat maps
new by binning
new by calculation
new name
tab
Comments
annotating columns
annotations tab
Comparing lists
description of dialog
how to
Complete linkage
Compound ID
dialog for searching for
searching for
Compound list
adding as new columns
adding to Portfolio
editing the name of
exporting
pasting
pop-up menu
searching for compound structures
sorting
troubleshooting
Computation Services
example configuration
Execution Log tab
general concepts
Input Parameters tab
menus
Output Parameters tab
overview
Result dialog
Result Handling tab
toolbar
user interface overview
workflow
Condition
in trellis plots
Conditioning
data conditioning upon import
using Pivot Data
using Transpose Data
163, 164
267
243
241
241
244, 245
206
205
207
99
22, 32
161
217
221
97
97, 164
99
72
349
348
276
317
316
288
288
287
292
287
295
316
287
13
358
367
361
365
363
366
355
379
366
364
362
357
106
25
245
254
Index
Configuring
ISIS connection
324
search domain
307
Structure view
290
Connecting
to data source using OLE DB
41
to DecisionSite server (logging in)
6
to SAS, R or S-Plus computation servers 355, 377
Connecting to structure database
how to connect (general information)
320
how to connect to ISIS database
324, 325
ISIS Connection
Configure dialog
327
Connect dialog
326
Structure Connection dialog
320
Constant Definition Dialog in Computation Services
378
Constraints
40
Continuous coloring
2D scatter plots
115
Continuous Coloring Dialog
122
heat maps
154
Copy special
172
Copying
a dendrogram
262
a visualization
174
in Portfolio
341
marked records to new column
171
records
172
structures
289
Correlation
between data
179
similarity measure for clustering
273
Cosine correlation
274
Creating Favorites
29
Creating Guides
Analysis Builder user interface
393
deploying to server
393
including links to actions
389
overview
387
properties included with links
390
quick reference
388
running guides locally
391
suggested workflow
387
Creating new columns
by binning
217
from an expression
221
from marked records
220
Creating visualizations
bar chart
61
heat map
67
histogram
61
line chart
65
pie chart
64
profile chart
66
scatter plots
60
table
70
trellis plot
visualization
CSV files
Currency
Curve
draw from equation
fit 87, 89, 90, 93
Custom Guides
creating using Analysis Builder
publishing to Library
Customizing
advanced options
axes
colors
fonts
markers
shapes
start page
toolbars
visualizations
Cutting in portfolio
104
11
32
100
85
387
409
178
75
115
176
114
117
384
175
175
341
D
Data
conditioning
25
copying
23, 171
data set overview
172, 203
exporting
445
importing
21, 22, 23, 45
loading
8, 17
pasting
23
range
75
saving
415
types
33, 35
Data and Background
axes
75
tab
74
Data conditioning
using Pivot Data
245
using Transpose Data
254
Data menu
451
Data normalization
dialog
243
overview
241
theory
244
Data range
axes
75
range sliders
183
setting
166
Data set
definition dialog in Computation Services
379
Information about
172, 203
Data sources
OLE DB
41
selecting
21
Data types
general information
35, 225
mismatch upon adding columns
207, 210
481
TIBCO Spotfire DecisionSite 9.1.1 for Lead Discovery - User's Manual
Database
connecting using OLE DB
export database queries
importing from
Database connection
ISIS
SDfiles
Date
Datetime
Decimal digits
Decimal type and separators
DecisionSite
Administrator
DecisionSite Navigator
Library
what is it?
DecisionSite Data Set dialog
DecisionSite ID Column
Default file location
Default settings
Deleting
annotation from Portfolio
list or record in Portfolio
marked records
value in a master profile
web link
Delimiter
in web links
specifying upon import
Dendrogram
column dendrogram
exporting
importing
interaction with visualizations
menus
opening
resizing
row dendrogram
saving
troubleshooting
zooming
Depivot Data
dialog
example
launching
overview
Deploying Guides
Deselecting records
Details-on-Demand
adjusting columns
auto-switch
export
HTML
locking
plain text
properties
sorting values
482
41
444
23
324
324, 325
36
37
100
39
381
383
17, 381
1
379
322
178
175
340
337
171
278
352
351
22
267
262
262
260
269
262
261
266
262
13
261
253
250
250
249
393
170
197
199
443
200
199
197
80
197
template
what is it?
Digits
Dimensions
3D perspective
3D Tab
Displaying
many structures
structures in table
Distance
calculator
measures for clustering
Divide by standard deviation
binning
description of normalization method
Divide by substring
Domain
Double
Drawing order
Drop empty panels
Duplicate visualization
80
197
40
112
111
290
305
381
272
215
244
215
307
39
114
109
174
E
e 195
Edit menu
Editing
annotations in Portfolio
master profile in Profile Search
name of compound list in Structures
name of list in Portfolio
web links
Editor in Profile Search
adjusting the scale in profile editor
using the editor in Profile Search
Editor in Structure Analytics
Editor Rule dialog
Empty list in portfolio
Empty panels
Empty values
adding columns with
excluding in profile search
in new columns (see Troubleshooting)
indicators
replacement of
Enter expression
Entering
limits for binning
values for sliders
Equal height bars
Error bars
Euclidean distance
Even distribution
Even intervals
Example
creating a table of similar structures
editing HTML of DoD
of adding columns with empty values
of adding columns with multiple IDs
449
340
278
287
336
351
279
282
332
335
109
214
284
13
195
241, 242
222
215
194
61
80, 82
273
215
215
286
202
214
213
Index
of pivoting
of R-group search
of run-time filter
of search molecules
of transposing
Excel
copy from
import from
Excluding empty values in profile search
Expanding
nodes in Portfolio
Explicit primary key
Exponential scale
Export
a structure
as web page
current visualization
data
database queries
dendrogram
details-on-demand
HTML
legend image
portfolio
SAR table
SDfile
SQL
the compound list
the portfolio
troubleshooting
visualizations to PowerPoint
visualizations to Word
Expression
calculating columns
language
246, 247
313
47
307
255
23
22
284
343
209
99
291
440
443
445
444
262
443
440, 443
444
341
291
292
444
292
341
13
437
439
221
225
F
Favorites
creating
importing using
organizing
Field Types
File menu
Files
importing from
SFA
SFS
SFT
supported formats
text file
version 7.x and prior
Filter
data during retrieval
run-time example
Set Filter for Column dialog
what is a query device?
Finding a record
in the Portfolio
29
25
30
324, 325, 327
447
22
417
416
416
32
31
417
46
47
49
182
341
using the full-text slider
186
Fit
curve
orthogonal straight line
straight line
Fixed
color
Fixed Coloring Dialog
shape
Flexmatch
Edit Flexmatch Parameters dialog
Structure Search dialog
Fonts
Format column
Formats
specifications for data types
supported formats
Formatting text files
Freezing columns
Frozen columns
Full screen
Full-text Search
description
regular expression
using slider
Function Compatibility
Functions
conversion
date and time
logical
math
statistical
text
87
83
87
115
121
117
311
309
176
97
35
32
31
163
163
173
186
187
186
239
236
234
232
229
231
233
G
Get Values from Data Set dialog
Getting started
Glossary
Glyphs
Graphics cards
Grippers
Grouped list in portfolio
adding
description of dialog
GUI
for Portfolio
for Structure Viewer
of Spotfire DecisionSite
Guides
creating
deploying to a server
from Analysis Builder
including prompted steps
open and publish to Library
pane in DecisionSite
running locally
what are they?
Guides menu
55
8, 17
472
117
5
178
336
348
343
293
4
387
393
387
391
393
383, 384
391
383
454
483
TIBCO Spotfire DecisionSite 9.1.1 for Lead Discovery - User's Manual
H
Half square Euclidean distance
275
Hardware requirements
5
Header height
163, 164
Heading
annotating columns
99
Annotations tab
72
color for trellis plots
108
Heat map
coloring
153
columns
161
creating
67
edit color range
154
marking
67
order of rows
161
troubleshooting
13
visualisation
67
what is it?
67
Help menu
456
Hiding
axis labels
168
axis selectors
173
query devices
193
window frames
173
windows
173
Hierarchical Clustering
adding clustering column
260
dendrogram
260, 262, 266, 267
dialogs
263, 265, 266
launching
258
marking nodes
260
menu
267
on keys
259
opening
262
overview
258
pop-up menu
269
resizing
261
saving
262
theory
271, 276
toolbar
267
zooming
261
Highlighting
how to
169, 171
in dendrogram
260
Histogram
color
134
creating
61
what is it?
61
Home page
383
Horizontal distance in dendrogram
270
Horizontal zooming in dendrogram
261
Host request
328
Hovering
169
HTML Details-on-Demand
Details-on-Demand
200
editing HTML DoD
202
editing HTML templates
200
484
export DoD
statistics for templates
HTML report
exporting visualizations
Hyperlink
Hyperlink Properties dialog
443
202
440
396
I
ID lists
adding to Portfolio
288
adding to the data set
288, 337
exporting from Structure Viewer
292
working with, in Structure Viewer
287
IDdb3 Drug Search
dialog
355
using
354
Identifier
in Transpose Data tool
256
searching for
316
Image
adding background
77
DecisionSite mapping files
79, 417
exporting legend as
444
exporting visualizations as
437, 439, 440, 443
Implicit primary key
209
Importing
case sensitivity
25
data
21
data from structure database
289
dendrogram
262
file interpretation
33
from clipboard
23
from database
23
from favorite
25
from file
22
ISIS
289
ISIS data to Spotfire
289
OLE DB
41
portfolio
340
SAS data
56, 58
SDfiles
325
Spotfire text data file
25
structure keys
318
Indicators
195
Individual scale mode
148
Information
about the data set
172, 203
Information Library
dialog
49
introduction
45
Information link
adding to guides
389
opening
45
Initial query device selection
196
Initiating
a hierarchical clustering
258
a profile search
277
Input
Index
for a web link query
for hierarchical clustering
for profile search
Inserting
empty panels
Integer
Intensity plots
Interaction with visualizations
for dendrograms
troubleshooting
Interactive reports
Interpolation
details on row interpolation
Interpreting results
of Profile Search
Introduction
Inverse
Inverting
ISIS Connection
connecting to ISIS DB
connecting to SDfiles
overview
SDfile file types
ISIS database
configuring the connection
connecting to
host request
importing data to Spotfire
importing structure keys from
searching
ISIS keys
add to data set
dialog
ISIS/Draw
Item sliders
description
entering a value
350
271
283
109
39
67
260
13
416
242
279
7
99
171
324
324
323
325
324, 325, 327
324, 325, 326
328
289
318
47, 306, 316
318
319
306
185
194
J
Jittering
in visualizations
119
K
Keep aspect ratio
Known troubles
(see Troubleshooting)
112
13
L
Label orientation
Labels
axis label width/height
axis labels properties
marker labels in scatter plots
Lasso tool
Launch File dialog
Layout
of line charts
of trellis plots
of visualization area
168
168
75
114
170
376
146
108
173
Lead Discovery Tools
5
Legend
description
203
export as image
444
showing/hiding
173
Library
opening from Library
18, 393
Publish Analysis
420
publishing Analyses
418, 419, 420, 421
publishing Guides
393, 409
publishing Posters
422, 423, 424, 425, 426
what is DecisionSite Library?
17
Lighting
111
Line chart
appearance
145
color
145
columns
145
creating
65
description
65
jitter
119
labels
168
layout
145, 146
line connection
149
Lines tab
145
markers
148
scale mode
145
Line connection
between markers
120
in line charts
149
Line fit
curve
87
orthogonal straight line
83
straight line
87
Line type
145
Line width
145
Linear
(straight line) fit
87
Link
adding action links to Guides
389
information links
45
Link Properties dialog
397
properties included with links
390
web links
350
List file
details on list search
317
exporting from List Logic
349
exporting from Structure Viewer
292
List Logic
comparing lists
348
dialog
349
List name
editing in Portfolio
336
editing in Structure Viewer
300
List Search
details on list search
317
dialog
311, 317
using
316
485
TIBCO Spotfire DecisionSite 9.1.1 for Lead Discovery - User's Manual
Lists
details on list search
in Portfolio
List Logic
List Search
tab in Structure Viewer
Loading data
Locking details-on-demand
Log scale in dendrogram
Logarithmic scale
Logging in
Logical Functions
Login
317
335
348, 349
316, 317
287
8, 17
199
261
99
6
232
6
M
Manhattan distance
Many structures
in Structure Viewer
spawning windows
MapInfo
Mapping files
Maps
adding background images
adding MapInfo files
Spotfire DecisionSite mapping files
Maps
Maps
Maps
Maps
Marked records
marking
new column from
Markers
activating
coloring
copying
customizing
drawing order
highlighting
labelling
marking
rotating
shape of
size of
tab of scatter plot
Marking
how to
in dendrogram
interaction with Portfolio
interaction with Structure Viewer
troubleshooting
Marking records
Master profile
changing a value in
removing a value in
using active profile
Matrix plots
Measures
486
274
290
290
78
79, 417
77
78
79, 417
77
78
79
417
170
220
171
115
172
114
114
171
114
170
114
117
114
114
169, 170
260
342
285
13
170
278
278
277
67
similarity
Menu
Analysis Builder
dendrogram pop-up
Hierarchical Clustering
Portfolio
Profile Search pop-up
Structure Viewer
Microsoft PowerPoint Presentation
dialog
exporting visualizations
Microsoft Word Presentation
dialog
exporting visualizations
MIF file
Minimum requirements
Mismatching
case when adding columns
data types when adding columns
MOL file
Molecules
browsing for structures
example of search molecules
searching using Structure Search
Mouse maneuvers
3D scatter plots
bar charts and pie charts
profile charts
scatter plots and line charts
Moving windows
Multiple conditioning methods
Multiple Venn comparison
272
406, 407, 408
269
267
344, 345
283
294, 295
438
437
439
439
78
5
209
207, 210
291
285
307
306
469
469
470
468
174
26
337
N
Name
of annotation in Portfolio
of column
of compound list in Structure Viewer
of list in Portfolio
of web link
Navigation
Navigator
options
what is the Guides pane?
Negative numbers
Network connection
New
annotation in Portfolio
empty list in Portfolio
grouped list in Portfolio
list from comparing lists in Portfolio
list of records in Portfolio
value in master profile
visualization
web link
New column
adding to data set
by binning
340
195
300
336
351
113
384
383
100
6
339
335
336
348
335
278
11
351
205
217
Index
dialog for adding from Structure Viewer
from expression
from hierarchical clustering
from marked records
from Portfolio
from Structure Viewer
problems when adding
No structures are shown
(see Troubleshooting)
Nodes in dendrogram
activating
description of
distance between
highlighting
marking
Normalization
dialog
launching
overview
theory
Normalize case
Null expressions
Number Format
299
221
260
220
337
288
13
13
260
266
270
260
260
243
241
241
244
25
237
100
O
ODBC
23
Offline
6
OLE DB
41
Open From Library
18
Open in Other DecisionSite Instance dialog
375
Open Resulting Data Set in DecisionSite dialog 380
Opening
a dendrogram
262
a portfolio
340
data in DecisionSite
8, 17, 18, 21, 45
Operator
overview
227
precedence
229
Order
Favorites
30
of tabs in workbook mode
174
query devices
192
table columns
164
table rows
163
Ordering function
272
Original scale
99
Orthogonal straight line fit
applying
80
description
83
Overview
Add Columns
205
Analysis Builder
387
Column Normalization
241
Hierarchical Clustering
258
Normalization
241
Pivot Data
245
Portfolio
335
Profile Search
277
Similarity measures
Structure Viewer
Tools, overview
Transpose Data
User interface
Web Links
272
285
5
254
4
350
P
Panning
166
Password
dialogs for ISIS connection
328, 329
logging in
6
Pasting
a list into Structure Viewer
287
data from clipboard
23
in Portfolio
341
Pearson's correlation
273
Personal settings
175
Perspective
112
Pictures
adding as background
77
background formats
77
Spotfire DecisionSite mapping files
79, 417
Pie charts
color
143
creating
64
description
64
jitter
119, 141
labels
141
size
144
Pivot Data
dialog
247
example
246, 247
launching
245
overview
245
what is pivoting?
28
Plain Text
197
Pop-up menu
for query devices
456
in Analysis Builder
408
in dendrogram
269
in Portfolio
345
in Profile Search Edit dialog
283
in Structure Search, R-group Search and List
Search
312
in Structure Viewer
295
in Table with structures
305
in visualizations
458
Portfolio
adding ID list from Structure Viewer
288
annotations
339
cut, copy, paste
341
dialogs
347, 348, 349
exporting
341
importing
340
launching
335
lists
335
menu
344
487
TIBCO Spotfire DecisionSite 9.1.1 for Lead Discovery - User's Manual
overview
335
searching
341
user interface
343, 344, 345, 346
Position background image
78
Poster
background images
436
Details-on-Demand
429
query devices
428
supported features
430
PowerPoint Presentation
dialog
438
exporting visualizations
437
Precision
40
Printing
from DecisionSite
446
Problems
Lead Discovery troubleshooting
13
Profile chart
color
150
columns
152
creating
66
jitter
150
labels
150
lines
150
scale mode
150
what is it?
66
Profile Columns Tab
152
Profile Search
dialogs
280, 282
editing
278
launching
277
overview
277
theory
283
Profile Tab
150
Prompt for... dialog
398
Prompt Settings dialogs in Computation Services
Boolean
367
Column Name
368
Data Set
369
File
370
Integer
370
List
371
Real
372
String
373
Prompting in guides
391
Properties
for visualizations
9
Guide properties in Analysis Builder
401
hyperlink properties in Analysis Builder
396
link properties in Analysis Builder
397
quick access
195
scatter plot color
115
shape and rotation
117
Structure Viewer
290
text properties in Analysis Builder
395
Publish
Analysis to Library
418, 419, 420
488
Guide to Library
Poster to Library
393, 404, 405, 406, 409
422, 423, 424, 425, 426
Q
Query devices
changing type
check boxes
descriptions
e 195
entering a value
full-text search
hiding
indicators
initial selection
item sliders
moving
pop-up menu
radio buttons
range sliders
regular expressions
sorting
types
Quick navigation
Quick reference
for Analysis Builder
for Computation Services
190
189
182
194
186
193
195
196
185
191
456
190
183
187
192
182
113
388
355
R
R statistical computing
Computation Services overview
connection to an R server
example configuration
Radio button query devices
Range sliders
adjusting span
entering values
Real
Record meter
Records
activating
copying
highlighting
marking
status bar
unmarking
Reference line
adding in a bar chart
dialog
References
for hierarchical clustering
Regular expressions
introduction
symbols
Remember me
Removing
an annotation from Portfolio
list or compound in Portfolio
value in a master profile
web link
355
377
358
190
183
194
39
172, 203
171
172
171
170
172, 203
170
74
94
272
187
188
6
340
337
278
352
Index
Renderer in Structure Analytics
Renderer Rule dialog
333
settings
303
Rendering
111
Replace Current Data Set dialog
375
Replacing empty values
details on interpolation
242
how to
241
Report
export as web page
440
export to PowerPoint
437
export to Word
439
printing
446
Required input
for hierarchical clustering
271
for profile search
283
Requirements
hardware
5
software
6
Reserved words
237
Reset zooming
166
Resetting
3D navigation
113
marked records
171
original scale in profile editor
282
visualizations
172
zooming in dendrogram
261
zooming in visualizations
166
Resizing
dendrograms
261
windows
174
Resources pane
Resources
456
Retrieving
data using the Import Agent
21
R-group Search
dialog
314
example of query
307
performing a search
313
Structure Search dialog
309
Rotating a data set
depivot data
249
pivot data
245
transposing
254
Rotation of markers
114
Row dendrogram
266
Row height
Table Columns tab
164
Table tab
163
Rules
for choice of editor and renderer in Structure
Analytics
330, 332, 333, 334
Run-time filter
dialog
49
example
47
filtering data during retrieval
46
S
Sample data
SAR table
dialog for exporting
exporting
SAS
Computation Services overview
connection to a SAS server
example configuration
Saving
a dendrogram
a portfolio
a visualization as an image
an Analysis (*.SFS)
data in other formats
visualization settings
Scale
above the dendrogram
exponential
inverse
labels
line charts
logarithmic
of profile editor
profile charts
Scale between 0 and 1
description of method
dialog for normalization
normalizing by
Scatter plots
2D marker rotation
3D
color
creating
jitter
labels
line connection
scale
shapes
size
zooming
Script
Computation Services overview
field in Computation Services
SDfile
connecting to
dialog for exporting
exporting
importing
SDfile Settings dialog
Searching
an ISIS database
for compound ID using list search
for similar profiles
for structure similarity
for substructure
IDdb3
7
300
291
355
377
57, 58, 358
262
341
443
415
445
175
270
99
99
168
145
99
279
150
245
243
241
114
60
115
60
119
75, 110, 168
120
99
117
114
166
355
362
324, 325
301
292
325
325, 327
306
316
277
306, 307, 313
306
354
489
TIBCO Spotfire DecisionSite 9.1.1 for Lead Discovery - User's Manual
regular expression
187
setting search domain
307
the Internet using Web Links
350
the library
20
the portfolio
341
troubleshooting
13
using Full-text search query device
186
Security
software requirements
6
Selecting
data source
21
line chart columns
148
what is a query device?
182
Sending a query using Web Links
350
Separators
column
32
date
36
decimal
39
integer
39
Server
6
Setting
color
195
data range
183
property
195
size
195
slider span
183
Setting up
new web link
351
Settings for... dialog
399
SFA files
417
SFM files
79, 417
SFS files
416
SFT files
416
Shade
111
Shapes
2D markers
117
customizing
114, 117
Short/Wide
dialog
247
examples
246, 247
pivoting
26, 245
Shortcuts
keyboard
466
mouse
468, 469, 470
Show
axes
113
bounding box
113
empty values
195
windows
173
Similarity
between clusters
276
between structures
306
city block distance
274
cosine correlation
274
Euclidean distance
273
half square decide
275
measures overview
272
490
Tanimoto coefficient
Similarity search
how to search
in run-time filters upon data retrieval
parameters
Single linkage
Size
2D markers
3D markers
pie charts
SKV files
Sliders
full-text
item
range
Slow interaction
(see Troubleshooting)
SMILES
Smooth shading
Software requirements
Sorting
a Table
Details-on-Demand
in Structure Viewer ID list
query devices
Spawn structure viewers
Specifications
data types
hardware requirements
software requirements
text files
Specify Column dialog
Splash screen
S-PLUS
Computation Services overview
connection to an S-PLUS server
example configuration
Spotfire DecisionSite
contact support
welcome to
what is it?
Spotfire files
Spotfire interactive reports
Spreadsheet
SQL
editing
exporting
Square
Stacked bars
in bar charts
layout option in bar charts
Standard Deviation
Average and Standard Deviation dialog
data and background
division
when binning
Star
275
306
47
311
276
114
114
144
32
186
185
183
13
322
111
6
163
197
287
192
290
35
5
6
31
224
178
355
377
358
3
7
1
416
416
70
23
444
117
61
133
81
80
244
215
117
Index
Starting
a hierarchical clustering
258
a List Logic comparison
348
guides
383
local Guides
391
Statistical computations
Computation Services overview
355
example configuration
358
suggested workflow
357
user interface overview
362
Statistical functions
231
Statistical measures
in visualizations
80
Statistics
for HTML templates
202
in visualizations
80
Status bar
172, 203
Straight line fit
Data and Background tab
80
description
83, 87, 93
String
38
Structure Connection
creating a connection
320
dialog
320
disconnecting connections
321
overview
319
Structure keys
dialog for importing
319
importing from ISIS
318
Structure Search
dialog
309
examples of search molecules
307
how to search for structures
306
search domains
307
setting up an R-group query
313
Structure view
configuring
290
dialog for configuring
304
Structure Viewer
compound lists
287
connecting to ISIS
324
connecting to SDfiles
324, 325
dialogs
297, 299, 300, 301, 302, 304, 307
example
286
exporting from
291, 292
launching
285
menu
294
overview
285
pop-up menu
295
properties
304
toolbar
297
user interface
293
Structures
copying
289
displaying many
290
example
307
exporting
291, 292
searching for
Structures in Table
Substructure search
Support
Symbols
shape and rotation
Syntax
System requirements
306
305
306
3
117
225
6
T
Table
color
column order
column selection
column width
creating
details-on-demand
displaying structures in table
exporting SAR table
properties
sorting
what is it?
Tabs
Tall/Skinny
dialog
examples
pivoting
Tanimoto coefficient
Templates
applying
Details-on-Demand templates
editing HTML templates
SFT files
statistics for HTML templates
Terminology
Text files
specifications
supported formats
Text Properties dialog
Theory
of Column Normalization
of curve fit
of hierarchical clustering
of Normalization
of Profile Search
of similarity measures
Thousands separators
Three-dimensional
scatter plots
settings
TIBCO Spotfire DecisionSite
contact support
welcome to
what is it?
Tick marks
3D tab
Axes tab
Bar Chart Columns tab
163, 164
164
163, 164
164
70
197
305
291
163, 164
163, 164
70
174
247
246, 247
26, 245
275
169
80
200
416
202
472
31
32
395
244
90, 93
271
244
283
272
100
60
111
3
7
1
111
110
140
491
TIBCO Spotfire DecisionSite 9.1.1 for Lead Discovery - User's Manual
Bars tab
133
Lines tab
145
Markers tab of line chart
148
Markers tab of scatter plot
114
Pies tab
141
Profile tab
150
Tiling
173
Time
35
Title
columns
99
trellis plots
108
visualizations
72
Tool Option dialog
402
Toolbar
in Analysis Builder
395
in DecisionSite
175, 466
in hierarchical clustering visualization
267
in Portfolio
346
in Profile Search Edit dialog
282
in Structure Viewer
297
Tools
in DecisionSite for Lead Discovery
5
Tools menu
452
Transforming
axis scale
99
data
25, 26, 28
Transpose Data
dialog
256, 257, 258
example
255
using
254
Tree
hierarchical clustering dendrogram
266, 267
Trellis plot
conditions
106
creating
104
empty panels
109
heading colors
108
layout
108
what is it?
104
Trends
80
Trinary operators
229
Troubleshooting
for Lead Discovery
13
Tutorials
383
TXT files
specifications
31
supported formats
32
Type strings
33
U
Unary operators
Unmarking records
UPGMA
URL
annotation in Portfolio
editing a web link
removing a web link
setting up new web link
492
227
170
276
339
351
352
351
User ID
User interface
for Portfolio
for Structure Viewer
Spotfire DecisionSite
6
343
293
4
V
Venn diagrams
multiple Venn comparison using Portfolio
337
View menu
450
View tip
algorithms
180
description
179
Viewing structures
in a table visualization
305
in floating windows
290
troubleshooting
13
using Structure Viewer
285
Visualization menu
450
Visualizations
2D scatter plots
60
3D scatter plots
60
annotating
72
bar charts
61
changing axes
9, 166
customizing
175
exporting
443
heat maps
67
histograms
61
line charts
65
multiple
173, 174
pie charts
64
profile charts
66
properties
9
table
70
tiling
173
W
Ward's method
Web link
creating in Web Links tool
editing in Web Links tool
removing from Web Links tool
sending a query using Web Links
Web Links
dialog
options dialog
overview
Web page
Web report
exporting visualizations
Welcome screen
Width of table columns
Window menu
Windows
arranging
moving
showing/hiding
Word Presentation
277
351
351
352
350
352
353
350
383
440
7
164
455
173
174
173
Index
dialog
exporting visualizations
Workbook
mode
showing and hiding windows
WPGMA
439
439
174
173
276
X
XML
DecisionSite 7.x and prior
XSF files
417
417
Z
Zoom bar
zooming and panning
Zoom to selection
Zooming
dendrograms
scatter plots
Z-score
calculating z-score
description of method
166
166
261
166
241
244
493