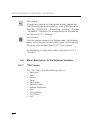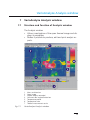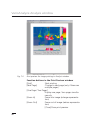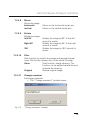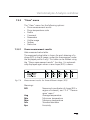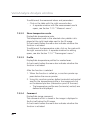
1
VarioAnalyze
User Manual
JENOPTIK Group.
Dear User
Dear User
You should carefully read these instructions before you start operating the
VarioAnalyze Software.
Editorial deadline:
October 2005
Document number:
014801-021-98-02-1005 (english)
JENOPTIK Laser, Optik, Systeme GmbH
Göschwitzer Straße 25
D - 07745 Jena
Germany
Phone: +49 3641 65-3942
Fax:
+49-3641 65-3494
E-mail: [email protected]
CE
Note:
No part of this User Manual may be reproduced in any form (print, photocopy, microfilm or any other process), nor may it be processed, duplicated
or distributed using electronic systems without the written permission of JENOPTIK Laser, Optik, Systeme GmbH.
This document was produced with appropriate care. No liability will be accepted in the case of damages arising from non-observance of the information contained herein.
We reserve the right to modify this document following technical advancements.
Content
Content 1
Instructions for using this manual
7
2
Application field of VarioAnalyze
9
3
Supplied items and system requirements
11
Installation
13
4
5
5.1
5.2
5.2.1
5.2.2
5.3
Starting and ending the program
Starting the program
Structure of the software user interface
VarioAnalyze Explorer window
VarioAnalyze Analysis window
End program
15
15
15
16
16
17
6
6.1
6.2
6.3
6.3.1
6.3.1.1
6.3.1.2
6.3.1.3
6.3.1.4
6.3.1.5
6.3.1.6
6.3.1.7
6.3.1.8
6.3.1.9
6.3.1.10
6.3.1.11
6.3.2
6.3.2.1
6.3.2.2
6.3.3
6.3.3.1
6.3.3.2
VarioAnalyze Explorer window Structure and function
Toolbar in the VarioAnalyze Explorer window
Menu description in the Explorer window
“File” menu
New root
Save
Save as
Send
New folder
Previous folder
Refresh directories
Print
Print preview
Print Setup
Exit
“Edit” menu
Image sequence
Change comment
“View” menu
Settings
Toolbar
19
19
21
22
22
23
23
23
24
24
24
24
24
25
26
26
27
27
27
28
28
29
Content
6.3.3.3
6.3.4
6.3.4.1
6.3.4.2
Status bar
“Help” menu
Help
About VarioAnalyze 29
30
30
30
7
7.1
7.2
7.3
7.3.1
7.3.1.1
7.3.1.2
7.3.1.3
7.3.1.4
7.3.1.5
7.3.1.6
7.3.1.7
7.3.2
7.3.2.1
7.3.2.2
7.3.2.3
7.3.2.4
7.3.2.5
7.3.2.6
7.3.2.7
7.3.2.8
7.3.2.9
7.3.2.10
7.3.2.11
7.3.3
7.3.3.1
7.3.3.2
7.3.3.3
7.3.3.4
7.3.3.5
7.3.3.6
7.3.3.7
VarioAnalyze Analysis window31
Structure and function of Analysis window
31
Toolbar in the Analysis window
35
Menu description in the Analysis window
38
“File” menu
38
Open
38
Save
38
Save as
38
Print
39
Print preview
39
Print Setup
41
Exit
41
“Edit” menu
42
Undo
42
Copy
42
Copy selection
43
Copy measurement results
43
Copy measurement results ASCII
43
Copy to report
44
Set selection
44
Mirror
45
Rotate
45
Filter
45
Change comment
45
“View” menu
47
Show measurement results
47
Show temperature scale
48
Profile
48
Comment
48
Parameters
49
Visible image
49
Toolbar
50
Content
7.3.3.8
7.3.4
7.3.4.1
7.3.4.2
7.3.4.3
7.3.4.4
7.3.4.5
7.3.4.6
7.3.4.7
7.3.4.8
7.3.4.9
7.3.4.10
7.3.4.11
7.3.4.12
7.3.4.13
7.3.5
7.3.5.1
7.3.6
7.3.6.1
7.3.7
7.3.7.1
7.3.7.2
7.3.8
7.3.8.1
7.3.8.2
7.3.9
7.3.9.1
7.3.9.2
7.4
7.4.1
7.4.2
7.4.3
Status bar
“Thermogram” menu
Limits
Units
Grid settings
Temperature Matrix
Isotherms
Point
Line
Rect
Circle
Ellipse
Polygon
Next
Previous
“Measure” menu Measurement results
“Correction” menu
Definition
“Extras” menu
Options
Arrange icons
“Report” menu
Create new report
Open existing report
“Help” menu
Help
About VarioAnalyze…
Direct access with right mouse click
Thermogram: Edit shapes
Change limits and color palette
Save, print, export thermograms
50
51
51
53
54
55
57
57
57
58
58
58
58
58
58
59
59
60
60
63
63
66
67
67
68
69
69
69
70
70
73
74
8
8.1
8.1.1
Create report: Report window
Structure and function of the Report window
Edit report fields
75
75
77
Content
8.1.2
8.2
8.2.1
8.2.1.1
8.2.1.2
8.2.1.3
8.2.1.4
8.2.1.5
8.2.1.6
8.2.1.7
8.2.1.8
8.2.2
8.2.2.1
8.2.2.2
8.2.2.3
8.2.3
8.2.3.1
8.2.3.2
8.2.3.3
Changing the properties of a report field and
importing images
Menu description in the Report window
“File” menu
Open
Save
Save as
Save template as
Send
Print preview
Print
Exit
“Edit” menu
Copy the page
Add page
Delete page
“View” menu
Next page
Previous page
Change the template
77
79
79
80
80
80
80
80
80
80
80
81
81
81
81
82
82
82
82
9
General procedure for image evaluation
83
10
Service and support
85
Instructions for using this manual
1 Instructions for using this manual
In this manual, the following linguistic and typographic synonyms and rules are used:
Click
Right click
Click with the left mouse button
Click with the right mouse button
[OK]
Identifies a button in a software window
[x]
Means the small cross in the top right
corner of each window (close window)
|- Menu | Submenu 1 | Submenu 2 -|
Marks a path through the menus; you
follow it using either the mouse pointer
or the arrow keys on the keyboard
“Edit correction definitions shapename”
Window name. Instead of the expression in italics, the actual name taken
from your image – in the example, the
shape name – appears in the window.
Instructions for using this manual
Application field of VarioAnalyze
2 Application field of VarioAnalyze
The VarioAnalyze software is used to manage, analyze and
evaluate infrared images (thermograms). In particular, it is
used for convenient analysis of thermograms which were
taken using JENOPTIK thermal cameras.
Application field of VarioAnalyze
10
Supplied items and system requirements
3 Supplied items and system requirements
The following are supplied:
• CD-ROM with software for Windows operating systems
as executable file
• User manual
The following are system requirements for installation and
use of the software:
Operating system Windows 2000, Windows XP
Free hard disk space
Minimum 512 MB
RAM
Minimum 256 MB,
512 MB or more recommended
Processor clock frequency
1 GHz or higher
Graphics card
Windows 2000 or Windows XP compatible
Minimum 16-bit color depth (true color)
Screen resolution
Minimum 1024 x 768 pixels,
1280 x 1024 pixels or higher
recommended
11
Supplied items and system prerequisites
12
Installation
4 Installation
To install the software directly from the data medium:
1. Insert the CD-ROM into the CD-ROM drive of the PC.
2. To install the English version: Double click on the file
varioanalyze_engl.exe;
to install the Japanese version: Double click on the file
varioanalyze_jpn.exe;
to install the Spanish version: Double click on the file
varioanalyze_spn.exe.
3. Click on [OK] to confirm that you want to continue with
the installation of VarioAnalyze.
> Program installation is started.
4. If required, select the desired program folder.
> The software is installed in full.
> After installation, the program folder contains,
among other things, the files varioanalyze.exe,
varioanalyzemess.exe, varioanalyze.hlp, varioanalyzemess.hlp and the subdirectories Colors, Images
and Doc.
The Colors directory contains the color palette files.
The Images directory contains example images.
> The VarioAnalyze program icon is installed on the
desktop if this option was chosen.
> The installation routine reports that installation is
complete.
The program can now be used.
13
Installation
14
Starting and ending the progam
5 Starting and ending the program
5.1
Starting the program
1. Start VarioAnalyze by double-clicking with the left mouse
button on the VarioAnalyze icon on your desktop, or select the program in the Windows start menu (e.g. |- Start
| All programs | VarioAnalyze -|).
> The “Select root” window opens.
2. In the “Select root” window, select the path to the desired image directory, e.g. directory
|- thermograms -|, and click on [open].
> The Explorer window of the software opens. See the
following section 5.2 “Structure of the software user
interface”.
Depending on the number of drives which are connected to the computer and the number of existing
directories and subdirectories, opening the Explorer
window can take a few seconds.
5.2
Structure of the software user interface
The VarioAnalyze user interface consists of two separate
windows which remain open simultaneously:
• Explorer window to select directories and to display and
select preview images (Fig. 5-1)
• Analysis window to analyze thermal images and produce
analysis reports (Fig. 5-2)
Switching from the open Explorer window to the open
Analysis window and vice versa is possible, e.g. using the
Windows standard key combination (Alt + Tab).
15
Starting and ending the program
5.2.1
Fig. 5-1
VarioAnalyze Explorer window
Explorer window
From the Explorer window, you can open the desired IR image directly: Double click on the preview image in the righthand part of the window to show the image in the Analysis
window. For a description of the Explorer window, see
Chapter 6 “VarioAnalyze Explorer window”.
5.2.2
Fig. 5-2
VarioAnalyze Analysis window
Analysis window
For a description of the Analysis window, see Chapter 7
“VarioAnalyze Analysis window”.
16
Starting and ending the program
5.3
End program
1. Select in succession, in the Explorer window and Analysis
window: |- File | Exit -|
or close the current window by clicking on [x].
> VarioAnalyze is ended. If required, you have the opportunity to save data which has not been stored
until now.
17
Starting and ending the program
18
VarioAnalyze Explorer window
6 VarioAnalyze Explorer window
6.1
Structure and function
In Explorer window
• Select the directory in which the IR images to be analyzed are stored
• If thumbnails (preview images) of the images which are
stored in the current directory are displayed,
• open the desired IR image in the Analysis window by
double-clicking on the preview image.
1 Menu and icon bars
2 Directory tree
3 Preview image
Fig. 6-1
VarioAnalyze Explorer window
Menu and icon bar
For a description of the menus, see Section 6.3 “Menu description in the Explorer window”.
For a description of the icons, see Section 6.2 “Toolbar in
the VarioAnalyze Explorer window”.
19
VarioAnalyze Explorer window
Directory tree
In the left-hand window area (directory tree), change the
directory as for Windows Explorer, by marking the desired
folder.
Preview area
In a similar way to Windows Explorer, in the Preview area
information about the objects which are held in the current
directory (images in the .irb, .bmp und .pcx formats) is displayed.
Display options in the Preview area:
• Text list (No preview images / only text)
• Small preview images
• Large preview images
Double click with the left mouse button on the preview image to open IRB files in the Analysis window.
The other formats (.bmp, .pcx) are displayed only as preview
image, and cannot be opened in the Analysis window.
Right click on a marked image to open a flyout menu with
the options
Print
Print the selected image; opens the
print preview window (see Section
6.3.1.9 “Print preview”)
Save as
Save IRB files (see Section 6.3.1.3 “Save
as”)
20
VarioAnalyze Explorer window
6.2
Toolbar in the VarioAnalyze Explorer window
The icons in the toolbar are used to operate the software
quickly using the mouse. The functions which they represent can also be reached via the menus of the VarioAnalyze
Explorer window. In the menu description of the Explorer
window, you will find the icon corresponding to each menu
item.
Change the shown directory to the next higher level
Create a new folder
Save as ...
Stores the selected thermogram in a freely selectable directory. VarioAnalyze displays the “Save As” dialog window.
See Section 6.3.1 “’File’ menu”.
No preview images
On the right side of the VarioAnalyze Explorer screen the
thermograms will just get shown with their filename, date,
file type, camera type and pixel resolution in a list form.
No preview images are shown. See Section 6.3.3 “’View’
menu”.
Small preview images
Small thumbnails (80x60 pixels) are displayed in the Preview
area. See Section 6.3.3 “’View’ menu”.
Large preview images
Large thumbnails (160x120 pixels) are displayed in the Preview area. See Section 6.3.3 “’View’ menu”.
21
VarioAnalyze Explorer window
Next palette
Change color palette for the preview display (toggle key).
The following palettes are used in a loop in this sequence:
from IRB – VARIOCAM – BlackWhite – IronBow – BlueRed
– MrkedBW – Rainbow. For an explanation of the palettes,
see Section 6.3.3.1 “Settings”.
Print preview
Print the marked image in the Preview area. VarioAnalyze
opens a print preview window after again confirming the
Windows print window. See 6.3.1.9 “Print preview”.
For displaying or hiding the toolbar, see Section 6.3.3.2
“Toolbar”.
6.3
6.3.1
Menu description in the Explorer window
“File” menu
The “File” menu has the following options:
• New root
• Save
• Save as
• Send
• New folder
• Previous folder
• Refresh directories
• Print
• Print preview
• Print Setup
• Exit
22
VarioAnalyze Explorer window
6.3.1.1
New root
Select a new directory which is to be displayed, the next
time the software starts, as the default directory for thermograms.
> The “Select root” window opens.
Fig. 6-2
“Select root” window
The usual procedure for Windows:
– Select path and click on [open].
> The displays in the Directory area and Preview area
are updated.
6.3.1.2
Save
Store the current image under the same name and in the
same directory. The existing file is overwritten.
6.3.1.3
Save as
Store the current IRB image under a new name, in a different format and/or under another path.
> The “Save as” window opens.
In the “Save as” window:
1. Enter the filename and path
23
VarioAnalyze Explorer window
2. Click on [Save]
> The file is saved.
> The display in the Preview area is updated only after
the “Refresh directories” function has been executed,
see Section 6.3.1.7 “Refresh directories”.
6.3.1.4
Send
Send selected image by email.
> Opens the email client and attaches the file to a new
email.
To send it, see your documentation for using your email
program.
6.3.1.5
New folder
Create new folder in Explorer (Directory area).
6.3.1.6
Previous folder
Change to the higher-level folder.
6.3.1.7
Refresh directories
Update the displays in the Directory and Preview areas.
6.3.1.8
Print
Print the marked image in the Preview area.
> The Windows print window is opened.
In the Windows print window:
1. Select printer and make settings for the selected printer
2. Click on [OK]
> The image is printed.
24
VarioAnalyze Explorer window
6.3.1.9
Print preview
Print the marked image in the Preview area.
> A Print Preview window is opened.
Fig. 6-3
Print preview for printing from the VarioAnalyze Explorer window
As well as the image content, the following file information
is included in the print view:
• Path and filename
• Date
• Which camera was used, format (breadth and height in
number of pixels)
25
VarioAnalyze Explorer window
Function buttons in the Print Preview window
[Print]
Start printing
[Zoom In]
Zoom into image (enlarge representation)
[Zoom Out]
Zoom out of image (reduce representation)
[Close]
Close print preview
To print the image:
1. Click on [Print]
> The Windows print window opens.
2. Select printer, make settings for paper size,
orientation, color options, etc.
3. Click on [OK]
> The image is printed.
6.3.1.10
Print Setup
Select the printer and printer connection for VarioAnalyze.
Define printer settings.
> The Windows print window is opened.
In the Windows print window:
1. Select printer, make settings for selected printer, e.g.
paper size, orientation, color options etc.
2. Click on [OK]
> The settings are accepted as default settings for VarioAnalyze and called up at every start of the print
function.
6.3.1.11
26
Exit
End VarioAnalyze Explorer.
VarioAnalyze Explorer window
6.3.2
“Edit” menu
The “Edit” menu has the following options:
• Image sequence
• Change comment
The functions of the “Edit” menu are available only if the
Preview area is active (click with left mouse button in the
Preview area) or if one or more images are marked there.
6.3.2.1
Image sequence
Function to show only the selected (marked) images.
1. Mark desired images in Preview area with [Shift] + click
or [Ctrl] + click.
2. Select menu |- Edit | Image sequence -|
> Only the selected images are displayed in the Preview
area.
6.3.2.2
Change comment
Change the image comment for the selected IRB image.
The image comment can be displayed in the Analysis window, see Section 7.3.2.11 „Change comment“.
27
VarioAnalyze Explorer window
6.3.3
“View” menu
The “View” menu has the following options:
• Settings
• Toolbar
• Status bar
6.3.3.1
Settings
Select properties for the display in the Explorer window.
Palette for IRB
28
Select color palette for the Preview display.
The following palettes can be selected:
from IRB Representation of the IR image in the
color palette which is encoded in the
IRB file.
IRB is the color palette with which the
thermogram was originally taken by the
camera.
VARIOCAM Representation in the color palette of
the VarioCam
BlackWhite Gray scale representation
IronBow Color palette in the tempering colors of
steel
BlueRed Color palette from blue (low temperatures) to red (high temperatures)
MrkedBW Marked Black-White: Color palette in
gray scale representation with color
marking of high temperatures (red) and
low temperatures (blue)
Rainbow
Color palette in the colors of the rainbow
Further options:
Next
Display in the next color palette of the
list
VarioAnalyze Explorer window
Invers
Inverts the representation in the current
color palette
Thumbnails
Select representation (of the thermograms in the selected
directory) in the Preview area.
The following options are possible:
text only: Thermograms will get shown with their filename,
date, file type, camera type and pixel resolution in a list
form. No preview images are shown.
small: display small Preview images.
large: display large Preview images.
Sort by
Sort the display in the Preview window.
Possible sort criteria:
• Filename
• Filename, reverse
• File type
• File type, reverse
• Time upward
• Time downward
6.3.3.2
Toolbar
Display or hide VarioAnalyze Explorer toolbar.
For a description of the icons of the toolbar, see Section 6.2
“Toolbar in the VarioAnalyze Explorer window”.
6.3.3.3
Status bar
Display/hide VarioAnalyze Explorer status bar.
29
VarioAnalyze Explorer window
A check mark before the menu bar indicates whether the
status bar is displayed.
The status bar displays information in 5 fields of different
sizes from left to right:
Field 1
• Description of the menu function which is currently
marked if you move the cursor through the menus using
the arrow keys of the keyboard
• If available, a description of the function of the printed
icon in the toolbar
• If an image is marked (selected) in the Preview area, the
associated filename.
Field 2
Date and time most recently marked image was taken. The
information remains even if another directory has already
been opened in the directory tree.
Fields 3 to 5
CAP
Caps lock key is pressed.
NUM
Num lock key is pressed.
SCRL
Scroll lock key is pressed.
6.3.4
“Help” menu
The “Help” menu has the following options:
• Help
• About VarioAnalyze
30
6.3.4.1
Help
Call up Help file.
6.3.4.2
About VarioAnalyze
Display copyright and version information.
VarioAnalyze Analysis window
7 VarioAnalyze Analysis window
7.1
Structure and function of Analysis window
The Analysis window
• Allows investigation of the open thermal image and displays its properties
• Makes it possible to produce, edit and print analysis reports.
1
2
3
4
5
6
7
Fig. 7-1
Menu and icon bar
Open image
Shapes (ellipse, rectangle)
Comment bar and parameter bar
Temperature profile
Temperature scale
Table of measurement results
VarioAnalyze Analysis window
31
VarioAnalyze Analysis window
From the Analysis window, depending on the selected function, other windows are opened as required (e.g. Report
window).
Menu and icon bar
For a description of the menus, see Section 7.3 “Menu description in the Analysis window”.
For a description of the icons, see section 7.2 “Toolbar in
the Analysis window“.
Image display
Thermal image representation in selected color mode and
with current temperature profiles
Right click in the image to open a flyout menu with the options
Save As
Store the image as a new file (e.g. in
IRB, JPG, BMP, ASC formats; see Section
7.3.1.3 “Save as”)
Copy
Copy the current window content to
the Clipboard. It is then possible to insert it into other application programs.
Print
Print the current image; opens the Windows print window (see Section 7.3.1.4
“Print”)
32
Shapes (ROIs)
Regions-of-interest (ROI = shape) which are drawn in for
evaluation of an image. For each shape, the measurement
results are listed in a table below the image, see Item 7 in
this figure.
VarioAnalyze Analysis window
Comment bar and parameter bar
Top line: displays the comment which is stored in the image.
For displaying or hiding the comment bar, see Section 7.3.3
“’View’ menu”.
Bottom line: displays image parameters. For displaying or
hiding the command bar, see Section 7.3.3 “‘View‘ menu“.
Temperature profile
Displays the vertical and horizontal temperature profile for
the axes of the crosshair pointer. The crosshair pointer appears, and its position can be set, if the “Profile” function
has been called. See Section 7.3.3 “’View’ menu”.
Temperature scale
Displays the temperature scale in the colors of the current
color scale.
For displaying or hiding the temperature scale, see Section
7.3.3.2 “Show temperature scale”.
Right click on the scale to open a window to edit the scale
limits and color palette, see also Section 7.3.4.1 “Limits”.
Table of measurement results
Displays the measurement results if shapes (shapes = ROIs =
regions-of-interest) are drawn into the IR image.
ROI
Name and coordinates, see Section
7.3.4 “’Thermogram’ menu”
Avg
Average temperature
Min
Minimum
Max
Maximum
Sdv
Standard deviation
Eps
Emissivity
33
VarioAnalyze Analysis window
To correct/edit the measured values:
– Click on the table with the right mouse button
> A separate window with the table of measured values opens.
In this window, it is possible to save, load and delete
shapes and change correction values (globally / for
individual shapes). See Section 7.3.5 “’Measure’
menu”.
34
VarioAnalyze Analysis window
7.2
Toolbar in the Analysis window
Icons
The icons are used to operate the software quickly using
the mouse. The functions which they represent can also be
reached via the menus of the Analysis window. In the menu
description of the Analysis window, you will find the icon
corresponding to each menu item.
Open
Open new IRB file. VarioAnalyze displays the “Open” Windows dialog window. See Section 7.3.1.1 “Open”.
Save as ...
Store the current IRB image. VarioAnalyze displays the “Save
As” dialog window. See Section 7.3.1.3 “Save as”.
Print preview
Print current view of open image. VarioAnalyze opens a
print preview window after again confirming the Windows
print window. See Section 7.3.1.5 “Print preview”.
Previous image
Opens the previous IRB image which is stored in the same
directory (paging through a sequence). See Section 7.3.4.13
“Previous”.
Next image
Opens the next IRB image which is stored in the same directory (paging through a sequence). See Section 7.3.4.12
“Next”.
ZoomDisplay next smaller representation (zoom out)
Zoom+
Display next larger representation (zoom in)
35
VarioAnalyze Analysis window
Set the selection
Set the selection window. See Section 7.3.2.7 “Set selection”.
Profile
Display vertical and horizontal temperature profile (for the
axes of the crosshair pointer which appears), see also Section 7.3.3.3 “Profile”.
Minimum
Display minimum temperature in image
Maximum
Display maximum temperature in image
Point
Set temperature measuring point. A shape in the form of a
point can be set anywhere in the image.
Line
Set temperature measuring line. A shape in the form of a
line can be set anywhere in the image.
Rect
Rectangle: Set rectangular temperature measuring area. A
shape in the form of a rectangle can be set anywhere in the
image.
Circle
Set circular temperature measuring area. A shape in the
form of a circle can be set anywhere in the image.
Ellipse
Set elliptical temperature measuring area. A shape in the
form of an ellipse can be set anywhere in the image.
36
VarioAnalyze Analysis window
Polygon
Set temperature measuring area of arbitrary form. A shape
of arbitrary form can be set anywhere in the image. The
outline of the shape is generated by clicking on the desired
positions. The drawing of the polygon is ended by a double
click or right click on the starting point.
Show VIS
Shows the digital photo (visible image) of the current IR image in a separate window (see also Section 7.3.3.6 “Visible
image”).
Play audio
Plays the audio information for the image (available only if
an audio recording exists).
Combo boxes
The following combo boxes are integrated into the toolbar
of the Analysis window:
Set zoom
Select enlargement of the display
Change palette
Select color palette, see Section 7.3.4.1 “Limits”.
Temperature unit
Select unit for the temperature display, see Section
7.3.4.2 “Units”.
37
VarioAnalyze Analysis window
7.3
7.3.1
Menu description in the Analysis window
“File” menu
The “File” menu has the following options:
• Open
• Save
• Save as
• Print
• Print preview
• Print setup
• Exit
7.3.1.1
Open
7.3.1.2
Save
Store the current image under the same name and in the
same directory. The existing file is overwritten.
7.3.1.3
Save as
Open an existing IRB image in the Analysis window.
Save the current IRB image under a new name, in a different
format (e.g. JPG, BMP, ASC) and/or under a different path.
> The “Save as” window opens.
In the “Save as” window:
1. Enter the filename and path
2. Click on [Save]
> The file is saved.
> The display in the Preview area of the Explorer window is updated only after the „Refresh directories“
function has been executed, see Section 6.3.1.7 „Refresh directories“.
38
VarioAnalyze Analysis window
7.3.1.4
Print
Print the current image.
> The Windows print window opens.
– Alternatively, you can reach this function by clicking
on the thermogram with the right mouse button and
choosing “Print” in the flyout menu.
In the Windows print window:
1. Select printer and make settings for the selected printer
2. Click on [OK]
> The image is printed.
7.3.1.5
Print preview
Print the current image in the current Analysis display window.
> A print preview is opened.
39
VarioAnalyze Analysis window
Fig. 7-2
Print preview for image printing in Analysis window
Function buttons in the Print Preview window
[Print]
Start printing
[Next Page]
Change to next page (only if there are
multiple pages)
[One Page / Two Pages]
Display one page / two pages simultaneously
[Zoom In]
Zoom into image (enlarge representation)
[Zoom Out]
Zoom out of image (reduce representation)
[Close]Close print preview
40
VarioAnalyze Analysis window
To print the image:
1. Click on [Print]
> The Windows print window opens.
2. Select printer, make settings for paper size, orientation,
color options etc.
3. Click on [OK]
> The image is printed.
7.3.1.6
Print Setup
Select the printer and printer connection for VarioAnalyze.
Define printer settings.
> The Windows print window is opened.
In the Windows print window:
1. Select printer, make settings for selected printer, e.g.
paper size, orientation, color options etc.
2. Click on [OK]
> The settings are accepted as default settings for VarioAnalyze and called up at every start of the print
function.
7.3.1.7
Exit
Close VarioAnalyze analysis window, end program. If appropriate, there is a safety query with the option of storing
changes (measurement results table, report).
41
VarioAnalyze Analysis window
7.3.2
“Edit” menu
The “Edit” menu has the following options:
• Undo
• Copy
• Copy selection
• Copy measurement results
• Copy measurement results ASCII
• Copy to report
• Set selection
• Mirror
• Rotate
• Filter
• Change comment
7.3.2.1
Undo
Undo previous action (if possible).
This function is available only if an action which can be undone has taken place. The name of the function varies depending on what the last action was. It changes to “Can’t
Undo” if the last action cannot be undone.
The following actions can be undone:
• mirroring
• rotations
• applying filter
7.3.2.2
42
Copy
Copy current Analysis window view to the Clipboard.
> Any contents which were previously stored in the
Clipboard are overwritten.
VarioAnalyze Analysis window
7.3.2.3
Copy selection
Copy the content of the selection area to the Clipboard.
The function is available only if a selection area is marked.
For marking a selection area, see Section 7.3.2.7 „Set selection“.
The data from the Clipboard can be imported into other
applications.
7.3.2.4
Copy measurement results
Copy table with measured values as metafile (graphic) to the
Clipboard.
The function is available only if measured values are displayed in the current view.
A measured value table is displayed if shapes (ROI) are defined in the Analysis view (using the Point, Line, Rect, Circle,
Ellipse, Polygon functions). See Section 7.3.4 “’Thermogram’ menu”.
For copying the measured values as text (ASCII), see Section
7.3.2.5 “Copy measurement results ASCII”.
7.3.2.5
Copy measurement results ASCII
Copy table with measured values as ASCII data (text only)
to the Clipboard. This copy function is particularly recommended if the contents of the measured value table are to
be evaluated or displayed using a spreadsheet program (e.g.
Excel, Origin).
The function is available only if measured values are displayed in the current view.
A measured value table is displayed if shapes (ROI) are defined in the Analysis view (using the Point, Line, Rect, Circle,
Ellipse, Polygon functions). See Section 7.3.4 „‘Thermogram‘ menu“.
For copying the measured values in graphic format (metadata), see Section 7.3.2.4 „Copy measurement results“.
43
VarioAnalyze Analysis window
7.3.2.6
Copy to report
Copy current window content into open Report window.
The function is available only if a Report window is open
and at least one graphic field is free in it. The image is copied to the first free graphic field of the Report form.
To open a Report window, use the functions “Create new
report” or “Open existing report”, see Section 7.3.8 “Report”.
7.3.2.7
Set selection
Create a selection area in the image.
The selection is independent of any shape, and can be
marked in addition to shapes. The selection area can be
used to define the temperature scale or copied to other applications via the Clipboard, see also Sections 7.3.4.1 “Limits” and 7.3.2.3 “Copy selection”.
A check mark before the menu bar and the printed icon
indicate whether the function is activated.
To create a selection:
1. With the function activated, click with the left mouse
button on the starting point of the desired selection rectangle in the IR image.
2. Keep the mouse button pressed and drag to the desired
end point.
3. Release the mouse button.
The outline of the selection rectangle is drawn by dragging.
To remove a selection:
– Click again on the menu option or icon.
44
VarioAnalyze Analysis window
7.3.2.8
7.3.2.9
Mirror
Mirror the image.
horizontal
vertical
Rotate
Rotate the image.
Left 90°
Right 90°
180°
Mirror on the horizontal center axis
Mirror on the vertical center axis
Rotates the image by 90° to the left
around its center.
Rotates the image by 90° to the right
around its center.
Rotates the image by 180° around its
center.
7.3.2.10
Filter
Filter function to smooth the image and remove thermal
noise. The function always acts on the whole IR image.
Clean
Filter function: Image cleaning. The
function can be applied several times to
optimize the cleaning.
Original
Restore original image.
7.3.2.11
Change comment
Edit image comment
> The “Change comment” window opens.
“Change comment” window
Fig. 7-3
45
VarioAnalyze Analysis window
To change the image comment:
1. Click with the left mouse button in the text field, mark
text
2. Enter new comment
3. To confirm, click on [OK]. To cancel, click on [Cancel].
> The changed comment is stored. The current comment is displayed in the Analysis window if the
“Comment” function is active, see Section 7.3.3
“’View’ menu”.
46
VarioAnalyze Analysis window
7.3.3
“View” menu
The “View” menu has the following options:
• Show measurement results
• Show temperature scale
• Profile
• Comment
• Parameters
• Visible image
• Toolbar
• Status bar
7.3.3.1
Show measurement results
Hide measured value table.
The measured value table is shown for each drawing of a
shape (ROI) in the IR image, under the thermogram (under
the displayed profile if any). This table can be hidden using
the “Show measurement results” function. It is automatically displayed again when a new shape (ROI) is drawn.
Measurement results for three different shapes (ROI)
Fig. 7-4
Meanings:
ROI
Avg
Min
Max
Sdv
Eps
Name and coordinates of shape (ROI =
region-of-interest), see 7.3.4 “’Thermogram’ menu”
Average temperature
Minimum temperature
Maximum temperature
Standard deviation
Emissivity
47
VarioAnalyze Analysis window
To edit/correct the measured values and parameters:
– Click on the table with the right mouse button.
> A separate window with the measurement results
opens, see Section 7.3.5 “’Measure’ menu”.
7.3.3.2
Show temperature scale
Display/hide temperature scale.
The temperature scale in the selected color palette is displayed at the right-hand edge next to the IR image.
A check mark before the menu bar indicates whether the
function is activated.
To edit/correct the temperature scale, click on the scale with
the right mouse button. A separate window for editing
opens, see also Section 7.3.4 “’Thermogram’ menu”.
7.3.3.3
Profile
Display/hide temperature profiles for marked axes.
A check mark before the menu bar indicates whether the
function is activated.
After the function is selected:
1. When the function is called up, a crosshair pointer appears below the mouse pointer.
2. Using this crosshair pointer, define horizontal and vertical
axes for the temperature profile in the image and click
on the desired position (intersection point of the axes).
> The temperature profile axes (horizontal, vertical) are
defined and displayed.
7.3.3.4
48
Comment
Display/hide image comment.
The comment which is stored in the image is displayed in
the first cell below the IR image.
A check mark before the menu bar indicates whether the
function is activated.
VarioAnalyze Analysis window
For changing/editing the image comment, see Section
7.3.2.11 “Change comment”.
7.3.3.5
Parameters
Display/hide image parameters.
The parameters are shown below the IR image (below the
comment line if any).
A check mark before the menu bar indicates whether the
function is activated.
The following parameters can be displayed:
• Transmissivity
• Emissivity
• Filename
• Time
• Date
• Ambient temperature
• Camera
• Zoom
• Path temperature
• Distance
• Absorption
For selecting/changing the parameters, see Section 7.3.7.1
“Options”.
7.3.3.6
Visible image
Open Visible Image (VIS) in separate window.
This function is available only if a digital photo (Visible Image) for the open IRB image exists. The digital photo (Visible
Image, VIS) can either be stored in the IRB, or exists as a
bitmap (BMP) with the same name as the IRB in the same
directory.
49
VarioAnalyze Analysis window
50
7.3.3.7
Toolbar
Display/hide toolbar in the Analysis window.
A check mark before the menu bar indicates whether the
Toolbar is displayed.
For an explanation of the icons of the toolbar, see Section
7.2 “Toolbar in the Analysis window”.
7.3.3.8
Status bar
Display/hide status bar in Analysis window.
A check mark before the menu bar indicates whether the
status bar is displayed.
The status bar displays information in 8 fields of different
sizes from left to right:
Field 1
• For navigation in the image: current cursor position in
image (pixel) and associated temperature value
• For navigation in the menu: description of the menu
function which is currently marked if you move the cursor through the menus using the arrow keys of the keyboard
• If available, a description of the function of the printed
icon in the toolbar
Field 2
Date and time image was taken.
Field 3
Name of camera which was used to take the image.
Field 4
Serial number of thermogram in current image directory.
Data: serial number (total number).
Field 5
Not used
Fields 6 to 8
CAP
Caps lock key is pressed.
NUM
Num lock key is pressed.
SCRL
Scroll lock key is pressed.
VarioAnalyze Analysis window
7.3.4
“Thermogram” menu
The “Thermogram” menu has the following options:
• Limits
• Units
• Grid setting
• Temperature Matrix
• Isotherms
• Point
• Line
• Rect
• Circle
• Ellipse
• Polygon
• Next
• Previous
7.3.4.1
Limits
Define temperature limits and palette.
> The “Select limits and palette“ window opens.
– Alternatively, open the “Select limits and palette” window with a right mouse click on the temperature scale
(color scale) in the Analysis window.
“Select limits and palette” window
Fig. 7-5
“Setup limits” area
Possible settings for the temperature scale:
Direct
Specify temperature scale manually:
Define “Level” and “Range” using the
51
VarioAnalyze Analysis window
scrollbar, or enter values in the input
field. Confirm and apply by clicking on
[Apply].
Min/Max
Temperature scale is defined by minimum and maximum in the image
Min/Max selection
The temperature scale is defined by
minimum and maximum in the current
selection area. To use this function, a
selection must be marked. To mark a
selection area, use the function 7.3.2.7
“Set selection”.
Calib range
The calibration range of the camera is
used as the temperature scale. The calibration range is encoded in the header
of the IRB file.
From IRB
“Level” and “Range” are set to the
same values as at the instant when
the thermogram was taken using the
camera. The values are encoded in the
header of the IRB file.
“Select palette” area
Select the color palette for the temperature scale from the
combo box:
VARIOCAM
Representation in the color palette of
the VarioCam
BlackWhite
Gray scale representation
IronBow
Color palette in the tempering colors of
steel
BlueRed
Color palette from blue (low temperatures) to red (high temperatures)
MrkedBW
Marked Black-White: Color palette in
gray scale representation with color
marking of high temperatures (red) and
low temperatures (blue)
52
VarioAnalyze Analysis window
Rainbow
Steps
invers
Color palette in the colors of the rainbow
Define number of color steps
Invert selected color palette
7.3.4.2
Units
Define temperature and length units for image representation in the window.
> The “Select units” window opens.
“Select units” window
Fig. 7-6
Temperature
Possible temperature units:
• Celsius
• Kelvin
• Fahrenheit
Distance
Possible length units:
• Meter
• Foot
53
VarioAnalyze Analysis window
7.3.4.3
Grid settings
Place the measuring grid on the IR image.
Measuring grids can be used to simplify the structure of the
image contents and for thermal categorization of thermogram areas.
> The “Grid settings” window opens.
“Grid settings” window
Fig. 7-7
In the “Grid settings” window:
1. Activate “Show grid” function, to show IRB images in
the Analysis window with measuring grid.
2. Define measuring grid properties:
Line distance
Distance between vertical grid lines,
in pixels
Column distance Distance between horizontal grid
lines, in pixels
Solid/dashed line Choice of solid and dashed grid lines
Font selection
Font and size for temperature data
Color selection
Color for grid and font
3. To display temperature values in each grid cell, select the
desired options:
Average temperature
Minimum temperature
Maximum temperature
54
VarioAnalyze Analysis window
Fig. 7-8
Representation of an IR image with grid, and giving the average
temperature in each grid cell
7.3.4.4
Temperature Matrix
Open the temperature matrix for the current image. The
temperature for each individual point of the image is given
in a table.
> The window “imagename.irb – Temperature matrix”
opens.
55
VarioAnalyze Analysis window
Fig. 7-9
“Temperature matrix” window
The window offers the following menu functions:
“File” menu
Save as
Save current temperature matrix as
ASCII file
Print
Print current temperature matrix
Exit
Close “Temperature matrix“ window
“Edit” menu
Copy
Copy ASCII
Mirror
Rotate
56
Store the current visble part of the temperature matrix as image in the Clipboard (metafile)
Store current temperature matrix as text
file in the Clipboard (ASCII, e.g. for import into Microsoft Excel)
Mirror temperature matrix (vertically/
horizontally)
Rotate temperature matrix (left 90°/
right 90°/180°)
VarioAnalyze Analysis window
7.3.4.5
Isotherms
Show isotherms. You can define a maximum of 10 isotherms for each image.
> The “Isotherms” window opens.
Fig. 7-10
“Isotherms” window
1. Specify the following properties for each isotherm:
Minimum temperature
Maximum temperature
Color
2. Click on “Apply” to confirm the entry for the isotherms
you have just defined.
3. To display the isotherms in the current image, activate
the “Active” function.
7.3.4.6
Point
Draw a measuring area (shape) in the form of a point.
To change the shape properties (position, name, emissivity),
see Section 7.4.1 “Thermogram: Edit shapes”.
7.3.4.7
Line
Draw a measuring area (shape) in the form of a line.
To change the shape properties (position, size, name, emissivity), see Section 7.4.1 “Thermogram: Edit shapes”.
57
VarioAnalyze Analysis window
58
7.3.4.8
Rect
Rectangle: Draw a measuring area (shape) in the form of a
rectangle.
To change the shape properties (position, size, name, emissivity), see Section 7.4.1 “Thermogram: Edit shapes”.
7.3.4.9
Circle
Draw a measuring area (shape) in the form of a circle.
To change the shape properties (position, size, name, emissivity), see Section 7.4.1 “Thermogram: Edit shapes”.
7.3.4.10
Ellipse
Draw a measuring area (shape) in the form of a ellipse.
To change the shape properties (position, size, name, emissivity), see Section 7.4.1 “Thermogram: Edit shapes”.
7.3.4.11
Polygon
Draw a measuring area (shape) in arbitrary form. The drawing of the polygon is ended by a double click or right click
on the starting point.
To change the shape properties (position, size, name, emissivity), see Section 7.4.1 “Thermogram: Edit shapes”.
7.3.4.12
Next
Display next IRB image.
The next IRB image in the current directory is displayed.
7.3.4.13
Previous
Display previous IRB image.
The previous IRB image in the current directory is displayed.
VarioAnalyze Analysis window
7.3.5
“Measure” menu
The “Measure” menu has one option:
• Measurement results
7.3.5.1
Fig. 7-11
Measurement results
Display measurement results for shapes (ROI).
> A separate window with the table representation of
the measurement results for all shapes opens.
“Measurement results” window
The buttons open the following functions:
[Delete]
Delete marked shapes (ROI).
To delete, confirm the safety query.
[Correction]
Opens the dialog “Correction definitions”, see Section 7.3.6 “’Correction’
menu”.
[Save]
Saves the position and properties of the
current shapes (ROIs) as a *.roi file.
The filename can be freely chosen.
[Load]
Opens a *.roi file and sets the stored
ROIs in the current image.
Close the window by clicking on [x].
59
VarioAnalyze Analysis window
7.3.6
“Correction” menu
The “Measure” menu has one option:
• Definition
7.3.6.1
Definition
Correct values which affect the measurements (e.g. ambient
temperature, emissivity, transmissivity etc.).
> The “Correction definitions” window opens.
The window has two tabs:
• Global
• Shapes
“Global” tab
Define correction definitions for the whole current image.
Fig. 7-12
60
“Correction definitions” window, “Global” tab
VarioAnalyze Analysis window
In the “Correction definitions” window, “Global” tab:
1. On this tab, correct (if required, corresponding to the
actual conditions when the image was taken):
Emissivity
Ambient temperature
Path temperature
Transmissivity
2. Alternatively to direct entry, you can also calculate the
transmissivity of the object environment by entering the
values for “distance” and “absorption” and copy this
value by clicking on [Get Transmissivity].
3. Click on [Apply] to apply the entries.
> The image display in the Analysis window is immediately updated.
4. Change to the “Shapes” tab
“Shapes” tab
Define correction definitions for each shape individually.
Fig. 7-13
“Correction definitions” window, “Shapes” tab
61
VarioAnalyze Analysis window
1. Select a line (shape)
2. Click on [Edit] (alternatively: double-click on the Shape
line)
> The Edit dialog opens (“Edit correction definitions
shapename” window)
Fig. 7-14
“Edit correction definitions” window
In the “Edit correction definitions” window:
3. Correct the data (as for the “Global” tab) and confirm
with [OK]
> The image display in the Analysis window is immediately updated.
4. Close the window by clicking on [x]
62
VarioAnalyze Analysis window
7.3.7
“Extras” menu
The “Extras” menu has the following options:
• Options
• Arrange icons
7.3.7.1
Options
Select settings and program options.
> “Options” window opens
The “Options” window has three tabs:
• Generally
• Parameter
• Global Properties
“Generally” tab
Do settings for representation in the Analysis window.
Fig. 7-15
“Options” window: “Generally” tab
63
VarioAnalyze Analysis window
The options have the following meaning:
Temperature presentation
Number of digits after decimal point for
measured temperature values
Number of last used thermograms
ROIs font
Font for the shape (ROI) name
Comment font
Font in the comment and parameter
line
Background
Background color in the window
Profiles backgroundBackground color for temperature profile representation
“Parameters” tab
Select the parameters which are to be displayed in the parameter line.
Fig. 7-16
“Options” window: “Parameters” tab
The following parameters can be selected:
• Transmissivity
• Emissivity
• Filename
• Time
• Date
64
VarioAnalyze Analysis window
•
•
•
•
•
•
Ambient temperature
Camera
Zoom
Path temperature
Distance
Absorption
“Global Properties” tab
Copy properties from the previously opened image.
This option is useful, for instance, if you have recorded a
series of measurements in approximately constant conditions and want to correct all images of this series with the
same parameters.
Fig. 7-17
“Options” window: “Global Properties” tab
You can copy the following parameters from the previous
image:
• Emissivity
• Ambient temperature
• Path temperature
• Transmissivity
65
VarioAnalyze Analysis window
The marked parameters are not changed when a new IRB
image is opened. VarioAnalyze retains the associated values
from the previous image.
7.3.7.2
Fig. 7-18
Arrange icons
Display/hide icons in the toolbar.
> The “Select toolbar icons“ window opens.
“Select toolbar icons” window
To display icons:
1. Mark the icons which are to be displayed in the toolbar.
2. Confirm with [OK].
To cancel, click on [Cancel].
66
VarioAnalyze Analysis window
7.3.8
“Report” menu
The “Report” menu has the following options:
• Create new report
• Open existing report
7.3.8.1
Create new report
Create new report.
> “Select template” window opens
To create a report, you can choose between predefined templates (3 A4, 3 US letter formats) and open your own previously stored templates (*.tpl).
For preselection of templates, the “Select template” window has 3 tabs:
• A4 templates
• US letter templates
• Own templates
Fig. 7-19
“Select template” window: “A4 templates” tab
67
VarioAnalyze Analysis window
In the “Select template” window:
1. Select the tab which corresponds to the format you
want.
2. Click on the template you want.
> The “VarioAnalyze basic report” window opens the
template.
3. For editing and saving a report, see Section 8 “Create
report: Report window”.
7.3.8.2
Open existing report
Open existing report.
The report must previously have been stored in VarioAnalyze
report format *.rep.
> The Windows “Open” window opens.
In the “Open” window:
1. Select path and filename
2. Click on “Open”
> The report is opened in the “VarioAnalyze basic report” window.
3. For editing and saving the report, see Section 8 “Create
report: Report window”.
68
VarioAnalyze Analysis window
7.3.9
“Help” menu
The “Help” menu has the following options:
• Help
• About VarioAnalyze…
7.3.9.1
7.3.9.2
Help
Open VarioAnalyze Windows help.
About VarioAnalyze…
Display copyright information about the software and the
version number of your copy of VarioAnalyze.
69
VarioAnalyze Analysis window
7.4
Direct access with right mouse click
The right mouse click on various objects of the Analysis
window makes possible fast, convenient access to functions, some of which can also be reached via the menu. This
section summarizes the essential functions which can be
reached by a right click:
• Edit shapes in a thermogram (change size, position)
• Edit temperature limits and color palette of a thermogram representation
• Save, copy and print the content of the Analysis window
(thermogram with displayed measured values, color palette etc.)
7.4.1
Thermogram: Edit shapes
If you have drawn shapes (ROIs) into the image to evaluate your thermogram, you have the option of changing the
properties of each individual shape subsequently.
Proceed as follows:
1. In the Analysis window, click with the right mouse button on the label of the shape to be corrected (e.g. R1)
> The “Change properties for shapename” window
opens.
70
VarioAnalyze Analysis window
Fig. 7-20
“Change properties for shapename” window
2. Correct the properties of the shape by using the scroll
bars or by entries in the text fields:
Position
Label position
Size
Name
Emissivity
> You can observe the result in the image immediately
if you place the “Change properties” window appropriately on your screen.
71
VarioAnalyze Analysis window
Fig. 7-21
Image in the Analysis window for editing a shape
3. Activate the “Show minimum” and/or “Show maximum” options if the minimum and/or maximum temperatures within the shape are to be displayed.
4. Confirm the settings by clicking on [Apply].
To delete the selected shape:
– Click on the [Delete] button in the “Change properties
for shapename” window.
> The shape is removed.
Close the window by clicking on [x].
72
VarioAnalyze Analysis window
7.4.2
Change limits and color palette
To change the temperature limits and the color palette for
your current thermogram in the Analysis window, use the
following function:
– Click with the right mouse button on the temperature
scale (color scale) in the Analysis window.
> The “Select limits and palette“ window opens.
Fig. 7-22
“Select limits and palette” window
For the description of the options and settings in the “Select
limits and palette” window, see Section 7.3.4.1 “Limits”.
73
VarioAnalyze Analysis window
7.4.3
Save, print, export thermograms
Clicking with the right mouse button directly on the thermogram of the Analysis window opens a flyout menu with
these options:
Save As
Save IRB files (see Section 7.3.1.3 “Save
as”)
Copy
Copy the current window content to
the Clipboard. It is then possible to insert it into other application programs.
Print
Print the current image. Selecting the
function opens the Windows print window (see Section 7.3.1.4 “Print”)
74
Create report: Report window
8 Create report: Report window
The report function makes it possible to summarize the
analysis and evaluation of your thermograms clearly and
uniformly, and to save them.
The Report window “VarioAnalyze basic report” opens after
one of the two options in the “Report” menu of the Analysis window is called up:
|- Report | Create new report -| or
|- Report | Open existing report -|
(See Section 7.3.8 “’Report’ menu”).
8.1
Structure and function of the Report window
The “VarioAnalyze basic report” window opens either an
empty report template or an existing report to be edited and
saved.
Each template has predefined report elements: text and
graphic fields.
75
Create report: Report window
76
Fig. 8-1
“Report” window
Text field: Enter text directly
Graphic field: Include images from the VarioAnalyze Analysis window or from another file
Create report: Report window
8.1.1
Edit report fields
– Click with the left mouse button in the report field.
> In a text field, the cursor flashes and you can write
immediately.
> In a graphic field, at first you see no reaction. To
insert a graphic, use the “Change properties of a
report field” function (see following Section 8.1.2
“Changing the properties of a report field and importing images”) or the menu option |- View | Copy
to report -|.
8.1.2
Changing the properties of a report field and
importing images
1. Click with the right mouse button on the report field of
which you want to change the properties.
> The “Setup report element property” window opens.
Depending on whether the field is defined as a text
or graphic field, the relevant options can be selected.
77
Create report: Report window
Fig. 8-2
“Setup report element property” window for a text field
2. To change the field format, activate “Text” or “Graphic”.
> The associated options become available.
You can import images directly from the Analysis
window into a graphic field.
A text field has the following options:
Font selection
Define font
Set date
Copy today’s date
Set page no.
Copy current number of pages (format:
page X (Y))
multiline
If active (check mark): allow multiline
text
A graphic field has the following options:
Alignment
Image alignment in field: left, center,
right
78
Create report: Report window
Load view
Insert view of the Analysis window (IRB
image and table of measurement results, if displayed)
Load image
Insert IRB image from Analysis window
Measurement results
Insert table of measurement results
(metafile). Import is possible only if
shapes are marked in the IRB image.
Load file
Load image file (e.g. logo). The Windows „Open“ window then opens.
Supported image formats: .irb, .bmp,
.pcx, .jpg.
The following option is always available:
Delete
Delete current field content
8.2
Menu description in the Report window
The Report window has the following menus:
• File
• Edit
• View
8.2.1
“File” menu
In the “File” menu, you will find the following options:
• Open
• Save
• Save as
• Save template as
• Send
• Print preview
• Print
• Exit
79
Create report: Report window
80
8.2.1.1
Open
Open existing report.
8.2.1.2
Save
Save the current report in VarioAnalyze report format
(*.rep).
The report which is saved in internal format can be edited
again in VarioAnalyze at any time.
8.2.1.3
Save as
Save current report.
Possible formats are:
REP
VarioAnalyze internal format; allows
subsequent editing in VarioAnalyze
HTML
Web browser format; subsequent editing in VarioAnalyze is not possible
8.2.1.4
Save template as
Save template in current design (format: .rep)
8.2.1.5
Send
Start email client (if available), open a new email and append the current report to it as an attachment (name: report.rep).
8.2.1.6
Print preview
Display print preview of current report.
8.2.1.7
Print
Open Windows print window to print current report.
8.2.1.8
Exit
Close Report window. Before the current report is closed, if
appropriate you have the option of saving it.
Create report: Report window
8.2.2
“Edit” menu
In the “Edit” menu, you will find the following options:
• Copy the page
• Add page
• Delete page
8.2.2.1
Copy the page
Save the current report in the Clipboard.
You thus have the possibility of inserting the report into other application programs (e.g. Microsoft Word) and to save it
in their formats (e.g. *.doc).
8.2.2.2
Add page
Add a page to the current report.
The format of the new page is copied from the current template.
8.2.2.3
Delete page
Delete current report page.
81
Create report: Report window
8.2.3
“View” menu
In the “View” menu, you will find the following options:
• Next page
• Previous page
• Change the template
82
8.2.3.1
Next page
Display the next page in the open report.
8.2.3.2
Previous page
Display the previous page in the open report.
8.2.3.3
Change the template
Closes the current report; if appropriate you have the option
of saving the report.
Then opens the „Select template“ window to select a new
template, see also Section 7.3.8.1 „Create new report“.
General procedure for image evaluation
9 General procedure for image evaluation
This section is intended to give you a brief overview of the
flow of an image evaluation, and presents the typical sequence of the individual steps. A method of working which
may differ from this is equally justifiable, and may lead the
user to the objective just as surely. Also, it will not be necessary in all cases to carry out all the operations which are
explained here.
Prerequisite
The IR images are stored in one directory (e.g. |- thermograms -|) on your system.
Image evaluation using VarioAnalyze
1. Start the VarioAnalyze software, and select the directory
with the stored thermograms (e.g. |- thermograms -|).
See Section 5.1 “Start program”.
> The VarioAnalyze Explorer window opens, and shows
the images which are held in the directory in the Preview area.
See Section 6 “VarioAnalyze Explorer window”.
2. Open the IRB image you want by double-clicking on the
preview.
3. Using the toolbar icons “Previous” and “Next”, display
the images from the directory in succession in the Analysis window (search directory).
See Section 7.2 “Toolbar in the Analysis window”.
4. Adjust temperature scale
See Section 7.3.4.1 “Limits”.
5. Draw the shapes (ROIs) you want in the current image.
Use the toolbar icons in the Analysis window.
See Section 7.2 “Toolbar in the Analysis window”.
83
General procedure for image evaluation
6. Correct measurement results/evaluation:
Global: for the whole image.
Shape: For each shape individually.
See Section 7.3.6 “’Correction’ menu”.
7. Save, copy, print, export etc. measurement results/evaluation
See Section 7.3.1 “’File’ menu”.
8. Generate report.
See Section 8 “’Create report: Report window”.
84
Service and support
10 Service and support
The VarioAnalyze software is a powerful tool for managing,
analyzing and evaluating thermal images which were taken
using thermal cameras from JENOPTIK.
If you have questions or advice about the cameras or software, please consult your authorized dealer for JENOPTIK
thermal cameras, or contact us directly at:
JENOPTIK Laser, Optik, Systeme GmbH
Business unit Sensor Systems – Infrared Technology
Göschwitzer Strasse 25
07745 Jena
Germany
Phone +49 3641-65 30 29
Fax
+49 3641-65 34 94
Email [email protected]
Internet www.infraredtechnology.de
85
Service und Support
86