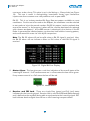
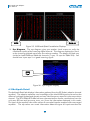
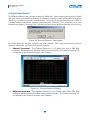
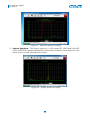
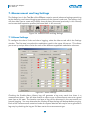
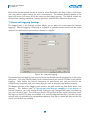
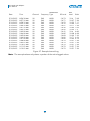
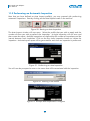
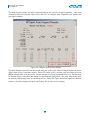
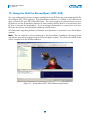
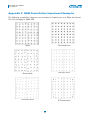
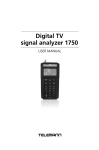
1
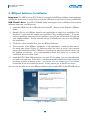
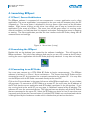
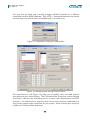
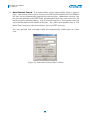
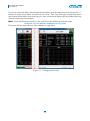
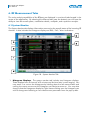
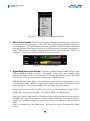
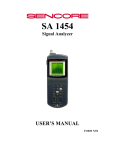
DTU-236A with RFXpert
8VSB/QAM and ASI Analysis & Monitoring Probe for USB-2
USER MANUAL
March 2015
DTU-236A with RFXpert
User Manual
Table of Contents
Revision History ................................................................................................................ 3
1. Introduction ................................................................................................................. 4
2. Specifications and Minimum Requirements .................................................................... 4
2.1 DTU-236A RF Probe ............................................................................................... 4
2.2 RFXpert Software ..................................................................................................... 5
3. RFXpert Software Installation ......................................................................................... 6
4. Launching RFXpert ....................................................................................................... 8
4.1 Client / Server Architecture ...................................................................................... 8
4.2 Launching the RFXpert............................................................................................. 8
4.3 Connecting to an RF Probe ...................................................................................... 8
4.4 Licensing the RF Probe ............................................................................................ 9
4.5 RFXpert Application General Layout ....................................................................... 11
5. Creating a Channel Plan ............................................................................................ 12
5.1 Building the Plan ................................................................................................... 12
5.2 Additional Settings ................................................................................................ 15
5.3 Selecting the Channel Plan and Channel ............................................................... 15
6. RF Measurement Tabs ................................................................................................ 17
6.1 System Monitor ..................................................................................................... 17
6.2 Modulation Detail ................................................................................................. 21
6.3 Multipath Detail .................................................................................................... 22
6.4 Spectrum Detail .................................................................................................... 24
6.5 About the RFXpert ................................................................................................. 26
7. Measurement and Log Settings ................................................................................... 27
7.1 Alarm Settings ...................................................................................................... 27
7.2 Interval Logging Settings ....................................................................................... 28
8. Snapshot ................................................................................................................... 30
9. Transport Stream Recording ....................................................................................... 31
10. Equalizer Disable ..................................................................................................... 32
11. Auto Inspect ............................................................................................................. 34
11.1 Setting the Profile ................................................................................................ 34
11.2 Performing an Automatic Inspection .................................................................... 37
12. Using the DekTec StreamXpert (DTC-320)................................................................. 40
Appendix A: RFXpert Default Values ................................................................................ 41
Appendix B: Digital Channel Power Measurement & Spectral Displays ............................. 42
Appendix C: QAM Constellation Impairment Examples ................................................... 43
2
DTU-236A with RFXpert
User Manual
Revision History
Version
1.1
1.0
Date
Changes
2015.03.17 Update with latest RFXpert application version.
2012.10.29 Initial version of this document. Update of manual for DTU-236A.
Copyright © 2015 by DekTec Digital Video B.V.
DekTec Digital Video B.V. reserves the right to change products or specifications without
notice. Information furnished in this document is believed to be accurate and reliable, but
DekTec assumes no responsibility for any errors that may appear in this material.
3
DTU-236A with RFXpert
User Manual
1. Introduction
The DTU-236A RF Probe and RFXpert software is a comprehensive package designed to
provide real-time analysis and monitoring of 8VSB, QAM Annex A, B, and C and NTSC RF
channels.
Note: QAM Annex A is equivalent to DVB-C, QAM Annex B is used in North America and
Korea, and Annex C is used in Asia
The RFXpert software is intended to be loaded by the end-user on any qualifying PC or laptop
and work in conjunction with the DTU-236A RF Probe. The RFXpert provides complete RF
analysis and logging, along with transport stream recording. Channel plans and alarms may
be custom defined by the user.
2. Specifications and Minimum Requirements
2.1 DTU-236A RF Probe
RF Input:
Connector
Frequency
Level
Modulation
NTSC Band
75 ohm type 'F’ female
47 to 1002MHz
-30 to +50dBmV
8VSB, QAM Annex A (16, 32, 64, 128 & 256),
Annex B (64 & 256) and Annex C (64 & 256)
Broadcast, FCC Cable, IRC Cable, HRC Cable
Power:
Source
Voltage
Current
USB port of host PC
+5V DC
< 500mA
Dimensions:
Physical
Weight
180x107x36mm (7.1" x 4.2" x 1.4")
< 500g (< 1lb)
Minimum PC / Laptop Requirements:
Operating System
USB
Processor
RAM
Windows XP SP3, 7, 8
2.0
Core i3 or better
1GB minimum
4
DTU-236A with RFXpert
User Manual
2.2 RFXpert Software
RF Tests:
Level
-10 to 10dBmV 0.1dB resolution +/- 1dB accuracy
-40 to -10dBmV & 10 to +50 dBmV, +/- 2dB accuracy
MER
15 to 38dB (measured from constellation)
EVM
2.3 to 16.5% RMS
BER
Pre/Post FEC, SER, Errored Seconds
Modulation Display Constellation and Eye diagram
Echo Profile
-2.3 to +40µs delay range
0 to -30dBc echo level
Spectrum Display
Channel (6/7/8 MHz), Adjacent (18/21/24 MHz),
Full (50-1000 MHz)
Logging:
Type
Auto Inspect
File
Interval and alarms
Automatic analysis and logging of a channel plan
User defined, limited by host hard drive space
5
DTU-236A with RFXpert
User Manual
3. RFXpert Software Installation
Important: The USB driver for DTU-236A is included in the RFXpert software install package.
Installation of the driver is required to provide the USB drivers and channel tuning capabilities.
USB "Thumb" Drive: Your DTU-236A RF Probe was shipped with a USB drive that contains
Software, Manuals, and Brochures.
1. Insert the USB drive into a USB port on the host PC. Browse to the Software / RFXpert
folder.
2. Double-click on the RFXpert Installer.exe application to begin the installation. For
Windows 7 right click the installer.exe and select “Run as Administrator”. If you do
not have Microsoft .Net framework installed on your PC you will be taken through the
.Net install procedure. Simply leave all settings in default and "next" your way through
the installation.
3. The Driver will be installed first, then the RFXpert Software.
4. The remainder of the RFXpert installation is self-explanatory. However, take note of
the setup type screen (Figure 2). Selecting either the client or server icon presents
options for installation of each. RFXpert is a client/server based architecture and must
be installed accordingly. It is recommended to leave this option as is, which will
install both the server and client.
5. Insert the DTU-236A USB connection into your PC or Laptop. You may be prompted
to install new hardware. If the driver is not automatically installed manually direct the
hardware installer to browse to the :\Program Files\DekTec\Drivers folder
to load the driver and install the device. It may require you to do this two times.
You will now be able to use your RFXpert software with installed DTU-236A RF/USB device.
Figure 1. RFXpert install
6
DTU-236A with RFXpert
User Manual
Figure 2. RFXpert Setup Type
Figure 3. Finishing the Install
7
DTU-236A with RFXpert
User Manual
4. Launching RFXpert
4.1 Client / Server Architecture
The RFXpert software is composed of two components: a server application and a client
application. The server application is transparent to the user and will autostart when the PC
is booted up. The server status is displayed in the tray (lower right corner) of the Windows
toolbar. Right mouse clicking on the server icon allows you to stop or restart the server
application in the event of a failure. The server icon will be green when it is running under
normal conditions, red indicates that it is stopped, and amber indicates that server is stopping
or starting. The client application provides the user interface to the RF Probe, along with all
measurements and settings.
Figure 4. Server Icon (in tray)
4.2 Launching the RFXpert
Double-click on the desktop icon created by the software installation. This will launch the
RFXpert software. This is the client software and may be run on a PC remote to the PC that is
running the server application with the RF Probe physically attached. It may also run locally.
4.3 Connecting to an RF Probe
You must now connect to a DTU-236A RF Probe to begin measurements. The RFXpert
software is laid out in a Client / Server architecture. This means that the RF Probe may be
connected to one PC, but accessed via a network connection by another PC. You may also
run the RFXpert with an RF Probe connected directly to the same PC.
Click on the Connect button in the upper left corner of the RFXpert application. A new window
will pop open. To connect to a DTU-236A on a remote PC you must enter the IP address of
the PC that has the server application and RF Probe(s) connected in the left test box. If you
are running local to the same PC you may type in "localhost" instead of the IP address. The
software will scan for connected devices. The right text box now displays all of the RF Probes
that are connected to the server PC. Select the RF Probe you desire to use (if more than one
is present) and click on the Connect button. If multiple DTU 236A’s are connected each device
is distinguished by the hardware number which matches that printed on the device.
8
DTU-236A with RFXpert
User Manual
Figure 5. Connecting to an RF Probe
4.4 Licensing the RF Probe
You may run the RFXpert software with an unlicensed RF Probe. However, you will only be
able to create channel plans and tune channels. This feature may be useful if you desire to
run the DekTec StreamXpert software, but have no need for RF measurements. To take
advantage of the full analysis capabilities of the RFXpert software, you must install a license
file.
Note: This file may have been pre-installed at the factory, in which case you will not need to
complete the following steps.
If you need to install a license to run the RFXpert, the header of the application will indicate
that it is in Limited Functionality Mode and an Activate button will be present.
Figure 6. Licensing the RF Probe Step 1
Click on the Activate button to begin the license installation process. You will receive a new
window that reports the serial number of the RF Probe. Press OK to continue.
Figure 7. Licensing the RF Probe Step 2
You will now be prompted to browse for the license file. This will be an .xml file containing
the serial number of the RF Probe you wish to license. It will be located in the License folder
9
DTU-236A with RFXpert
User Manual
of the USB thumb drive you received with the DTU-236A RF Probe. Select this file and click
Open.
Figure 8. Licensing the RF Probe Step 3
You will now receive a confirmation window if the license file was correctly applied to the RF
Probe. Click OK and the application will close; double click on the RFXpert desktop icon and
the fully licensed application will open.
Figure 9. Licensing the RF Probe Step 4
10
DTU-236A with RFXpert
User Manual
4.5 RFXpert Application General Layout
1
2
3
Figure 10. RFXpert Overview
1. Tool Bar: The top area of the RFXpert application contains all of the settings and
shortcuts that allow you to tailor the analyzer to your individual situation. It also
contains the controls for connecting and disconnecting from individual DTU-236A RF
Probes.
Some of the settings are Channel Plan, Logging, Auto Inspect, EQ Disable and TS
Recording.
2. Measurement Windows: This area displays the RF signal measurements. Using
the different tabs you may choose to view the overall RF measurements, modulation
details, multipath, and spectrum analysis.
3. Status Bar: The bottom area of the RFXpert displays the status of Receiver and FEC
lock. It also displays the current channel that is selected and provides the ability to
change channels.
11
DTU-236A with RFXpert
User Manual
5. Creating a Channel Plan
To properly utilize the RFXpert application, you must first build a channel plan. You may
create multiple channel plans for use in different locations and the channel plans may include
channels of different modulation types.
5.1 Building the Plan
Start by clicking on the Settings button in the toolbar. Now select the General tab within the
Settings window.
Figure 11. Creating a Channel Plan
1
2
Figure 12. Creating a Channel Plan 2
1. Create New Channel Plan: Use this button to manually create a channel plan.
You will be asked to provide a name for the plan and select the band (FCC Cable,
IRC, HRC, or Broadcast). All channels in the band will then be added to the plan
assuming the following modulation schemes:
- Broadcast = 8VSB
- FCC Cable = QAM 256B
- IRC and HRC Cable = QAM 256B
12
DTU-236A with RFXpert
User Manual
You may then go back and manually change individual channels to a different
modulation scheme (8VSB, QAM 64 / 256, NTSC). Unwanted channels may also be
removed from the channel plan and added back in at a later time.
Figure 13. Manually Creating a Channel Plan
Figure 14. Modifying and Saving Channel Plans
The areas boxed in red (Figure 14) allow you to modify, save, and add channel
descriptions to your channel plans. The C/N Noise Floor Frequency must be defined
to provide a reference for calculating carrier to noise ratio measurements on NTSC
channels. You should pick a frequency that has no active channel (modulation) to
serve as the measurement noise floor for your system. Each channel plan may have
a different C/N Noise Floor frequency.
13
DTU-236A with RFXpert
User Manual
2. Auto Channel Search: This button allows you to automatically create a channel
plan. You must provide a name, band, and an RF level threshold which the RFXpert
will then use to automatically populate the channel plan. Modulation scheme may
be manually defined and the RF Probe will attempt to lock onto each channel in the
band using the selected scheme. Any RF channel that has a level greater than the
specified threshold will be added to the plan. You will be prompted to enter a C/N
Noise Floor frequency if the channel plan has any NTSC channels.
You may go back and manually modify this automatically created plan at a later
time.
Figure 15. Automatic Channel Plan Creation
14
DTU-236A with RFXpert
User Manual
5.2 Additional Settings
There are three additional settings that must be defined before proceeding with RF
measurements.
1
2
3
Figure 16. Additional Measurement Settings
1. BER Options: The first step is to define the window size used for averaging /
resetting several measurements that pertain to digital modulation. Three Minutes is
the factory default window size. BER, SER, and PN-23 values are average values and
the window size determines the time frame over which the averaging is calculated.
The averaging is reset at an interval equal to the window size. Error Seconds and
Burst Error Seconds cumulative values and their counters are reset at an interval equal
to the window size.
2. Burst Error Count: Burst Error count defines how many errors must be present in
one second before a Burst Error Second count is triggered. See section 6 (figure 24)
for more detail on this measurement.
3. Level Measurement Units: Select between dBmV dBm and dBµV.
5.3 Selecting the Channel Plan and Channel
To select the desired channel plan, simply click on the channel plan (see figure 16) in the list
and select the OK button at the bottom left of the General Settings window. You will now be
returned to the main display containing the RF Measurement tabs.
15
DTU-236A with RFXpert
User Manual
To tune to a channel within the selected channel plan, go to the status bar and click on the +/buttons to move up or down one channel at a time. You may also right mouse click within
the channel information area to bring up a new window that allows you to quickly select any
channel within the channel plan.
Note: Channel Plans are saved as .cha (xml) file in the following directory path:
\Program Files\DekTec\RFXpert\xml\plans
The plans will be retained even if the software is upgraded.
Figure 17. Changing Channels
16
DTU-236A with RFXpert
User Manual
6. RF Measurement Tabs
The main analysis capabilities of the RFXpert are displayed in a series of tabs located in the
center of the application. By selecting the different tabs (near the bottom) you will have the
ability to view the overall system, modulation details, multipath, and a spectrum analysis.
6.1 System Monitor
The System Monitor tab displays information concerning the overall status of the incoming RF
channel. It also includes two histogram display and Pass / Fail / Warn indications.
5
2
4
3
1
6
Figure 18. System Monitor Tab
1. Histogram Displays: The system monitor tab includes two histogram displays.
These displays have a time axis of 5 minutes and the level axis is auto ranging. You
may zoom in or out on the histograms by holding down the left mouse button and
moving the mouse cursor over the histogram you desire to zoom on. You may also
change what the histograms display by right mouse clicking over the histogram you
wish to change and selecting a new measurement parameter from the pop-up box.
17
DTU-236A with RFXpert
User Manual
Figure 19. Changing the Histogram Display
2. RF Level Bar Graphs: The RF level bar graphs display a continuously updated level
measurements with pass (green) / fail (red) / warn (yellow) color coded thresholds for
quick diagnosis. The level thresholds are user definable. 8VSB channels will display
average channel power level and pilot level (dBc below the average channel power
level), QAM channels display average channel power level only, and NTSC will
display the video carrier level and the carrier to noise ratio.
Figure 20. RF Level Bar Graphs
3. Digital Modulation Bar Graphs: These bar graphs display the MER, Margin, and
EVM for 8VSB and QAM channels. Pass (green) / fail (red) / warn (yellow) color
coded thresholds provide for quick diagnosis. The level thresholds are user definable.
This section will be grayed out when measuring an NTSC channel.
MER (Modulation Error Ratio) is the digital equivalent of an analog signal to noise
ratio displayed in dB. MER is a ratio of signal power to the power of the impairments
within the signal. The larger the MER value, the better the signal quality.
Margin represents how far the MER value is from the threshold of visibility (TOV) /
"digital cliff". Margin equals (MER – 15.2 dB) for 8VSB. See Appendix A.
EVM (error vector magnitude) is a % RMS value that represents the amplitude ratio of
the RMS error vector amplitude to the largest symbol amplitude. This is basically how
closely the modulated digital "symbols" are received compared to the theoretical
ideal.
EVM is calculated from the MER value. The lower the value, the better the signal
quality.
18
DTU-236A with RFXpert
User Manual
Figure 21. Digital Modulation Bar Graphs
4. Digital Bit Error Display: The Digital Bit Error Display within the system monitor
tab provides bit error statistics that are averaged (or counted) over a specified time
window. Defining the window size was described in the previous section (see
Figure 12). This section is valid for 8VSB and QAM measurements, but will be grayed
out when measuring an NTSC channel. Pass (green) / fail (red) / warn (yellow) color
coded threshold indicators provide for quick diagnosis. The thresholds are user
definable.
PreFEC BER value is the Bit Error Rate expressed before any changes have been made
to the demodulated digital transport stream by the embedded Forward Error
Correction codes. This can be thought of as the raw bit errors in the digital payload.
Values lower than 1x10⁻⁶ are generally considered acceptable. Ranges from 1x10⁻⁹
(near perfect signal) to 1x10⁻³ (TOV) are typical.
PostFEC BER value is the Bit Error Rate expressed after changes have been made to
the demodulated digital transport stream by the embedded Forward Error Correction
codes. This can be thought of as the remaining bit errors in the digital payload after
all corrections (improvements) have been made. This value should be numerically
lower than the PreFEC BER. Values lower than 1x10⁻⁸ are generally considered
acceptable.
SER represents segment errors that are measured in the digital transport stream. The
MPEG stream is divided into packets or "segments". Each segment contains 187 data
bytes plus one sync byte. A commonly used measure of quality of the final output
stream is Segment Error Rate (SER). SER is computed as the number of segment errors
per second. As with BER, the value is averaged over the duration of the time window,
and reset to 0 every time the window rolls over. An SER value of about 3 (typically
averaged over a 20 second window) occurs at TOV. Once segment errors start to
occur, SER rapidly increases as the signal worsens (cliff effect). Smaller numbers are
better.
ErrorSec represents errored seconds. An errored second is any second that contains
at least one error in the digital transport stream. This measure keeps a count of the
number of errored seconds that occur within the reset window. The value is reset to
0 when the window rolls over.
BurstES represents burst errored seconds - exactly the same as the errored seconds
measurement except that only seconds that contained greater than "burst" number of
errors are counted. A Burst Errored Second is defined by the number of errors that
19
DTU-236A with RFXpert
User Manual
must occur to be a burst. This value is set in the Settings > General tab (see Figure
16). This test is useful in distinguishing inconsistent "bursty" type interference
impairments from constant error-rate problems such as poor MER.
PN-23 - This is an industry standard Bit Error Rate test pattern available on most
modulators. For this test to be used on the RFXpert, the modulator must be switched
to test mode to inject the pseudo-random PN-23 bit pattern into the payload data
area of the stream (i.e. the program is taken off-line, and the data bytes are replaced
with a known test pattern). A true BER counter is contained in the receiver in the RF
Probe. It generates the identical pattern, synchronizes itself with the incoming pattern,
and counts actual bit errors via a bit-by-bit comparison.
Note: The PN-23 values will not be valid unless a PN-23 signal is received. Also,
the PN-23 alarm will not indicate a Warn or Fail unless a valid PN-23 signal is
received.
Figure 22. Digital Bit Error Display
5. Master Alarm: This box gives you a real time indication of the overall status of the
incoming RF channel. If all measurements are in a Pass status the box will be green.
If any measurement is in a Fail status the box will be red.
Figure 23. Master Alarm
6. Receiver and FEC Lock: These are simple Pass (green) and Fail (red) status
indicators for the incoming signal. Receiver lock is valid for 8VSB and QAM channels
and is defined as the equalizer being able to synchronize to the incoming signal. FEC
lock indicates that the digital channel has a valid incoming transport stream.
20
DTU-236A with RFXpert
User Manual
6.2 Modulation Detail
The Modulation Detail tab provides you with measurements and diagrams particular to a
modulated digital (8VSB and QAM) channel. The measurements will be grayed out and the
diagrams inactive when measuring an NTSC channel.
1
3
2
Figure 24. Modulation Detail Tab
1. Digital Modulation Bar Graphs: These three graphs display the exact same
information that was previously described in the System Monitor tab (see Figure 21).
However, there are no Pass / Fail / Warn color indications. The bars are always
green.
2. Constellation Diagram: The constellation diagram gives you a visual indication of
how closely the demodulated digital "symbols" are received compared to the
theoretical ideal. The 8VSB signal constellation display has 8 lines and the individual
dots (representing symbols) should ideally be in straight lines at the middle of the
vertical dotted lines. The QAM signal constellation display will contain squares and
the individual dots (representing symbols) should ideally be in the center of the
squares. The number of squares will depend on the QAM mode, e.g. QAM 64 will
have 64 squares.
21
DTU-236A with RFXpert
User Manual
8VSB
QAM 64
Figure 25. 8VSB and QAM Constellation Displays
3. Eye Diagram: The eye diagram gives you another visual means to verify the
modulation quality of the incoming digital channel. This diagram displays the "trace"
as the incoming symbols move from one value to another. The display will look very
similar for both 8VSB and QAM 64 channels (7 eyes, 15 eyes for QAM 256). You
should have "open eyes" in a good incoming signal.
8VSB
“Eye”
Figure 26. Eye Diagram Display
6.3 Multipath Detail
The Multipath Detail tab displays information gathered from the RF Probe's adaptive channel
equalizer. The adaptive equalizer uses knowledge of the ideal 8VSB signal to cancel out the
effects of multipath (echoes and ghosts) and non-ideal frequency response in the transmission
channel. The DTU-236A RF Probe has been characterized to remove contributions from the
unit's own RF front-end (pre-amp, tuner, etc.) from the information displayed in this mode.
The "taps" of the equalizer refer to the values of a sampled impulse response of the converged
equalizer. The tap values can reveal information about the types of impairment that the
22
DTU-236A with RFXpert
User Manual
equalizer is trying to compensate for. These measurements are valid for 8VSB channels and
will be inactive on NTSC or QAM channels.
1
2
Figure 27. Multipath Detail Tab
1. Equalizer Loading Bar Graph: The equalizer loading number shows how "hard"
the equalizer is working. The load is computed by taking the RMS value of the taps,
(not including the center tap). This provides a measure of how much energy is going
into correcting for undesired reflections. A lower number indicates that the equalizer
is not working as hard and that the signal is of good quality.
2. Multipath Echo Profile: This is a plot of the tap energy versus time delay from the
selected channel. The channel is shown as a spike at time t=0, and is represented
as 100%. If reflections (echos) of the original signal are present, it will show as
another spike at some positive or negative time delay and reduced percentage from
the selected channel. This graph can assist in determining whether signal problems
are being caused by multipath problems, or not. The center tap (0µs) corresponds
to the main signal and any other echo is interference and noise.
Figure 28. Multipath Echo Profile Graph
23
DTU-236A with RFXpert
User Manual
6.4 Spectrum Detail
The RFXpert software also includes a Spectrum Detail tab. Upon selecting the Spectrum Detail
tab, you will be prompted that entering the Spectrum Analysis mode will disable all logging,
alarming, and channel specific measurements. This is due to the fact that the tuner will be in
a sweep mode to provide the spectrum measurements. Selecting “Yes” will allow you to view
the spectrum graphs, selecting “No” will take you back to the previous tab you were viewing.
Figure 29. Entering Spectrum Detail Mode
All of the Spectrum Analysis windows are auto ranging. Once you have entered into the
spectrum Detail tab, you have three display options:
1. Channel Spectrum - The Channel Spectrum is a 6 MHz span with a 280 KHz
resolution bandwidth and 100 KHz measurement intervals. The center frequency will
be defined by the channel that you have selected.
Figure 30. Channel Spectrum Display
2. Adjacent Spectrum - The Adjacent Spectrum is an 18 MHz span with a 280 KHz
resolution bandwidth and 200 KHz measurement intervals. The center frequency will
be defined by the channel that you have selected.
24
DTU-236A with RFXpert
User Manual
Figure 31. Adjacent Spectrum Display
3. System Spectrum - The System Spectrum is a full sweep (50-1000 MHz) of the RF
input. A 280 KHz resolution bandwidth measurement is taken of each channel in the
band of the currently selected channel plan.
Figure 32. System Spectrum Display
25
DTU-236A with RFXpert
User Manual
6.5 About the RFXpert
The final tab in the measurement display window is an "About" tab. This tab displays the
current version of RFXpert software, RF Probe driver, serial number of the connected RF Probe,
and .dll version numbers. The About tab provides information only and no values may be
changed.
Figure 33. RFXpert About Tab
26
DTU-236A with RFXpert
User Manual
7. Measurement and Log Settings
The Settings icon in the Tool Bar of the RFXpert contains several advanced settings pertaining
to the alarming and interval logging parameters of the channel under test. The settings icon
will also allow you to create and modify channel plans (discussed previously in this manual)
and create Auto Inspection profiles (discussed later in this manual).
Figure 34. Measurement and Log Settings
7.1 Alarm Settings
To configure the alarm limits and alarm logging, select the Alarms tab within the Settings
window. The first step is to select the modulation mode in the upper left corner. This allows
you to set up unique alarm limits for each of the different supported modulation schemes.
Figure 35. Alarm Settings
Checking the Enable Alarm History Log will generate a log entry each time there is a
measurement alarm. You will also receive an alarm once a measurement returns to a good
state from a fail state. The location and type of log will be discussed in the next section on
Interval Logging. You may also select the number of days the logs will be kept before purging.
Each of the measurements contained under the System Monitor tab may be set to generate a
log entry by checking the Log on Fail box next to the measurement type.
27
DTU-236A with RFXpert
User Manual
Each of the measurements contain a series of values that define the Pass / Warn / Fail limits.
You may define custom values for each measurement. The Restore Defaults button in the
lower left corner will return all of the values to the factory settings. The default values are
derived from existing standards, industry practices, and DekTec's extensive experience.
7.2 Interval Logging Settings
The Logging tab in the Settings window allows you to define the parameters for Interval
Logging. Interval Logging is basically a snapshot of selected measurements of the tuned
channel at a defined time period that is stored in a log file.
Figure 36. Interval Logging
To perform Interval Logging, you must first check the Enable Interval Logging box in the upper
left corner. You now need to check which measurements you want to include in the Interval
Logging. Now define the interval (frequency of occurrence) you wish to have for the
measurement snapshots and how many days you wish to keep the logs before purging.
The bottom portion of the Logging tab contains the path to the log files (both Alarm and
Interval). The default path is:\ProgramFiles\DekTec\RFXpert\logs\Alarm or
Interval. However, you may change this by clicking on the Change Path button and defining
your own directory path. The View Logs button will quickly take you into the directory where
the logs are stored. The logs are created as a comma separated text file (.csv) that may be
opened with any text editing or spreadsheet software. One file is created per day and the file
name is the date it was created.
28
DTU-236A with RFXpert
User Manual
Date
Time
Channel
Modulation
Frequency Type
5/19/2015
5/19/2015
5/19/2015
5/19/2015
5/19/2015
5/19/2015
5/19/2015
5/19/2015
5/19/2015
5/19/2015
5/19/2015
5/19/2015
5/19/2015
5/19/2015
5/19/2015
5/19/2015
5/19/2015
8:56:18 AM
8:57:19 AM
8:58:19 AM
8:59:19 AM
9:00:19 AM
9:01:19 AM
9:02:19 AM
9:03:20 AM
9:04:20 AM
9:05:20 AM
9:06:20 AM
9:07:20 AM
9:08:20 AM
9:09:21 AM
9:10:21 AM
9:11:21 AM
9:12:21 AM
29
29
29
29
29
29
29
29
29
29
29
29
29
29
29
29
29
563
563
563
563
563
563
563
563
563
563
563
563
563
563
563
563
563
8VSB
8VSB
8VSB
8VSB
8VSB
8VSB
8VSB
8VSB
8VSB
8VSB
8VSB
8VSB
8VSB
8VSB
8VSB
8VSB
8VSB
RF Level
Pilot
Level
EVM
-10.73
-10.71
-10.52
-10.76
-10.57
-10.39
-10.55
-10.41
-10.85
-10.83
-10.89
-10.66
-10.72
-10.72
-10.72
-10.72
-10.72
-12.4
-12.37
-12.53
-12.66
-12.17
-12.42
-12.39
-12.4
-12.38
-12.23
-12.71
-12.09
-12.51
-12.51
-12.51
-12.51
-12.51
7.08
7.26
7.11
7.01
7.26
7.03
7.2
6.83
6.98
7.23
6.96
6.76
7.26
7.26
7.26
7.26
7.26
Figure 37. Example Interval Log
Note: The example above only shows a portion of the entire logged values.
29
DTU-236A with RFXpert
User Manual
8. Snapshot
The RFXpert contains a unique feature that allows you to quickly capture a JPEG image of any
measurement screen for viewing at a later time. To take a Snapshot, simply click on the
Snapshot button while the desired measurement screen is displayed.
Figure 38. Taking a Snapshot
You will now be prompted to select a location and a name for your JPEG image. The default
name is the date and time of day.
Figure 39. Saving the Snapshot JPEG File
30
DTU-236A with RFXpert
User Manual
9. Transport Stream Recording
The RFXpert software allows you to capture the incoming digital transport stream on 8VSB
and QAM channels. The file will be recorded to a directory on the server PC. Click on the
Record button to initiate transport stream recording.
Figure 40. Recording a Transport Stream Step 1
A new window will open and you will be required to enter some basic information.
Figure 41. Record Setup
The destination path of the record file is displayed at the top of the Record window and may
be changed by selecting the "…" browse button. Now provide a file name, a .trp extension
will be added to all record files. You must then define the duration of your recording. This
may be in Time or File Size. Click on the Record button to initiate recording.
31
DTU-236A with RFXpert
User Manual
10. Equalizer Disable
The DTU-236A RF Probe has a built-in 8VSB equalizer. Equalizers are widely used in 8VSB
receivers (set top boxes) to facilitate reception of marginal signals containing large amounts
multipath or other channel impairments. The equalizer attempts to flatten the channel
response by canceling signals caused primarily by multipath echoes. Disabling the equalizer
allows you to take "true" measurements that show signal quality without the benefit of the
channel being equalized.
EQ disable is only valid on 8VSB channels. Multipath
measurements will be disabled when the EQ is disabled.
Figure 42. Disabling the 8VSB Equalizer
MER value and Constellation / Eye diagram degradation is the most obvious indication that
the EQ has been disabled.
Figure 43. MER and Modulation Detail with EQ ON
32
DTU-236A with RFXpert
User Manual
Figure 44. MER and Modulation Detail with EQ DISABLED
33
DTU-236A with RFXpert
User Manual
11. Auto Inspect
The Auto Inspect feature of the RFXpert allows you to automatically measure and log every
channel within a defined channel plan. This feature makes it simple to quickly verify the status
of your cable (or RF distribution) system by providing a report detailing overall status and
measurement reports for individual channels within a plan.
11.1 Setting the Profile
Click on the Settings button in the tool bar, then select the Auto Inspect tab in the Settings
window to create profiles and define Auto Inspect parameters.
Figure 45. Entering Auto Inspect Settings
2
1
3
Figure 46. Auto Inspect Settings Tab
1. Auto Inspect Profiles: The first step to setting up an Auto Inspection is to define a
Profile. The Profile is a unique name that ties a channel plan and a set of
measurement parameters together for performance of an automatic analysis of your
system. You may create multiple profiles for use at many different locations or
34
DTU-236A with RFXpert
User Manual
systems. Start by clicking on the Create New Profile button. You may go back and
modify or delete profiles at any time.
Figure 47. Creating an Auto Inspect Profile
After clicking on the Create New Profile button, a new window will pop-up prompting
you to enter a Profile name. Click on the Create button to proceed.
2. Select the Channel Plan: Now select the Channel Plan that you wish to associate
with the Profile. You may also enter notes in the Description field.
Figure 48. Defining Parameters for the Auto Inspect Profile
3. Defining the Auto Inspect Measurement Parameters: The final step in
creating the new (or modifying an existing) profile is to define which measurements
you want as part of the inspection and their Pass / Fail limits. Use the Mode pulldown box to select the modulation scheme and then define the appropriate
35
DTU-236A with RFXpert
User Manual
measurements and limits. 8VSB and QAM will have the same measurements (but
different limits) with the exception of Pilot Level (8VSB only). NTSC measurements are
completely different. The preset measurement limits are derived from the current
settings in the Alarm tab. You may modify these limits specific to you desired auto
inspect profile.
Figure 49. NTSC Parameters within Auto Inspect
36
DTU-236A with RFXpert
User Manual
11.2 Performing an Automatic Inspection
Now that you have defined an Auto Inspect profile(s), you may proceed with performing
automatic inspections. Start by clicking on the Auto Inspect button in the tool bar.
Figure 50. Starting an Auto Inspection
The Auto Inspect window will now open. Select the profile that you wish to apply and the
number of times you wish to perform the inspection. A single inspection will run once and
then create the report. Multiple inspections are defined by the number of inspections and the
interval between each inspection. Click on the Run Auto Inspection button to initiate the
inspection. An Auto Inspect report will be generated for each time an inspection is performed.
Figure 51. Performing an Auto Inspection
You will now be prompted to enter a site name that will be associated with the inspection.
Figure 52. Entering a Site Name
Figure 53. Multiple Auto Inspections in Progress
37
DTU-236A with RFXpert
User Manual
The Auto Inspect report will open automatically at the end of a single inspection. You must
manually select the desired report from the list if a multiple auto inspection was performed
(see figure above).
Figure 54. RFXpert Auto Inspect Report
The Auto Inspect report will not be saved until you click on the Save or Export buttons at lower
right corner of the inspection report. Save will create a file (.rst) that may be viewed with the
RFXpert application at a later time. Export creates a comma separated text (.csv) file that may
be viewed using a standard text editor or spreadsheet application. You may also select print
to receive a hard copy from an attached printer. Select the Open and View Inspection Results
button in the Auto Inspect window (see Figure 54) to view saved reports.
38
DTU-236A with RFXpert
User Manual
Figure 55. Saving an Auto Inspect Report
Figure 56. Exporting an Auto Inspect Report
39
DTU-236A with RFXpert
User Manual
12. Using the DekTec StreamXpert (DTC-320)
You may add transport stream analysis capabilities to the RF Probe by purchasing the DekTec
StreamXpert (DTC-320) software. The StreamXpert software is included in the USB thumb
drive included with your DTU-236A RF Probe. You must install a purchased license on your
RF Probe to use the StreamXpert software or have another DekTec device in connected to your
PC that is licensed for StreamXpert. If you purchased StreamXpert in conjunction with your
RF Probe the license will already be loaded on the RF Probe.
All information regarding software installation and operation is contained in the StreamXpert
manual.
Note: Do not install the drivers contained in the StreamXpert installation. Disregard these
procedures covered at the beginning of the StreamXpert manual. The drivers for the RF Probe
will be installed with the RFXpert software.
Figure 57. StreamXpert (DTC-320) Software Application
40
DTU-236A with RFXpert
User Manual
Appendix A: RFXpert Default Values
Alarm Settings
Mod Type
RF Level
Video Carrier Level
Pilot Level
Carrier/Noise Ratio
MER
MER
MER
EVM
EVM
EVM
Margin
Pre BER
Post BER
SER
ErrorSec
BurstES
PN-23
Digital
NTSC
8VSB
NTSC
8VSB
QAM64B
QAM256B
8VSB
QAM64B
QAM256B
Digital
Digital
Digital
Digital
Digital
Digital
Digital
Low
Fail
-15
-15
-16
43
18
20
25
3
Low
Warn
-10
-10
-14
48
23
24
29
High
Warn
40
40
-9
High
Fail
45
45
9
6.6
5.8
3.3
11.7
9.3
5.2
1E-5
1E-6
10
10
5
1E-6
2E-4
2E-5
15
15
8
2E-5
8
Standard TOV Values used in Margin Calculation:
8VSB = 15.2dB
QAM64B = 18.5dB
QAM256B = 23.5dB
41
Histogram
Low
High
-30
-30
-20
0
0
0
0
0
0
0
0
50
50
10
80
35
35
35
16
16
16
20
DTU-236A with RFXpert
User Manual
Appendix B: Digital Channel Power Measurement &
Spectral Displays
This appendix provides information on power measurement and spectrum displays. These
concepts are then applied to the DTU-236A RF Probe and RFXpert software.
The power of digital communications channels such as VSB or QAM modulated TV channels
is usually expressed in dBm or dBmV. dBm is a measure of power as dBmV is a measure of
voltage.
0 dbmV = 1 milliVolt
X(dBmV) = 20*log(Y(volts)/.001)
0 dBm = 1 milliWatt
X(dBm) = 10*log(X(watts)/.001)
In order to convert between dBm and dBmV, the system impedance must be known. (Because
a signal with a given fixed power will generate different voltages across different impedances).
In a 75 Ohm system:
0 dBm = +48.75 dBmV
0 dBmV = -48.75 dBm
In a 50 Ohm system:
0 dBm = +47 dBmV
0 dBmV = -47 dBm
The channel power is the average power measured within the 3dB bandwidth of the channel
(approximately 5.38MHz for 8VSB, 5.06MHz for QAM 64, and 5.38MHz for QAM 256). The
average digital channel power is often measured with a signal level meter, spectrum analyzer,
or power meter.
The DekTec DTU-236A RF Probe has built in averaging circuits to accurately measure the
average channel power of a digital channel (8VSB, QAM 64, and QAM 256).
Viewing the digital channel on the RFXpert spectral display can be confusing because the
signal trace indicates a level that is much lower than the actual average channel power (level)
measurement. This difference is due to the narrow bandpass filter in the spectral display's
signal detector, also known as the resolution-bandwidth (RBW) filter. The spectral display is
created by sweeping the RBW filter across the bandwidth of the channel. The noise like
qualities of a digital channel cause it to be attenuated by the narrow RBW filter. This
attenuation is what causes the difference between the trace level and the level displayed on
the System Monitor tab
42
DTU-236A with RFXpert
User Manual
Appendix C: QAM Constellation Impairment Examples
The following constellation diagrams are examples of impairments on a QAM 64 channel.
This will also apply to QAM 256.
Noise
CW Interference
Phase Noise
I/Q Gain Error
I/Q Phase Error
IF Compression
43