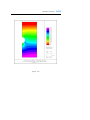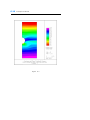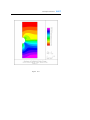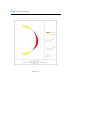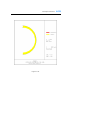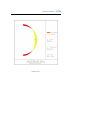
1
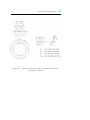
TUNA Ver sion 6 .50 U pda te No te
November 5, 2005
TUNA Version 6.50 Update Note
November 5, 2005
1.
SMAP-S2 / TUNA can consider hydrostatic ground water pressures below water table.
Refer to updated manual and example problem.
TUNA:
User’s Manual (Page 4-3)
Example EX1-1.DAT in C:\SMAP\TUNA\EXAMPLE\EX1\EX1-1
2.
SMAP automatically creates a sub directory Temp under current working directory.
All intermediate scratch files are saved in this sub directory. Consequently, to run
SMAP programs manually, you need to move to this Temp directory.
Refer to updated manual.
TUNA:
3.
User’s Manual (Pages 3-2 and 3-15)
SMAP provides debug information during execution of main-processing program
(solver). This information is useful for tracing run time errors, extracting convergence
status, and checking elapsed time.
Refer to updated manual.
TUNA:
User’s Manual (Page 3-16)
TINA User’s Manual
Update Version 6.50
November 5, 2005
3-2
Running Programs
3. Next, you need to select Working
Directory. W orkin g D irecto ry
should be the existing directory
where all the output files are
saved. It is a good idea to have
all your input files for the current
project in this Working Directory.
Click the disk drive, double-click
the directory, and then OK button.
Note that when you select Working Directory, a sub directory Temp
is created automatically. All intermediate scratch files are saved in
this Temp directory.
TUNA Menu
TUNA provides the following Main
Menus; RUN, PLOT, SETUP and
EXIT.
RUN executes TUNA main
processing programs and has the
following Sub Menus; TEXT EDITOR,
BUILT-IN EDITOR (not available),
PRE EXECUTE and EXECUTE.
PLOT executes post-processing
programs to show graphically the
computed results and has the
following one program; PLTDS.
Running Programs
3-15
3.5 Manual Procedure to Run TUNA
Occasionally, you need to execute programs manually to see what is
going on each step.
Executing TUNA Programs Step by Step
1.
Select MS-DOS mode or Command Prompt.
2.
Go to Working Directory where you want to save your output files.
Create temporary sub directory.
type
MD Temp
Then change to this sub directory.
type
CD Temp
Now, the files in the Working Directory can be accessed by prefixing
“..\” to the file name.
3.
To run TUNA main-processing program,
type
4.
C:\SMAP\CT\CTBAT\TUNA
To plot PLOT-2D output,
type \SMAP\CT\CTBAT\PLTDS
3-16
Running Programs
3.6 Debugging TUNA Main-Processing Program
Debug information would be helpful in the following cases:
C Having run time errors
C Extracting convergence
C Checking elapsed time
In order to get debug information, you need to modify the file
“DEBUG.DAT” in the directory C:\SMAP\CT\CTDATA.
0,
2,
1
1
IDEBUG, NCLDEB, IOUTDEB, ICONVER
Note: This "DEBUG.DAT" file allows listing of status with
elapsed time information while running main process
of SMAP programs.
This is the very useful
features to see where it spends most time and where
it stops.
IDEBUG
= 0 :
1 :
NCLDEB
:
Do not print debug information.
Print debug information.
Ending cycle number.
No printing debug information
after NCLDEB.
IOUTDEB =
0 :
1 :
Debug information on screen.
Debug information on file,
c:\smap\ct\ctdata\DEBUG.OUT
ICONVER =
0 :
Do not print convergence
information.
Print the ratio of displacement
increment to current displacement
(DU/U)
1 :
Description of Input Data
Card
Group
1
4-3
Input Data and Definitions
1.1
TITLE
TITLE
Any title of up to 60 characters
1.2
IUNIT
IUNIT
Length
1
in
2
Force
lb
Cm
Kg
Pressure
2
Unit Weight
lb/in3
lb/in
2
Kg/Cm
Kg/Cm3
General Information
1.3
NTALT
NTALT =1
=2
Unlined Tunnel subjected to Excavation Load
Unlined Tunnel subjected to Excavation and
Live Load.
=3
Lined Tunnel subjected to Excavation Load
=4
Lined Tunnel subjected to Excavation and Live
Load.
1.4
HT, DGW
HT
Tunnel depth
DGW
Depth of water table from ground surface
See Figure 4.2 for minimum depth.
4-12
Description of Input Data
Table 4.1
Work Sheet for TUNA Input Data
Card Group
Input Data
TITLE
General
Information
IUNIT
NTALT
HT, DGW
Distributed
Ps
Xs
Fi
Xi
Load
NUMCON
Concentrated
Load
Force 1
Live Load
Force 2
Force 3
Force 4
Force 5
Force 6
Force 7
Force 8
Force 9
Force 10
Internal
Load
Pi
T U N A
TUNnel Analysis Program
Version 6.0
COMTEC RESEARCH
Copyright @2003 by COMTEC RESEARCH
All right reserved. No part of this manual may be reproduced in any form or by any
means without a written permission of COMTEC RESEARCH.
Printed in the United States of America.
LICENSE AGREEMENT
LICENSE: COMTEC RESEARCH grants to Licensee a non-exclusive,non-transferable
right to use the enclosed Computer Program only on a single computer. The use of
the Computer Program is limited to the Licensee's own project. Licensee may not use
the Computer Program to serve other engineering companies or individuals without
prior written permission of COMTEC RESEARCH. Licensee may not distribute copies
of the Computer Program or Documentation to others. Licensee may not rent, lease,
or network the Computer Program without prior written permission of COMTEC
RESEARCH.
TERM: The License is effective as long as the Licensee complies with the terms of this
Agreement. The License will be terminated if the Licensee fails to comply with any
term or condition of the Agreement. Upon such termination, the Licensee must return
all copies of the Computer Program, Software Security Activator and Documentation
to COMTEC RESEARCH within seven days.
COPYRIGHT: The Licensed Computer Program and its Documentation are copyrighted.
Licensee agrees to include the appropriate copyright notice on all copies and partial
copies.
USER SUPPORT: COMTEC RESEARCH will provide the Software Support for the
Registered Users for a period of 90 days from the date of purchase. User support is
limited to the investigation of problems associated with the correct operation of the
Licensed Computer Program. The Licensee must return the Registration Card in order
to register the Licensed Computer Program.
DISCLAIMER: COMTEC RESEARCH has spent considerable time and efforts in checking
the enclosed Computer Program. However, no warranty is made with respect to the
accuracy or reliability of the Computer Program. In no event will COMTEC RESEARCH
be liable for incidental or consequential damages arising from the use of the Computer
Program.
UPDATE POLICY: Update programs will be available to the Registered Licensee for a
nominal fee. The Licensee must return all the Original Distribution Diskettes and
Software Security Activator to receive the update programs.
GENERAL: The Commonwealth of Virginia Law and the U. S. Copyright Law will govern
the validity of the Agreement. This Agreement may be modified only by a written
consent between the parties. COMTEC RESEARCH, 6416 Stonehaven court, Clifton VA
20124, U.S.A
Contents
1
Contents
1. Introduction . . . . . . . . . . . . . . . . . . . . . . . . . . . . . . . . . . . .
1-1
1.1
Overview . . . . . . . . . . . . . . . . . . . . . . . . . . . . . . . . . . .
1-1
1.2
Features
1-1
1.3
Assumptions
...................................
................................
1-2
2.1
Minimum Hardware Requirements . . . . . . . . . . . . . . . . . .
2-1
2.2
Installation Procedure . . . . . . . . . . . . . . . . . . . . . . . . . .
2-1
2. Installing TUNA
3. Running Programs
3.1
Introduction . . . . . . . . . . . . . . . . . . . . . . . . . . . . . . . . .
3-1
3.2
RUN Menu
..................................
3-3
3.3
PLOT Menu . . . . . . . . . . . . . . . . . . . . . . . . . . . . . . . . . .
3-4
3.3.1
3-4
3.4
3.5
PLTDS
...............................
SETUP Menu . . . . . . . . . . . . . . . . . . . . . . . . . . . . . . . .
3-12
3.4.1
General Setup . . . . . . . . . . . . . . . . . . . . . . . . .
3-12
3.4.2
PLTDS Setup . . . . . . . . . . . . . . . . . . . . . . . . . .
3-14
Manual Procedure to Run TUNA
..................
3-15
4. Description of Input Data . . . . . . . . . . . . . . . . . . . . . . . . . .
4-1
5. Description of Output Data . . . . . . . . . . . . . . . . . . . . . . . . .
5-1
6. Example Problems
...............................
6-1
6.1
Example 1 . . . . . . . . . . . . . . . . . . . . . . . . . . . . . . . . . .
6-2
6.2
Example 2 . . . . . . . . . . . . . . . . . . . . . . . . . . . . . . . . .
6-24
Introduction
1-1
Introduction
1.1 Overview
TUNA is a fully automated computer program developed for TUNnel
Analysis. TUNA employs a static, two-dimensional, linear elastic finite
element method. Pre- and post-processors of TUNA are built-in so that
only the physical geometries and material properties associated with a
proposed tunnel are required as input and graphical outputs can be
obtained directly through printers.
1.2 Features
Features of TUNA include:
C
Liner-Medium Interaction
C
English and Metric Units
C
Shallow and Deep Buried Tunnels
C
Multi-Layered Geological Medium
C
Circular, Rectangular and Horseshoe Shape Tunnels
C
Plain Concrete, Steel Plate, Reinforced Concrete and Composite
integral Liners.
C
Moment Release Option for the Connections between Segmented
Liners.
C
Excavation and Live Loads including Internal Pressure
1-2
Introduction
C
Lined and Unlined Tunnels
C
Graphical Outputs
- Tunnel Deformed Shape
- Principal Stresses in the Medium
- Octahedral Shear Stress in the Medium
- Bending Moment and Thrust in the Liner
- Stresses in the Reinforcing Bars
- Stresses and Strains in the Extreme Fiber of the Liner
1.3 Assumptions
TUNA assumes:
C
Liners and the surrounding medium are linear elastic
C
Liners are modeled by conventional beam
C
Plane strain condition in the longitudinal tunnel direction
C
No slippage along the interface between the liner and the surrounding
medium.
C
Excavation load is defined as tunnel deformations due to the
excavation of tunnel. Excavation of tunnel and installation of liner
occur instantaneously and simultaneously so that there is no
displacement in the surrounding medium prior to the excavation.
So
the liner interacts with the surrounding medium immediately after
excavation and must resist full displacement of tunnel.
C
Surface loads are the externally applied concentrated or distributed
loads on the ground surface such as traffic loads on the highway.
C
Internal pressure loads are the hydrostatic pressures acting on the
tunnel liner such as gas or water pressures.
C
Liners and the surrounding medium are planar symmetry about the
vertical axis passing through the tunnel center line. Soil/rock layers
are horizontal (i.e., perpendicular to the gravitational direction)
Installing TUNA
2-1
Installing TUNA
2.1 Minimum Hardware Requirement
T
Pentium with 128 Mb RAM and 580 Kb free memory.
T
Windows 95/98/me/2000/XP system.
T
SVGA monitor.
2.2 Installation Procedure
1. Uninstall if there are pre-existing SMAP programs. To uninstall SMAP
programs, remove following two programs using Add/Remove in
Control Panel:
SMAP
Sentinel System Drives
And then rename or delete following folders if they are existing:
C:\Program Files\Smap
C:\SMAP
2-2
Installing TUNA
2. Insert SMAP distribution CD,
go to SMAP-CD directory
and double-click Setup.
3. Click OK button to
continue installation.
4. Click Computer Logo button
to continue installation.
5. Selecting SMAP Programs window
will be shown. Click
the button showing the
appropriate Setup Number. The
last two digits in the SMAP key
serial number represent the
Setup Number. For example,
if the key serial number is 0148600-02, click SETUP-02 button.
Installing TUNA
6. Sentinel System Drivers -Install
Shield Wizard window will be
shown. This System Driver is
required for the SMAP Key to
work properly. Click the Next
button.
7.
Select Complete and click
Next button.
8.
Click Install button.
9.
Click Finish button. Do not
reboot the system when the
Sentinel Driver installation is
finished.
2-3
2-4
Installing TUNA
10. Choose Program Group and
click Continue.
11. Click OK button to finish installation.
12. If you have 3.5 inch SMAP key setup disk, insert the disk and run
INSTALL.EXE. If you do not have 3.5 inch setup disk, go to
SMAP-CD-->KEY-DISK--> SMAP-0XXX directory and run INSTALL.
Where XXX represents the Serial Number which is the first three digits
in SMAP key. For Demo Version, you do not need key setup.
13. Turn off the system.
Attach SMAP key to the parallel port LPT1.
Turn on the system.
14. If you have FEMAP program, modify the file FemapDir.dat
in C:\SMAP\CT\CTDATA directory so that it contains correct path.
15. For Windows 2000/XP operating systems, set the maximum size of
virtual memory to 4000 MB thru Control Panel ->System->Advanced> Performance Option->Change.
Running Programs
3-1
Running Programs
3.1 Introduction
Once you prepared the input file as described in Section 4, running TUNA
programs are straightforward since finite element meshes and graphical
instruction files are automatically generated.
Accessing TUNA Programs
1. When you setup a Shortcut to
SMAP Icon, you simply double-click
SMAP Shortcut. Otherwise, click
Start button, point to Programs,
and then click the
SMAP.
2. Select TUNA radio button and
then click O K button.
3-2
Running Programs
3. Next, you need to select Working
Directory. W orkin g D irecto ry
should be the existing directory
where all the output files are
saved. It is a good idea to have
all your input files for the current
project in this Working Directory.
Click the disk drive, double-click
the directory, and then OK button.
TUNA Menu
TUNA provides the following Main
Menus; RUN, PLOT, SETUP and
EXIT.
RUN executes TUNA main
processing programs and has the
following Sub Menus; TEXT EDITOR,
BUILT-IN EDITOR (not available),
PRE EXECUTE and EXECUTE.
PLOT executes post-processing
programs to show graphically the
computed results and has the
following one program; PLTDS.
Running Programs
3-3
SETUP is used to set plotting control
parameters for PLTDS and PLTXY.
It has the following Sub Menus;
General, PLTDS and PLTXY (not
available).
EXIT is used to end TUNA.
3.2 RUN Menu
Once you have prepared the input file according to Section 4, you are
ready to execute TUNA main-processing program by selecting EXECUTE
Menu.
RUN Menu has the following Sub
Menu; TEXT EDITOR, BUILT-IN
EDITOR (not available), PRE
EXECUTE and EXECUTE.
TEXT EDITOR is used to create or modify the input file using Wordpad.
BUILT-IN EDITOR (not available) is used to create or modify the input
file using the specially designed editor which allows much easier input
preparation.
PRE EXECUTE is used either to check the input file or to generate plotting
information files.
EXECUTE executes TUNA main-processing program. You are asked to
open your input file.
3-4
Running Programs
3.3 PLOT Menu
Once you finished executing TUNA main-processing program, you need
to run post-processing programs to
show graphically the numerical results.
Plot Menu is mainly used to execute
post-processing programs; PLTDS
and PLTXY. To access PLOT Menu,
click Plot ÿ Plot Options.
Plot Menu contains PLTDS.
3.3.1
PLTDS
PLTDS is used to plot the following output:
C
Finite element mesh
C
Principal stress distribution
C
Deformed shape
C
Lining section force/extreme fiber stress
C
Rock bolt axial stress
C
Contours of principal stresses and octahedral shear stress
PLTDS has 12 menus; File, Edit, View, Plot, Numeric-Character, Draw,
Draw-Style, Node, Element, Child-Window, Window, and Help.
Running Programs
3-5
For description of File, Edit and Window menus, refer to the contents in
Help menu.
View is provided to show different appearance
of finite element meshes and draw items.
Currently there are 8 different check items and
1 contour option. Click different options if you
want other than default. Check mark will be
moved to the clicked item. Default options are
used as initial check. Coordinate and Tick
Mark and Grid Line can be applied to all types
of plots. Draw Item is for drawing in Draw
menu to be either permanent or temporary.
Element Fill, Element Outline, Element
Type, Beam/Truss Line and Beam/Truss
End influence only the appearance of finite
element mesh plot.
Contour Option is provided to
switch from line contour to color
filled contour or viceversa.
3-6
Running Programs
Plot has the followin g five men us;
Replot
Replot the currently focused child
window.
Zoom
Zoom the currently focused child
window. It zooms only mesh. Once
this sub menu is selected, you can
specify the rectangular zoom area by
left-mouse-button-down at the left top corner and then leftmouse-button-up at the right bottom corner.
Hardcopy
Print the currently focused child window.
Next
Plot the next graph.
Stop
Stop plotting.
Numeric-Character has 3 sub menus;
Default size, 30% Increase and 50% Increase.
Default Size
Use numeric character size
set in PLTDS Setup window.
30% Increase
Increase the current size by
30%.
50% Increase
Increase the current size by 50%.
Draw has 5 sub menus: Point, Line, Arc, Text and Grid. You can add
these drawing items on the current plot. Drawing is influenced by sub
menu Draw-Style.
Point is to draw point. When you select Mouse Pickup and click OK,
the point will be marked at the
position where the left mouse button
is down. As you move the mouse,
the current mouse location is
shown on the status bar at the
bottom of PLTDS window. When you
select Enter X and Y, the point will be
marked at the position where you specified on the Point Input window.
Running Programs
3-7
Point is influenced by Color, Mark Type, and Mark Size in the Draw-style
menu.
Line is to draw straight lines.
As for point, the coordinates of line
can be specified by either Mouse
Pickup or Enter X and Y. Line is
influenced by Color, Mark Type,
Mark Size, Line Style, and Line
Type.
Arc is to draw elliptical arc. You
need to specify Horizontal Radius,
Vertical Radius, Beginning and Ending
Angles. The origin of Arc can be
specified by either Mouse Pickup or
Enter X and Y. Arc is influenced by
Color and Line Type.
Text is to draw text. You need to
specify Rotation Angle and Text.
Beginning Position can be specified
by either Mouse Pickup or Enter X
and Y. Text is influenced by Color,
Font Type, and Font Size.
3-8
Running Programs
Grid is to draw grid lines. When you select
Screen and Hardcopy, the selected plot file is
modified to include grid lines. Grid is influenced
by Color and Line Type.
Draw-Style has 7 sub menus; Color, Mark Type,
Mark Size, Line Style, Line Type, Font Type, and
Font Size. Draw-Style influences drawing items in
Draw menu.
Color shows color palette having 16
different colors. Select the current
color to be used. Color influences all
the drawing items in the Draw menu.
Mark Type shows 10 different mark types.
Mark Type influences point and Line drawing.
Running Programs
Mark Size includes 3 options; Small (0.06 inch),
Medium (0.08 inch), and Large (0.10 inch). Mark
Size influences Point and Line drawing.
Line Style is used to select Mark,
Line, Arrowheaded Line, or Mark and
Line to plot line. The other selection
is applicable for the case when the
total number of points is greater
than 2. When you select Closed
Loop, the first and the last points
can be connected to make a polygon. It influences only Line.
Line Type includes Solid Line, Long Dashes, and
Short Dashes as selection. It influences Line, Arc
and Grid.
Font Type includes IBM Character, SIMPLEX
and DUPLEX to draw Text.
3-9
3-10
Running Programs
Font Size includes 3 options; Small (0.08 inch),
Medium (0.10 inch), and Large (0.12 inch) to
draw Text.
Node is used to find the node number. You can find the node number
which is close to the position where you press down the left mouse button.
Node number close to the mouse position will be listed on Message List
and Keyboard Input Window.
Element is used to find the element number. You can find the element
number which is close to the position where you press down the left
mouse button. Element number close to the mouse position will be listed
on Message List and Keyboard Input Window.
Child-Window has three sub menus;
Child Window Create, Child Window Overlay
and Child Window Close.
Child Window Create
New child window will be created. A maximum
of 40 child windows can be opened.
Child Window Overlay
New child window will be overlaid on the current
child window.
Child Window Close
Currently focused child window will be closed.
Running Programs
Running PLTDS
1. Select PLTDS and click OK
button.
2. A list of plot items is shown in
the Select From Unplotted List
window. Double-click any
one item in the list.
3. The selected plot item will be
shown on the screen.
3-11
3-12
Running Programs
3.4 SETUP Menu
You need to run SETUP menu
•
To specify TUNA main-processing program module.
•
To adjust scales of graphical outputs from PLTDS.
•
To specify FEMAP directory (not applicable for TUNA).
SETUP menu has three sub menus; General, PLTDS,
and PLTXY (not available).
3.4.1 General Setup
General Setup has six
different items; Program
Version, Program Module,
Screen Display, Hardcopy
Output, Layout Unit, and
FEMAP Directory.
Program Version has two
options; Demo and Full
Version. Demo Version
does not require SMAP
key but it has the
following maximum
limits:
Number of Nodes
= 300
Number of Continuum Elements
= 100
Number of Beam Elements
= 50
Number of Truss Elements
= 50
Running Programs
3-13
Full Version requires SMAP Key attached on the parallel port of your
computer.
Program Module contains four options. Standard (Debugging) uses
TUNA main-processing program having debugging. This program module
runs slow but gives more detailed information when run time errors occur.
Standard (Nonoptimized) is the same as Standard (Debugging) except it
does not include debugging information. Standard (Optimized) runs fast
but it does not include debugging information. For most cases, Standard
(Optimized) is recommended. Extra Large (Optimized) is designed to run
large problems.
Screen Display has four options: 640x480, 800x600, 1024x768, and
1280x1024.
Hardcopy Output is used for post-processing program PLTDS and PLTXY.
You can select Black/White Windows Printer, Color Windows Printer, DXF
Auto CAD File, or Postscript Printer File as hardcopy output.
Layout Unit is used for PLTDS and PLTXY. You can select either
Centimeter or Inch in specifying plot scales and dimensions.
FEMAP Directory is required if you are using FEMAP. You need to type in
full path of FEMAP directory where FEMAP.EXE is existing.
3-14
Running Programs
3.4.2 PLTDS Setup
PLTDS Setup is mainly used to
specify scales and dimensions
of post-processing program
PLTDS and mesh plotting
program PLTDS-3D (not
available for TUNA). It has
five different items; Drawing
Size, Margins, Line Thickness,
Numeric Character Size, and
Scale.
Drawing Size controls the
size of output. Once you
specify Legend Box Width,
Horizontal and Vertical Length,
you can click View button to see the scaled layout.
Margins is used to shift the drawing area. Left margin is the distance
from the left edge of printer page to the left frame line. Top margin is the
distance from the top edge of printer page to the top frame line.
Line Thickness specifies the thickness of contour lines. It has three
options; Standard, Doubled, and Tripled.
Num eric Character Size specifies the size of numeric characters such
as node and element numbers. It has 3 options; Standard, Small, and
Large.
Scale specifies Maximum Displacement Length, Maximum Principal Stress
Length, Maximum Beam Section Force Length, and Maximum Truss
Force/Stress Length.
Running Programs
3-15
3.5 Manual Procedure to Run TUNA
Occasionally, you need to execute programs manually to see what is
going on each step.
Executing TUNA Programs Step by Step
1.
Select MS-DOS mode or Command Prompt.
2.
Go to Working Directory where you want to save your output files.
3.
To run TUNA main-processing program,
type
4.
C:\SMAP\CT\CTBAT\TUNA
To plot PLTDS output,
type
C:\SMAP\CT\CTBAT\PLTDS
Description of Input Data
4-1
Description of Input Data
The input data is classified into seven different card groups.
The first card group includes general informations; job title (TITLE),
selection of unit (IUNIT), tunnel analysis type (NTALT) and tunnel depth
(HT).
The second card group specifies live loads. Live loads as schematically
shown in Figure 4.1 include concentrated/distributed surface loads and
internal pressure load acting on the liner.
The third card group specifies soil/rock material property for each layer.
Soil/rock Layers are schematically shown in Figure 4.1.
The fourth card group specifies tunnel dimensions.
Currently there are
four tunnel shapes available; circular, rectangular, vertical walls with arch
roof and general horseshoe shapes. Tunnel shapes and dimensional limits
are shown in Figure 4.2.
The fifth card group specifies liner elastic material properties for the
concrete, steel plate and reinforcing bars.
The sixth card group contains liner cross section data.
For the non-
circular tunnel shapes, tunnels are composed of three segments (top, side
and bottom) as marked in Figure 4.2.
A different liner type (LNTP) can be
4-2
Description of Input Data
applied to each segment of liner.
Figure 4.3 shows the liner cross
sections.
The last card group specifies locations where moments are released along
the tunnel liner.
Table 4.1 is the work sheet designed for easy preparation of input data.
You can save this original work sheet and copy it as you need.
Description of Input Data
Input Data and Definitions
Card
Group
1
4-3
1.1
TITLE
TITLE
Any title of up to 60 characters
1.2
IUNIT
IUNIT
Force
Pressure
1
Length
in
lb
lb/in2
Unit Weight
lb/in3
2
Cm
Kg
Kg/Cm2
Kg/Cm3
General Information
1.3
NTALT
NTALT =1
=2
Unlined Tunnel subjected to Excavation Load
Unlined Tunnel subjected to Excavation and
Live Load.
=3
Lined Tunnel subjected to Excavation Load
=4
Lined Tunnel subjected to Excavation and Live
Load.
1.4
HT
HT
Tunnel depth
See Figure 4.2 for minimum depth.
4-4
Description of Input Data
Input Data and Definitions
Card
Group
2
2.1
(Distributed Surface Load)
Ps, Xs
Ps
Xs
Load intensity in terms of pressure unit
Distance from center line to edge of load
Surface Load
(Concentrated Surface Load)
NUMCON
+
F1 ,
X1
NUMCON
*
F2 ,
X2
Cards
*
-
-
.
-
-
NUMCON
Number of concentrated loads. By
symmetry, consider only right half of
loads.
Fi, Xi
Force Fi at the distance Xi from the
center line.
2.3
(Internal Pressure Load)
Pi
Internal Load
Live Loads ( If NTATL=1 or NTALT=3, skip this card)
2.2
Pi
Internal hydrostatic pressure acting on the liner.
Description of Input Data
Input Data and Definitions
Card
Group
3
3.1
NLAYER
NLAYER
Total number of layers (maximum 10)
Soil / Rock Material Property
3.2
+
H1 ,
GAMA1 ,
RKO1 ,
E1 ,
V1
NLAYER
*
H2 ,
GAMA2 ,
RKO2 ,
E2 ,
V2
Cards
*
-
-
-
-
-
.
-
-
-
-
-
H
Layer thickness
GAMA
Unit weight
RKO
Coefficient of earth pressure at rest
E
Young's modulus
V
Poisson's ratio
See Figure 4.1
4-5
4-6
Description of Input Data
Input Data and Definitions
Card
Group
4
4.1
ISHAPE
4.2
ISHAPE = 1 >
D
=2 >
B,
H
=3 >
B,
H1, H2
=4 >
B1, B2, H1, H2,
Tunnel Dimension
See Figure 4.2
H3
Description of Input Data
4-7
Card Group 5,6 and 7 are required for lined tunnels (NTALT=3 or 4)
Input Data and Definitions
Card
Group
5
5.1
(Concrete Property)
EC,
VC
EC
Young's modulus of concrete
VC
Poisson's ratio of concrete
5.2
(Steel Plate Property)
Liner Property
ES ,
VS
ES
Young's modulus of steel plate
VS
Poisson's ratio of steel plate
5.3
(Reinforcing Bar Property)
ER, VR
ER
Young's modulus of reinforcing bar
VR
Poisson's ratio of reinforcing bar
4-8
Description of Input Data
Input Data and Definitions
Card
Group
6
6.1
6.1.1
LNTP,
WL
LNTP
Liner type (Select from Figure 4.3)
WL
Weight per unit length of liner
Top Segment or Circular Tunnel (ISHAPE = 1)
Liner Cross Section Data
6.1.2
LNTP
=1
>
No data, skip this Card
=2
>
TC
=3
>
T1 , T2 ,
=4
>
TC, D1 , AS1, D2 , AS2
=5
>
T1 , T2 ,
=6
>
TC, TS
=7
>
TC, D1 , AS1, D2 , AS2, TS
=8
>
TC, D1 , AS1, D2 , AS2, TS
=9
>
TS
= 10
>
T1 , T2 ,
= 11
>
TC, TS
= 20
>
Tb, Tt,
W1 , W2
W1 , W2 , D1 , AS1, D2 , AS2
W1 , W2
W,
A,
I
Description of Input Data
4-9
Input Data and Definitions
Card
Group
6
6.2
6.2.1
LNTP,
WL
LNTP
Liner type (Select from Figure 4.3)
WL
Weight per unit length of liner
Side Segment
Liner Cross Section Data
6.2.2
LNTP = 1
>
No data, skip this Card
=2
>
TC
=3
>
T1 , T2 ,
=4
>
TC, D1 , AS1, D2 , AS2
=5
>
T1 , T2 ,
=6
>
TC, TS
=7
>
TC, D1 , AS1, D2 , AS2, TS
=8
>
TC, D1 , AS1, D2 , AS2, TS
=9
>
TS
= 10 >
T1 , T2 ,
= 11 >
TC, TS
= 20 >
Tb, Tt,
W1 , W2
W1 , W2 , D1 ,
W1 , W2
W,
A,
I
AS1,
D2 , AS2
4-10
Description of Input Data
Input Data and Definitions
Card
Group
6
6.3
6.3.1
LNTP, WL
LNTP
Liner type (Select from Figure 4.3)
WL
Weight per unit length of liner
6.3.2
Bottom Segment
Liner Cross Section Data
LNTP
=1
> No data, skip this Card
=2
> TC
=3
> T1 , T2 ,
=4
> TC, D1 , AS1, D2 , AS2
=5
> T1 , T2 ,
=6
> TC, TS
=7
> TC, D1 , AS1, D2 , AS2, TS
=8
> TC, D1 , AS1, D2 , AS2, TS
=9
> TS
=10
> T1 , T2 ,
=11
> TC, TS
=20
> Tb, Tt,
W1 , W2
W1 , W2 , D1 , AS1, D2 , AS2
W1 , W2
W,
A,
I
Description of Input Data
4-11
Input Data and Definitions
Card
Group
7
7.1
NUMRELEASE
NUMRELEASE
Number of locations where liner
moments are released.
Liner Moment Release Locations
7.2
+
X1 ,
Y1
NUMRELEASE *
X2 ,
Y2
*
-
-
.
-
-
Cards
Xi,Yi
X and Y coordinates where liner moments are
released.
See Figure 4.4.
4-12
Description of Input Data
Table 4.1
Work Sheet for TUNA Input Data
Card Group
Input Data
TITLE
General
Information
IUNIT
NTALT
HT
Distributed
Ps
Xs
Fi
Xi
Load
NUMCON
Concentrated
Load
Force 1
Force 2
Live Load
Force 3
Force 4
Force 5
Force 6
Force 7
Force 8
Force 9
Force 10
Internal
Load
Pi
Description of Input Data
Table 4.1
4-13
Work Sheet for TUNA Input Data (Continued)
Card Group
Input Data
NLAYER
H
LAYER = 1
LAYER = 2
LAYER = 3
Soil/Rock
Material
Property
LAYER = 4
LAYER = 5
LAYER = 6
LAYER = 7
LAYER = 8
LAYER = 9
LAYER = 10
ISHAPE
Tunnel
Dimension
ISHAPE = 1
ISHAPE = 2
ISHAPE = 3
ISHAPE = 4
GAMA
RKO
E
V
4-14
Description of Input Data
Table 4.1
Work Sheet for TUNA Input Data (Continued)
Card Group
Liner
Material
Property
Input Data
Concrete
Ec
Vc
Steel
Es
Vs
Er
Vr
Plate
Reinf.
Bar
LNTP
WL
LNTP
WL
LNTP
WL
Liner Section Data
Top
Segment
Circular
Tunnel
Side
Segment
Bottom
Segment
Description of Input Data
Table 4.1
Work Sheet for TUNA Input Data (Continued)
Card Group
Input Data
NUMRELEASE
Xi
Moment
Release
Locations
Location 1
Location 2
Location 3
Location 4
Location 5
Yi
4-15
4-16
Description of Input Data
Figure 4.1
Schematic Tunnel Section in the Layered Medium
Description of Input Data
HT $ 0.7 D
HT $ 0.1 B
HT $ 0.7B
4-17
HT $ 0.7 B1
H
$ 0.2 B
H1 # 0.5 B
H
# 5B
H2 $ 0.2 B
H2 $ 0.5 (B1-B2)
H3 # 5 B
H2 $ 0.1 B1
H1 # 0.5 B1
H3 # 0.5 B2
B2 $ 0.1 B1
B2 # B1
H1+H2+H3 $ 0.2 B1
H1+H2+H3 # 5 B1
Figure 4.2
Tunnel Shapes and Dimensional Limits
4-18
Description of Input Data
LNTP = 2
LNTP= 3
LNTP= 4
LNTP= 5
Concreted section
Steel section
Reinforcing bar section
LNTP
Figure 4.3
Liner type
Liner Cross Sections
Description of Input Data
LNTP= 6
LNTP= 7
LNTP= 8
LNTP= 10
Concreted section
Steel section
Reinforcing bar section
Figure 4.3
Liner Cross Sections (continued)
4-19
4-20
Description of Input Data
LNTP= 9
LNTP= 11
LNTP= 20
A:
I:
Cross section area
Moment of inertia
Concrete section
Steel section
Reinforcing bar section
Figure 4.3
Liner Cross Sections (continued)
Description of Input Data
Figure 4.4
4-21
X and Y coordinates to specify locations of liner moment release.
Description of Output Data
5-1
Description of Output Data
In general, there are 15 graphical outputs as summarized in Table 5.1. Sign
conventions and notations used for section forces and strains in the liner are
shown in Figure 5.1.
5-2
Description of Output Data
Table 5.1
Plot Type
Summary of TUNA Output Data
Descriptions
1
Finite Element Mesh
2
Tunnel Deformed Shape
3
Principal Stress Distribution in Surrounding Medium
(Adjacent to the Tunnel Surface)
4
Principal Stress Distribution in Surrounding Medium
(Overall)
5
Contours of Major Principal Stress
6
Contours of Minor Principal Stress
7
Contours of Octahedral Shear Stress
8
Bending Moment in the Tunnel Liner
9
Thrust in the Tunnel Liner
10
Inner Extreme Fiber Stress in the Tunnel Liner
11
Outer Extreme Fiber Stress in the Tunnel Liner
12
Inner Extreme Fiber Strain in the Tunnel Liner
13
Outer Extreme Fiber Strain in the Tunnel Liner
14
Inner Reinforcing Bar Stress in the Tunnel Liner
15
Outer Reinforcing Bar Stress in the Tunnel Liner
Description of Output Data
Figure 5.1
5-3
Sign conventions and notations used for section forces
and strains in the liner.
Example Problems
6-1
Example Problems
This section is to illustrate how TUNA can be applied for the analysis of
tunnel problems. Main features of example problems are summarized in
Table 6.1. First example problem is for the analysis of segmented liner
due to the excavation associated with shield tunneling. Second example
problem is for the analysis of steel pipe subjected to both surface loads
and internal gas pressure. For each example problem, brief problem
descriptions, listing of input files, and graphical outputs are presented.
Table 6.1
Problem
Number
1
File
Name
EX1.DAT
List of example problems
Run Time (min)
PIII 850 MHZ
0.02
Description
Segmented shield tunnel liner
subjected to excavation load
2
EX2.DAT
0.03
Steel pipeline subjected to surface
loads and internal gas pressure
6-2
Example Problems
6.1 Example 1
A 10 feet diameter circular tunnel is buried along the interface between
the clay and sand layers as shown in Figure 6.1.
An assembly of 16"
width four-flange steel plates is used as tunnel liner. Material properties of
the liner and the surrounding media are listed in Figure 6.1.
The tunnel is
subjected to excavation load.
It should be noted that in this analysis, the connections between the liner
segments are assumed to carry the full moments. You can also analyze
this example problem by assuming that connections are moment-released
using the Card group 7.
As an illustration for input preparation, a work sheet is provided in Table
6.2.
And the actual input file is listed in Table 6.3.
Results
Figures 6.2 to 6.14 show the graphical outputs from TUNA.
Key results
are summarized below.
Max. Tunnel Diameter Change
=
0.2 in
(0.17 % of tunnel diameter)
Max. Liner Compressive Stress =
14,000 psi
(50 % of yield strength)
Example Problems
Table 6.2
Work Sheet for Example 1
Card Group
General
Information
Input Data
TITLE
Example 1
IUNIT
1
NTALT
3
HT
360
Distributed
Ps
Xs
Fi
Xi
Load
NUMCON
Concentrated
Load
Force 1
Force 2
Live Load
Force 3
Force 4
Force 5
Force 6
Force 7
Force 8
Force 9
Force 10
Internal
Load
Pi
6-3
6-4
Example Problems
Table 6.2
Work Sheet for Example 1 (Continued)
Card Group
NLAYER
Input Data
2
H
E
V
360
0.0723
0.6667
5000
0.4
LAYER = 2
600
0.0752
0.4286
10000
0.3
LAYER = 4
LAYER = 5
LAYER = 6
LAYER = 7
LAYER = 8
LAYER = 9
LAYER = 10
Tunnel
Dimension
RKO
LAYER = 1
LAYER = 3
Soil/Rock
Material
Property
GAMA
ISHAPE
1
ISHAPE = 1
120
ISHAPE = 2
ISHAPE = 3
ISHAPE = 4
Example Problems
Table 6.2
Card
Group
Concrete
Liner
Material
Steel
Property
Plate
Reinf.
Bar
Top
Segment
Circular
Liner Section Data
Work Sheet for Example 1 (Continued)
Tunnel
Input
Data
Ec
Vc
0.0
0.0
Es
Vs
29.E+06
0.3
Er
Vr
0.0
0.0
LNTP
WL
20
0.0
Tb
2.094
Tt
W
0.718 16.
A
I
2.396 1.915
LNTP
WL
LNTP
WL
Side
Segment
Bottom
Segment
6-5
6-6
Example Problems
Table 6.2
Work Sheet for Example 1 (Continued)
Card Group
NUMRELEASE
Input Data
0
Xi
Moment
Release
Locations
Location 1
Location 2
Location 3
Location 4
Location 5
Yi
Example Problems
Table 6.3
*
*
:
*
*
*
*
*
*
*
*
*
*
*
*
*
*
*
*
*
*
*
*
*
*
*
*
*
*
*
*
*
Listing of Input File for Example 1
CARD 1.1
TITLE
Example 1
CARD 1.2
IUNIT
1
CARD 1.3
NTALT
3
CARD 1.4
HT
360.
CARD 2.1
Ps
Xs
CARD 2.2
NUMCON
Fi
Xi
CARD 2.3
Pi
CARD 2.1
NLAYER
2
CARD 2.2
H
GAMA
360.
0.0723
600.
0.0752
CARD 3.1
ISHAPE
1
CARD 3.2
D
120.
CARD 4.1
EC
VC
0.0
0.0
CARD 4.2
ES
VS
29.E+06
0.3
CARD 4.3
ER
VR
0.0
0.0
CARD 5.1.1
LNTP
WL
20
0.0
RKO
0.6667
0.4286
E
5000.
10000.
V
0.4
0.3
6-7
6-8
Example Problems
* CARD 5.1.2
* Tb
Tt
2.094 0.718
* CARD 7.1
* NUMRELEASE
0
* CARD 7.2
* Xi
Yi
* END
W
16.
A
2.396
I
1.915
Example Problems
Figure 6.1
Schematic tunnel section view for example 1
6-9
6-10
Example Problems
Liner Cross Section Property (16" width four-flange steel plate)
Figure 6.1
W
=
16 in
A
=
2.396 in2
I
=
1.915 in4
t
=
0.239 in
Tb
=
2.094 in
Tt
=
0.718 in
E
=
29. x 106 psi
<
=
0.3
Min. Tensile Strength =
42,000 psi
Min. Yield Strength
28,000 psi
=
Schematic tunnel section view for example 1 (Continued)
Example Problems
Figure 6.2
6-11
6-12
Example Problems
Figure 6.3
Example Problems
Figure 6.4
6-13
6-14
Example Problems
Figure 6.5
Example Problems
Figure 6.6
6-15
6-16
Example Problems
Figure 6.7
Example Problems
Figure 6.8
6-17
6-18
Example Problems
Figure 6.9
Example Problems
Figure 6.10
6-19
6-20
Example Problems
Figure 6.11
Example Problems
Figure 6.12
6-21
6-22
Example Problems
Figure 6.13
Example Problems
Figure 6.14
6-23
6-24
Example Problems
6.2 Example 2
Example 2 represents steel gas pipeline subjected to concentrated and
distributed loads applied on the ground surface as well as the uniformly
distributed internal gas pressure acting on the pipe wall. Table 6.4 shows
the listing of input file EX2.DAT. Figure 6.15 shows finite element meshes
along with soil layers.
Results
Partial graphical outputs are shown in Figures 6.16 to 6.23.
Key results are summarized below:
Max. Liner hoop stress of 1,276 kg/Cm2 takes place at the inner face of
tunnel crown as shown in Figure 6.22. Assuming that the yield stress of
steel liner is 2,530 kg/Cm2 , the safety factor is close to 2.
Example Problems
Table 6.4
*
*
:
*
*
*
*
*
*
*
*
*
*
*
*
*
*
*
*
*
*
*
*
*
*
*
*
*
Listing of input file for Example 2
CARD 1.1
TITLE
Buried Gas Pipeline For Example 2
CARD 1.2
IUNIT
2
CARD 1.3
NTALT
4
CARD 1.4
HT
688.
CARD 2.1
Ps
Xs
10.
5.0
CARD 2.2
NUMCON
2
Fi
Xi
250. 0.0
500. 2.0
CARD 2.3
Pi
10.
CARD 2.1
NLAYER
4
CARD 2.2
H
GAMA
RKO
E
V
500.
0.002
0.4
230.
0.3
120.
0.002
0.4
230.
0.3
116.
0.0022
0.33
250.
0.25
300.
0.0023
0.31
300.
0.25
CARD 3.1
ISHAPE
1
CARD 3.2
D
76.2
CARD 4.1
EC
VC
0.0
0.0
CARD 4.2
ES
VS
2.11E+06 0.3
6-25
6-26
Example Problems
* CARD 4.3
* ER
VR
0.0
0.0
* CARD 5.1.1
* LNTP
WL
9
0.0
* CARD 5.1.2
* Ts
1.7
* CARD 7.1
* NUMRELEASE
0
* CARD 7.2
* Xi
Yi
* END
Example Problems
Figure 6.15
6-27
6-28
Example Problems
Figure 6.16
Example Problems
Figure 6.17
6-29
6-30
Example Problems
Figure 6.18
Example Problems
Figure 6.19
6-31
6-32
Example Problems
Figure 6.20
Example Problems
Figure 6.21
6-33
6-34
Example Problems
Figure 6.22
Example Problems
Figure 6.23
6-35