1
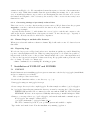
Help Document for Wqed and the WET Reduction Suite
Susan E. Thompson & Fergal Mullally
July 21, 2009
1
General Idea
As reductions go, time resolved photometry is one of the easier problems in astronomy. The
problem for the Whole Earth Telescope (WET) is one of standardisation. During a WET run,
data is pouring into headquarters from all over the world and every minute of the day (and
night). Each telescope may have a different camera, different software and different conventions
and it all needs to be reduced and analysed quickly. Afterwards, the data needs to be stored in a
manner that makes it possible find a given dataset, and to easily determine what was observed,
where and when. Many of the problems faced by the WET in this regard are experienced on a
smaller scale by individual observers.
Data collection can be broken into the following steps.
Acquisition – Taking the data
Calibration – Dark subtraction, Flat fields etc.
Extraction – Turning fits files into light curves.
Correction – Removing the effects of clouds etc.
Analysis – Making sense of it all.
The WET typically performs calibration and extraction with iraf and Antonio Kanaan’s
ccd hsp package. The Wqed suite is useful for the last two steps, correction and analysis. The
goal is to take the output of Antonio’s routines (one or more runs from one or more telescopes) and
create a light curve (LC) and Fourier Transform (FT). Whiff uses the information stored in the
fits header of an image to create ascii header text used to keep track of your data. Wqed allows
you to manipulate the data; dividing by reference stars to remove the effect of cloud, removing
bad points, etc. It also calculates the barycentric correction 1 . Weld and Wmd provide two
different options for combining data from different runs. A number of scripts provide some
lightweight analysis tools.
Although written for use by the WET, the various tools in the package should be easy to
adapt and use for reducing other variable star time-series data.
1.1
Changelog since version 1.0
• Fixed two small bugs in how barycentric corrections are calculated. See § 6.7.1 for more
details
• Added support for reducing 3 channel phototube data. See § 6.2.
1
Barycentric correction is the difference between the observed time of an event, and the time that event would
be observer at the centre of mass of the solar system
1
• Output files includes information on how barycentric correction is calculated, to help find
errors.
• A new script, update-leapseconds keeps the leap seconds file up to date.
• fitlc and fitdata now apply the barycentric corrections to data if available.
• Fix bug in whiff where the first day of the year was handled incorrectly.
• Improved support for gcc version 4.3.2.
• Numerous bug fixes that reduced memory leaks and improved stability
2
Installation
2.1
Requirements
The WET reduction suite is written for the X11 environment common among Unix-like systems.
It requires C and Fortran compilers to install. It also requires Perl and the pgplot package to
run. The pgplot extensions to perl are also necessary to run some of the scripts.
2.2
Obtaining the Package
The package can be downloaded as a tar ball from http://www.physics.udel.edu/darc/. If
you want to contribute to the code, either with bug fixes, new features, or improvements to
the manual, you will need access to the subversion repository. Talk to Susan, or email her at
[email protected].
2.3
Installation
On most systems, pgplot will be the only required component not already installed. Pgplot is a
set of plotting routines written in Fortran that is popular with many astronomers. Pgplot can be
downloaded from www.astro.caltech.edu/∼tjp/pgplot/. It comes with some fairly detailed
instructions, and we provide some additional help in §7. Follow the installation instructions,
ensuring that you also compile the C bindings.
To compile and install Wqed and its associated programs, download the package from the url
given above. Unpack it using tar
: tar -zxvf wqed.tgz
Wqed needs two pieces of information to install correctly, and you need to find these yourself.
The first is the location of the file libX11.so 2 . Try
: locate libX11.so
or failing that
: find /usr -name ‘libX11.so’
If you have a working X11 environment you definitely have this file, so keep looking. The second
piece of information is the location of your pgplot installation. Specifically, you need the path of
the files libpgplot.so and libcpgplot.so 3 .
Edit the file Makefile by setting the variable XlibLibrary to the path of libX11.so, and the
pgInclude variable to the location of pgplot.
Run make from the command line
: make all
2
3
On macs, this may be called libX11.dy or somesuch
On some installations, you may find the (equally acceptable) statically linked libraries with the extension .a
2
If you see error messages after this step play with the values of these two variables until you
get it to work, consulting your local unix guru for help.
Once Wqed compiles, you probably want to put links to Wqed various scripts and binaries in
your bin directory so you can easily access run the programs. The script installwqed will create
soft links into your $HOME/bin directory for all the programs in the wqed/bin directory. If you
do not have $HOME/bin directory, create one before running installwqed. You do not need root
access for this step.
Installwqed also creates a directory calls $HOME/.wet and adds some necessary configuration
files to it. If this directory already exists, it updates the configuration files.
Compiling on a Mac
Installation on a Mac has been successfully performed for OS X. You will need fink and X11
installed on your mac, if not installed you will find them on the disks that come with your Mac.
Fink requires the most current version of Ctab before it will allow you to install or update software. These are mac development tools that can be found on the mac web sites. If you didn’t
have X11 installed, you may also find that you are missing fortran and a c compiler, necessary for
wqed. Look for gcc and fortran on fink and install these packages. A good place to get a lot of astronomy tools is the Scisoft package (http://web.mac.com/npirzkal/Scisoft/Scisoft.html).
It includes such tools as iraf, wcstools and pgplot. Its version of pgplot is not compiled. However, installing pgplot is easy with fink. You must include the unstable tree in fink. To do this
type “fink configure; fink selfupdate; fink selfupdate-cvs; fink index; fink scanpackages”. Then to
install pgplot, run “fink install pgplot”. The pgplot librray and code is then in /sw/lib/pgplot.
At this point you can use makewqed, making the appropriate changes to the directories at the
top of the file.
3
Tutorial
Data reduction proceeds as follows.
• Extract light curves using Antonio’s IRAF routines or your favourite aperture photometry
package.
• Choose the optimal aperture light curve from the output of the previous step.
• Convert the data to the Wqed format using whiff.
• Correct the data using Wqed .
• Merge light curves from different runs using weld.
• Analyze the light curves with your favorite Fourier Transform programs (e.g. period04 or
fitlc — see §4.3).
This tutorial assumes that your are using Antonio’s routines to extract your lightcurve. If
you prefer to use some other package, it will be helpful to know what the format of the expected
output is so you can adapt your output if necessary. Alternatively, you can skip to §6.5 to see
the specification of the Wqed data format. Antonio’s routines produce a number of files with the
extension ‘..star-sky’, one per aperture size used in his extraction. Each line of the file stores the
information for a single image. The first column is the julian day of the exposure (as extracted
from the fits header). Each succeeding pair of columns lists the sky subtracted flux from a star,
and the sky flux that was subtracted from the star.
3
3.1
Some example data
We have included some example data in the directory example. There is data from two telescopes,
“hawaii” and “mcdonald”, in two subdirectories. Both telescopes observed the same star, G3829. For each telescope, we provide a single fits file, and the lightcurve output of ccd hsp for
different apertures. We will use the data from McDonald in our example.
3.2
Choosing the optimal aperture
Antonio’s routines reduce all marked stars in a field with a number of different apertures, one aperture per output file. For the McDonald data, these files are called g3829 mcdonal 20071110 ??..starsky, where ?? is the aperture size used.
The first step is to choose the extraction with the optimal aperture size.
: chooselc g3829 -a -d
Chooselc will consider every file that starts with the string “g3829”. The -a indicates that
the data is in the format alternating columns of star and sky. The -d flags instructs chooselc to
divide the first star column by the second star column. For an undivided lightcurve, omit this
flag.
A pgplot window will open, with 3 panels, showing a lightcurve from 3 different files. Use
[Enter] and [Backspace] to page through the lightcurves (or left and right click with your mouse).
[Z] and [SHIFT]+[Z] zoom in and out and [U] and [D] to scroll up and down. Hit [?] to see this
list of commands. When you are satisfied, hit [Q] to quit. A list of the files examined will be
displayed in your xterm. Type the number beside your preferred file. The output file will be
called g3829 mcdonal 20071110 12.sec and the times have been converted to seconds.
3.3
Creating a Header with Whiff
The purpose of Whiff (Wet Header from Initial Fits File) is to read the header of a fits file and
create a WET header containing information pertinent to a run in a simple, but standard format
that can be easily read by both humans and machines. The format of a WET header is described
in more detail in §6.5. The usage is
: whiff file.fits -o observatory
file.fits is the fits file for the first image in the lightcurve 4 . For our example, we will type
: whiff A1618.0001.fits -o mcdo
The header is saved to a file with the extension .head. If you have already created the .sec file
above, you can create a WET format light curve directly using
: whiff A1618.0001.fits -o mcdo -l g3829 mcdonal 20071110 12.sec
Whiff generates a name for the output file by combining the observatory, date and hour of
the run. For our data, taken at McDonald on 2007-11-10 at 03:30:19 UTC, the output filename
(known as the run name) will be mcdo071110-03.wq.
To create a header for data from other telescopes, type ‘whiff -o’ to see a list of recognised
observatories. If your telescope participated in a recent WET run then whiff probably already
understands the format of your fits file. If not, it is easy to configure Whiff to understand a new
telescope’s fits file. See §6.3.
3.4
Wqed
The purpose of Wqed is to remove atmospheric and instrumental effects from data, as well as to
remove hopelessly corrupted data from the light curve. This is primarily achieved by offering an
4
Antonio’s routines automatically create a file called tapered first image.fits so you know which image was the
first processed by hsp nd.
4
interactive way of dividing a lightcurve by one or more reference stars, selecting and removing bad
points, and fitting and removing trends in the data. It also calculates the appropriate barycentric
corrections, and writes that information to the header.
Wqed is an re-design of the old DOS program, qed, written by Ed Nather. qed was designed
to work with 2 or 3 channel PMT data taken with a specific program called Quilt, and started
to creak when exposed to data extracted from ccds. While advances in technology (not to
mention newer versions of Windows) rendered qed obsolete, the basic user interface was sound
and was largely copied in Wqed. Users familiar with qed should feel at home in Wqed, although
some features have improved, and others (e.g. extinction correction) have not been implemented.
Wqed stands for Wet Qed, and is pronounced “wicked”.
3.4.1
Start up
To run Wqed on our recently created file, simply type
:wqed mcdo071110-03.wq
On startup, Wqed reads two configuration files necessary for calculating barycentric corrections, stars.dat and leapseconds.dat, both of which should be stored in $HOME/.wet. stars.dat
is a list of star names and their right ascension and declination, leapseconds.dat is a list of all
leapseconds applied to UTC and when they were applied 5 . Improperly corrected times are a
menace to time resolved astronomy, and so Wqed will halt if these files are not found. If for
some reason you badly need to reduce data without proper timings use the -b flag, but do so
with caution.
: wqed file.wq -b
Having found its configuration files, Wqed then tries to determine what object was observed
in this run, and when, by reading the keywords Object, UTC and Date from the header. If one
of these lines is not found, Wqed will complain and quit. Override this behaviour with the -b
flag.
Finally, if you have a file with a non-standard header that Wqed cannot understand, you can
instruct Wqed to ignore n lines of header with the flag -i n. This option implicitly sets the -b
flag.
: wqed file.wq -i 10
3.4.2
Reductions
Having successfully calculated the barycentric correction, Wqed now searches for previous reductions. If it finds any, it will prompt you to delete them. This is probably a good idea, because
Wqed will append any new reductions to those files. If you want to keep your old reductions, hit
[N] for No, and quit without reducing.
A pgplot window will now appear (see Figure 1). The white dots are the target star channel,
blue dots are the sky channel, and other coloured lines are reference stars. The average counts
from each star is displayed in the appropriate colour on the left margin. Some information about
the run is at top, and a text window at the bottom displays important messages.
The most recent message instructs to user to “Type ? for a list of commands”. Highlight the
pgplot window and type [?]. This will cause short help message to be displayed in the xterm
window.
Select the red channel by hitting [2]. Hide that lightcurve by hitting [H]. Re-show the
lightcurve by hitting [H] again. Repeat the process for the green light curve by hitting [3].
Some users may prefer to see lightcurves plotted as solid lines instead of just as dots. Toggle
connected lines using [C].
5
While you should feel free to add new objects to stars.dat, you should not edit the file leapseconds.dat. If the
file needs to be updated, use the update-leapsecond script included with this package.
5
Figure 1: Example Wqed startup screen. The header tells you the telescope, object name and date
and time of your first observation. The channel numbers, referring to the separate columns/stars
in your input file, are found on the right. Use these numbers to select each channel/star. The
number on left show the average number of counts in each channel.
Just like chooselc, the [Z] key allows you to zoom into a certain region of the screen. Type
[Z] and the cursor changes from cross-hairs to a box. Move the mouse to encompass the area
you want to zoom into, and hit [Z] again. To un-zoom, type [SHIFT]+[Z]. Note this zooms back
a step, but does not return to the original zoom level. To (Un)zoom back to the initial screen
size, type [U].
Points badly affected by cloud, or otherwise undesirable, can be removed from the lightcurve,
or garbaged. Type [G], select the region with the bad points and type [G] again. Note that
only points from the currently selected channel are removed, others are ignored. To select all
bad points in a given time interval from all channels, use [SHIFT]+[G]. Select a region using
[Ctrl]+[G] and all points outside this region will be removed. Unhappy with your selection? Use
[CTRL]+[U] to undo a step. Most actions which change the lightcurve can be undone. The
maximum number of undo steps is currently set at 30.
Two other useful operations are division and trend fitting. To divide channel one (the
target star) by channel 2 (a reference star), first select the first channel ([1]), then select the
divide command [/], and then type [2], followed by [ENTER]. You will see that small bumps and
wiggles in the divided lightcurve are removed, but more serious cloud does not divide out well.
Often you will find that parts of the divided lightcurve should be garbaged. Be sure to check for
very high data points that may not appear on the screen. If a point lies off the screen it will be
indicated by an arrow.
A lightcurve can be divided by the sum of two more more channels. For example, to divide
Channel 1 by the sum of Channels 2 and 3, select Channel 1, select the divide command [/], then
6
type [2] and [3] before hitting enter.
Stars typically looked at by the WET are very blue. Most comparison stars are red, and
so are extincted differently at different air masses. This often manifests as a slight curvature in
the divided lightcurve. The size of this affect can be calculated, but it is quicker, and just as
effective, to remove this trend by fitting a low order polynomial. To fit a trend to the data,
select the channel of interest, type [F], and select the order of the polynomial to fit (1 for linear,
2 for quadratic etc.) by typing the appropriate number. A polynomial will be fit and removed
from the data. As a rough rule of thumb, a second order polynomial should be sufficient for
removing the effects of differential extinction.
3.4.3
Saving your results
When the lightcurve has been edited to your satisfaction, it’s time to save your work. Select the
appropriate channel and write the lightcurve to disk by typing [W]. The cursor will change to
a vertical bar, allowing you to select the region of the lightcurve you want to save. To save the
entire lightcurve, just type [E]. If you try to save separate sections of the lightcurve, subsequent
sections will be appended to what was previously saved.
A common request is to save the lightcurves of the target and first reference star (Channels
1 and 2). [SHIFT]+[W] provides a handy shortcut to save both channels at once. Wqed saves a
file with the extension .lc?, where the question mark is replaced with the channel number. The
header from the input file is copied to the output file. Some keywords are added, including two for
the barycentric date of the data 6 . The keyword Bjed is the Barycentric Julian Ephemeris Date
(also known as just Barycentric Julian Date) of the midpoint of the first exposure. BjedCorr, is
the linear barycentric correction to apply to the times. The barycentric date (in days) of the i th
exposure, Ti , is
ti
× BjedCorr
(1)
Ti = Bjed +
86400
where Bjed and BjedCorr are the values of the respective header keywords, and t i is the time
(in seconds) of the ith exposure. The main body of the output file has two columns — time in
seconds and normalised flux.
3.4.4
Wqed command summary
Here is a quick reference for the more utilized commands in Wqed.
Help [?]
Undo last command. [Ctrl]-[U]
Dividing one channel by others [/]
Smooth Gaussian smooths data with a kernel of std deviation of nn seconds, where nn is input
by the user. Usage: nn [ENTER]
Garbage bad points
g to garbage points inside a box of one channel
Shift-g specify an x-range of points to garbage for all channels.
Ctrl-g garbage points outside of a box in one channel
6
Despite the best of intentions, mistakes can be made calculating Barycentric corrections, whether it is incorrect
coordinates, or a forgotten leapsecond. By putting Bjed in the header, but not changing the times for each data
point, we make it easier to correct a Bjed when necessary.
7
Bridge across garbaged points in selected channel. [B]. Bridging is sometimes useful if there is
a small gap in a reference star, but its use on a target star should be frowned upon.
Zooming in and out.
z uses your mouse location to zoom in by drawing a box.
Shift-z zooms out.
x zooms in the x-direction.
Shift-x zooms out in the x-direction.
u goes to the original zoom level.
Fit polynomial and remove from specified channel. [F]
Navigation among your light curves.
o or l move the selected channel up and down.
= or - ([+] or [−]) increase or decrease the y scaling of the selected channel.
< or > scroll right and left
Output Saving your results
w Write one channel.
Shift -w Write the first two channels.
e After hitting W or Shift-W, use [E] to save the entire lightcurve.
If you tell Wqed to write a particular channel more than once, it will append the file. If
you make a mistake saving a file, delete the current output file (eg. abc.lc1) and write the
output again.
3.5
Antonio’s Routines
While we do not support Antonio’s routines, we use their output as the input to the final reduction
pipeline. For completeness, here we quickly describe how to use Antonio’s routines to produce
the star-sky files.
Antonio’s routines are based on IRAF. They are designed to let you mark the stars on the first
fits image you have, perform aperture photometry at different aperture sizes, calculate the Julian
date of each frame and follow the stars as they change position in each frame. You must run
Antonio’s routines by running iraf from the directory with the correct login.cl, one has probably
been created for the observatory whose data you are reducing.
The basic steps of Antonio’s Routines are
mark Used to select each star in the first frame.
setjd Checks that setjd will recognize your date format and observatory name to produce a
correct Julian date.
hsp nd Runs phot at various apertures and produces the star-sky files.
The Iraf routine mark should be run on the first image by typing in into the fname parameter.
The type :go to run the routine. Instructions are provided in your xterm. Basically, activate the
ds9 window and type [w] over each star. Type [r] to close the file and [q] to quit. It will then
prompt you to hit [return] to examine the coordinates you specified. If you are happy, leave the
8
vi window with a [:wq] and type [yes]. Otherwise type [no] and try marking again. This creates
a phot.coords file that is used by phot to do your aperture photometry.
The Iraf routine setjd calculates the Julian date of each file. Run this on at least one file in
your series to make sure it is working correctly. You need a date, time and observatory in your
header to get it to work correctly. Specify which Fits keywords to use for the Date and the UTC.
If the Date also contains UTC, it will use that instead of whatever keyword you type into the
UTC blank. This will use the OBSERVAT keyword to specify your observatory. Make sure your
OBSERVAT equals a known IRAF observatory. You can either change the name in your headers
to something recognized by IRAF or you can add your name to the $iraf/noao/lib/obsdb.dat file.
The Iraf routine hsp nd performs the aperture photometry. You must create a list of fits
images (preferably in the order of time taken); specified as list fil. Then create a base output
name for base out, the program will attache the apeture sizes to this name. Pick the method
to follow the stars, previous, cross or 2dcross; previous is the quickest method. Then pick your
apeture radii with diaf beg and diaf end and diaf stp. The sky radius is determined by annulus
and dannulus. Since you already marked your stars, make mark int=no.
Following the stars is the tricky part. Previous is straight forward, you can however change
the box size in which to search for the star with the ceterpars function. Change cbox to a
reasonable box width. If you use cross you need to also change parameters in immatch. Put two
of your images in the images and reference parameters. Then pick an section size to do the cross
correlation, in the form [x1:x2,y1:y1]. When you run :go, you should see to not quite overlapping
peaks. 2dcross takes forever and should only be run if nothing else has worked.
When hsp nd is finished working you will have star-sky files that can be used for the begining
of the Wqed pipline, as described above.
9
4
4.1
Quick analysis
wqplot
After reducing a run, you will have a light curve with a WET header. The first thing you will
want to do is plot the reduced light curve and its Fourier Transform. The quickest way to do
this is with wqplot. You provide the light curve and it will take the FT (with a program called
dodft) and produce a plot.
:wqplot mcdo071110-037.lc1 [-w] [-o file.ps] [-r 0 10000]
Use the -w flag to see the window of the FT. The -o flag will create a postscript file of your
image. The -r flag allows you to specify the range of the FT.
4.2
wqreport
Wqreport provides an interface to quickly view the header information for all the runs in a
directory. The command
:wqreport
Recursively searches the current directory for files with the extension .lc1 and outputs the
value of the keywords Date, UTC, Observatory, Object and Exposure time. It also calculates the
length of the run (i.e time between the first and last data point in a file). The last column is the
name of the file. The output is formatted to fit on one line of an 80 column terminal window.
If you want to search for files with a different extension, use the -w flag
: wqreport -w lc2
If you want to search a directory other than the current one, provide the desired directory as
an argument.
: wqreport /data/telescope1/
4.3
fitlc
After reducing a run, use fitlc to interactively examine the lightcurve and its FT. Type
:fitlc mcdo071110-037.lc1
An FT of the data will appear in the pgplot window previously used by Wqed. Movement
commands available in Wqed are reproduced in fitlc. The following commands are also useful.
Toggle Lightcurve display: Hit [L] to toggle between lightcurve and FT. The most recent fit
to the data will be displayed as a solid red line in the light curve display.
Show Window: Move the mouse to the desired frequency and amplitude and hit [W]. Use [B]
to blink between window and FT.
Do a Linear Fit: Move the mouse to the desired frequency and hit [F]. A sine wave at the
given frequency will be fit to the data, and the results output to the xterm window.
Do a Non-linear Fit: . Move the mouse to the desired frequency and hit [N]. The data is first
fit linearly, and the results of the linear fit are used as initial conditions to a MarquantLevenberg non-linear least squares solution. The result is output to the xterm window.
Multiple Non-linear Fit: . Select multiple frequencies using [M] and hit [ENTER] to do a
simultaneous non-linear least squares solution.
Prewhiten: To subtract the most recent fit from the data hit [P]. The lightcurve display is
updated, and the Fourier Transform is recalculated.
10
Refresh FT: . Calculating FTs is a slow process. To speed up analysis, fitlc only calculates
the FT for the visible window, and calculates a maximum of 4000 points, regardless of the
resolution. To see a portion of the FT in greater detail, zoom in on that region and hit [R].
Show Combination and Harmonic Frequencies: Select an interesting frequency in your
FT (by moving your mouse over it) and type [C]. Thin vertical white lines will appear
denoting the frequency of the first, second and third harmonics of that frequency. Select a
second frequency, hit [C], and thin colour lines will indicate sum and difference frequencies.
Show False Alarm Probabilities: . Select a region of the FT free of obvious peaks using [9].
Red and green dashed lines will appear indicating the amplitudes of peaks which are 99%
likely to be real (i.e not noise peaks) and 99.9% real. Peaks below the green line should be
treated with suspicion unless corroborated by other data 7 .
Saving plots and data: Use [h] to save an image of the currently displayed plot, and [s] to
save a copy of the current (pre-whitened) lightcurve.
Fitlc has a couple of other useful options; consult the help menu.
4.4
fitdata
fitlc has a command line cousin, fitdata. This can be useful for fitting precise periods to data,
and is useful for analysing many runs in batch mode. For example, to non-linearly fit the period
302.2312424 s to a data set, try
: fitdata –nlsf -f mcdo071110-037.lc1 302.2312424
Fitdata’s many other options can be viewed by typing fitdata on the command line with no
arguments.
4.5
dodft
dodft is a command line Fourier transform program, used by wqplot, but also available for general
use. The simplest usage is just
: dodft mcdo071110-037.lc1
which will produce an FT between 0 Hz and the Nyquist frequency oversampled by a factor of
10. There are a number of options for controlling both the input and output that can be listed
by typing dodft with no arguments.
5
Combining Multiple Runs
The purpose of a WET run is to combine data from telescopes all over the world for analysis,
and WET provides two tools for achieving this. Combining different runs is made easier because
Wqed inserts two keywords into the header indicating the barycentric time of start of run (bjed),
and the rate of change of bjed with respect to UTC.
Weld applies the barycentric correction to multiple lightcurves. The default is to use the Bjed
and BjedCorr keywords in your header. However, you can specify other keywords if necessary.
It can either take a file with a list of light curve files, or you can type in a list of files.
Weld outputs the barycentric corrected times and flux for each file in temporal order (i.e
the file with the earliest start time is output first). The Barycentric time of the first data point
is subtracted from each time (unless you specify the -t flag). The times are assumed to be in
seconds (as output by Wqed).
7
The algorithm that calculates these lines has not be properly tested, and may not be correct. Do not use these
lines in a refereed publication
11
5.0.1
Usage
Usage: weld filelist [-k Bjed] [-l BjedCorr] [-o outname] [-t zero time] [-b] [-f files] [-c cuts]
To weld together all the files listed in a file called list using Bjed for the zero times and
BjedCorr for the linear correction in Bjed and output to list.lc.
: weld list -o list.lc
To weld together all the *.lc1 files in the wet directory and output to a file called wet.lc
: weld -o wet.lc -f *.lc1
To create a file with times in days instead of secions
: weld list -b
5.1
Cutting out data from your light curve.
Sometimes after you have all your light curves together you would like to remove overlapping
data, especially when that overlapping data is of much poorer quality. Weld has the ability to
remove parts of the light curves when you create your master light curve. The -c flag allows you
to include a file containing observatory name and dates for where you would like to cut. An
example of that file would look like:
cuts.dat
hawa 4425 4425.9
suho 4444.1 4444.3
mcao 4410.2 4410.5
Usage: weld list -o list.lc -c cuts.dat -b
The observatory names need to match the same observatory code that whiff uses. However
if you type hawaii, it will match with hawa. The times are in MJD-50000.0. This is something
that may change in the future, so be sure to check the helpfile (by typing weld). If you decide
to create bjed files as well, then pound signs (#) are placed in front of those points that you did
not want to include.
The plotting program wplotlc plots your bjed files in different colors. Wplotlc knows not to
read lines that begin with #. In this way you can plot up the light curve with those points your
selected removed, however the information is still in the bjed files in case you want to make small
changes manually. Usage: wplotlc list.bjed [-p 24]
where list.bjed is a list of bjed files to plot, and -p specifies the length of each panel on the
page in hours.
12
6
6.1
Advanced Topics
Reducing 3 channel phototube data
Wqed now has limited support for reducing three channel phototube data. This new feature is
still under development, and will be more complete in later versions. To reduce data taken with
three channel photometers, it must first be converted to the Wqed format. For the most common
three channel data format, Quilt, we provide a script to perform this conversion. To use, simply
type : qed2wqed file.qed
The output will be stored in a file called quiltfile.wq. Run Wqed on this output file, using
the -q flag to initialise three channel mode. Additional functionality is then available
Mark Sky: Hit [M] to mark a region of the currently selected lightcurve as a sky observation.
Mark Sky in All Channels Hit [SHIFT]+[M] to mark a region of all lightcurves as sky
Subtract Sky: Hit [S] to subtract the sky channel from the currently selected lightcurve. If a
region of the data has been marked as sky, the relative sensitivity of the two phototubes is
taken into account when performing the subtraction.
Subtract Sky from All Channels Use [Shift]+[S]
Set Sky Channel Wqed assumes the last column in the input file is the sky channel. If this is
incorrect, hit [Ctrl]+[S] and select the correct channel.
6.2
Reducing 2 channel phototube data
Wqed also has limited support for reducing two channel phototube data. This feature is under
development.
In the case of 2 channel observations, no sky channel exists. The observer occasionally moves
off the stars and observes the sky. Wqed marks the sky and interpolates between the points to
estimate a sky for each channel. Then the two channels can be divided as normal.
To begin you must create a wqed file from the qed file, as described above. The reduction
process when wqed is run using the -q flag is as follows.
Mark Sky: Hit [M] to mark all the sky regions of each channel.
Subtract Sky: For each channel, hit [P] to interpolate the sky region and subtract it from the
data. Notice this is not the same as [S] described above for three channel phototube data.
The sky is created by averaging all the points in each section then drawing a straight line
between the different sky sections. If only one sky section is selected, the mean value of
those points are removed. All regions that were previously sky will now be set as Garbaged
points.
The rest of the reduction process is as before. You can divide the two channels and garbage
any bad points as normal.
6.3
Adding a new observatory to Whiff
To add a new observatory, you must edit the file called ∼/.wet/whiff.dat. The telescope information for the mcdonald observatory would look like
%Information for Mcdonald
mcdo McDonald Observatory
13
instrument INSTRUME
observer OBSERVER
exptime EXPTIME
object OBJECT
date DATE-OBS
utc UTC
filter FILTER
utcstyle 1
datestyle 1
timefrac 0
ArgosRun RUN
C.ArgosRun Argos Run Info
END
Each observatory listing in this file must contain the following features: 1) The line before
you start your observatory must begin with a %. The rest of the line is ignored and can serve as a
comment. 2) The first line after the % must contain the 4 letter observatory code followed by the
name you want written to the Telescope keyword in your Wqed header. 3) The value on the left
is the whiff keyword, the value on the right is the keyword from the FITS file, except for utcstyle,
datestyle, timefrac and any keyword begining with C.. The meaning of utcstyle etc. are explained
below in §6.3.1 4) The end of the observatory information is signified with a line beginning with
END. 5) Any line beginning with a # is ignored when reading in telescope information. Keywords
beginning with C. are comments. For example C.ArgosRun is the comment to accompany the
keyword ArgosRun in the output header.
You may tell whiff to use a different file for the observatory information by running whiff
with the -f flag.
6.3.1
Whiff Keywords
Whiff uses keywords to link pieces of information with the desired FITS keyword. Several of
these are required to successfully run Wqed, some are reserved and always printed by Whiff, and
others you can add so they are put in your Wqed header.
The whiff keywords you must specify are: exptime, date, object, utcstyle, datestyle, timefrac
and usually utc. The keyword exptime should be followed by the Fits keyword containing the
exposure time in seconds. The keyword date should be followed by the Fits keyword containing
the utc date. The keyword object should be followed by the Fits keyword containing the star’s
name. If none exists, you may use the -s flag provided with whiff. The keyword datestyle is ‘1’ for
dates formatted as yyyy-mm-dd 8 , ‘2’ for yyyy-mm-ddThh-mm-ss and ‘3’ for dd/mm/yyyy. The
keyword utcstyle is 0 if the time should be extracted from the date (used with datestyle 2) and
1 if your time is hh:mm:ss.ss9 . The whiff keyword timefrac is the fraction of the exposure time
when the time was written, as measured from the beginning of the exposure. For the time written
at the start of exposure, timefrac=0, for the time written at the end of exposure timefrac=1.
The whiff keywords that are reserved for values that are always included in the header are:
instrument, observer, and filter. These keywords create the information found in Instrument,
Observer and Filter of your Wqed header.
You may add any keyword you like by creating a whiff keyword by that name. See ArgosRun
above. The final header created by whiff will contain the keyword ‘ArgosRun’ and the value will
be the value contained in ‘RUN’ of the fits file provided. To add a comment to your new keyword
8
9
yyyy:mm:dd and yyyy mm dd also work with datestyle=1.
hh mm ss.ss and hh-mm-ss.ss also work with utcstyle 1
14
supply a whiff keyword that begins with a ‘C.’. For this example, we have included the keyword
C.ArgosRun. Whatever you enter for that keyword will appear in the comments section of the
‘ArgosRun’ key.
Finally, we note that the complexity in whiff reflects the endless variation in formats that
different observatories use to denote time and date in their fits headers. As a famous astronomer
once said, “if you think this is hard to read, spare a thought for those who had to write it”.
6.4
Editting Wqed config files
Wqed has two configuration files, stored in the directory $HOME/.wet. Both files are necessary
for calculating barycentric corrections. stars.dat is a list of the right ascensions and declinations,
while leapseconds.dat is a list of when all leap seconds were applied to UTC.
The format of stars.dat is very simple. It consists of 7 columns separated by whitespace. The
first column is the name of the star, all as one word (e.g. PG1351+489, not PG 1351+489). The
next 6 columns are the right ascension (hours minutes seconds) and declination (hours minutes
and seconds). The epoch of the coordinates is J2000. Take care when adding the position of a
star that you use this epoch, or your corrections will be wrong.
This is not a fixed format file, you can separate different columns by one whitespace character
or a hundred. However, for the sake of neatness, we try to keep the columns aligned. If you
have two or more names that you commonly see for the same star (e.g PYVul, G185-32 or
WDJ1937+2743), make a different entry for each name, keeping the coordinates the same.
leapseconds.dat is lists the dates of all leapseonds applied to UTC. You should not edit this
file, instead, download a new one when necessary from USNO (ftp://maia.usno.navy.mil/ser7/taiutc.dat). It is your responsibility to download the latest version of this file whenever
a new leapsecond is applied.
6.5
Data format
The Wqed data format is designed to be easy to read by both machines and humans. A Wqed
file consists of two parts, a header and data. The header is composed of a series of cards, each
containing a key, value and comment. The format, in C syntax is
#%-15s=%-34s#%-27s\n, key, value, comment
This means that card starts with a # symbol, a left-aligned string of exactly 15 characters
for the key, an equals sign, a string of exactly 34 characters for the value, a second #, followed
by up to 27 characters of a comment, followed by a newline character. Actually, all characters
from the second # to the newline are optional, so the following are all legal cards.
#Telescope
=McDonald 82-in
#Telescope Name
\n
#Telescope
=McDonald 82-in
#Telescope Name\n
#Telescope
=McDonald 82-in
#\n
#Telescope
=McDonald 82-in
\n
At a minimum, three cards are required for a legal header, Object, Date and UTC. UTC is
the Universal Time Corrected of the midpoint of the first exposure time. The format for date
is yyyy-mm-dd, while time is hh:mm:ss[.sss], where the fractions of a second are optional. For
example, the initial impact of comet Shoemaker-Levy 9 10 and Jupiter occured on Date 1994-0716 and UTC 20:15:00. There is no limit on the number of other cards that can be included –
indeed the more cards included the easier it will be to figure out what the data in the file refers
to.
The data part of the format consists of rows of numbers. The zeroth column is the number of
seconds between the time indicated by by the keyword UTC in the header and the midpoint of
10
http://en.wikipedia.org/wiki/Shoemaker levy 9
15
the current exposure. The next 8 columns give the observed number of (sky subtracted) counts
from a single star for the exposure. There is two restriction of the format of this number. It must
be positive definite, and machine readable as a double precision floating point number. So 12,
12., 12.0, 12.3456 are all acceptable, as is 1.23456e1. Using ‘d’ is not acceptable for exponential
notation. The final column is an estimate of the sky flux.
The reduced file has a slightly different format. The data section consists of two columns, time
(as before), and flux in units of fractional amplitude. To convert a flux to fractional amplitude,
divide by the average flux and subtract 1. Fluxes given in fractional amplitudes may be negative.
6.6
Working with raw data in different formats
As described in the Tutorial, the Wqed package provides a script for dealing with the output of
the ccd hsp iraf routine, called chooselc. We also provide a number of other scripts which may
be useful in converting the format of data from other sources. When manipulating data files,
awk is typically the most useful tool available. You may find these two tools useful. days2sec
converts the first column of a file from units of days to units of seconds. picklc is the interactive
interface for examining a number of different lightcurves used by chooselc. Takes in input file
and plots 3 columns of that file at a time on the screen. Hit [ENTER] to see the next lightcurve,
and [Backspace] to go backwards.
6.7
Barycentric Corrections
For each run, Wqed calculated a barycentric correction based on four pieces of information.
The date and time of observation (taken from the header), the position of the star (taken from
stars.dat), and the difference between UTC and UT, taken from the file leapseconds.dat. Because
any of these sources of information may in error, the barycentric correction is written only to the
header, so that correcting it at a later date is significantly easier.
The corrections themselves are calculated using the method of Stumpff (1980, A&AS 41:1).
This is the same method used by two older programs used by the Whole Earth Telescope, QED
(written by Ed Nather) and XQED (written by Reed Riddle). The relevant code in Wqed is
taken directly from XQED.
6.7.1
Errors in Wqed 1.0
Despite our bests efforts, three small bugs crept into the previously released version of Wqed.
These bugs do not significantly change the barycentric calculation, and we provide a tool to test,
and correct your previously reduced data.
• Leapseconds were not correctly applied on the day they were introduced. For example, for
data taken on 1999 Jan 1, 63 leapseconds were applied instead of 64. This bug is now fixed.
• When the positions of stars were being read in from stars.dat, the value of seconds of right
ascension was incorrectly set to minutes of right ascension. In tests, we find this introduced
an error in the calculated barycentric date of 0.002 to 0.08 seconds. This bug is now fixed.
• whiff incorrectly extracted dates from fits files for the 30th and 31st December of any given
year, returning nonsensical results.
To test our barycentric calculation we compare our result to the JPL DE405 emphemerides
as determined by IDL’s cmephem package 11 . We calculated the barycentric correction for 10,000
randomly chosen ra/dec and dates between 1970 and 2030, and compared the result with the
11
http://cow.physics.wisc.edu/ craigm/idl/ephem.html
16
estimate from Wqed’s code. We currently find a mean discrepancy of 4.6×10 −4 but an rms scatter
of 0.08 seconds. While this is smaller than the typical timing uncertainty due to photometric
error, it is still larger than we expect, and we are investigating its cause. Because we do not use
the latitude and longitude of the observatory, the accuracy of the correction is never any better
than 0.02 seconds.
6.7.2
Correcting timings of previously reduced data
There is no need to re-reduce data from the previous version of Wqed. Instead use the program
wqverify to search for, and fix, headers where the time is off by more than 10ms.
The usage is simple:
: wqverify file1.lc1 file2.lc1 [...] will calculate the correct bjed for each file and compare to the
value in the header, warning when a discrepancy is found. To fix a header, type : wqverify -f
file1.lc1 The old header is saved to file1.hd for comparison.
6.8
Known Bugs or undesireable features
When given a data file with more than 10 columns, Wqed will crash on exit. No data is lost in
this crash.
6.9
Reporting bugs
We welcome bug reports on Wqed and endeavour to fix them as quickly as possible. Email bug
reports to [email protected]. When reporting bugs please be as detailed as possible to
help us track down the source of the problem. Always include the copies of the input files used
to discover the bug and a description of what went wrong. If a program crashes, please also send
the core dump. To enable core dumps, type
: ulimit -c unlimited before running the offending program.
7
7.1
Installation of PGPLOT and PGPERL
PGPLOT
Detailed instructions for installing pgplot are given at www.astro.caltech.edu/∼tjp/pgplot/install.html,
and we recommend you read them.
The overall procedure is as follows.
Download the distribution files to some directory. e.g. /opt
Untar pgplot using tar -zxvf pgplot5.2.tar.gz
Create a target directory for the compiled pgplot. For this example we will use /opt/local/pgplot
In /opt/pgplot/drivers.list uncomment the drivers you want by removing the !. Wqed requires
XSERVE, GIF and CPS. We recommend you also uncomment VGIF, PS, VPS, VCPS and
XWINDOW. We have often experienced difficulty when trying to install bindings for PNG.
Change to your target directory, /opt/local/pgplot, and run the makemake command as specified by pgplot. An example of this would be
/opt/pgplot/makemake /opt/pgplot linux g77 gcc
The exact command depends on your operating system and available compiler.
Type ‘make’ and ‘make clean’. Test the installation by running ./pgdemo1
17
Install the C bindings to pgplot by running
make cpg. C bindings are required for Wqed.
Environmental Variables. You must add two variables to your shell envirnoment. If you are
using bash, add the following to your .bashrc file
LD LIBRARY PATH=$LD LIBRARY PATH:/opt/local/pgplot
export LD LIBRARY PATH
PGPLOT DIR=/opt/local/pgplot
export PGPLOT DIR
For C-shell, add the following to your .cshrc file
setenv LD LIBRARY PATH $LD LIBRARY PATH:/opt/local/pgplot
setenv PGPLOT DIR /opt/local/pgplot
Test the cpgplot installation by running cpgdemo. A demonstration program showing the
capabilities of pgplot should run.
Note you can install pgplot as an ordinary user, and only need to do it as root if you wish
for every user on your machine to have access to pgplot.
7.2
PGPERL
To install pgperl, the perl bindings to the pgplot installation, you must install both the fortran
to perl converter,ExtUtils::F77, and the perl version of pgplot, PGPLOT. This may be done
through CPAN as root.
: perl -MCPAN -e ‘install ExtUtils::F77’
: perl -MCPAN -e ‘install PGPLOT’
If you find that when running programs that use pgperl (wqplot and wplotlc) that you get an
error refering to unresolved symbols, this can be fixed by editing perl’s pgplot makefile. This is
discussed in the Help file. Apparently this occurs because pgperl is not picking up the fact that
you are using a f2c based Fortran compiler (e.g g77 or f2c).
If you used CPAN, pgplot was probably installed in /root/.cpan/build/PGPLOT-2.20. Change
to this directory. Then open Makefile.PL and change the line ”use ExtUtils::F77” to ”use ExtUtils::F77 qw(generic g77)”. Then run the following
: perl Makefile.PL
: make
: make test
This should produce nice plots.
: make install
18