1
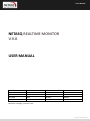
User Manual
NETASQ REALTIME MONITOR
V.9.0
USER MANUAL
Date
April 2010
April 2010
May 2010
may 2012
Version
V8.0
V8.1
V8.2
V9.0
Author
NETASQ
NETASQ
NETASQ
NETASQ
Details
Creation
Update
Update
Update
Reference: naengde_nrmonitor-v9.0
Copyright NETASQ 2011
User Manual
Copyright © NETASQ 2010. All rights reserved.
Any reproduction, adaptation or translation of this current document without prior written permission is
prohibited, except where expressly allowed by copyright laws.
NETASQ applies a method of continual development and as such reserves the right to modify and improve
any product described in the document without prior notice.
Under no circumstances shall NETASQ be held liable for any loss of data or revenue, or any special damage
or incident, resulting from or indirectly caused by the use of the product and its associated documentation.
The contents of this document relate to the developments in NETASQ’s technology at the time of its
writing. With the exception of the mandatory applicable laws, no guarantee shall be made in any form
whatsoever, expressly or implied, including but not limited to implied warranties as to the merchantability
or fitness for a particular purpose, as to the accuracy, reliability or the contents of the document. NETASQ
reserves the right to revise this document, to remove sections or to remove this whole document at any
moment without prior notice.
To ensure the availability of products, which may vary according to your geographical locations, contact
your nearest NETASQ distributor.
Products concerned
U30, U70, U120, U250, U450, U1100, U1500 and U6000,
NG1000-A, NG5000-A,
VS5, VS10, V50, V100, V200, V500, VU.
Copyright NETASQ 2011
User Manual
FOREWORD
1. INTRODUCTION
7
10
1.1. BASIC PRINCIPLES
1.1.1.
Who should read this user guide?
1.1.2.
Typographical conventions
1.1.3.
Vocabulary used in this manual
1.1.4.
Getting help
1.1.5.
Introduction to NETASQ REALTIME
MONITOR
1.2. CONNECTION
1.2.1.
Access
1.2.2.
Connection
1.2.3.
Address book
10
10
10
12
12
12
13
13
14
15
2. GETTING FAMILIAR WITH NETASQ REALTIME MONITOR
19
7
User configuration Manual
2.1. PRESENTATION OF THE INTERFACE
2.1.1.
Main window
2.1.2.
Description of icon
2.1.3.
Menus
2.1.4.
Menu directory
2.1.5.
Result display zone
2.1.6.
Status bar
2.1.7.
Button bar
2.1.8.
Search engine
2.2. INTRODUCTION TO MENUS
2.2.1.
File
2.2.2.
Windows
2.2.3.
Applications
2.2.4.
? (Help)
2.3. APPLICATION SETTINGS
2.3.1.
Behavior at startup
2.3.2.
External tools
2.3.3.
Report
2.3.4.
Address book
2.3.5.
Miscellaneous
2.4. DEFAULT MONITORING SETTINGS
2.4.1.
Updates
2.4.2.
Memory
2.4.3.
Miscellaneous
19
19
20
20
21
22
37
37
38
39
39
39
39
40
40
40
41
42
44
45
46
46
47
48
3. INFORMATION ON FIREWALLS
49
3.1. OVERVIEW
49
3.1.1.
Introduction
49
3.1.2.
Overview of information on vulnerabilities50
3.1.3.
List of firewalls
50
3.1.4.
Connection logs
51
3.2. DASHBOARD
51
3.2.1.
Introduction
51
3.2.2.
Selecting a product
53
3.2.3.
System information
53
3.2.4.
Memory
54
3.2.5.
CPU
54
3.2.6.
Hardware
54
3.2.7.
Active network policies
55
3.2.8.
Alarms
55
3.2.9.
VPN Tunnels
56
3.2.10.
Active Update
56
3.2.11.
Logs
56
3.2.12.
Services
56
3.2.13.
Interfaces
56
3.2.14.
Top 5 interfaces for incoming throughput56
3.2.15.
Top 5 interfaces for outgoing throughput56
3.2.16.
Top 5 hosts for incoming throughput
56
3.2.17.
Top 5 hosts for outgoing throughput
56
4. REAL-TIME INFORMATION
57
4.1. EVENTS
4.2. VULNERABILITY MANAGER
4.2.1.
Introduction
4.2.2.
Vulnerabilities tab
4.2.3.
Application tab
4.2.4.
Events tab
4.3. HOSTS
4.3.1.
“Host” view
4.3.2.
“Vulnerabilities” view
4.3.3.
“Applications” view
4.3.4.
“Information” view
4.3.5.
“Connections” view
4.3.6.
“Events” view
4.4. INTERFACES
4.4.1.
Introduction
4.4.2.
Legend view (or tabular view of
interfaces)
4.4.3.
“Details” view
4.4.4.
“Bandwidth” tab
4.4.5.
“Connections” tab
4.4.6.
“Throughput” tab
4.5. QUALITY OF SERVICE (QoS)
4.6. USERS
4.6.1.
Introduction
4.7. QUARANTINE – ASQ BYPASS
4.7.1.
“Quarantine” view
4.7.2.
“ASQ Bypass” view
57
60
60
61
64
66
69
70
71
72
73
74
75
78
78
5. NETWORK ACTIVITY
88
5.1. VPN TUNNELS
5.2. ACTIVE UPDATE
5.3. 90
5.4. SERVICES
5.5. HARDWARE
5.5.1.
High availability
88
89
6. POLICIES
93
6.1.
6.2.
93
94
FILTER POLICY
VPN POLICY
79
80
80
81
83
84
85
85
86
87
87
91
92
92
7. LOGS
96
7.1. STATUS OF USE
7.2. LOG TYPES
7.2.1.
VPN
7.2.2.
System
96
96
96
97
APPENDICES
98
Appendix A: FAQ
98
Appendix B: NETASQ log files
100
Appendix C: Session and user privileges
110
Appendix D: SA states
111
Appendix E: Sort criteria
112
Appendix F: The Details column in the Events menu
116
Copyright NETASQ 2012
User Manual
FOREWORD
Copyright
© Copyright NETASQ 2011. All rights reserved. Under copyright law, any form of reproduction whatsoever
of this user manual without NETASQ's prior written approval is prohibited. NETASQ rejects all liability
arising from the use of the information contained in these works.
Liability
This manual has undergone several revisions to ensure that the information in it is as accurate as possible.
The descriptions and procedures herein are correct where NETASQ firewalls are concerned. NETASQ
rejects all liability directly or indirectly caused by errors or omissions in the manual as well as for
inconsistencies between the product and the manual.
Notice
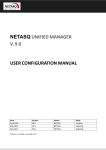
WEEE Directive
7
User configuration Manual
All NETASQ products that are subject to the WEEE directive will be marked with the mandated
"crossed-out wheeled bin" symbol (as shown above) for items shipped on or after August 13,
2005. This symbol means that the product meets the requirements laid down by the WEEE
directive with regards to the destruction and reuse of waste electrical and electronic equipment.
For further details, please refer to NETASQ's website at this address:
http://www.netasq.com/recycling.html
License Agreement
Introduction
The information contained in this document may be changed at any time without prior notification.
Despite the care taken in preparing this document, it may contain some errors. Please do not hesitate to
contact NETASQ if you notice any.
NETASQ will not be held responsible for any error in this document or for any resulting consequence.
Acceptance of terms
By opening the product wrapping or by installing the administration software you will be agreeing to be
bound by all the terms and restrictions of this License Agreement.
Copyright NETASQ 2012
User Manual
License
NETASQ hereby grants, and you accept, a non-exclusive, non-transferable license only to use the object
code of the Product. You may not copy the software and any documentation associated with the Product,
in whole or in part. You acknowledge that the source code of the Product, and the concepts and ideas
incorporated by this Product, are valuable intellectual property of NETASQ. You agree not to copy the
Product, nor attempt to decipher, reverse translate, de-compile, disassemble or create derivative works
based on the Product or any part thereof, or develop any other product containing any of the concepts and
ideas contained in the Product. You will be held liable for damages with interests therein in favor of
NETASQ in any contravention of this agreement.
Limited warranty and limitation of liability
a - Hardware
NETASQ warrants its Hardware products ("Hardware") to be free of defects in materials and workmanship
for a period of one year, in effect at the time the Purchaser order is accepted. This period begins with
effect from the date on which the product is activated.
8
User configuration Manual
b - Software
NETASQ Software products ("Software") are warranted for a period of 90 days (unless otherwise stated at
purchase) from the date of the product’s activation to be free from defects and to operate substantially
according to the manual, as it exists at the date of delivery, under the operating system versions supported
by NETASQ.
NETASQ does not warrant its software products for use with operating systems not specifically identified.
c - Default
NETASQ’s entire liability and your exclusive remedy shall be, at NETASQ’s option, either a return of the
price paid for this License or Product resulting in termination of the agreement, or repair or replacement of
the Product or media that does not meet this limited warranty
d - Warranty
Except for the limited warranties set forth in the preceding paragraph, this product is provided "as is"
without warranty of any kind, either expressed or implied. NETASQ does not warrant that the product will
meet your requirements or that its operation will be uninterrupted or error free. NETASQ disclaims any
implied warranties or merchantability or fitness for particular purpose, or non-infringement.
Copyright NETASQ 2012
User Manual
e - Recommendations
In no event will NETASQ be liable to you or any third party for any damages arising out of this agreement or
the use of the product, including lost profit or savings, whether actual, indirect, incidental, or
consequential, irrespective of whether NETASQ has been advised of the possibility of such damages.
NETASQ’s maximum liability for damages shall be limited to the license fees received by NETASQ under this
license for the particular product(s) which caused the damages.
Any possible legal action relating to the alleged defectiveness of the software will come under the
jurisdiction of NETASQ’s headquarters, French law being the binding authority.
WARNING
1) Certain NETASQ products enable gathering and analyzing logs. This log information allows the
activity of internal users to be tracked and may provide nominative information. The legislation
in force in the destination country may impose the application of certain measures (namely
administrative declarations, for example) when individuals are subject to such monitoring.
Ensure that these possible measures have been applied before any use of the product.
2) NETASQ products may provide cryptographic mechanisms which are restricted or forbidden by
the legislation in force in the destination country. Despite the control made by NETASQ before
exportation, ensure that the legislation in force allows you to use these cryptographic
mechanisms before using NETASQ products.
9
User configuration Manual
3) NETASQ disclaims all liability for any use of the product deemed illegal in the destination
country.
Copyright NETASQ 2012
User Manual
1. INTRODUCTION
1.1.
BASIC PRINCIPLES
1.1.1. Who should read this user guide?
This manual is intended for network administrators or for users with the minimum knowledge of IP.
In order to configure your NETASQ Firewall in the most efficient manner, you must be familiar with these
protocols and their specific features:
ICMP (Internet Control Message Protocol).
IP (Internet Protocol).
TCP (Transmission Control Protocol).
UDP (User Datagram Protocol).
10
User configuration Manual
Knowledge of the general operation of the major TCP/IP services is also preferable:
HTTP
FTP
Mail systems (SMTP, POP3, IMAP).
Telnet
DNS
DHCP
SNMP
NTP
If you do not possess this knowledge, don't worry: any general book on TCP/IP can provide you with the
required elements.
The better your knowledge of TCP/IP, the more efficient will be your filter rules and the greater your IP
security.
1.1.2. Typographical conventions
1.1.2.1.
Abbreviations
For the sake of clarity, the usual abbreviations have been kept. For example, VPN (Virtual Private
Network). Other acronyms will be defined in the Glossary.
1.1.2.2.
Display
Names of windows, menus, sub-menus, buttons and options in the application will be represented in the
following fonts:
I
Menu Vulnerability
Manager
n
d
Copyright NETASQ 2012
User Manual
1.1.2.3.
Indications
Indications in this manual provide important information and are intended to attract your attention.
Among these, you will find:
NOTE/REMARKS
These messages provide a more detailed explanation on a particular point.
WARNING
These messages warn you about the risks involved in performing a certain manipulation or about
how not to use your firewall.
TIP
This message gives you ingenious ideas on using the options on your product.
DEFINITION
Describes technical terms relating to NETASQ or networking. These terms will also be covered in
the glossary.
1.1.2.4.
Messages
Messages that appear in the application are indicated in double quotes.
Example: "Delete this entry?"
11
User configuration Manual
1.1.2.5.
Examples
Example
This allows you to have an example of a procedure explained earlier.
1.1.2.6.
Command lines
Command lines
Indicates a command
command window).
line
(for
example,
an
entry
in
the
DOS
1.1.2.7.
Reminders
Reminders are indicated as follows:
Reminder.
1.1.2.8.
Access to features
Access paths to features are indicated as follows:
Access the menu File\Application settings.
Copyright NETASQ 2012
User Manual
1.1.3. Vocabulary used in this manual
Dialup
Interface on which the modem is connected.
Firewall
NETASQ product to protect and filter your data.
Logs
Records of user activity on the network.
1.1.4. Getting help
To obtain help regarding your product and the different applications in it:
Website: www.netasq.com. Your secure-access area allows you to access a wide range of
documentation and other information.
User manuals: NETASQ UNIFIED MANAGER, NETASQ REAL-TIME and NETASQ EVENT
REPORTER.
1.1.5. Introduction to NETASQ REALTIME MONITOR
12
User configuration Manual
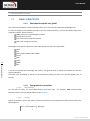
NETASQ REAL-TIME MONITOR allows you to visualize your Firewall’s activity in real time and provides the
information below:
Use of the Firewall’s internal resources (memory, CPU, etc.),
List of raised alarms when vulnerabilities are detected
List of connected hosts and users,
Real-time alarms,
Number of connections, bandwidth use, throughput,
Information on the status of interfaces and VPN tunnels,
Last logs generated,
Use of disk space allocated to logs.
With this tool, you can connect to several Firewalls and supervise all of them.
Copyright NETASQ 2012
User Manual
NETASQ REAL-TIME MONITOR provides a simple display of connections transiting via the Firewall, along
with any alarms it has generated.
Monitor can be shut down by clicking on the cross in the top right corner, but this does not stop it from
operating. Clicking on the Monitor icon in the taskbar restores it.
By default, Monitor can only be run on a machine connected to the internal network and must be running
permanently in order to avoid missing any alarms. You can use it remotely (through the internet) but you
would have to explicitly authorize the service (Firewall_srv) in the filter rules.
1.2.
CONNECTION
1.2.1. Access
There are 2 ways to launch the NETASQ REAL-TIME MONITOR application:
Via the shortcut Applications\Launch the NETASQ REAL-TIME-MONITOR in the
menu bar on other applications in the Administration Suite.
Via the menu Start\Programs\NETASQ\Administration Suite 9.0\NETASQ
REAL-TIME MONITOR.
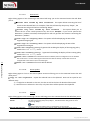
If this is your very first time connecting to your product, a message will prompt you to confirm the serial
number (found on the underside of the firewall).
13
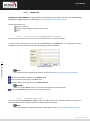
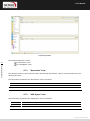
The Overview window will open upon connection:
User configuration Manual
Figure 1: Overview
Copyright NETASQ 2012
User Manual
1.2.2. Connection
NETASQ REAL-TIME MONITOR is opened differently depending on the option chosen in the tab Startup
behavior in Application settings (cf. Part 2/Chapter 3: Startup behavior).
The possible options are:
Direct connection
Connect to automatic connection data sources
None
1.2.2.1.
Direct connection to a NETASQ multifonction Firewall
Direct connection allows you to enter connection information for a specific firewall.
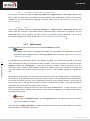
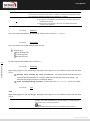
To make a direct connection, go to the menu File\Direct connection. Or, if Monitor has been
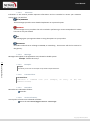
configured to connect directly at startup, the following window will appear:
14
User configuration Manual
Figure 2: Direct connection
NOTE
For more information regarding connection, please refer to Part 2/Chapter3: Startup behavior.
Indicate the firewall’s IP address in the Address field.
Enter the administrator login in the User field.
Enter the administrator password in the Password field.
REMARK
Select the option Read only to connect to the firewall in read-only mode.
Click on the Connect button. The main window will appear.
1.2.2.2.
Opening the address book
Go to the menu File\Address book to open the address book. Or, if Monitor has been configured to
open the address book at startup, the Address book window will appear:
NOTE
For more information regarding the address book, please refer to Part1/Chapter2: Address book.
Copyright NETASQ 2012
User Manual
1.2.2.3.
Connecting automatically to the data source
If this option has been selected in Startup behavior\Application settings, Monitor will
directly open the "Overview" main window and the application will automatically connect to the existing
firewalls. (cf. for more information regarding connection, please refer to the section Part 2/Chapter 3:
Startup behavior.)
1.2.2.4.
None
If this option has been selected in Startup behavior\ Application settings, Monitor will
directly open the "Overview" main window but no application will be connected to the firewall. Only the
Overview menu will be enabled. The other menus in the directory will be grayed out. (cf. for more
information regarding connection, please refer to Part 2/Chapter 3: Startup behavior.)
1.2.3. Address book
The address book can be accessed from the menu File\Address book.
REMARK
The address book can also be opened automatically upon the startup of the application if you have
selected the option in Application settings/Behaviour at start up. (See Part 2/Chapter
3: Behaviour at start up).
15
User configuration Manual
It is possible to store connection data on your different Firewalls. This information is stored on the same
client workstation on which the interface has been installed. It may be encrypted if you check the option
Address book is encrypted. In this case, you will be asked to enter an encryption key. The
information that is stored for each firewall includes the IP address, login name, connection password and
the serial number of the Firewall to which you wish to connect. This password belongs to an authorized
user.
By specifying a serial number, you will protect yourself from “man-in-the-middle” attacks. If you attempt a
connection on an firewall that does not meet the “serial number” criterion indicated in the address book,
the monitor will inform you that you are attempting to connect to an unknown firewall. You will also be
asked if you wish to add this serial number to the list of authorized firewalls. Verify the information
displayed in the monitor before accepting such a request.
Once this information has been entered, you may save it using the Save button. To open a session on one
of the Firewalls from the address book, click on its name then on the OK button, or simply double click on
the name of the Firewall.
WARNING
If you modify the Address book is encrypted option, the address book has to be saved
once more to apply the changes
Check the option Display passwords to check the passwords used for each Firewall saved in the address
book (passwords are displayed in plaintext).
Copyright NETASQ 2012
User Manual
1.2.3.1.
Adding an address
Click on the Add button to add an address to the address book. Other information to supply:
Name
The name of the firewall
Address
IP address of the firewall
Login
The administrator account.
Password
Administrator password
Confirm
Confirms the password
Description
Description or comments regarding the firewall.
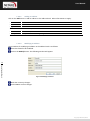
1.2.3.2.
Modifying an address
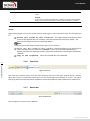
The procedure for modifying an address in the address book is as follows:
Select the firewall to be modified.
Click on the Modify button. The following window will appear:
16
User configuration Manual
Figure 3: Modifying an address
Make the necessary changes.
Click on OK to confirm changes.
Copyright NETASQ 2012
User Manual
1.2.3.3.
Deleting an address
The procedure for deleting a firewall from the address book is as follows:
Select the firewall to delete.
Click on the Delete button. The following message will appear:
"Confirm deletion of these items?"
Click on Yes or No to confirm deletion or cancel.
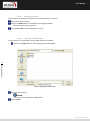
1.2.3.4.
Importing an address book
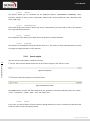
The procedure for importing an existing address book is as follows:
Click on the Import button. The following window will appear:
17
User configuration Manual
Figure 4: Importing the address book
Select the file to import.
REMARK
The file to import should be in .dat format.
Click on Open.
Copyright NETASQ 2012
User Manual
1.2.3.5.
Exporting an address book
The procedure for exporting an existing address book is as follows:
Click on Export. The following window will appear:
18
User configuration Manual
Figure 5: Exporting the address book
Select the file to export.
REMARK
The file to export should be in .dat format.
Click on Save.
1.2.3.6.
Search
The search covers all information found in the columns.
Information can be filtered on a column and the search can then be refined.
Examples:
- Filter on the “Address” column containing 129: a list of results will appear; next, launch a global
search by refining according to address.
- Filter on the “Address” column beginning with “10.2”, then search from the displayed addresses,
hosts with addresses beginning with “10.2.14” by entering only “14” in the search field.
Copyright NETASQ 2012
User Manual
2. GETTING FAMILIAR WITH NETASQ REAL-TIME MONITOR
2.1.
PRESENTATION OF THE INTERFACE
2.1.1. Main window
From this window, you can open several windows, each connected to different firewalls.
19
User configuration Manual
Figure 6: Overview
Once Monitor is connected, it will open a welcome window (Overview Menu) which will display various
types of information on the firewall’s activity.
It consists of five parts:
A menu bar
A horizontal bar containing icons relating to connection and a search zone
A vertical bar containing a menu directory allowing NETASQ REAL-TIME MONITOR options to
be viewed and configured
A result display zone
A status bar
Copyright NETASQ 2012
User Manual
REMARK
The other windows in the menu directory may contain the following buttons:
Refresh
Show/Hide help
Firewall
Duplicate
2.1.2. Description of icon
Connects via the address book.
Connects to a firewall
Disconnects or deletes a connection.
Connects to the selected firewall.
Disconnects from the selected firewall.
Edits the address book address book.
Displays the dashboard of the selected firewall.
Memory.
List of connected hosts (IP address, interface to which the user is connected, amount of data
transferred, number of connections, throughput used...).
List of authenticated users (user name, IP, remaining time on authentication period...).
List of alarms raised (major and minor).
List of active VPN tunnels.
List of active services.
Status of the Active Update module.
Statistics.
Vulnerability Manager…
20
User configuration Manual
2.1.3. Menus
The main window contains the following menus: File, Windows, Applications, and ? (Help).
File
Allows you to connect to Firewalls and to access the application’s general options.
Windows
Allows you to organize the connection windows on the screen.
Applications
Enables you to execute the two other applications making up the NETASQ Administration Suite:
NETASQ UNIFIED MANAGER et NETASQ EVENT REPORTER.
Allows you to access the relevant Help file, and to know which version the monitor runs on.
? (Help)
Copyright NETASQ 2012
User Manual
2.1.4. Menu directory
Overview
Dashboard
Events
Vulnerability Manager
This window lists the firewalls. Monitor opens in this window once the connection has
been established...
The Console sub-menu: When the option Enable is selected in the menu Application
parameters\Miscellaneous in the console zone, you will be able to access firewalls
in console mode (CLI commands). When this window is validated, a Console menu will
be added under the Overview menu directory.
This window gives you a summary of the main information relating to your product’s
activity.
This window lists events that the firewall has raised.
Hosts
This window allows you to view alarms being raised and to get help in the event of
vulnerability.
List of hosts on your network.
Interfaces
This window allows you to get statistics on bandwidth, connections and throughput.
Quality of service
This window allows you to analyze your bandwidth, connections and throughput.
Users
This window allows you to get information on users and session privileges on
authentication.
This window displays the list of dynamically quarantined hosts.
Quarantine - ASQ
Bypass
VPN Tunnels
Hardware
This window displays static information on the operation of VPN tunnels and on the source
and destination.
This window sets out the status of Active Update on the firewall for each type of update
available.
This window shows the active and inactive services on the firewall and how long they have
been active/inactive.
This window shows information on the initialization of high availability and RAID.
Filter policy
This window displays the active filter policy by grouping the implicit and local rules.
VPN policy
This window allows viewing the configuration of different VPN tunnel policies.
Logs
This window allows viewing in real time the size of the log file.
The sub-menu VPN provides information on VPN logs.
The sub-menu System provides system information.
21
User configuration Manual
Active Update
Services
Copyright NETASQ 2012
User Manual
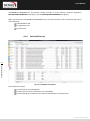
2.1.5. Result display zone
Data and options from the selected menus in the horizontal bar appear in this zone. These windows will be
explained in further detail in the corresponding sections.
2.1.5.1.
Contextual menu on columns
Right-clicking on a column header will display the following options
22
Filter by this column…
Isolates a set of events according to the criteria provided. For example, filtering by
Clear column filter
events with a “minor” protocol. When a filter has been applied to a column, the icon
will appear in blue in the column label. For more information on the sort criteria, please
refer to Appendix F: Sort criteria.]
Removes the filter that was previously set on the column.
Clear all filters
Removes the filters set on all the columns.
Clear all filters except
this
Hide column
Removes the filters set on all the columns except for the filter on the selected column.
Columns
Allows selecting the columns to display.
Adjust column width to
fit contents
Columns will be resized according to the contents.
Hides the selected column.
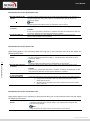
When the menu Filter by this column is selected, the following screen will appear:
User configuration Manual
Figure 7: Filter by this column
The screen relates to the column that had been selected previously. (E.g.: Filter by the “Details” column).
- Hide blank fields option: allows displaying only fields that contain data.
- Filter by selected values: a value can be entered manually or selected from the suggested list.
Copyright NETASQ 2012
User Manual
To create a filter, you only need to select one or several values from the suggested list and add them in
order for them to appear in the section to the right of the table.
You may use the following operators:
Equals: the values found have to be equal to those selected.
Contains: looks for a word in a phrase
Begins with: looks for a phrase beginning with a string
Ends with: looks for a phrase ending with a string.
Joker (Wildcard): See the table below.
Regular expression: cf. http://qt.nokia.com/doc/4.5/qregexp.html
c
E.g., if “c” is entered, the system will search for all occurrences of “c”.
?
Allows searching for a single character.
*
Allows searching for one or several characters.
[…]
Allows entering several characters between square brackets. For example, if [ABCD] is selected,
the search will be conducted for A or B or C or D. If [A-D] is entered, the search will be for ABCD, if
[A-Z] is entered, the search will be for all capital letters.
Events can therefore be filtered according to one or several values. For example, displaying events using
the protocol HTTP or https.
It is also possible to negate a criterion by selecting the option No. For example, displaying all entries except
if the protocol is HTTP.
23
Columns can be resized according to their contents (option Adjust columns to fit contents).
User configuration Manual
Furthermore, the administrator can sort the table by clicking on the column by which he wishes to sort.
2.1.5.2.
Contextual menu on lines
Right-clicking against a line will display a contextual menu that allows various operations. The options
offered vary according to the table.
2.1.5.2.1.
Overview
3 contextual menus can be opened in this window:
When right-clicking against a firewall
When right-clicking against an empty zone in the list of firewalls
When right-clicking against in the “Connection logs” view
Contextual menu relating to a firewall
Show dashboard…
Opens the Dashboard menu of the selected firewall.
Generate an instant web
Clicking on this button will generate a report in HTML. This report will contain
Copyright NETASQ 2012
User Manual
report…
Disconnect
Remove this firewall from the
connection list…
Add a new firewall to the
connection list and connect
to it
Add a firewall from the
address book to the
connection list
Add this firewall to the
address book
Edit the address book
the following information at any given moment: system information, memory,
connected users, services, Active Update status, bandwidth statistics,
connection statistics, vulnerabilities, number of hosts, authenticated users,
number of major and minor alarms, quarantine, the number of VPN tunnels,
filter rules and configured IPSec tunnels.
Allows disconnecting from the selected firewall.
Enables disconnecting and deleting the entry that corresponds to this
connection.
Displays the direct connection window to enable connecting to a firewall.
Opens the address book window to allow the selection of a registered firewall.
Opens a window that will allow saving the selected firewall in the address
book.
Opens the address book window to enable editing.
Contextual menu from right-clicking against an empty zone
24
User configuration Manual
Add a new firewall to the
connection list and connect
to it
Add a firewall from the
address book to the
connection list
Edit the address book
Displays the direct connection window to enable connecting to a firewall.
Opens the address book window to allow the selection of a registered firewall.
Opens the address book window to enable editing.
Contextual menu relating to connection logs
Copy
Copies the selected log line(s).
Copy Link Location
Copies the location of the link.
Select all
Clear logs
Selects all the log lines.
Deletes all log lines.
Copyright NETASQ 2012
User Manual
2.1.5.2.2.
Events
Right-clicking against a line containing an event will bring you to the contextual menu that will allow you to:
Filter by these criteria
View source host…
View destination host…
Send source to quarantine
View packet...
Empty alarms
Copy to the clipboard
2.1.5.2.3.
25
This option allows restricting the list of results to the selected field. For example,
if the data is filtered by the priority “Major”, the administrator will get all the
lines containing “Major”.
NOTE:
Using this option will replace all the current filters on the columns
Indicates the name of the source host. If this option is selected, the Hosts
menu will open.
Indicates the name of the destination host.
Allows quarantining the source host for a fixed period of 1 minute, 5 minutes, 30
minutes or 3 hours.
Allows opening the tool that will allow viewing malicious packets.
Purges the list of displayed alarms.
Copies the selected line to the clipboard.
Vulnerability Manager
User configuration Manual
In the Vulnerability tab, 3 contextual menus can be opened:
When right-clicking against a line detailing a vulnerability
When right-clicking against a line detailing a host
When right-clicking against the help zone
Contextual menu relating to a vulnerability
Right-clicking against a line containing vulnerability will bring you to the contextual menu that will allow
you to:
Filter this column by this
criterion
Filter only this column by
this criteria
Copy to the clipboard
This option allows restricting the list of results to the selected field. For example,
if the data is filtered by the priority “Major”, the administrator will get all the
lines containing “Major”.
NOTE:
Using this option will replace all the current filters on the columns
This option allows you to restrict the list of the results pointed to by the cursor.
Example
If your cursor pointed the destination / website consulted, the displayed list will
only present the elements containing this destination / website.
Copies the selected line to the clipboard.
Copyright NETASQ 2012
User Manual
Contextual menu relating to a host
Right-clicking against a line containing a host will bring you to the contextual menu that will allow you to:
Filter this column by this
criterion
Filter only this column by
this criteria
View the host
Copy to the clipboard
This option allows restricting the list of results to the selected field. For example,
if the data is filtered by the priority “Major”, the administrator will get all the
lines containing “Major”.
NOTE:
Using this option will replace all the current filters on the columns
This option allows you to restrict the list of the results pointed to by the cursor.
Example
If your cursor pointed the destination / website consulted, the displayed list will
only present the elements containing this destination / website.
The Hosts menu directory will open to display additional information on the
detected host. During “pre-filtering”, the host concerned will be selected. The
data will be filtered according to the hostname if available, or by its address.
Copies the selected line to the clipboard. Data can be copied in two different
ways:
1) A single line is selected: in this case, this line as well as the lines of
details will be copied.
2) Several lines are selected: in this case, only these lines will be copied
to the clipboard.
Contextual menu in the help zone
Right-clicking against a help zone will bring you to the contextual menu that will allow you to:
26
User configuration Manual
Copy
Allows copying the help text in order to retrieve it later
Copy the link
Allows copying the hypertext link.
Select all
Allows selecting all the help text.
In the Application tab, 2 contextual menus can be opened:
When right-clicking against a line detailing an application
When right-clicking against a line detailing a host
Contextual menu for a line containing an application
Right-clicking against a line containing an application will bring you to the contextual menu that will allow
you to:
Filter by these criteria
Filter only this column by
this criteria
This option allows restricting the list of results to the selected field. For example,
if the data is filtered by the priority “Major”, the administrator will get all the
lines containing “Major”.
NOTE:
Using this option will replace all the current filters on the columns
This option allows you to restrict the list of the results pointed to by the cursor.
Example
If your cursor pointed the destination / website consulted, the displayed list will
only present the elements containing this destination / website.
Copyright NETASQ 2012
User Manual
Copy to the clipboard:
Copies the selected line to the clipboard. Data can be copied in two different
ways:
1) A single line is selected: in this case, this line as well as the lines of
details will be copied.
2) Several lines are selected: in this case, only these lines will be copied
to the clipboard.
Contextual menu for a line containing a host
Filter this column by this
criterion
Filter only this column by
this criteria
View the host
27
This option allows restricting the list of results to the selected field. For example,
if the data is filtered by the priority “Major”, the administrator will get all the
lines containing “Major”. Caution: this is a new filter system…
NOTE:
Using this option will replace all the current filters on the columns
This option allows you to restrict the list of the results pointed to by the cursor.
Example
If your cursor pointed the destination / website consulted, the displayed list will
only present the elements containing this destination / website.
The Hosts menu directory will open to display additional information on the
detected host. During “pre-filtering”, the host concerned will be selected. The
data will be filtered according to the hostname if available, or by its address.
User configuration Manual
In the Information tab, 3 contextual menus can be opened:
When right-clicking against a line containing information
When right-clicking against a line detailing a host
When right-clicking against the help zone
Contextual menu for a line containing information
Filter by these criteria
Filter only this column by
this criteria
Copy to the clipboard
This option allows restricting the list of results to the selected field. For example,
if the data is filtered by the priority “Major”, the administrator will get all the
lines containing “Major”.
NOTE:
Using this option will replace all the current filters on the columns
This option allows you to restrict the list of the results pointed to by the cursor.
Example
If your cursor pointed the destination / website consulted, the displayed list will
only present the elements containing this destination / website.
Copies the selected line to the clipboard. Data can be copied in two different
ways:
1) A single line is selected: in this case, this line as well as the lines of
details will be copied.
2) Several lines are selected: in this case, only these lines will be copied
to the clipboard.
Copyright NETASQ 2012
User Manual
Contextual menu for a line containing an event
Right-clicking against a line containing an event will bring you to the contextual menu that will allow you to:
Filter by these criteria
Filter only this column by
this criteria
View the host
Copy to the clipboard
28
This option allows restricting the list of results to the selected field. For example,
if the data is filtered by the priority “Major”, the administrator will get all the
lines containing “Major”.
NOTE:
Using this option will replace all the current filters on the columns
This option allows you to restrict the list of the results pointed to by the cursor.
Example
If your cursor pointed the destination / website consulted, the displayed list will
only present the elements containing this destination / website.
The Hosts menu directory will open to display additional information on the
detected host. During “pre-filtering”, the host concerned will be selected. The
data will be filtered according to the hostname if available, or by its address.
Copies the selected line to the clipboard. Data can be copied in two different
ways:
1) A single line is selected: in this case, this line as well as the lines of
details will be copied.
2) Several lines are selected: in this case, only these lines will be copied
to the clipboard.
Contextual menu in the help zone
User configuration Manual
Right-clicking against a help zone will bring you to the contextual menu that will allow you to:
Copy: Allows copying the help text in order to retrieve it later.
Copy the link: Allows copying the hypertext link.
Select all: Allows selecting all the help text.
2.1.5.2.4.
Hosts
Many contextual menus can be opened in this window:
When right-clicking against a host
When right-clicking against the “Vulnerabilities” tab
When right-clicking against the “Applications” tab
When right-clicking against the “Information” tab
When right-clicking against the “Connections” tab
When right-clicking against the “Events” tab
When right-clicking against the help zone
Copyright NETASQ 2012
User Manual
Contextual menu relating to a host
Filter by these criteria
Filter only this column by
this criteria
Remove host from ASQ…
29
This option allows restricting the list of results to the selected field. For example,
if the data is filtered by the priority “Major”, the administrator will get all the
lines containing “Major”.
NOTE:
Using this option will replace all the current filters on the columns
This option allows you to restrict the list of the results pointed to by the cursor.
Example
If your cursor pointed the destination / website consulted, the displayed list will
only present the elements containing this destination / website.
Enables deleting the host’s ASQ information. This may be useful especially if a
host has been hacked. The “Monitor modify” privilege is necessary. A message
will appear, asking you to confirm this action.
User configuration Manual
Reset Vulnerability Manager
information
Resets VULNERABILITY MANAGER data for the selected host. The “Monitor
modify” privilege is necessary. A message will appear, asking you to confirm this
action. When you perform this reset, the host will be deleted from the
VULNERABILITY MANAGER database and as well as from data counters (detected
vulnerabilities, software…).
Send to quarantine
the quarantined host will be dynamically blocked for a duration to be specified.
(This duration can either be 1 minute, 5 minutes, 30 minutes or 3 hours). The
“Monitor modify” privilege is necessary. You will not be asked to confirm this
action.
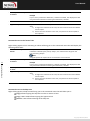
Manually set the Operating System:
Figure 8: Manually set the OS
Copyright NETASQ 2012
User Manual
Current operating system
The OS that NETASQ VULNERABILITY MANAGER uses for detecting vulnerabilities
on a host. The OS of a host may not be detected sometimes.
Detected operating system
OS that NETASQ VULNERABILITY MANAGER detects after performing a traffic
scan on a host. The Restore button allows removing the OS indicated by the
user and reverting to the OS detected by NETASQ VULNERABILITY MANAGER.
In the event the host’s OS is not detected by NETASQ VULNERABILITY
MANAGER, it is possible to impose it by selecting it from the suggested list. In
this case, 2 situations may arise:
New OS name
You are unable to specify the correct version (examples: Android, Blackberry,
etc). In this case, the “Version” field will remain grayed out. Click on OK in order
to force the OS to accept this value.
You are able to specify the version (example: Linux). In this case, the “Version”
field will be modifiable and you will be able to enter a version number (example:
2.6). Next, click on Validate. If VULNERABILITY MANAGER detects the version, a
name will appear (example, Linux 2.6.14). To finish, click on OK in order to
confirm your selection.
Imposing the host’s OS when it has not been detected will allow, in particular,
viewing the vulnerabilities of services and products according to the system.
30
User configuration Manual
Copy to the clipboard : Copies the selected line to the clipboard. Data can be copied in two
different ways:
1) A single line is selected: in this case, this line as well as the lines of details will be copied.
2) Several lines are selected: in this case, only these lines will be copied to the clipboard.
Contextual menu in the “Vulnerabilities” tab
Filter this column by this
criterion
Filter only this column by
this criteria
Copy to the clipboard
This option allows restricting the list of results to the selected field. For example, if
the data is filtered by the priority “Major”, the administrator will get all the lines
containing “Major”.
NOTE :
Using this option will replace all the current filters on the columns
This option allows you to restrict the list of the results pointed to by the cursor.
Example
If your cursor pointed the destination / website consulted, the displayed list will
only present the elements containing this destination / website.
Copies the selected line to the clipboard. Data can be copied in two different
ways::
1) A single line is selected: in this case, this line as well as the lines of
details will be copied.
2) Several lines are selected: in this case, only these lines will be
copied to the clipboard.
Copyright NETASQ 2012
User Manual
Contextual menu in the “Applications” tab
Filter this column by this
criterion
Filter only this column by
this criteria
Copy to the clipboard
This option allows restricting the list of results to the selected field. For example, if
the data is filtered by the priority “Major”, the administrator will get all the lines
containing “Major”.
NOTE:
Using this option will replace all the current filters on the columns
This option allows you to restrict the list of the results pointed to by the cursor.
Example
If your cursor pointed the destination / website consulted, the displayed list will only
present the elements containing this destination / website.
Copies the selected line to the clipboard. All the elements as well as the root
element will be added to the clipboard.
Contextual menu in the “Events” tab
Right-clicking against a line containing data will bring you to the contextual menu that will display the
following information:
Filter this column by this
criterion
31
User configuration Manual
Filter only this column by
this criteria
List the hosts that present
the same information
Copy to the clipboard
This option allows restricting the list of results to the selected field. For example, if
the data is filtered by the priority “Major”, the administrator will get all the lines
containing “Major”.
NOTE:
Using this option will replace all the current filters on the columns
This option allows you to restrict the list of the results pointed to by the cursor.
Example
If your cursor pointed the destination / website consulted, the displayed list will
only present the elements containing this destination / website.
Allows filtering on hosts that have similar events.
Copies the selected line to the clipboard. Data can be copied in two different ways:
1) A single line is selected: in this case, this line as well as the lines of
details will be copied.
2) Several lines are selected: in this case, only these lines will be copied
to the clipboard.
Contextual menu in the “Connections” tab
Right-clicking against a line containing a connection will bring you to the contextual menu that will display
the following information:
Filter this column by this
criterion
This option allows restricting the list of results to the selected field. For example,
if the data is filtered by the priority “Major”, the administrator will get all the
lines containing “Major”.
NOTE:
Using this option will replace all the current filters on the columns
Copyright NETASQ 2012
User Manual
Filter only this column by
this criteria
View host
Copy to the clipboard
This option allows you to restrict the list of the results pointed to by the cursor.
Example
If your cursor pointed the destination / website consulted, the displayed list will
only present the elements containing this destination / website.
This option allows you to view only information of the selected host.
Copies the selected line to the clipboard. Data can be copied in two different
ways:
1) A single line is selected: in this case, this line as well as the lines of details
will be copied.
2) Several lines are selected: in this case, only these lines will be copied to
the clipboard.
Contextual menu in the “Events” tab
Right-clicking against a line containing an alarm will bring you to the contextual menu that will display the
following information:
Filter this column by this
criterion
32
Filter only this column by
this criteria
User configuration Manual
View the packet that raised
the alarm
Copy to the clipboard
This option allows restricting the list of results to the selected field. For example,
if the data is filtered by the priority “Major”, the administrator will get all the
lines containing “Major”.
NOTE:
Using this option will replace all the current filters on the columns
This option allows you to restrict the list of the results pointed to by the cursor.
Example
If your cursor pointed the destination / website consulted, the displayed list will
only present the elements containing this destination / website.
This will open the tool that will allow you to view malicious packets.
Copies the selected line to the clipboard. Data can be copied in two different
ways:
1) A single line is selected: in this case, this line as well as the lines of details
will be copied.
2) Several lines are selected: in this case, only these lines will be copied to
the clipboard.
Contextual menu in the help zone
Right-clicking against a help zone will bring you to the contextual menu that will allow you to:
Copy: Allows copying the help text in order to retrieve it later.
Copy the link: Allows copying the hypertext link.
Select all: Allows selecting all the help text.
Copyright NETASQ 2012
User Manual
2.1.5.2.5.
Interfaces
Right-clicking against a line containing an interface will bring you to the contextual menu that will allow you
to:
Filter by these criteria
This option allows restricting the list of results to the selected field. For
example, if the data is filtered by the priority “Major”, the administrator
will get all the lines containing “Major”.
This option allows you to restrict the list of the results pointed to by the
cursor.
Filter only this column by this
criteria
Display hosts associated with this
interface
2.1.5.2.6.
Example
If your cursor pointed the destination / website consulted, the displayed
list will only present the elements containing this destination / website.
This option allows displaying the list of hosts that have the same interface.
Quality of Service
Please refer to chapter QUALITY OF SERVICE (QoS)
QUALITY OF SERVICE (QoS)
2.1.5.2.7.
33
Users
User configuration Manual
2 contextual menus can be opened in this window:
When right-clicking against the “users” zone
When right-clicking against an “administration sessions” zone
Contextual menu from right-clicking against the “users” zone
Filter this column by
this criterion
Filter only this column
by this criteria
Remove user from ASQ
Copy to the clipboard
This option allows restricting the list of results to the selected field. For example, if the
data is filtered by the priority “Major”, the administrator will get all the lines containing
“Major”.
NOTE:
Using this option will replace all the current filters on the columns
This option allows you to restrict the list of the results pointed to by the cursor.
Example
If your cursor pointed the destination / website consulted, the displayed list will only
present the elements containing this destination / website.
Enables deleting the user’s ASQ information. This may be useful especially if a user has
been affected by an attack. The “Monitor modify” privilege is necessary. A message will
appear, asking you to confirm this action.
Copies the selected line to the clipboard. Data can be copied in two different ways:
1) A single line is selected: in this case, this line as well as the lines of details
will be copied.
2) Several lines are selected: in this case, only these lines will be copied to
the clipboard.
Copyright NETASQ 2012
User Manual
Contextual menu from right-clicking against the “administration sessions” zone
Copy to the clipboard: Copies the selected line to the clipboard. Data can be copied in two
different ways:
1) A single line is selected: in this case, this line as well as the lines of details will be copied.
2) Several lines are selected: in this case, only these lines will be copied to the clipboard.
2.1.5.2.8.
Quarantine – ASQ Bypass
2 contextual menus can be opened in this window:
When right-clicking against the “Quarantine” zone
When right-clicking against an “ASQ Bypass” zone
Contextual menu from right-clicking against the “Quarantine” zone
Right-clicking against a line containing a quarantined host will bring you to the contextual menu that will
allow you to:
Filter this column by this
criterion
34
User configuration Manual
Filter only this column by
this criteria
Copy to the clipboard
This option allows restricting the list of results to the selected field. For example,
if the data is filtered by the priority “Major”, the administrator will get all the
lines containing “Major”.
NOTE:
Using this option will replace all the current filters on the columns
This option allows you to restrict the list of the results pointed to by the cursor.
Example
If your cursor pointed the destination / website consulted, the displayed list will
only present the elements containing this destination / website.
Copies the selected line to the clipboard.
Contextual menu from right-clicking against the “ASQ Bypass” zone
Right-clicking against a line containing a quarantined host will bring you to the contextual menu that will
allow you to:
Filter this column by this
criterion
Filter only this column by
this criteria
Copy to the clipboard
This option allows restricting the list of results to the selected field. For example,
if the data is filtered by the priority “Major”, the administrator will get all the
lines containing “Major”.
This option allows you to restrict the list of the results pointed to by the cursor.
Example
If your cursor pointed the destination / website consulted, the displayed list will
only present the elements containing this destination / website.
Copies the selected line to the clipboard.
Copyright NETASQ 2012
User Manual
2.1.5.2.9.
VPN Tunnels
Right-clicking against a line containing a VPN tunnel will bring you to the contextual menu that will allow
you to:
Filter this column by this criterion: This option allows restricting the list of
results to the selected field. For example, if the data is filtered by the priority “Major”, the
administrator will get all the lines containing “Major”.
Filter only this column by this criteria : This option allows you to
restrict the list of the results pointed to by the cursor. Example : If your cursor pointed the
destination / website consulted, the displayed list will only present the elements containing this
destination / website.
View logs of outgoing SPIs: this option will allow displaying the SPIs of the
negotiated outgoing SA.
View logs of incoming SPIs: this option will allow displaying the SPIs of the
negotiated incoming SA.
View the outgoing policy: hypertext link enabling the display of the outgoing policy
visible in the VPN Policy menu.
View the incoming policy: hypertext link enabling the display of the incoming policy
visible in the VPN Policy menu.
Reset this tunnel: the selected tunnel will be deleted, but the configuration on the firewalls
will still be active. The SAs matching the selected tunnel will be cleared; new SAs will have to be
renegotiated so that the tunnel can be used again.
35
Reset all tunnels: all tunnels will be deleted.
User configuration Manual
2.1.5.2.10.
Active Update
Right-clicking against a line in the Active Update section will bring you to the contextual menu that will
allow you to:
Copy to the clipboard: Copies the selected line to the clipboard. Data can be copied in two
different ways:
1) A single line is selected: in this case, this line as well as the lines of details will be copied.
2) Several lines are selected: in this case, only these lines will be copied to the clipboard.
2.1.5.2.11.
Services
Right-clicking against a line containing a service will bring you to the contextual menu that will allow you to:
Filter this column by this
criterion
Filter only this column by
This option allows restricting the list of results to the selected field. For example, if
the data is filtered by the priority “Major”, the administrator will get all the lines
containing “Major”.
NOTE:
Using this option will replace all the current filters on the columns
This option allows you to restrict the list of the results pointed to by the cursor.
Copyright NETASQ 2012
User Manual
this criteria
Copy to the clipboard
Example
If your cursor pointed the destination / website consulted, the displayed list will
only present the elements containing this destination / website.
Copies the selected line to the clipboard. Data can be copied in two different ways:
1) A single line is selected: in this case, this line as well as the lines of
details will be copied.
2) Several lines are selected: in this case, only these lines will be
copied to the clipboard.
2.1.5.2.12.
Hardware
This is the menu dedicated to high availability. Please refer to sections 3.2.6 and 5.5.
2.1.5.2.13.
Filter policy
This menu allows you to view different types of rules :
Implicit rules
Global filtering rules
Local filtering rules
NAT rules for local
For more information, please refer to section 6.1.
36
User configuration Manual
2.1.5.2.14.
VPN Policy
Right-clicking against a line containing a VPN policy will bring you to the contextual menu that will allow
you to:
Filter this column by this criterion: This option allows restricting the list of
results to the selected field. For example, if the data is filtered by the priority “Major”, the
administrator will get all the lines containing “Major”.
View corresponding tunnels: this will open the VPN Tunnels menu with a filter.
2.1.5.2.15.
Logs
VPN
Right-clicking against a line containing a VPN policy will bring you to the contextual menu that will allow
you to:
Filter this column by this criterion
This option allows restricting the list of results to the selected field. For
example, if the data is filtered by the priority “Major”, the administrator
will get all the lines containing “Major”.
NOTE:
Using this option will replace all the current filters on the columns
Copyright NETASQ 2012
User Manual
Filter only this column by this criteria
Copy to the clipboard
This option allows you to restrict the list of the results pointed to by the
cursor.
Example
If your cursor pointed the destination / website consulted, the displayed
list will only present the elements containing this destination / website.
Copies the selected line to the clipboard.
System
Right-clicking against a line in the System section will bring you to the contextual menu that will allow you
to:
Filter this column by this criterion: This option allows restricting the list of
results to the selected field. For example, if the data is filtered by the priority “Major”, the
administrator will get all the lines containing “Major”.
NOTE:
Using this option will replace all the current filters on the columns.
Filter only this column by this criteria : This option allows you to restrict the list
of the results pointed to by the cursor. Example : if your cursor pointed the destination /
website consulted, the displayed list will only present the elements containing this destination
/ website.
Copy to the clipboard: Copies the selected line to the clipboard.
37
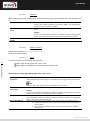
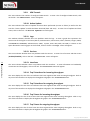
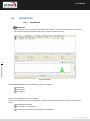
2.1.6. Status bar
User configuration Manual
Figure 9: Status bar
The status bar contains menus from the menu directory that may have been opened during a session.
Being able to do so is particularly useful when you are monitoring several firewalls at a time. You will be
able to get back the same information window for each firewall and thus make simultaneous comparisons.
2.1.7. Button bar
Figure 10: Button bar
This bar appears in most menus in Monitor.
Copyright NETASQ 2012
User Manual
2.1.7.1.
Refresh
This button allows you to reinitialize the list displayed (Alarms, VULNERABILITY MANAGER, Hosts,
Interfaces, Quality of Service, Users, Quarantine, VPN Tunnels, Active Update, Services, Hardware, Filter
Policy, VPN, Logs).
2.1.7.2.
Show/Hide help
This button allows you to show or hide a help screen. Subsequently, you only need to click on the selected
line to get help when necessary.
2.1.7.3.
Firewall
This drop-down menu allows you to filter the list of alarms on a selected firewall.
2.1.7.4.
Duplicate
The window can be duplicated using the button found in it. This comes in handy especially when you wish
to change the target (firewall or <all>) and view.
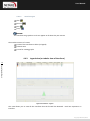
2.1.8. Search engine
38
The search zone is presented in 2 different formats:
1st format: the bar shown below can be seen on all screens except for the “Events” screen.
User configuration Manual
Figure 11: Search zone
2nd format: the bar below appears in the Events menu.
Figure 12: Search zone - Events
The Filters button contains the filters defined by the application and allows obtaining only the “Alarm”,
“Virus”, “Connection”, “Web”, “Mail”, “FTP” and “Filter” lines.
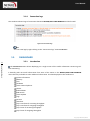
2.1.8.1.
Search
In this zone, you will be able to conduct searches through elements in the list. Elements are filtered at the
same time search criteria are being entered.
Copyright NETASQ 2012
User Manual
2.2.
INTRODUCTION TO MENUS
2.2.1. File
The File menu concerns connections to the firewall and the application’s general options.
Address book…
Configures the firewalls’ address books.
Direct connection…
Opens a new Firewall connection window. Enter the IP address of the Firewall and the
user password.
Determines the behavior that Monitor should adopt at startup, enables getting a packet
analyzer, defining a destination folder for reports, and the language used in the graphical
interface.
Configures memory, connection timeout and the frequency with which different
parameters will be refreshed.
Disconnects monitors and shuts down the application.
Application settings…
Default
settings…
Quit
monitoring
2.2.2. Windows
The Windows menu enables managing the display windows of the different connected firewalls:
39
User configuration Manual
Maximize
Opens the selected window.
Cascade
Arranges the various connection windows in cascade.
Title
Gives a global view of the main services offered by Monitor.
Duplicate
current window
Overview
Duplicates the current window according to the firewall that you had selected earlier.
Firewall
address
The drop-down menu indicates the last screens visited and identifies the current screen with a
tick.
IP address of connected firewall(s).
2.2.3. Applications
The Applications menu enables connecting to other applications in the NETASQ Administration Suite.
Using the two shortcuts provided the added advantage of not having to reauthenticate on both
applications.
Launch NETASQ UNIFIED
MANAGER
Launch NETASQ EVENT
REPORTER
Enables opening the NETASQ firewall configuration software.
Enables opening the NETASQ EVENT REPORTER module from the Administration
Suite.
Copyright NETASQ 2012
User Manual
2.2.4. ? (Help)
Help
Opens a page that accesses your secure-access area, to allow you to obtain
documentation.
Provides information on the monitor in use (version number, credits).
About…
2.3.
APPLICATION SETTINGS
Certain parameters can be configured in the NETASQ REAL-TIME MONITOR application.
Select the menu File\Application settings...: the parameters window will appear.
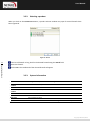
2.3.1. Behavior at startup
This tab offers the different options that enable configuring the application’s behavior at startup.
40
User configuration Manual
Figure 13: Behavior at startup
Direct connection
Connect automatically
to data sources
None
If this option is selected, the direct connection window will open when Monitor starts
up. It will enable you to enter the IP address of the desired firewall and the user
password.
If this option is selected, the connection will be established automatically on different
firewalls in the address book.
The Overview window will open but Monitor will not connect to any firewall.
Copyright NETASQ 2012
User Manual
2.3.2. External tools
Figure 14: Settings – External tools
41
User configuration Manual
Packet analyzer
Path
Parameters
When an alarm is triggered on a NETASQ Firewall, the packet responsible for setting off the
alarm can be viewed. In order to do this, you need a packet viewing tool like Ethereal or
Packetyzer. Specify the selected tool in the field “Packet analyzer”, which the Monitor will
use to display malicious packets.
Indicates the location of the directory containing the application that allows analyzing
packets.
The parameter “$packet_file$” can be added to the packet analyzer.
Copyright NETASQ 2012
User Manual
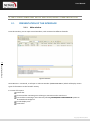
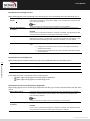
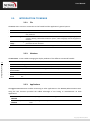
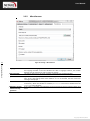
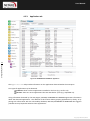
2.3.3. Report
Figure 15: Settings – Report
42
User configuration Manual
Destination folder
Number of events
Enables selecting the destination folder for the report.
The Reset button allows you to reset the directory for storing reports.
Allows defining the number of events desired when generating the report. By default,
the value is set to 500 lines.
REMARK
The report can be generated by right-clicking on a line in the Overview menu and by selecting
the option Generate a web report...
Copyright NETASQ 2012
User Manual
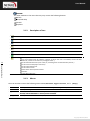
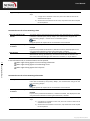
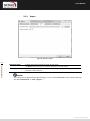
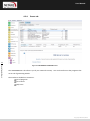
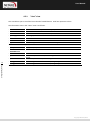
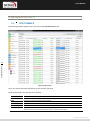
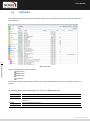
The report contains the following information:
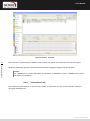
Figure 16: Synthesis report
It displays information regarding the firewall for which you intended to generate a report. By clicking on a
link in the list, the information will be displayed in table or graph form.
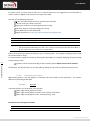
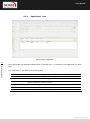
43
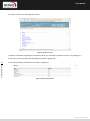
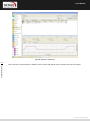
In the example below, information on memory is displayed.
User configuration Manual
Figure 17: Memory information
Copyright NETASQ 2012
User Manual
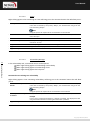
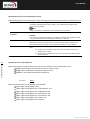
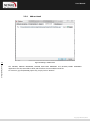
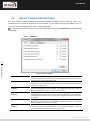
2.3.4. Address book
44
Figure 18: Settings – Address book
User configuration Manual
The NETASQ UNIFIED MANAGER, NETASQ REAL-TIME MONITOR and NETASQ EVENT REPORTER
applications use the same address book and therefore the same address book file.
To retrieve a .gap file (NETASQ project file), simply click on “Browse”.
Copyright NETASQ 2012
User Manual
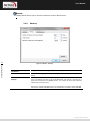
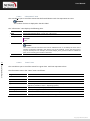
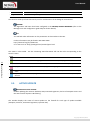
2.3.5. Miscellaneous
Figure 19: Settings – Miscellaneous
45
User configuration Manual
Language
Online help URL
Splash screen
Console
Minimize in systray
instead of closing
application
You can select a language for the interface's menus. The automatic selection will choose
the language installed on the PC's Windows OS. After a language selection, the Firewall
Monitor must be restarted in order to apply the change.
This option allows you to access at any time at the base of knowledge NETASQ.
If you select this option, the first window that appears on startup will contain the name,
logo, version and loading status of the software. If it is not selected, the start screen will
no longer be displayed.
If the option Enable is selected, you will be able to access firewalls in console mode (CLI
commands). When this window is validated, a Console menu will be added under the
Overview menu directory.
If this option is selected, the application will be minimized in Systray instead of being shut
down.
Copyright NETASQ 2012
User Manual
2.4.
DEFAULT MONITORING SETTINGS
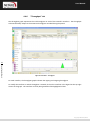
This menu enables configuring when all information contained in Monitor will be refreshed. There are 6
parameters that regulate the frequence of data retrieval. You can define how long the different logs (in
number of lines) and datagrams (in minutes) will be displayed.
The default parameters for monitoring can be accessed from the menu File\Default monitoring
settings.
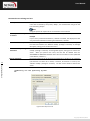
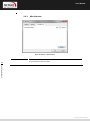
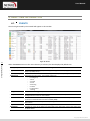
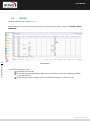
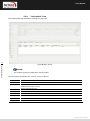
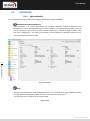
2.4.1. Updates
46
User configuration Manual
Figure 20: Monitor – Updates
Event refreshment frequency
Graph refreshment frequency
Activity data refreshment
frequency
System data refreshment
frequency
Log refreshment frequency
Configuration data update
frequency
Specifies in seconds when the list of detected events will be refreshed. The
refreshment frequency is set to 30 seconds by default and may be a minimum of
1 second and a maximum of 3600 seconds.
Specifies in seconds when graphs (Statistics, Interfaces, QoS and VPN SA) will be
refreshed. The refreshment frequency is set to 30 seconds by default and may be
a minimum of 10 seconds.
Specifies in minutes when activity data (hosts, authenticated users and
Vulnerability Manager) will be refreshed. The refreshment frequency is set to 3
minutes by default and may be a minimum of 1 minute.
Specifies in minutes when system data (session data, high availability, RAID,
cryptography card, quarantine, services and Active Update) will be refreshed.
The refreshment frequency is set to 3 minutes by default and may be a minimum
of 1 minute.
Specifies in minutes when log data (Log space, filters, VPN, system, traffic and
filter logs) will be refreshed. The refreshment frequency is set to 5 minutes by
default and may be a minimum of 1 minute.
Specifies in minutes when configuration data (Anti spam, anti-virus, proxies, SPD
and system properties) will be refreshed. The refreshment frequency is set to 5
minutes by default and may be a minimum of 1 minute.
Copyright NETASQ 2012
User Manual
REMARK
The Default button allows you to reset the parameters to their default values.
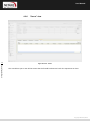
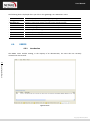
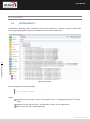
2.4.2. Memory
47
Figure 21: Monitor – Memory
User configuration Manual
Number of log lines to be
downloaded
Graph period
Maximum number of events
displayed
Configures the number of log lines you wish to display in the Traffic menu.
Indicates how long graphs will be displayed (Statistics from the Interfaces
menu).
Configures the number of event lines that you wish to display in the Events
menu. By default, the value is set to 20,000 events and may be a minimum of 1
events and a maximum of 2,000,000 events. The number of alarm lines indicated
influences the memory used:
The memory used for 150,000 event lines indicated for a firewall is about 220 MB.
The memory used for 300,000 event lines indicated for a firewall is about 430 MB.
Copyright NETASQ 2012
User Manual
2.4.3. Miscellaneous
Figure 22: Monitor – Miscellaneous
Connection timeout
48
When the firewall does not respond, the connection will be shut down at the end of
the period determined in this field.
User configuration Manual
Copyright NETASQ 2012
User Manual
3. INFORMATION ON FIREWALLS
3.1.
OVERVIEW
3.1.1. Introduction
From the menu directory, the Overview menu allows you to display several types of information
regarding your firewalls. Once the connection with the firewall is established, this information will be
available.
The Overview menu consists of five zones:
The menu directory
An overview of information on vulnerabilities found on your network.
(Corresponds to the Part 4/Chapter2: VULNERABILITY MANAGER menu)
A search and icon bar
A list of your firewalls
A view of connection logs
49
User configuration Manual
Figure 23: Overview
Copyright NETASQ 2012
User Manual
3.1.2. Overview of information on vulnerabilities
This view indicates the number of vulnerabilities found, the number of critical vulnerabilities and the
number of vulnerabilities that are remotely accessible on your networks. These indications represent links
that allowing access to these vulnerabilities (VULNERABILITY MANAGER menu).
Figure 24: Network overview
3.1.3. List of firewalls
This view provides the following information on your product(s):
Auto connect
50
User configuration Manual
Read-only
Selecting this option allows you to activate automatic reconnection of NETASQ
REAL-TIME MONITOR in the event of a disconnection.
Select this option to activate read-only mode.
State
Indicates the product’s connection status. Options: Connected/Disconnected.
Name
Product’s name or IP address if the name has not been indicated.
Address
Firewall’s IP address.
User
Login of the connected administrator account.
Model
Product model: U250, U6000…
Firmware
Version of the firmware monitored in Firewall Monitor’s "Firmware".
Active Update
VULNERABILITY MANAGER
Indicates the update status of the Active Update module. Options: OK or x failure
(s).
Indicates the number of vulnerabilities.
Antivirus
Indicates the status of the antivirus. Options: OK/Disabled.
Backup version
Version number of the backup module or of the firmware in the passive partition.
Last alarms
Indicates the number of major and minor alarms for the latest alarms (over the
past 15 minutes). The maximum value is 100 even if the number of alarms
exceeds this value.
Indicates the number of vulnerabilities.
Vulnerabilities
Global filter
Filter
Indicates whether a global filter rule has been activated. If so, “Global policy” will
be indicated.
Indicates the name of the active filter slot.
VPN
Indicates the name of the active VPN slot.
URL
Indicates the name of the active URL slot.
NAT
Indicates the name of the active NAT slot.
Uptime
Amount of time that the firewall has been running since the last startup.
Session
Indicates the number of sessions opened on the firewall.
Comments
Comments or descriptions of the firewall.
Copyright NETASQ 2012
User Manual
3.1.4. Connection logs
This window indicates logs of connections between NETASQ REAL-TIME MONITOR and the firewall.
Figure 25: Connection logs
TIP
You can erase logs by right-clicking on the “Connection logs” view DASHBOARD
3.2.
51
DASHBOARD
3.2.1. Introduction
User configuration Manual
The Dashboard menu allows displaying on a single screen all the useful information concerning realtime monitoring.
It basically picks out useful information from some of the menus in the NETASQ REAL-TIME MONITOR
menu directory and adds on other additional information. The data displayed in this window are:
System information
Memory
CPU
Hardware
Active network policies
Alarms
Vulnerabilities
VPN tunnels
Active Update
Logs
Services
Interfaces
Top 5 interfaces for incoming throughput
Top 5 interfaces for outgoing throughput
Top 5 hosts for incoming throughput
Top 5 hosts for outgoing throughput
Copyright NETASQ 2012
User Manual
52
User configuration Manual
Figure 26: Dashboard
Copyright NETASQ 2012
User Manual
3.2.2. Selecting a product
When you click on the Dashboard menu, a product selector window may open if several firewalls have
been registered.
Figure 27: Search
53
If the list of firewalls is long, look for the desired firewall using the Search field.
User configuration Manual
Select the firewall.
Click on OK. The Dashboard of the desired firewall will appear.
3.2.3. System information
Firewall name
Name given to the product when it was registered in the address book.
Firmware on active
partition
Active Partition
Version of the active partition’s firmware.
Firmware on passive
partition
Model
Version of the passive partition’s firmware.
Serial number
Firewall’s serial number.
Date-time
Current date and time.
Uptime
Amount of time that the firewall has been running since the last startup.
Partition on which the firewall was booted.
Firewall’s model number.
Copyright NETASQ 2012
User Manual
3.2.4. Memory
This refers to the use (in percentage) of memory reserved for storing information (buffer). The buffer is
linked to the stateful module and corresponds to saving the context.
Host
Host stack
Fragmented
Fragmented packets
Connections
All TCP/IP connections.
ICMP
ICMP requests (Ping, trace route...).
Data tracking
Memory used for monitoring connections.
Dynamic
Percentage of ASQ memory being used.
Buffer sizes vary according to product type and product version.
Cleaning algorithms optimize the operation of “Hosts”, “Fragmented”, “ICMP” and “Connections” buffers.
Entries in the “Fragmented” and “ICMP” buffers are initialized at fixed intervals (each entry has a limited
lifetime: TTL).
This illustrates part of the Firewall’s activity. A high percentage may mean the Firewall is overloaded or
that an attack has been launched.
3.2.5. CPU
54
User configuration Manual
DEFINITION
Better known as a “processor”, this is the internal firewall resource that performs the necessary
calculations.
User:
CPU time allocated to the management of user processes.
Kernel:
CPU time that the kernel consumes
Interruption:
CPU time allocated for interruptions.
3.2.6. Hardware
DEFINITION OF “HIGH AVAILABILITY”
A specific architecture in which a backup firewall takes over when the “main” firewall breaks down
while in use. This switch is totally transparent to the user.
If high availability has been activated, an additional section will provide you with the information
regarding high availability (status of firewalls, licenses, synchronization).
Copyright NETASQ 2012
User Manual
Click on the descriptive phrase in the “Hardware” zone in order to display the Hardware menu
and to obtain information on high availability.
If the backup firewall is not available, information on the active firewall can be viewed.
Figure 28: Hardware
55
User configuration Manual
3.2.7. Active network policies
This view indicates whether slots are active. If so, the label of the activated rule is indicated. The rules
mentioned here are:
Global filter rule
Name of the activated global filter policy.
Filter rule:
Name of the activated filter policy.
VPN rule
Name of the activated VPN rule.
NAT rule
URL filter rule
Name of the activated translation policy.
Name of the activated URL filter rule.
REMARK
<None> means that no policy has been activated for the rule that contains this indication.
3.2.8. Alarms
This view indicates the number of major and minor alarms during the past 15 minutes that the product has
been connected. The maximum value indicated is 100 even if the number of alarms exceeds this value.
To view the alarms, click on either link of your choice – the Events menu will appear and will set out the
list of alarms according to the selected criticality.
Copyright NETASQ 2012
User Manual
3.2.9. VPN Tunnels
This view indicates the number of configured VPN tunnels. To view a list of configured VPN tunnels, click
on the link – the VPN Tunnels menu will appear.
3.2.10. Active Update
This view indicates the status of updates that have been performed (success or failure) as well as the last
time the “Active Update” module had been launched (date and time). To view a list of updates and their
status, click on the link – the Active Update menu will appear.
3.2.11. Logs
This window indicates whether there are problems with the logs. To view a graph that represents the
current size of the log file in real time (Alarms, Authentication, Connections, Filters, Monitor, Plugins, POP3,
VULNERABILITY MANAGER, Administration, SMTP, System, IPSec VPN, Web, SSL VPN) in relation to the
space allocated to each log type on the firewall, click on the link. The Logs menu will appear.
3.2.12. Services
This zone indicates whether there are problems with the services. To view a list of services and their status
(Enabled/Disabled), click on the link – the Services menu will appear.
56
3.2.13. Interfaces
User configuration Manual
This zone indicates whether there are problems with the interfaces. To view information on bandwidth,
connections and throughput, click on the link. The Interfaces menu will appear.
3.2.14. Top 5 interfaces for incoming throughput
This zone displays the list of the 5 interfaces that have registered the most incoming throughput. Click on
any one of the interfaces to display the Throughput tab graph in the Interfaces menu.
3.2.15. Top 5 interfaces for outgoing throughput
This zone displays the list of the 5 interfaces that have registered the most incoming throughput. Click on
any one of the interfaces to display the Throughput tab graph in the Interfaces menu.
3.2.16. Top 5 hosts for incoming throughput
This zone displays the list of the 5 hosts that have registered the most incoming throughput. Click on any
one of the interfaces to display the throughput tab graph in the Interfaces menu.
3.2.17. Top 5 hosts for outgoing throughput
This zone displays the list of the 5 hosts that have registered the most outgoing throughput. Click on any
one of the interfaces to display the throughput tab graph in the Interfaces menu.
Copyright NETASQ 2012
User Manual
4. REAL-TIME INFORMATION
4.1.
EVENTS
The alarms generated by the Firewall will appear in this window.
Figure 29: Events
57
User configuration Manual
When the Events menu in the menu directory is selected, the data displayed by default are:
Date (time)
Date and time the line was recorded in the log file at the firewall’s local time.
Logs
Indicates the type of logs (the possible types of logs are: Alarm, Plugin, Connection, Web,
SMTP, FTP, POP3, Filter).
Action associated with the filter rule and applied on the packet (Examples: Block/Pass…)
Action (action)
Priority (pri)
Config
Policy
User
Source
Src prt num
Destination
Determines the alarm level. The possible values are:
- 0: emergency
- 1: alert
- 2: critical
- 3: error
- 4: warning
- 5: notice
- 6: information
- 7: debug
Number of the filtering policy involved in the rise of the event.
Category of the event raised. Example: "travail" means that the packet comes from the
working session of a user on the network.
Identifier for the authenticated user (ftp), e-mail address of the sender (SMTP), identifier
for the user if authentication has been enabled (WEB).
IP address or name of the object corresponding to the source host of the packet that set
off the alarm.
Source port number involved, displayed in digital.
IP address or name of the object corresponding to the destination host of the packet that
set off the alarm.
Copyright NETASQ 2012
User Manual
Dst port
Details
Destination port number of the service or name of the object corresponding to the service
port of the destination host if it exists and is requested for this connection.
Description of the event relating to the log. This column groups some of the information
gathered from the other columns.
E.g.: if an alarm log is concerned, information such as whether it was a sensitive alarm, the
number of the filter rule, rule ID (already given in the columns "Sensitive alarm", "Rule" and
"Rule ID") will be grouped in this column.
Please refer to appendix G.
Other available data are:
58
User configuration Manual
Firewall (fw)
Serial number or name of the firewall (if known) that caused the event.
UTC Date (time+tz)
UTC date (replaces the GMT)
Start date (starttime)
“Local” date at the start of an event.
UTC start date
(startime+tz)
Timezone (tz)
UTC date at the start of an event (a connection).
Rule (ruleid)
Number of the filter rule involved in the raised alarm.
Protocol (proto)
Protocol of the packet that set off the alarm.
Connection group
(groupid)
Source interface
(srcif/srcifname)
Source address (src)
Identifier that would allow tracking child connections.
Source port
(srcport/srcportname)
Destination interface
(dstif/dstifname)
Destination address
(dst)
Sensitive alarm
(sensitive)
Source port number of the service or the name of the object corresponding to the
service port of the source host (only if TCP/UDP).
Network card of the destination interface.
Firewall’s timezone.
Name of the firewall interface on which the event was raised (source interface network
card).
IP address of the source host of the packet that set off the event.
IP address of the destination host of the packet that set off the event.
Indicates whether an alarm is sensitive. This alarm is raised whenever the intrusion
prevention system detects a sensitive packet and for which it has been configured in
intrusion detection mode. If the alarm is sensitive, an icon in the form of an exclamation
mark followed by “Yes” will appear. Otherwise, “No” will be indicated. When the alarm
is blocked, the icon will be grayed out (it is disabled).
Identifier (Id/alarmid)
NOTE:
Only protocol alarms can be described as “sensitive”. For alarms that are not in
this class, the column will be empty.
Indicates the number of an event’s occurrences within a defined period. This period is
configured in NETASQ UNIFIED MANAGER in the menu “Logs\Advanced”, option
Write log duplicates every.
Indicates the number of the alarm.
Context (class)
Text indicating the category to which the alarm belongs (system, protocol, filter, etc).
Alarm type
(classification)
Caller
Code (number) indicating the alarm category.
Callee
VoIP: Indicates the callee
Duration
Connection time in seconds.
Sent
Number of KB sent during the connection.
Received (rcvd)
Number of KB received during the connection.
Copy (repeat)
VoIP: Indicates the caller
Copyright NETASQ 2012
User Manual
Operation (op)
59
Result
Identified command of the protocol.
- FTP: PUT, MPUT, GET, DELETE,…
- HTTP: GET, PUT, POST,…
- EDONKEY: SENDPART
- POP3: RETR, LIST,…
- FTP: DELETE, LIST,…
Result of the operation in the protocol (example: 404 which indicates an error).
Parameter (arg)
Operation parameter.
Category (cat_site)
Web category of the requested website.
Spam level
(spamlevel)
Virus (virus)
Spam level: 0 (Message not spam) 1,2 and 3 (spam) x (error during the treatment of the
message) and ? (the nature of the message could not be determined) if antispam has
been enabled.
Indicates whether there is a virus (if the antivirus has been enabled).
IP (ipproto)
Internet protocol (tcp or udp).
Media)
Type of traffic detected (audio, video, application,…)
Message (Msg)
ICMP code (icmpcode)
Detailed description of the alarm. All commands sent by the client are found here.
Sensitive information such as passwords is removed.
ICMP code in the alarm logs.
ICMP type (icmptype)
ICMP type in the alarm logs.
Packet
Indicates the IP packet for which the alarm was raised. Right-clicking on this packet
allows it to be viewed through a packet analyzer. The information displayed in this
column shows the size of the IPv4 packets (value beginning with 45).
Packet sizes vary according to the firewall model.
S 64 bytes: U30 to U70.
M 128 bytes: U120 to U450
L 1500 bytes: U1100 to U1500 and NG1000-A
XL 1500 bytes: U6000, NG5000-A
User configuration Manual
WARNING
To view a packet, a software program needs to be installed on your workstation.
NOTE
The logs will now be displayed for models without hard drive.
Copyright NETASQ 2012
User Manual
4.2.
VULNERABILITY MANAGER
4.2.1. Introduction
NETASQ VULNERABILITY MANAGER is a module that allows network administrators to gather information
in real time and to analyze it in order to spot possible vulnerabilities that may compromise the security of
their networks. Among other things, it also allows raising alarms generated by ASQ and thus to maintain an
optimal security policy.
NETASQ VULNERABILITY MANAGER collects and archives in particular, information relating to the
operating system, to various active services as well as to the different applications that have been installed.
As a result, descriptive profiles can be made of network elements.
The following are NETASQ VULNERABILITY MANAGER’s aims:
To configure your company network’s security policy
To analyze the status of the risk
To optimize the level of security
To report security events
The procedure is as follows:
60
NETASQ’s intrusion prevention engine (ASQ) extracts data in real time using network protocols that it
knows.
User configuration Manual
VULNERABILITY MANAGER then combines and weights these data.
The vulnerability found can then be treated using databases that have been indexed dynamically. Once
all this information has been collected, they will be used in Monitor so that flaws on the network can be
corrected, or prohibited software can be detected, or the real risk relating to the attack can be identified
in real time.
The profile is therefore complete.
One or several solutions can thus be considered.
Example
A company has a public website that it updates twice a month via FTP. At a specific date and time,
a vulnerability that affects FTP servers is raised and Monitor immediately takes it into account,
enabling the network administrator to detect it at practically the same time.
This vulnerability is represented by a line that indicates the number of affected hosts and whether a
solution is available.
By deploying this line, details of the hosts concerned will appear, as well as the service that has
been affected by the vulnerability. Help, in the form of links, may be suggested to correct the
detected flaw.
Once the network administrator becomes aware of the vulnerability, he can correct it at any moment,
quarantine the affected host(s) and generate a report.
Copyright NETASQ 2012
User Manual
VULNERABILITY MANAGER can also perform weekly, monthly or yearly analyses, using the application
NETASQ EVENT REPORTER (Autoreport). (See the NETASQ EVENT REPORTER user guide.)
When you click on the VULNERABILITY MANAGER menu in the menu directory, the scan window will consist
of the following
A Vulnerabilities tab
An Applications tab
An Events tab
4.2.2. Vulnerabilities tab
61
User configuration Manual
Figure 30: VULNERABILITY MANAGER
The window has 3 views:
A view of the list of vulnerabilities
A view of the list of hosts affected by this vulnerability
A view allowing the resolution of the selected vulnerability if a solution exists
Copyright NETASQ 2012
User Manual
4.2.2.1.
“Vulnerability(ies)” view
This view allows you to view all the vulnerabilities that the firewall has detected. Each line represents a
vulnerability.
REMARK
The number of vulnerabilities is displayed in the tab’s label.
The information provided in the “vulnerability” view is as follows:
Firewall
Serial number or name (if known) of the firewall at the source of the vulnerability.
Severity
Indicates the how severely the host(s) have/has been affected by the vulnerability, according to 4
levels: Low, Moderate, High, Critical.
Indicates the name of the vulnerability.
Name
62
Affected
hosts
Family
Number of hosts affected by the vulnerability.
Target
One of 2 targets: Client or Server.
Exploit
Local or remote access (via the network). Allows exploiting the vulnerability.
Solution
Indicates whether a solution has been suggested.
Release
Date on which the vulnerability was discovered.
ID
WARNING
This refers to the date on which the vulnerability was discovered and not the date on which it
appeared on the network.
Allows a unique identification of the vulnerability.
Family to which the vulnerability belongs. (See Appendix D: Sessions and user privileges).
User configuration Manual
4.2.2.2.
“Hosts” view
This view allows you to view all the vulnerabilities for a given host. Each line represents a host.
The information provided in the “Hosts” view is as follows:
Affected
Date on which the host was affected.
Name
Name of the host affected by the attack (if it exists).
Address
IP address of the host affected by the attack.
Application
Name and version of the application (if available).
Type
Application type (Client/Server/Operating system).
Detail
Name of the service prone to being affected by the vulnerability.
Operating system
OS used.
Port
Number of the port on which the vulnerability had been detected.
Protocol
Name of the protocol used.
Copyright NETASQ 2012
User Manual
4.2.2.3.
Help zone
The help zone allows you to get more details relating to the attack. Thus the administrator can correct the
vulnerability.
Click on the Show help button to show or hide the help zone associated with a vulnerability.
Typically, help comes in the form of a descriptive file that contains explanations, links to the publisher’s site
or to bug fixes, and the possibility of quarantining the affected host.
63
User configuration Manual
Figure 31: Help
Copyright NETASQ 2012
User Manual
4.2.3. Application tab
64
User configuration Manual
Figure 32: VULNERABILITY MANAGER - Application
The Applications tab provides information on the application detected within the enterprise.
Two types of application may be detected:
Products: these are client applications installed on the host (e.g.: Firefox 1.5).
Services: these are server applications that are attached to a port (e.g.: OpenSSH 3.5).
Using information detected by the ASQ engine, NETASQ VULNERABILITY MANAGER generates information
about the detected applications. The addition of this feature allows grouping applications by family, so by
pairing such information with the vulnerability database, NETASQ VULNERABILITY MANAGER also suggests
probable security loopholes linked to these applications.
Copyright NETASQ 2012
User Manual
This tab offers features that include filtering, optional column display, resizing to fit contents and copying of
data to the clipboard. It displays information on the detected applications through the columns that can be
seen in the window above.
The window comprises 2 views:
A view that lists the applications
A detailed view that lists the hosts
4.2.3.1.
“Application(s)” view
This view allows you to see the applications that the firewall detects. Each line represents an application.
REMARK
The number of applications is displayed in the tab’s label.
The Applications tab displays the following data:
Firewall
Serial number or name (if known) of the firewall.
Name
Name of the software application. The version is not specified except for the operating
systems.
The software application’s family (e.g.: “web client”).
Family
Type
Software type (Client: the software does not provide any service – Server: the software
application provides a service – Operating system).
Number of software applications detected in the monitored networks. For a server, the
same service may be suggested on several ports. E.g.: an Apache http server which
provides its services on port 80 and port 8080 (web proxy) would appear twice.
Instance
65
User configuration Manual
4.2.3.2.
“Hosts” view
This view allows you to see all the applications for a given host. Each line represents a host.
The information seen in the “Hosts” view is as follows:
Name
Host name
IP address
IP address of the host
Application
Name of the software as well as its version, if available.
Type
Operating system
Software type (Client: the software does not provide any service – Server: the software
application provides a service – Operating system).
Host’s operating system.
Port
Port that the software application uses (if it uses any).
Protocol
Internet protocol of the software (if it uses any).
Copyright NETASQ 2012
User Manual
4.2.4. Events tab
66
User configuration Manual
Figure 33: VULNERABILITY MANAGER-Events
The Information tab informs you of your network’s activity. You can therefore see the programs that
are at risk of generating attacks.
The window is divided into 3 sections:
List of programs
List of hosts
Help zone
Copyright NETASQ 2012
User Manual
4.2.4.1.
“Information” view
This view allows you to see all the events that the firewall detects. Each line represents an event.
REMARK
The number of events is displayed in the tab’s label.
The “Information” view displays the following data:
Firewall
Serial number or name (if known) of the firewall.
Name
Name of the detected OS or a server (e.g.: SSH server).
Family
Host family.
Example
SSH
Affected hosts
Number of hosts affected. These hosts are identified in the Hosts view in this tab.
Id
REMARK
The number of hosts indicated in the column "Affected hosts" is not always the same as the
number of elements indicated in the "Hosts" zone in this window. In fact, the same service
may use several ports. For example, the service thhtpd_server_2.25b can listen to 2 different
ports, thus increasing the number of elements.
Identifier.
67
4.2.4.2.
“Hosts” view
User configuration Manual
This view allows you to see all the events for a given host. Each line represents a host.
The information seen in the “Hosts” view is as follows:
Assigned
Date and time of the event’s occurrence.
Name
Host name.
Address
IP address of the host
Application
Name of the software as well as its version, if available.
Type
Detail
Software type (Client: the software does not provide any service – Server: the software
application provides a service – Operating system).
Details about the operating system.
Operating system
Host’s operating system.
Port
Port that the software application uses (if it uses any).
Internet Protocol
Internet protocol of the software (if it uses any).
Copyright NETASQ 2012
User Manual
4.2.4.3.
Help zone
The help zone allows you to get more details relating to the attack. Thus the administrator can correct the
vulnerability.
Click on the Show help button to show or hide the help zone associated with an event.
Typically, help comes in the form of a descriptive file that contains explanations, links to the publisher’s site
or to bug fixes, and the possibility of quarantining the affected host.
68
User configuration Manual
Figure 34: Help
REMARK
Refer to the user guide NETASQ UNIFIED MANAGER to configure VULNERABILITY MANAGER.
Copyright NETASQ 2012
User Manual
4.3.
HOSTS
From the menu directory, click on Hosts.
This window lists the connected hosts (these hosts had been created earlier as objects in NETASQ UNIFIED
MANAGER).
69
Figure 35: Hosts
User configuration Manual
The window comprises 3 views:
A view that lists the hosts
A view that lists the Vulnerabilities, Applications, Information, Connections and Events relating
to the selected host
A help view that allows working around the selected vulnerability, if a solution exists
Copyright NETASQ 2012
User Manual
4.3.1.
“Host” view
This view allows you to see all the hosts that the firewall detects. Each line represents a host.
The information seen in the “Hosts” view is as follows:
70
Name
Name of the source host (if declared in objects) or host’s IP address otherwise.
Address
Host’s IP address
Users
User connected to the host (if there is one).
Operating system
Operating system used on the host.
Information
Indicates the information in the Information tab.
Vulnerabilities
Number of vulnerabilities detected.
Applications
Number of applications on the host (if there are any).
Events
Number of detected events
Open ports
Number of open ports.
Last VULNERABILITY
MANAGER event
Interface
Indicates the date and time of the last VULNERABILITY MANAGER event.
Bytes in
Bytes out
Number of bytes that have passed through the Firewall from the source host since
startup.
Number of bytes that have passed through the Firewall to the source host since startup.
Throughput in
Actual throughput of traffic to this host passing through the Firewall.
Throughput out
Actual throughput of traffic to this host passing through the Firewall.
Interface on which the host is connected.
User configuration Manual
Copyright NETASQ 2012
User Manual
4.3.2. “Vulnerabilities” view
This tab describes the vulnerabilities detected for a selected host. Each vulnerability can then be viewed in
detail.
Figure 36: Hosts – Vulnerabilities
The information provided in the “vulnerability” view is as follows:
71
User configuration Manual
Firewall
Ip adress of your firewall NETASQ where the vulnerability comes from.
Severity
Name
Indicates the how severely the host(s) have/has been affected by the vulnerability, according to
4 levels: Low, Moderate, High, Critical.
Indicates the name of the vulnerability.
Family
Family to which the vulnerability belongs.
Type
Target
Software type (Client: the software does not provide any service – Server: the software
application provides a service).
One of 2 targets: Client or Server.
Affected hosts
Number of hosts affected by the vulnerability.
Exploit
Local or remote access (via the network). Allows exploiting the vulnerability.
Solution
Indicates whether a solution has been suggested.
Date
Date on which the vulnerability was detected.
Internet Protocol
WARNING
This refers to the discovery date and not the date on which the vulnerability appeared on the
network.
Name of the protocol used.
Id
Vulnerability identifier.
Copyright NETASQ 2012
User Manual
4.3.3. “Applications” view
Figure 37: Hosts – Applications
72
User configuration Manual
This tab describes the applications detected for a selected host. It is possible to view applications in detail
later.
The “Applications” view displays the following data:
Version
Name and version of the application.
Vulnerability
Number of vulnerabilities detected on the application.
Family
The software application’s family (e.g.: “web client”).
Type
Port
Software type (Client: the software does not provide any service – Server: the
software application provides a service).
Port used by the application (if it uses one).
Protocol
Protocol used by the application
ID
Unique identifier of the vulnerability family.
Copyright NETASQ 2012
User Manual
4.3.4.
“Information” view
This tab describes the information relating to a given host
73
User configuration Manual
Figure 38: Hosts – Events
REMARK
The number of events is displayed in the tab’s label.
The information provided in the “events” view is as follows:
Name
Name of the detected OS.
Family
Family of the vulnerability that is likely to appear (Example: SSH).
Type
Application type (Client: the software does not provide any service – Server: the software
application provides a service).
Name of the detected OS.
Detail
Description of information.
Detected
Date and time of detection.
Port
Number of the port on which the vulnerability had been detected.
Protocol
Name of the protocol used.
Id
Unique identifier of the vulnerability family.
Copyright NETASQ 2012
User Manual
4.3.5. “Connections” view
74
Figure 39: Hosts - Connections
User configuration Manual
This view allows you to see the connections that the firewall detects. Each line represents a connection.
The “Connections” view displays the following data:
Time
Indicates the date and time of the object’s connection.
Protocol
Communication protocol used for the connection.
Source
Name of the object that connected to the selected host.
Source port
Indicates the number of the source port used for the connection.
Destination
Name of the object for which a connection has been established.
Destination
port
Sent
Indicates the number of the destination port used for the connection.
Received
Number of KB received during the connection
Duration
Connection duration.
Operation
Identified command of the protocol.
Parameter
Operation parameter.
Number of KB sent during the connection.
Copyright NETASQ 2012
User Manual
4.3.6. “Events” view
75
Figure 40: Hosts - Events
User configuration Manual
This view allows you to view all the events that the firewall has detected. Each line represents an alarm.
Copyright NETASQ 2012
User Manual
The information provided in the “Events” view is as follows:
Date (time)
Date and time the line was recorded in the log file at the firewall’s local time.
UTC Date (time+tz)
UTC date (replaces the GMT)
Start date (starttime)
“Local” date at the start of an event.
UTC start date (startime+tz)
UTC date at the start of an event (a connection).
Timezone (tz)
Firewall’s timezone at the time the log was written.
Logs
File at the source of the event.
Action (action)
Rule (ruleid)
Action associated with the filter rule and applied on the packet (Examples:
Block/Pass…)
Determines the alarm level. The possible values are:
- 0: emergency
- 1: alert
- 2: critical
- 3: error
- 4: warning
- 5: notice
- 6: information
- 7: debug
Number of the filter rule involved in the raised alarm.
User
Identifier of the user requesting authentication
Protocol (proto)
Protocol of the packet that set off the alarm.
Connection group (groupid)
Identifier that would allow tracking child connections.
Source interface
(srcif/srcifname)
Source (src)
Source address (src)
Network card of the source interface (name of the source host or the object
corresponding to the service port of the source machine if it exists).
IP address or name of the object corresponding to the source host of the
packet that set off the event.
IP address of the source host of the packet that set off the event.
Source port (srcport)
Port number of the source (only if TCP/UDP).
Destination interface (dstif)
Network card of the destination interface.
Destination (dst/dstname)
IP address or name of the object corresponding to the destination host of the
packet that set off the event.
IP address of the destination host or name of the object corresponding to the
IP address (if it exists) of the packet that set off the event.
Port requested for this connection.
Priority (pri)
76
User configuration Manual
Destination address (dst)
Destination port
(dstport/dstportname)
Details
Sensitive alarm (sensitive)
Describes the event relating to the log. This description groups together
information from other columns in a single column. Example: if it is an alarm
log, information such as whether the alarm is sensitive, the filter rule number
and rule identifier will be indicated in this column or will otherwise be new
columns in order to enable filtering.
Please refer to Appendix G.
Indicates whether an alarm is sensitive. This alarm is raised whenever the
intrusion prevention system detects a sensitive packet and for which it has
been configured in intrusion detection mode. If the alarm is sensitive, an icon
in the form of an exclamation mark followed by “Yes” will appear. Otherwise,
“No” will be indicated. When the alarm is blocked, the icon will be grayed out
(it is disabled).
NOTE: Only protocol alarms can be described as “sensitive”. For alarms
that are not in this class, the column will be empty.
Copyright NETASQ 2012
User Manual
Copy (repeat)
Id (alarmid)
Context (class)
77
Indicates the number of an event’s occurrences within a defined period. This
period is configured in NETASQ UNIFIED MANAGER in the menu
“Logs\Advanced”, option Write log duplicates every.
Indicates the number of the alarm.
User configuration Manual
Alarm type (classification)
Text indicating the category to which the alarm belongs (system, protocol,
filter, etc).
Code (number) indicating the alarm category.
Caller
VoIP: Indicates the caller
Callee
VoIP: Indicates the callee
Duration
Connection time.
Data sent (sent)
Number of KB sent during the connection.
Data received (rcvd)
Number of KB received during the connection.
Operation (op)
Identified command of the protocol.
Result
Result of the operation in the protocol (example: 404 which indicates an error).
Parameter (arg)
Operation parameter.
Category (cat_site)
Web category of the requested website.
Spam level (spamlevel)
Virus (virus)
0 (Message not spam) 1,2 and 3 (spam) x (error during the treatment of the
message) and ? (the nature of the message could not be determined)
Indicates whether there is a virus.
IP (ipproto)
Internet protocol (tcp or udp).
Media
Type of traffic detected (audio, video, application,…)
Message (Msg)
Detailed description of the alarm.
ICMP code (icmpcode)
ICMP code in the alarm logs.
ICMP type (icmptype)
ICMP type in the alarm logs.
Packet
Indicates the IP packet for which the alarm was raised. Right-clicking on this
packet allows it to be viewed through a packet analyzer. The information
displayed in this column shows the size of the IPv4 packets (value beginning
with 45).
Packet sizes vary according to the firewall model.
S 64 bytes: U30 to U70.
M 128 bytes: U120 to U450
L 1500 bytes: U1100 to U1500 and NG1000-A
XL 1500 bytes: U6000, NG5000-A
WARNING
To view a packet, a software program needs to be installed on your
workstation.
Copyright NETASQ 2012
User Manual
4.4.
INTERFACES
4.4.1. Introduction
DEFINITION
A zone, whether real or virtual, that separates two elements. The interface thus refers to what the
other element need to know about the other in order to operate correctly.
78
User configuration Manual
Figure 41: Interfaces
The Interfaces menu presents different statistics concerning:
Bandwidth
Connections
Throughput
Statistics are displayed in the form of graphs.
The vertical and horizontal axes are graduated. The horizontal axis represents time, and the vertical axis is
either:
Bandwidth percentage
The number of connections, or
Throughput expressed in bytes, kilobytes or megabytes.
Copyright NETASQ 2012
User Manual
4.4.1.1.
Interface types
Vlan.
Ethernet.
PPTP.
Dialup.
REMARK
The interfaces are grayed out or do not appear at all when they are inactive.
The window consists of 3 views:
A view of the interfaces in tables (or legend)
A details zone
A zone for viewing graphs
4.4.2. Legend view (or tabular view of interfaces)
79
User configuration Manual
Figure 42: Interfaces – Legend
This view allows you to view all the interfaces that the firewall has detected. Each line represents an
interface.
Copyright NETASQ 2012
User Manual
The information provided in the “legend” view is as follows:
Name
Name and color attributed to the interface. The colors allow you to distinguish the interface in
the different graphs.
Type of interface with a matching icon.
Type
Address/
Network
Throughput in
The interface’s address and sub-network mask.
Throughput out
Indicates the real outgoing throughput.
Connections
Number of real-time connections on each interface of the firewall over a defined period.
Media
Bandwidth
By default, its value is 0. The throughput of a network interface can be configured via NETASQ
UNIFIED MANAGER.
Indicates the percentage of bandwidth used for an interface.
Stats
If this option is selected, the graph corresponding to this interface will be displayed.
Indicates the real incoming throughput.
REMARK
Inactive interfaces are grayed out.
You will notice the colors of the visible interfaces at the top of the window. These colors are defined in the
network parameters of the NETASQ UNIFIED MANAGER for each interface (refer to the NETASQ UNIFIED
MANAGER user manual).
80
4.4.3. “Details” view
User configuration Manual
Each chart provides statistical information on throughput for each interface:
Name, IP address, subnet mask (American format – see Appendix for explanations), connection
type (10 or 100Mbits, half duplex or full duplex),
Instantaneous (left) and maximum (right) throughput,
Number of packets and volume in bytes for TCP, UDP and ICMP,
Number of TCP connections,
Total number of packets accepted, blocked and fragmented by the Firewall.
4.4.4.
“Bandwidth” tab
The bandwidth graph displays the percentage of use of the available bandwidth on each interface in real
time.
Copyright NETASQ 2012
User Manual
Figure 43: Interfaces - Bandwidth
81
Each interface is represented by a different color of which the legend may be found at the top of the graph.
User configuration Manual
Maximum bandwidth represents the theoretical maximum throughput supported by the interface.
Example
For a 100Mbits/s line used in full duplex, this maximum is 200 Mbits/s, and for a 10Mbits/s line used in
half duplex it is 10 Mbits/s.
4.4.5.
“Connections” tab
The connection graph displays in real time the number of connections on each of the Firewall’s interfaces
during the defined period.
Copyright NETASQ 2012
User Manual
Figure 44: Interfaces - Connections
82
User configuration Manual
Each interface is represented by a different color of which the legend may be found at the top of the graph.
Copyright NETASQ 2012
User Manual
4.4.6.
“Throughput” tab
The throughput graph represents the real throughput on each of the Firewall’s interfaces. The throughput
scale automatically adapts to the maximum throughput recorded during the period.
83
User configuration Manual
Figure 45: Interfaces - Throughput
For each interface, the throughput graph indicates the ingoing and outgoing throughput.
To modify the interface on which throughput is viewed, click on this interface in the legend at the top right
section of the graph. The interface currently being viewed will be highlighted in blue.
Copyright NETASQ 2012
User Manual
4.5.
QUALITY OF SERVICE (QoS)
REMARKS
1) Quality of Service, which has a high level of abstraction, refers to the ability to provide a network
service according to parameters defined in a Service Level Agreement (SLA). The “quality” of the
service is therefore gauged by its availability, latency rate, fluctuations, throughput and rate of lost
packets.
2) Where network resources are concerned, the “Quality of service” refers to a network element’s
ability to provide traffic prioritization services and bandwidth and latency time control.
84
User configuration Manual
Figure 46: Quality of service
This window consists of 2 views:
A table view
A graph view
This view shows the incoming and outgoing throughput associated with the different QIDs defined on the
firewall’s QoS policy.
Copyright NETASQ 2012
User Manual
The following data is displayed when you click on the Quality of service menu:
QID
Name of the policy defined for accepting or rejecting packets.
Throughput in
Indicates in real time the incoming throughput that the QID manages.
Throughput out
Indicates in real time the outgoing throughput that the QID manages
Packets in
Number of incoming packets in real time over a defined period.
Packets out
Number of outgoing packets in real time over a defined period
Drops in
Number of rejected incoming packets on the network.
Drops out
Number of rejected outgoing packets.
Bytes in
Value in Kbits or Mbits.
Bytes out
Value in Kbits or Mbits.
4.6.
USERS
4.6.1. Introduction
The User menu enables viewing, in the capacity of an administrator, the users who are currently
connected on the Firewall.
85
User configuration Manual
Figure 47: Users
Copyright NETASQ 2012
User Manual
This window comprises 2 views:
A “users” view.
An “administration session” view.
4.6.1.1.
“Users” view
The information provided in the “users” view is as follows:
Firewall
Serial number or name (if known) of the firewall.
Name
Name of authenticated user.
Group
Name of the group to which the user belongs.
Address
User’s IP address.
Timeout
Time remaining for this authentication session (a user is authenticated only for a limited
duration).
4.6.1.2.
“Administration sessions” view
This window enables finding out the session privileges of the user connected to the firewall.
The information provided in the “administration sessions” view is as follows:
86
User configuration Manual
Firewall
Serial number or name (if known) of the firewall.
User
Authenticated user’s identifier.
Address
IP address of the connected user’s host.
Session
privileges
Indicates the privileges for the current session. Only one administrator is allowed to make
changes in each session (modify and mon_write privileges).
User privileges
Indicates privileges that have been given to the connected user (these privileges include adding,
modifying, deleting or reading in different applications).
Session
identifier
Number identifying the session.
4.7.
QUARANTINE – ASQ BYPASS
DEFINITIONS
1) Dynamic quarantine: the quarantine is manually done and for a set duration.
2) Static quarantine: the quarantine is automatic and for permanent. Static quarantining is
configuring in the application NETASQ UNIFIED MANAGER.
Copyright NETASQ 2012
User Manual
Figure 48: Quarantine
87
User configuration Manual
This window comprises 2 views:
A “Quarantine” view
An “ASQ Bypass” view.
4.7.1. “Quarantine” view
This window shows the hosts that have been dynamically quarantined. Hosts in static quarantine are not
reflected in this list.
The information provided in the “Quarantine” view is as follows:
Addresses
IP address of the host(s) affected by the quarantine.
Type
2 options are possible: Host to host and Host to all.
Expiry
Time at which the quarantine will expire.
4.7.2. “ASQ Bypass” view
The information provided in the “ASQ Bypass” view is as follows:
Addresses
IP address of the host(s) affected by the ASQ Bypass.
Type
2 options area possible: Host to host and Host to all.
Expiry
Time at which the ASQ Bypass will expire.
Copyright NETASQ 2012
User Manual
5. NETWORK ACTIVITY
5.1.
VPN TUNNELS
The following window appears when you click on the VPN Tunnels menu:
88
User configuration Manual
Figure 49: VPN tunnels
Here, you will see statistical information on the tunnel’s operation.
The data displayed in this window are as follows:
Source
IP address or name of the tunnel initiator
Source address
IP address of the tunnel initiator
Bytes
Indicates incoming and outgoing throughput.
Destination
Destination IP address
Status
Indicates the tunnel’s status. (Example: Mature).
Lifetime
The SA’s (Security Association) lifetime in a graphical representation of the position in this
lifetime as well as the value (expressed in hours, minutes and seconds)
Copyright NETASQ 2012
User Manual
Authentication
The authentication algorithm
Encryption
Name of the encryption algorithm
The tunnel is made up of two sub-tunnels, one for each direction of the datagram transmission.
REMARK
The algorithms and limits have been configured in the NETASQ UNIFIED MANAGER (refer to the
Manager user and configuration guide help for further details).
TIP
You will find other information on the parameters in this window in the RFC.
Further information may be found in RFC 2401 IPSEC:
http://www.ietf.org/rfc/rfc2401.txt
or on sites such as: http://www.guill.net/reseaux/Ipsec.html
This status is color-coded. The line containing VPN information will use the color corresponding to the
tunnel’s status.
Undetermined.
Larval: the SA is in the process of being negotiated or has not been completely negotiated.
89
Mature: the SA has been established and is available; the VPN tunnel has been correctly set up.
User configuration Manual
Dying: the SA will soon expire; a new SA is in the progress of being negotiated.
Dead: the SA has expired and cannot be used; the tunnel has not been set up and is therefore no longer
active.
Orphan: a problem has arisen, in general this status means that the tunnel has been set up in only one
direction.
5.2.
ACTIVE UPDATE
DEFINITION: ACTIVE UPDATE
Enables updating the antivirus database, ASQ contextual signatures, the list of antispam servers and
the URLs used for dynamic URL filtering.
This window displays the status of Active Update on the firewall for each type of update available
(Antispam, Antivirus, Contextual signatures, Dynamic URL).
Copyright NETASQ 2012
User Manual
Figure 50: Active Update
90
Active Update is used for automatically keeping URL databases up to date by downloading them on servers
such as updateX.netasq.com.
User configuration Manual
The Monitor screen indicates the result of the last update (successful or failed) and the date of the last
update.
The following data will be displayed when you click on the Active Update menu:
Status
Name
Indicates the status of the Active Update. 2 options are possible: The last update
failed / Updated.
Indicates the update data categories.
Last update
Indicates the date and time of the last update.
License expiry
Indicates the expiry date of the license option for this category.
5.3.
Copyright NETASQ 2012
User Manual
5.4.
SERVICES
This window sets out the services (active and inactive) on the Firewall and for how long they have been
active/inactive.
91
User configuration Manual
Figure 51: Services
Proxies are displayed in 4 distinct entries:
HTTP Proxy
SMTP Proxy
POP3 Proxy
FTP Proxy
Information regarding antivirus can also be seen in this window (activity, version, last update, expiry of its
license).
The following data will be displayed when you click on the Services menu:
Status
Indicates whether services are active or inactive
Name
Indicates the names of services
Uptime
Indicates the number of number of days the service has been running and the time of
activation.
Version
Version number of the service
Last update
Date of the last time the service was updated.
Copyright NETASQ 2012
User Manual
5.5.
HARDWARE
5.5.1. High availability
This window displays information concerning the initialization of high availability.
DEFINITION OF HIGH AVAILABILITY
High availability is an option that allows two firewalls (identified through a MasterHA and
BackupHA license) to exchange information on their statuses, via a dedicated link in order to ensure
service continuity in the event one of the firewalls breaks down. Firewalls in high availability have
the same configuration – only their serial numbers, licenses (Master or Backup) and most of all,
their status (active or passive) differ.
92
User configuration Manual
Figure 52: Hardware
NOTE
Version 9 of multifunction firewalls NETASQ allows you to benefit from high availability support
new-generation display with the date of the last synchronization of the cases.
You will also note an evolution in the support RAID.
Figure 53: Raid
Copyright NETASQ 2012
User Manual
6. POLICIES
6.1.
FILTER POLICY
The Filter Policy menu, accessible from the menu directory, in Monitor recaps the active filter
policy by grouping together implicit rules, global filter rules and local filter rules.
93
User configuration Manual
Figure 54: Filter policy
Each row displayed is set out as follows:
<identifier for the rule type >: <identifier for the rule in the
slot>: <filter rule>
Where
<identifier for the rule type > can be “0” for implicit rules, “1” for global filters and “2” for local
filters.
<identifier for the rule in the slot>: this identifier is always “0” for implicit rules.
<filter rule>: filter rule created by NETASQ.
Copyright NETASQ 2012
User Manual
6.2.
VPN POLICY
Definition VPN (Virtual Private Network)
The interconnection of networks in a secure and transparent manner for participating applications
and protocols – generally used to link private networks to each other through the internet.
94
User configuration Manual
Figure 55: VPN policy
The VPN section allows viewing the configuration of different VPN tunnel policies defined in the active VPN
slot. These VPN policies do not necessarily have to be used in order to be displayed. The VPN slot only
needs to be activated.
Copyright NETASQ 2012
User Manual
The following information is displayed in this window:
Source
Traffic endpoint. Indicates the source network.
Source router
Indicates the address of the source gateway.
Direction
Indicates the direction of the traffic represented by the following icons:
Protocol
Indicates the protocol(s) allowed to pass through the tunnel.
Destination router
Indicates the address of the destination address.
Destination
Traffic endpoint. Indicates the destination network.
Level
Level of security associated with the tunnel.
REMARK
This level is defined when creating the VPN tunnel according to the encryption and
authentication algorithm).
Max lifetime
Maximum lifespan of the configured VPN policy.
95
User configuration Manual
Copyright NETASQ 2012
User Manual
7. LOGS
7.1.
STATUS OF USE
A graph represents the current size of the log file in real time (“Alarms”, “Authentication”, ”Connections”,
“Filters”, “ftp”, “Monitor”, “Plugins”, “POP3”, “VULNERABILITY MANAGER”, “Administration”, “SMTP”,
“System”, “IPSec VPN”, “Web”, “SSL VPN”) in relation to the size allocated on the Firewall for each log type.
DEFINITION OF LOGS
Chronological record of a computer’s activity, which makes up a journal of events that took place in
programs and systems over a given period.
7.2.
LOG TYPES
7.2.1. VPN
96
User configuration Manual
Figure 56: VPN
Copyright NETASQ 2012
User Manual
The following data is displayed when you click on the VPN menu:
Date
Date and time the entry was generated
Error level
Error message
Phase
SA negotiation phase
Source
Connection source address (tunnel initiator).
Destination
Destination IP address or name
Message
Message informing of an attempt to set up a tunnel.
Peer identity
In SPI
Identity of the peer indicated in pre-shared key configuration where “IP address” has not
been specified as the identity type.
SPI number of the negotiated incoming SA (in hexadecimal).
Out SPI
SPI number of the negotiated outgoing SA.
Cookie
(incoming outgoing)
Role
Temporary identity markers for the initiator and recipient of the negotiation.
Remote network
IP address of the remote network on the traffic endpoint.
Local network
IP address of the local network on the traffic endpoint.
Indicates the user’s endpoint.
7.2.2. System
97
User configuration Manual
Figure 57: System
The following data is displayed when you click on the System menu:
Date
Date and time entry was generated
Service
Name of the service
Message
Indicates the action applied.
Copyright NETASQ 2012
User Manual
APPENDICES
Appendix A: FAQ
1). what is the meaning of the message “Impossible to locate the machine on x.x.x.x”?
2). How can I check the IP address (es) really assigned to the Firewall?
3). what is the meaning of the message ‘You lost the MODIFY privilege’?
4). what is the meaning of the message ‘The operation has exceeded the allotted time’?
5). How do I know if there has been an attempted intrusion?
6). It is possible to allow protocols other than IP?
1) What is the meaning of the message “Impossible to locate the machine on
x.x.x.x”?
This message means that the host on which you are connected cannot reach the Firewall by the IP address
you have specified in the connection window. This may be for one of several reasons.
Check:
98
User configuration Manual
That the IP address which you have specified in the connection window is that of the Firewall
(that of the internal interface in advanced mode),
That your host has indeed a different IP address from the Firewall but is on the same subnetwork,
That the connections are properly in place (use a crossover cable only if you are connecting the
Firewall directly to a host or a router. Type "arp -a" in a DOS window under Windows to see if
the PC recognizes the NETASQ Firewall’s physical address (Ethernet). If it doesn’t, check your
cables and the physical connections to your hub…
That you have not changed the Firewall’s operating mode (transparent or advanced),
That the Firewall recognizes the IP address (see “How can I check the IP address (es) really
assigned to the Firewall?”).
That the access provider for the graphical interface has not been deactivated on the Firewall.
2) How can I check the IP address (es) really assigned to the Firewall?
If you wish to check the IP address (es) or the operating mode (transparent or advanced) you need only
connect to the Firewall in console mode. To do so you can either conduct an SSH session on the Firewall (if
SSH is active and authorized) or connect directly to the firewall by the serial port or by connecting a screen
and a keyboard to the firewall.
Once connected in console mode (with the admin login) type the command ifinfo. This will give you the
network adapter configuration and the present operating mode.
Copyright NETASQ 2012
User Manual
3) What is the meaning of the message ‘You lost the MODIFY privilege’?
Only one user can be connected to the Firewall with the MODIFY privilege. This message means that a user
has already opened a session with this privilege. In order to force this session to close, you need only
connect, adding an exclamation mark before the user’s name (!admin).
WARNING
If an administrator session is open on another machine with the MODIFY right, it will be closed.
4) What is the meaning of the message ‘The operation has exceeded the allotted
time’?
As a security measure any connection between the Firewall and the graphic interface is disconnected after
a given time whether finished or not. In particular, this prevents an indefinite wait for a connection if the
Firewall cannot be reached via the network.
5) How do I know if there has been an attempted intrusion?
99
User configuration Manual
Each attempted intrusion triggers a major or minor alarm, depending on its gravity and configuration. You
are informed of these alarms in four ways:
Firstly the LEDs on the front panel of the firewall light up (red) or flicker (yellow) to alert you.
Then the alarms are logged in a specific file which you can consult from the graphical interface
(NETASQ REAL-TIME MONITOR or NETASQ EVENT REPORTER),
You can receive an alarm report at regular intervals (see Receiving alarms) via the NETASQ
UNIFIED MANAGER application, which can be configured so that whenever an alarm is raised,
an e-mail is sent. When several alarms are raised in a short period, they will be sent in a
collective e-mail
Finally NETASQ REAL-TIME MONITOR displays on the screen the alarms received in real time.
6) It is possible to allow protocols other than IP?
The NETASQ Firewall can only analyze IP-based protocols. All protocols that the Firewall does not analyze
are regarded as suspicious and are blocked.
However, in transparent mode, Novell’s IPX, IPv6, PPPoE, AppleTalk and NetBIOS protocols may be allowed
through even though they are not analyzed.
Copyright NETASQ 2012
User Manual
Appendix B: NETASQ log files
The treatment of traffic passing through Firewalls requires the generation of logs containing descriptions of
all events that arose. Depending on the type of event encountered, these logs will be recorded in specific
NETASQ log files.
There are 17 types of log files available on NETASQ firewalls: "Alarm", "Auth", "Connection", "Count",
"Filter", "Monitor", "Natstat", "Plugin", "Filterstat", "Pop3", "Pvm", "Server", "Smtp", "System", "Vpn",
"Web", "Xvpn".
The names used for these log files are rather self-explanatory. There are 7 in the Monitor section of events.
Alarm
Is used for alarms generated by ASQ in Firewalls (filter rules and “System” events which have a “minor” or “major”
attribute are logged in this file), and its source is NETASQ’s IPS engine – ASQ,
100
Example
The Firewall’s ASQ logs an attempted FTP bounce on a server protected by the Firewall (this traffic is
blocked by default and raises a minor alarm).
User configuration Manual
The information saved in this log file is as follows:
Identifier (Id)
Identifier (number) of the alarm on the firewall.
Date Time (time)
Firewall (fw)
Date and time the line was recorded in the log file at the firewall’s local time.
(Example: fri.9. march 15:46:04 2007).
Serial number or name of the firewall (if known) that caused the event.
Timezone (tz)
Firewall’s timezone at the time the log was written.
Start date (starttime)
“Local” date at the start of an event.
Priority (pri)
Determines the alarm level. The possible values are:
- 0: emergency
- 1: alert
- 2: critical
- 3: error
- 4: warning
- 5: notice
- 6: information
- 7: debug
Level of the filter rule (Local or Global).
Rule (slotlevel)
Rule id (ruleid)
Source interface
(srcif/srcifname)
Source interface name
Rule number. Rules are numbered in order. This number allows uniquely identifying
the rule within the filter slot that was involved in raising the alarm.
(Example: 24).
Name of the firewall interface on which the event was raised (source interface
network card).
Name of the source interface (only if known).
Copyright NETASQ 2012
User Manual
(srcifname)
IP (ipproto)
Internet protocol (tcp or udp).
Protocol (proto)
Protocol of the packet that set off the alarm.
Source (src/srcname)
IP address or name of the object corresponding to the source host of the packet that
set off the alarm.
Source port number of the service or the name of the object corresponding to the
service port of the source host (only if TCP/UDP).
IP address or name of the object corresponding to the destination host of the packet
that set off the event.
Destination port number of the service or name of the object corresponding to the
service port of the destination host if it exists and is requested for this connection.
Network card of the destination interface.
Source port
(srcport/srcportname)
Destination
(dst/dstname)
Destination port
(dstport)
Destination interface
(dstif/dstifname)
User
ICMP code (icmpcode)
Identifier of the authenticated user (FTP), e-mail address of the sender (SMTP),
identifier of the user if authentication has been enabled (WEB).
Action associated with the filter rule and applied on the packet (Examples:
Block/Pass…)
ICMP code in the alarm logs.
ICMP type (icmptype)
ICMP type in the alarm logs.
Message (Msg)
Detailed description of the alarm. All commands sent by the client are found here.
Sensitive information such as passwords is removed.
Category to which the alarm belongs (E.g.: system, protocol, filter, etc).
Action (action)
Context (class)
Alarm type
(classification)
Packet (Pktlen)
Code (number) indicating the alarm category.
Packet (pktdumplen)
Length of the available network packet.
101
Packet (Pktdump)
Available network packet.
User configuration Manual
Identifier (Id)
Identifier (number) of the alarm.
Copy (repeat)
Indicates the number of an event’s occurrences within a defined period. This period is
configured in NETASQ UNIFIED MANAGER in the menu “Logs\Advanced”, option
Write log duplicates every.
Length of the captured network packet.
Plugin
Identifier (Id)
Identifier (number) of the alarm on the firewall.
Date Time (time)
Firewall (fw)
Date and time the line was recorded in the log file at the firewall’s local time.
(Example: fri.9. march 15:46:04 2007).
Serial number or name of the firewall (if known) that caused the event.
Timezone (tz)
Firewall’s timezone at the time the log was written.
Start date (starttime)
“Local” date at the start of an event.
Priority (pri)
Determines the alarm level. The possible values are:
- 0: emergency
- 1: alert
- 2: critical
- 3: error
- 4: warning
- 5: notice
- 6: information
- 7: debug
Copyright NETASQ 2012
User Manual
Rule (slotlevel)
Level of the filter rule (Local or Global).
Rule id (ruleid)
Rule number. Rules are numbered in order. This number allows uniquely identifying the
rule within the filter slot that was involved in raising the alarm.
(Example: 24).
Name of the firewall interface on which the event was raised (source interface network
card).
Name of the source interface (only if known).
Source interface
(srcif/srcifname)
Source interface name
(srcifname)
IP (ipproto)
Protocol (proto)
Protocol of the packet that set off the alarm.
Source (src/srcname)
IP address or name of the object corresponding to the source host of the packet that set
off the alarm.
Source port number of the service or the name of the object corresponding to the service
port of the source host (only if TCP/UDP).
IP address or name of the object corresponding to the destination host of the packet that
set off the event.
Destination port number of the service or name of the object corresponding to the
service port of the destination host if it exists and is requested for this connection.
Network card of the destination interface.
Source port
(srcport/srcportname)
Destination
(dst/dstname)
Destination port
(dstport/dstportname)
Destination interface
(dstif/dstifname)
User
102
Internet protocol (tcp or udp).
Sent
Identifier of the authenticated user (FTP), e-mail address of the sender (SMTP), identifier
of the user if authentication has been enabled (WEB).
Number of KB sent during the connection.
Received (rcvd)
Number of KB received during the connection.
Duration
Connection time in seconds.
Connection group
(groupid)
Operation (op)
Session identifier (link between commands and data transfer).
User configuration Manual
Result
Identified command of the protocol.
- FTP: PUT, MPUT, GET, DELETE,…
- HTTP: GET, PUT, POST,…
- EDONKEY: SENDPART
- POP3: RETR, LIST,…
- FTP: DELETE, LIST,…
Result of the operation in the protocol (example: 404 which indicates an error).
Parameter (arg)
Action obtained (example: /gi-bin/uploadjs.cgi/).
Caller
VoIP: Indicates the caller
Callee
VoIP: Indicates the callee
Media
Type of traffic detected (audio, video, application,…)
Copyright NETASQ 2012
User Manual
Connection
Is used for connections made to and from the Firewall, and its source is NETASQ’s IPS engine – ASQ,
Example : The Firewall’s ASQ kernel logs the connection from the host 192.168.0.2 and from port 1672 to the
host 192.168.1.2 to port 1840.
The information saved in this log file is as follows:
Identifier (Id)
Firewall (fw)
Identifier of the entity that caused the entry to be written. This field always takes on
the value “firewall”.
Date and time the line was recorded in the log file at the firewall’s local time.
(Example: fri.9. march 15:46:04 2007).
Serial number or name of the firewall (if known) that caused the event.
Timezone (tz)
Firewall’s timezone at the time the log was written.
Start date (starttime)
“Local” date at the start of an event.
Priority (pri)
Determines the alarm level. The possible values are:
- 0: emergency
- 1: alert
- 2: critical
- 3: error
- 4: warning
- 5: notice
- 6: information
- 7: debug
Level of the filter rule (Local or Global).
Date Time (time)
Rule (slotlevel)
103
Rule id (ruleid)
User configuration Manual
User
Source interface
(srcif/srcifname)
Source interface name
(srcifname)
IP (ipproto)
Rule number. Rules are numbered in order. This number allows uniquely identifying
the rule within the filter slot that was involved in raising the alarm.
(Example: 24).
Identifier of the authenticated user (FTP), e-mail address of the sender (SMTP),
identifier of the user if authentication has been enabled (WEB).
Name of the firewall interface on which the event was raised (source interface
network card).
Name of the source interface (only if known).
Internet protocol (tcp or udp).
Destination interface
(dstif/dstifname)
Protocol (proto)
Network card of the destination interface.
Source (src/srcname)
Source port
(srcport/srcportname)
Destination
(dst/dstname)
Destination port
(dstport/dstportname)
Sent
IP address or name of the object corresponding to the source host of the packet that
set off the alarm.
Source port number of the service or the name of the object corresponding to the
service port of the source host (only if TCP/UDP).
IP address or name of the object corresponding to the destination host of the packet
that set off the event.
Destination port number of the service or name of the object corresponding to the
service port of the destination host if it exists and is requested for this connection.
Number of KB sent during the connection.
Received (rcvd)
Number of KB received during the connection.
Duration
Connection time in seconds.
Identifier (Id/alarmid)
Indicates the number of the alarm.
Protocol of the packet that set off the alarm.
Copyright NETASQ 2012
User Manual
Web
Identifier (Id)
Firewall (fw)
Identifier of the entity that caused the entry to be written. This field always takes on the
value “firewall”.
Date and time the line was recorded in the log file at the firewall’s local time.
(Example: fri.9. march 15:46:04 2007).
Serial number or name of the firewall (if known) that caused the event.
Timezone (tz)
Firewall’s timezone at the time the log was written.
Start date (starttime)
“Local” date at the start of an event.
Priority (pri)
Determines the alarm level. The possible values are:
- 0: emergency
- 1: alert
- 2: critical
- 3: error
- 4: warning
- 5: notice
- 6: information
- 7: debug
Rule number. Rules are numbered in order. This number allows uniquely identifying the
rule within the filter slot that was involved in raising the alarm.
(Example: 24).
Protocol of the packet that set off the alarm.
Date Time (time)
Rule id (ruleid)
Protocol (proto)
Source (src/srcname)
104
User configuration Manual
Source port
(srcport/srcportname)
Destination
(dst/dstname)
Destination port
(dstport/dstportname)
User
Action (action)
Message (Msg)
IP address or name of the object corresponding to the source host of the packet that set
off the alarm.
Source port number of the service or the name of the object corresponding to the
service port of the source host (only if TCP/UDP).
IP address or name of the object corresponding to the destination host of the packet that
set off the event.
Destination port number of the service or name of the object corresponding to the
service port of the destination host if it exists and is requested for this connection.
Identifier of the authenticated user (FTP), e-mail address of the sender (SMTP), identifier
of the user if authentication has been enabled (WEB).
Action associated with the filter rule and applied on the packet (Examples: Block/Pass…)
Sent
Detailed description of the alarm. All commands sent by the client are found here.
Sensitive information such as passwords is removed.
Number of KB sent during the connection.
Received (rcvd)
Number of KB received during the connection.
Duration
Connection time in seconds.
Operation (op)
Result
Identified command of the protocol.
- FTP: PUT, MPUT, GET, DELETE,…
- HTTP: GET, PUT, POST,…
- EDONKEY: SENDPART
- POP3: RETR, LIST,…
- FTP: DELETE, LIST,…
Result of the operation in the protocol (example: 404 which indicates an error).
Parameter (arg)
Action obtained (example: /gi-bin/uploadjs.cgi/).
Virus (virus)
Indicates whether there is a virus (if the antivirus has been enabled).
Category (cat_site)
Web category of the requested website.
Copyright NETASQ 2012
User Manual
SMTP
Identifier (Id)
Firewall (fw)
Identifier of the entity that caused the entry to be written. This field always takes on the
value “firewall”.
Date and time the line was recorded in the log file at the firewall’s local time.
(Example: fri.9. march 15:46:04 2007).
Serial number or name of the firewall (if known) that caused the event.
Timezone (tz)
Firewall’s timezone at the time the log was written.
Start date (starttime)
“Local” date at the start of an event.
Priority (pri)
Determines the alarm level. The possible values are:
- 0: emergency
- 1: alert
- 2: critical
- 3: error
- 4: warning
- 5: notice
- 6: information
- 7: debug
Protocol of the packet that set off the alarm.
Date Time (time)
Protocol (proto)
Source (src/srcname)
105
Source port
(srcport/srcportname)
Destination
(dst/dstname)
Destination port
(dstport/dstportname)
User
User configuration Manual
Action (action)
Message (Msg)
IP address or name of the object corresponding to the source host of the packet that set
off the alarm.
Source port number of the service or the name of the object corresponding to the
service port of the source host (only if TCP/UDP).
IP address or name of the object corresponding to the destination host of the packet that
set off the event.
Destination port number of the service or name of the object corresponding to the
service port of the destination host if it exists and is requested for this connection.
Identifier of the authenticated user (FTP), e-mail address of the sender (SMTP), identifier
of the user if authentication has been enabled (WEB).
Action associated with the filter rule and applied on the packet (Examples: Block/Pass…)
Sent
Detailed description of the alarm. All commands sent by the client are found here.
Sensitive information such as passwords is removed.
Number of KB sent during the connection.
Received (rcvd)
Number of KB received during the connection.
Duration
Connection time in seconds.
Spam level (spamlevel)
Spam level: 0 (Message not spam) 1,2 and 3 (spam) x (error during the treatment of the
message) and ? (the nature of the message could not be determined) if antispam has
been enabled.
Indicates whether there is a virus in the e-mail. Some of the possible values are “clean”
and “infected”.
Virus (virus)
Copyright NETASQ 2012
User Manual
FTP
Identifier (Id)
Firewall (fw)
Identifier of the entity that caused the entry to be written. This field always takes on the
value “firewall”.
Date and time the line was recorded in the log file at the firewall’s local time.
(Example: fri.9. march 15:46:04 2007).
Serial number or name of the firewall (if known) that caused the event.
Timezone (tz)
Firewall’s timezone at the time the log was written.
Start date (starttime)
“Local” date at the start of an event.
Priority (pri)
Determines the alarm level. The possible values are:
- 0: emergency
- 1: alert
- 2: critical
- 3: error
- 4: warning
- 5: notice
- 6: information
- 7: debug
Protocol of the packet that set off the alarm.
Date Time (time)
Protocol (proto)
Source (src/srcname)
106
User configuration Manual
IP address or name of the object corresponding to the source host of the packet that set
off the alarm.
Source port
Source port number of the service or the name of the object corresponding to the
(srcport/srcportname)
service port of the source host (only if TCP/UDP).
Destination
IP address or name of the object corresponding to the destination host of the packet that
(dst/dstname)
set off the event.
Destination port
Destination port number of the service or name of the object corresponding to the
(dstport/dstportname)
service port of the destination host if it exists and is requested for this connection.
User
Identifier of the authenticated user (FTP), e-mail address of the sender (SMTP), identifier of
the user if authentication has been enabled (WEB).
Action (action)
Action associated with the filter rule and applied on the packet (Examples: Block/Pass…)
Message (Msg)
Sent
Detailed description of the alarm. All commands sent by the client are found here. Sensitive
information such as passwords is removed.
Number of KB sent during the connection.
Received (rcvd)
Number of KB received during the connection.
Duration
Connection time in seconds.
Connection group
(groupid)
Operation (op)
Session identifier (link between commands and data transfer).
Parameter (arg)
Virus (virus)
Identified command of the protocol.
- FTP: PUT, MPUT, GET, DELETE,…
- HTTP: GET, PUT, POST,…
- EDONKEY: SENDPART
- POP3: RETR, LIST,…
- FTP: DELETE, LIST,…
Action obtained (example: /gi-bin/uploadjs.cgi/).
Indicates whether there is a virus in the e-mail. Some of the possible values are “clean” and
“infected”.
Copyright NETASQ 2012
User Manual
POP3
Identifier (Id)
Firewall (fw)
Identifier of the entity that caused the entry to be written. This field always takes on the
value “firewall”.
Date and time the line was recorded in the log file at the firewall’s local time.
(Example: fri.9. march 15:46:04 2007).
Serial number or name of the firewall (if known) that caused the event.
Timezone (tz)
Firewall’s timezone at the time the log was written.
Start date (starttime)
“Local” date at the start of an event.
Priority (pri)
Determines the alarm level. The possible values are:
- 0: emergency
- 1: alert
- 2: critical
- 3: error
- 4: warning
- 5: notice
- 6: information
- 7: debug
Protocol of the packet that set off the alarm.
Date Time (time)
Protocol (proto)
Source (src/srcname)
107
Source port
(srcport/srcportname)
Destination
(dst/dstname)
Destination port
(dstport/dstportname)
User
User configuration Manual
Action (action)
Message (Msg)
IP address or name of the object corresponding to the source host of the packet that set
off the alarm.
Source port number of the service or the name of the object corresponding to the
service port of the source host (only if TCP/UDP).
IP address or name of the object corresponding to the destination host of the packet that
set off the event.
Destination port number of the service or name of the object corresponding to the
service port of the destination host if it exists and is requested for this connection.
Identifier of the authenticated user (FTP), e-mail address of the sender (SMTP), identifier
of the user if authentication has been enabled (WEB).
Action associated with the filter rule and applied on the packet (Examples: Block/Pass…)
Sent
Detailed description of the alarm. All commands sent by the client are found here.
Sensitive information such as passwords is removed.
Number of KB sent during the connection.
Received (rcvd)
Number of KB received during the connection.
Duration
Connection time in seconds.
Operation (op)
Identified command of the protocol.
- FTP: PUT, MPUT, GET, DELETE,…
- HTTP: GET, PUT, POST,…
- EDONKEY: SENDPART
- POP3: RETR, LIST,…
- FTP: DELETE, LIST,…
Spam level: 0 (Message not spam) 1,2 and 3 (spam) x (error during the treatment of the
message) and ? (the nature of the message could not be determined) if antispam has
been enabled.
Indicates whether there is a virus in the e-mail. Some of the possible values are “clean”
and “infected”.
Spam level (spamlevel)
Virus (virus)
Copyright NETASQ 2012
User Manual
Filter
Is used for filter-generated logs (an entry is recorded each time a filter rule set to “Log” applies to the traffic passing
through the Firewall), and its source is NETASQ’s IPS engine – ASQ:
Example : The Firewall’s ASQ kernel logs the event of filter rule 3 (which has been set to “Log”) being used
for the treatment of a packet passing through the Firewall.
The information saved in this log file is as follows:
Identifier (Id)
Firewall (fw)
Identifier of the entity that caused the entry to be written. This field always takes on
the value “firewall”.
Date and time the line was recorded in the log file at the firewall’s local time.
(Example: fri.9. march 15:46:04 2007).
Serial number or name of the firewall (if known) that caused the event.
Timezone (tz)
Firewall’s timezone at the time the log was written.
Start date (starttime)
“Local” date at the start of an event.
Priority (pri)
Determines the alarm level. The possible values are:
- 0: emergency
- 1: alert
- 2: critical
- 3: error
- 4: warning
- 5: notice
- 6: information
- 7: debug
Type of filter rule: implicit (0), global (1) or even local (2).
Date Time (time)
108
Rule (slotlevel)
Rule ID (ruleid)
User configuration Manual
User
Source interface
(srcif/srcifname)
Protocol (proto)
Source (src/srcname)
Source port
(srcport/srcportname)
Destination
(dst/dstname)
Destination port
(dstport/dstportname)
Destination name
(dstname)
Destination interface
(dstif/dstifname)
User
Rule number. Rules are numbered in order. This number allows uniquely identifying
the rule within the filter slot that was involved in raising the alarm.
(Example: 24).
Identifier of the authenticated user (FTP), e-mail address of the sender (SMTP),
identifier of the user if authentication has been enabled (WEB).
Name of the firewall interface on which the event was raised (source interface
network card).
Protocol of the packet that set off the alarm.
IP address or name of the object corresponding to the source host of the packet that
set off the alarm.
Source port number of the service or the name of the object corresponding to the
service port of the source host (only if TCP/UDP).
IP address or name of the object corresponding to the destination host of the packet
that set off the event.
Destination port number of the service or name of the object corresponding to the
service port of the destination host if it exists and is requested for this connection.
Name of the destination (only if known).
Network card of the destination interface.
ICMP code (icmpcode)
Identifier of the authenticated user (FTP), e-mail address of the sender (SMTP),
identifier of the user if authentication has been enabled (WEB).
Action associated with the filter rule and applied on the packet (Examples:
Block/Pass…)
ICMP code in the alarm logs.
ICMP type (icmptype)
ICMP type in the alarm logs.
Action (action)
Copyright NETASQ 2012
User Manual
Format of log files
Log files are text files. A log corresponds to a line ending with the characters CR (Carriage Return, or OD in
hexadecimal) and LF (Line Feed, or 0A in hexadecimal).
The lines are in WELF format.
Blocked packets and allowed packets
In each log line, it is important to locate the “Action” token, as it enables identifying packets which have
been allowed (by the filter policy or because they had not been blocked by the ASQ analyses) when the
“Action” has been set to “Pass”, and packets which have been blocked (which are either uneventfully
deleted by the Firewall or deleted after a reinitialization has been sent to the packet’s source host – this
information is not available to Firewall administrators) when the “Action” has been set to “Block”.
Logs regarding the change of time on firewalls
When the Firewall’s time is reset, a special line will be written in all log files, according to the example
below:
id=firewall time="2003-12-29 16:35:32"fw="U700XXA0Z0899020"tz=+0100
startime="2003-12-29 16:30:10"datechange=1 duration=322
The “datechange=1” token means that the time was reset and “duration” refers to the lag in seconds.
Exceptions on tokens
109
User configuration Manual
Certain log files do not exactly follow the WELF format. These exceptions will be listed in the following
section.
Exceptions that are common to all logs
“Rule” is replaced with “ruleid”,
The “time” token refers to the time (firewall’s local time) at which the line in the log file was
saved,
“Tz” indicates the time difference from the firewall’s time at the moment the log was written.
Therefore it is possible to find out the time of the log in international time and to analyze
attacks launched simultaneously on equipment in different countries,
“Startime” states the time at which a connection started. If the connection lasts for an hour,
the “time” would be roughly equal to “startime” plus one hour,
“Groupid” The FTP plugin indicates a number that is found for all FTP child connections,
“Dstif”, “srcif”, “dstifname”, and “srcifname” refer to the firewall’s source and destination
interfaces with their names,
“User” in several logs corresponds the names of persons authenticated via “authd”,
“Icmptype” and “icmpcode” correspond respectively to the ICMP type and code in alarm logs.
SYSTEM log
Proxies also write events particular to their operation in this log.
"Service" corresponds to the name of the writing service.
"Msg" explains the action of the service that generated this log.
Copyright NETASQ 2012
User Manual
Appendix C: Session and user privileges
Name
Description
Assigned privileges
Logs (R)
Logs consultation
base, log_read
Filter (R)
Filtering policy consultation
base, filter_read
VPN (R)
VPN configuration consultation
base, vpn_read
Logs (W)
Privilege to modify logs configuration
modify, base, log
Filter (W)
Privilege to modify filtering policy configuration
modify, base, filter
VPN (W)
Privilege to modify VPN configuration
modify, base, vpn
Monitoring
Privilege to modify configuration from NETASQ Realtime
Monitor
modify, base, mon_write
Content filtering
Privilege for URL filtering, Mail, SSL and antivirus
management
modify, base, contentfilter
PKI
Privilege to modify PKI
modify, base, pki
Objects
Privilege to modify Object database
modify, base, object
Users
Privilege to modify Users
modify, base, user
Network
110
modify, base, network
User configuration Manual
Routing
Privilege to modify routing (default route, static routes
and trusted networks)
modify, base, route
Maintenance
Privilege to perform maintenance operations (backups,
restorations, updates, Firewall shutdown and reboot,
antivirus update, modification of antivirus update
frequency, High Availability modification and RAIDrelated actions in NETASQ Realtime Monitor)
modify, base,
maintenance
Intrusion
prevention
Privilege to
configuration
modify, base, asq
Vulnerability
Manager
Privilege to consult or modify vulnerabilities
modify, base, pvm
Objects (global)
Privilege to access to global objets
modify, base, globalobject
Filter (global)
Privilege to access to global filtering policy
modify, base, globalfilter
modify
Intrusion
prevention
(IPS)
The base privilege is assigned to all users systematically. This privilege allows reading the whole
configuration except filtering, VPN, logs and content filtering.
The modify privilege is assigned to users who have writing privileges.
The user who has logged on as admin will obtain the admin privilege. This is the only privilege that allows
giving other users administration privileges or removing them.
Copyright NETASQ 2012
User Manual
Appendix D: SA states
-
Undetermined
Larval
The SA is in the process of being negotiated or has not been completely negotiated.
Mature
The SA has been established and is available; the VPN tunnel has been correctly set up.
Dying
The SA will soon expire; A new SA is in the progress of being negotiated.
Dead
The SA has expired and cannot be used; The tunnel has not been set up and is therefore no
longer active.
A problem has arisen, in general this status means that the tunnel has been set up in only one
direction.
Orphan
111
User configuration Manual
Copyright NETASQ 2012
User Manual
Appendix E: Sort criteria
For each menu in NETASQ REAL-TIME MONITOR, a “Column” field will enable sorting. The sorting criteria
vary according to the menu
Overview
Auto connection
Read only
Status
Name
Address
User
Model
Firmware
Active Update
VULNERABILITY MANAGER
Antivirus
Backup version
Latest alarms
Vulnerabilities
Global filter
Filter
VPN
URL
NAT
Uptime
Session
Comments
Firewall
Date
UTC Date
Start date
UTC Start date
Timezone
Logs
Action
Priority
Rule
User
Protocol
Connection group
Source interface
Source
Source address
Source port
Destination interface
Destination
Destination address
Destination port
Details
Sensitive alarm
Copy
ID
Context
Alarm type
Caller
Callee
Duration
Data sent
Data received
Operation
Result
Parameter
Category
Spam level
Virus
IP
Media
Message
ICMP Code
ICMP Type
Event
112
User configuration Manual
Copyright NETASQ 2012
User Manual
Vulnerability manager
Data source
Severity
Name
Affected hosts
Family
Target
Exploit
Solution
Release
ID
Name
Address
Users
Operating system
Vulnerabilities
Applications
Infos
Open ports
Last vulnerability manager event
Interface
Incoming bytes
Outgoing bytes
Incoming throughput
Outgoing throughput
Name
Type
Address/Mask
Incoming throughput
Outgoing throughput
Connections
Media
Bandwidth
Stats
Machines
Interfaces
113
User configuration Manual
Quality of service
QID
Incoming throughput
Outgoing throughput
Incoming packets
Outgoing packets
Rejected incoming packets
Rejected outgoing packets
Incoming bytes
Outgoing bytes
Users
Firewall
Name
Group
Address
Expiry
Copyright NETASQ 2012
User Manual
Quarantine – ASQ Bypass
Addresses
Type
Expiration
VPN Tunnels
Source
Source address
Bytes
Destination
Destination address
Status
Lifetime
Authentication
Encryption
Spi Out
Spi In
Reqid Out
Reqid In
Active Update
Status
Name
Last update
License expiry
114
User configuration Manual
Services
Status
Name
Uptime
Version
Last update
License expiry
VPN Policy
Source
Source address
Source router
Src. Gateway addr.
Direction
Protocol
Destination router
Dest. Gateway addr.
Destination
Destination address
Level
Max. lifetime
Negotiated SAs
Copyright NETASQ 2012
User Manual
VPN
Date
Error level
Phase
Source
Source address
Destination
Destination address
Message
Identity of remote peer
Spi Out
Spi In
Cookie (incoming/outgoing)
Role
Remote network
Local network
System
Date
Service
Message
115
User configuration Manual
Copyright NETASQ 2012
User Manual
Appendix F: The Details column in the Events menu
The “Details” column seen in the Events menu groups information relating to the type of log. The detail
may be related to alarm, connection VoIP, web, mail, FTP or even filter logs.
The “Details” column groups in a single column information visible in other columns.
Alarm
Sensitive alarm (sensitive)
Copy (repeat): number of copies of the event groups in the event line
Slotlevel: indicates whether the log had been started by an implicit (0), global (1) or local (2)
rule
Rule (Ruleid): identifier of the rule that set off the log.
Connection
Sent: amount of data sent
Received (rcvd): amount of data received
Duration: duration of the connection
116
User configuration Manual
VoIP
(caller-callee): Caller – Callee
Sent: amount of data sent
Received (rcvd): amount of data received
Duration: duration of the connection
WEB
Message (msg): detailed description of the alarm. All commands sent by the client are found
here. Sensitive information such as passwords is removed.
Website category (cat_site)
Antivirus scan message
Sent: amount of data sent
Received (rcvd): amount of data received
Duration: duration of the connection
Copyright NETASQ 2012
User Manual
MAIL
Message (msg): detailed description of the alarm. All commands sent by the client are found
here. Sensitive information such as passwords is removed.
Antivirus scan message
SPAM level (spamlevel): Spam level: 0 (Message not spam) 1,2 and 3 (spam) x (error during the treatment
of the message) and ? (the nature of the message could not be determined) if antispam has been enabled.
Sent: amount of data sent
Received (rcvd): amount of data received
Duration: duration of the connection
FTP
Message (msg): detailed description of the alarm. All commands sent by the client are found
here. Sensitive information such as passwords is removed.
Antivirus scan message
Sent: amount of data sent
Received (rcvd): amount of data received
Duration: duration of the connection
Filter
117
User configuration Manual
Message
Slotlevel: indicates whether the log had been started by an implicit (0), global (1) or local (2)
rule
Rule (Ruleid): identifier of the rule that set off the log.
Copyright NETASQ 2012
User Manual
[email protected]