1
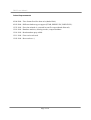
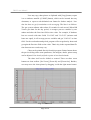
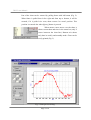
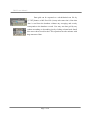
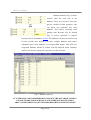
DB Viewer
User manual
By Peter Kravtsov (E-mail: [email protected])
This document location: http://lkst.pnpi.nw.ru/pdf/DBViewer.pdf
December 1999
(updated November 2007)
DB Viewer Manual
Latest improvements
02/04/2000 - Time format fixed for chart axis (thanks Blair).
02/03/2000 - Different database types support (STAR, PHENIX DC, PHENIX PC).
12/23/1999 - Zero time mistake is corrected in text file export (thanks Howard).
12/19/1999 - Database statistics, deleting records, compact database.
12/18/1999 - Raw datasheet query added.
12/11/1998 - First version released.
12/05/1998 - Idea was born :-)
Page 2 of 8
DB Viewer Manual
Software manual
The objective behind the Database Viewer was to create userfriendly software for analyzing STAR TPC Gas System data. All data are
kept in MS Access database, giving one a possibility to use native MS Access
tools for converting and analyzing these data. Besides, this simplifies
dramatically access to the certain data in a huge database (for example, 3.5
month database has approximately 200 thousands of records). Sometimes it is
useful to get fast results and charts from the database during the gas system
operation. The solution for these requirements is DB Viewer. Program allows
user to change the database to get data from (Fig. 1). The database name is
stored in the system registry and will be restored on next run. User may select
start date on the chart toolbar with one of three periods (daily, weekly and
monthly) and one of the gas system process variables from the [Channel]
listbox. The [Query] button gets specified data from database and shows it on
the chart. Two small buttons below the date picker shift the date by one day
independently on specified period.
Fig. 1. Chart window.
Page 3 of 8
DB Viewer Manual
User may copy chart picture to clipboard with [Copy] button, export
it to a windows metafile ([*.WMF] button), which can be inserted into any
document, or export to tab-delimited text format for further analysis. Note
that the data are got from database with averaging. The idea is as follows.
The gas system software takes about 50 seconds for each record. When DB
Viewer gets data for the day period, it averages process variables by one
minute and takes the first time field as time value. For example, if database
has two records with time fields "11:03:05" and "11:03:53" (minutes and
hours are equal), it will average process variables and get "11:03:05" as time
field. For the week and month period, program will average data by hours and
get again the first time field as time value. That's why in the exported data file
time between two records may vary.
Chart can be printed directly from this program. Printer button shows
the preview dialog where some parameters, like margins, details, printer setup
can be adjusted. Note that by default it prints in low-detailed mode.
The chart itself can be shifted or zoomed. There are three zoom
buttons on chart toolbar: [No Zoom], [Zoom In] and [Zoom Out]. Besides,
user may move the chart picture by dragging it with the right mouse button.
Fig. 2. Chart zoom.
Page 4 of 8
DB Viewer Manual
Part of the chart can be zoomed by pulling frame with left button (Fig. 2).
When frame is pulled from left to right and from top to bottom, it will be
zoomed, if it is pulled vise versa, chart restores "no zoom" position. This
position is restored also when [Query] button is pressed.
When mouse cursor moves over the chart, it
shows current data and time in the status bar (only if
cursor intersects the chart line). Bottom axis shows
only date in weekly and monthly mode. Chart can be
easily printed (Fig. 3).
Fig. 3. Print preview dialog.
Page 5 of 8
DB Viewer Manual
Datasheet window (Fig. 4) is designed to get the raw data and the statistics
information from the database. User should select start and stop date (if they
are equal, one-day period will be used). There is a possibility to select
multiple process variables from [Channels] listbox.
Data grid is filled by [Query] button. Before reading
the data program calculates records count and
acquires user acknowledge for data reading, because
it may take some minutes to get huge amount of
data.
Fig. 4. Data grid with multiple channels.
Page 6 of 8
DB Viewer Manual
Data grid can be exported to a tab-delimited text file by
[*.TXT] button, or MS Excel file (it may take some time). Note that
data is read from the database without any averaging and exactly
corresponds to the database records. User may sort data grid by any
column ascending or descending just by clicking column head. Small
blue arrow shows sort direction. This operation can take minutes with
huge amount of data.
Page 7 of 8
DB Viewer Manual
Database statistics (Fig. 5) shows
records count for each day in the
database. There is no need to select any
process variable for this operation. One
can delete any particular day from
database. This allows removing extra
garbage data. Records will be deleted
only if correct password is entered.
Password can be obtained by E-mail. The database size does not reduce even
if some records were deleted. User may compact database and remove
redundant space from database by [Compact DB] button. Note that new
compacted database should be written with the different name. Database
statistics can also be exported to a text file or an Excel format.
Fig. 5. Database statistics.
IT IS STRONGLY RECOMMENDED TO CHANGE THE DATABASE NAME IN
GAS SOFTWARE FOR EACH RUN! EACH WORKING MONTH TAKES
ABOUT 15 MEGABYTES AND OVER 50000 RECORDS IN THE DATABASE!
Page 8 of 8