1
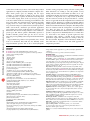
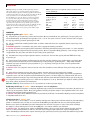
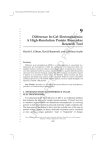
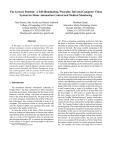
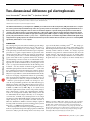
PROTOCOL
Two-dimensional difference gel electrophoresis
Surya Viswanathan1,2, Mustafa Ünlü1,3 & Jonathan S Minden1
1Department
of Biological Science, Carnegie Mellon University, Mellon Institute, 4400 Fifth Avenue, Pittsburgh, Pennsylvania 15213, USA. 2Present address: Proteopure
Incorporated, 900 William Pitt Way, Pittsburgh, Pennsylvania 15238, USA. 3Present address: Bogazici University, Department of Molecular Biology and Genetics, Bebek,
34342, Istanbul, Turkey. Correspondence should be addressed to J.M. ([email protected])
© 2006 Nature Publishing Group http://www.nature.com/natureprotocols
Published online 26 October 2006; doi:10.1038/nprot.2006.234
Two-dimensional difference gel electrophoresis (2D DIGE) is a modified form of 2D electrophoresis (2DE) that allows one to compare
two or three protein samples simultaneously on the same gel. The proteins in each sample are covalently tagged with different color
fluorescent dyes that are designed to have no effect on the relative migration of proteins during electrophoresis. Proteins that are
common to the samples appear as ‘spots’ with a fixed ratio of fluorescent signals, whereas proteins that differ between the samples
have different fluorescence ratios. With the appropriate imaging system, DIGE is capable of reliably detecting as little as 0.5 fmol of
protein, and protein differences down to ± 15%, over a 410,000-fold protein concentration range. DIGE combined with digital image
analysis therefore greatly improves the statistical assessment of proteome variation. Here we describe a protocol for conducting DIGE
experiments, which takes 2–3 d to complete.
INTRODUCTION
The central goals of proteomics include identifying protein changes
that differentiate normal and diseased states in cells, tissues or
organisms, and examining how protein changes correlate with
developmental age and environment. The first stage in comparative
proteomics is to separate complex mixtures of protein into individual components; this is typically done using gel electrophoresis
(at the whole protein level) or column chromatography (at the
peptide level). Both of these separation schemes have advantages
and disadvantages. We have focused on two-dimensional electrophoresis (2DE) because of its accessibility to most laboratories. This
approach was described simultaneously by several groups in 1975
(refs. 1–3). Despite the substantial advances in the technology since
its launch — the most notable of which was the introduction of
immobilized pH gradients in the first dimension4,5 — some of the
more significant systemic shortcomings have remained unsolved.
The most troublesome of these is the inherent lack of reproducibility between gels. Efforts to surmount this limitation have mostly
focused on developing computational methods for gel matching.
These approaches have had limited success because the sources of
gel-to-gel variation are numerous, complex and difficult to model.
Difference gel electrophoresis (DIGE) was developed to overcome the irreproducibility problem in the 2DE methodology by
labeling two samples each with a different fluorescent dye prior to
running them on the same gel (Fig. 1)6. The fluorescent dyes used
in DIGE, Cy3-NHS and Cy5-NHS (Fig. 2), are cyanine based,
molecular-weight matched, amine reactive and positively charged.
These characteristics, coupled with substoichiometric labeling,
result in no electrophoretic mobility shifts arising between the
two differentially labeled samples when they are co-electrophoresed. Therefore, in DIGE, every identical protein in one sample
superimposes with its differentially labeled counterpart in the other
sample, allowing for more reproducible and facile detection of
differences. Furthermore, DIGE is a sensitive technique, capable of
detecting as little as 0.5 fmol of protein, and this detection system is
linear over a 410,000-fold concentration range6–8.
The most important considerations in performing DIGE experiments are experimental design and sample preparation9. DIGE has
been used to analyze proteome changes from a wide variety of cell
types and bodily fluids, including serum7,10–12. The sample-preparation protocol depends on the cell type. Most samples require
mild homogenization in lysis buffer to extract protein. DIGE is an
extremely sensitive method, in which a 15% change in protein
abundance is more than two standard deviations (SDs) above the
normal variation8. One must take great care in deciding which
samples to compare, while bearing in mind the sources of variation.
If specific tissues are to be compared, one must carefully dissect
Test cells
Control cells
A
B
Prepare protein extracts
Label with
Cy3-NHS
Label with
Cy5-NHS
Mix samples
and run on
2D-PAGE
Image with
fluorescence
gel imager
MWt
pl
Figure 1 | Schematic of DIGE analysis. Extracts are made of two cell samples,
denoted ‘A’ and ‘B’. These extracts are separately labeled with Cy3-NHS and
Cy5-NHS, which covalently link to lysine residues. A low stoichiometry of
labeling is used, where B5% of all proteins carry a single dye molecule. The
labeled protein extracts are then combined and co-electrophoresed on a 2DE
gel. The gel is then imaged on a fluorescent gel imager at the Cy3 and Cy5
wavelengths. MWt, molecular weight; pI, isoelectric point.
NATURE PROTOCOLS | VOL.1 NO.3 | 2006 | 1351
PROTOCOL
N+
N
N+
(CH2)4
(CH2)2
(CH2)4
CO2R
CH3
CO2R
Cy3
N
CH3
Cy5
R = NHS
© 2006 Nature Publishing Group http://www.nature.com/natureprotocols
Figure 2 | Chemical structure of DIGE dyes. Propyl-Cy3-NHS and methyl-Cy5NHS are shown here. These compounds are charge and mass matched. The
fluorescent characteristics of Cy3 and Cy5 are dictated by the three-carbon
and five-carbon polyene chains, respectively, linking the two indoline rings.
the tissue to avoid variation. Hypothetically, if one has 10%
contamination of neighboring tissue in one sample and 5%
variation in another, it might lead to artifactual protein differences.
One way to avoid tissue contamination is to use laser microdissection, which provides a precise method for capturing
specific populations of cells13–15. Another source of variation can
arise during sample clean-up or fractionation. If sample
clean-up or fractionation is planned, it is best to label the samples
independently and then combine them prior to cleanup or fractionation. This will alleviate variation due to handling. Simply
measuring total protein after sample cleanup or fractionation
will not guard against variation in loss of specific proteins
during processing.
The protocol described here outlines the steps we use in
performing 2D DIGE experiments. We typically use a two-dye
approach with Cy3 and Cy5. For comparing model systems, such as
Drosophila or yeast, the two-dye approach is more reproducible
than the three-dye method, which utilizes a Cy2-labeled pooled
sample for normalization16. The three-dye method is better
suited to multiple sample comparisons where there is considerable
genetic variation, as in the analysis of human samples17.
The precursor to the three-dye method was a two-dye method
comparing a Cy3-labeled pooled control + test sample and Cy5labeled control or test samples18. We always run two gels for
each comparison, in which the order of labeling is reversed
(referred to as reciprocal labeling). This allows one to differentiate
between sample-dependent differences and rare dye-dependent
differences. The latter are presumably due to incomplete solubilization of proteins allowing the two dyes to associate differently with
the protein. Loading equal amounts of each protein sample is
advisable, but high precision is not required as slight load differences are normalized during image analysis. All steps should be
performed on ice or in a cold room if necessary. As soon as lysis is
complete, samples can be stored at –80 1C in aliquots of 100–250 mg
at concentrations 41 mg ml–1. When comparing whole-cell
extracts, we generally load 80–200 mg of each sample (160–400
mg total protein).
High-quality digital imaging of DIGE gels is essential for
detecting proteome changes. To peer as deeply into the proteome
as possible, it is important to use an imager that is capable of
true 16-bit data collection. Fluorescent gel imagers come in two
formats; scanner-based or CCD camera-based. There are several
commercial gel imagers, such as the Typhoon imager (Amersham
Biosciences/GE Healthcare), which is commonly used for DIGE
gel imaging. The Typhoon imager is based on a scanning
laser-illumination system and photomultiplier detector. The
1352 | VOL.1 NO.3 | 2006 | NATURE PROTOCOLS
gel-scanning systems that are suitable for DIGE analysis require
a different device for spot picking. We use a homemade
CCD-based fluorescence imager that has an integrated spot-picking
robot (Fig. 3).
The main issue to consider in gel imaging is that one should try
to utilize the full dynamic range of the detector. The dynamic range
of the detector is measured in terms of the number of discrete grey
levels or bits of information that each pixel can accommodate. The
CCD camera in our imager has a 16-bit dynamic range or 65,536
grey levels. Ideally, one would like to load enough fluorescentlylabeled protein and set the exposure parameters so that the brightest protein spot nearly saturates the full dynamic range of the
detector. Another important issue is the fluorescent background.
Many of the materials and substances that are placed in the imager
can have intrinsic fluorescence. For example, borosilicate glass is
highly fluorescent so any glass used to hold the gels in the imager
must be made of quartz or fused silica. Although background
fluorescent signals can be removed computationally, they limit the
dynamic range of the gel images and mask signals from lowabundance proteins. Our gel-imaging system is capable of detecting
as little as 0.5 fmol of protein, and can detect proteins over a
410,000-fold concentration range. As there are a limited number
of such gel-imaging systems currently in use, we will not describe
our imaging protocol here in detail.
Image analysis in our laboratory is done using several software
applications, including IPLab (Scanalytics), QuickTime and SExtractor. There are integrated image-analysis packages for DIGE gels,
the most commonly used of which is DeCyder (Amersham
Biosciences/GE Healthcare). We use IPLab and QuickTime for
image visualization and annotation. SExtractor is an astrophysics
freeware application that has been adapted to quantify protein-spot
intensities and ratios (https://sourceforge.net/projects/sextractor)19.
Although these separate applications are more time consuming
than the commercial packages, we find the analysis to be as reliable
CCD camera
Gel-cutter stage
Stepping motor
Cutting tip
96-well plate
Gel
Stage platform
Light-tight cabinet
Y-axis stage
X-axis stage
Figure 3 | Fluorescence gel imager/spot picker. This diagram illustrates
the components of the DIGE gel imager. This device comprises the
following components: a scientific-grade Peltier-cooled 16-bit CCD camera
(Photometrics/Roper Scientific); an 105-mm macro lens (Nikon); a computerdriven stage (New England Affiliated Technology); and a spot-picker
drive (Applied Precision). All electronic components are controlled by a
computer workstation running Windows and custom software. Not shown
is the illumination system, which is composed of two 250 W quartz-tungstenhalogen light sources (Oriel) that direct their light through motorized filter
wheels (Ludl). The light is directed onto the gel via fiber-optic light guides
(Oriel), and fluorescence wavelengths are selected by band-pass filters
(Chroma Technology).
© 2006 Nature Publishing Group http://www.nature.com/natureprotocols
PROTOCOL
as that achieved with DeCyder. None of the current image-analysis
applications are completely automatic in that the computer determines which protein spots are changing and the degree
of change. A certain amount of editing of the detected spots
by visual inspection is required. We find that visual inspection
of a two-frame looping movie of the Cy3 and Cy5 gel images
is the most reliable method for detecting protein differences and
for spot-list editing. For visual inspection, we find that two-frame
looping movies are much more robust than superimposing
two pseudocolor images of Cy3-labeled and Cy5-labeled proteins.
While state-of-the-art, automated spot-detection applications
are becoming more robust, visual inspection is still used as the
final arbiter. The outcome of image analysis is a list of differenceprotein spots that indicate putative differentially expressed or
modified candidate proteins. This spot list can be used for
large-scale protein-profiling studies using standard bioinformatics
tools20.
Despite DIGE being sensitive and reproducible, three caveats
need to be mentioned. First, 2DE does not efficiently resolve
integral membrane proteins. This is due to their hydrophobic
MATERIALS
REAGENTS
m CRITICAL Use double-distilled H2O unless otherwise stated
m CRITICAL The source and purity of ingredients is critical, especially for
solutions used for labeling and IEF
. Urea (Bio-Rad)
. Thiourea (Sigma)
. CHAPS (Roche)
. DTT (Sigma)
. SDS (20% stock solution; Bio-Rad)
. HEPES (100 mM Na-HEPES, pH 8.0, stock; Sigma)
. Cy3-NHS (Amersham Biosciences/GE Healthcare)
. Cy5-NHS (Amersham Biosciences/GE Healthcare)
. Protein clean-up kit (e.g., ProteoHookt; Proteopure)
. Iodoacetamide (Sigma)
. Acrylamide (30% T, 2.6% C stock solution; Bio-Rad)
. N,N,N¢,N¢-tetramethylethylenediamine (TEMED; Sigma)
. Ammonium persulfate (APS; 10% stock kept at –20 1C; Sigma)
. IEF strips (e.g., pH 3–10 NL, 18 cm Immobiline DryStrips; Amersham
Biosciences/GE Healthcare)
. 3 mm filter paper (Whatman)
. Nylon strips (30–130 mesh Nitexs screen; Sefar America Inc.)
. Dimethyl formamide (DMF; anhydrous, 99.9%; Aldrich)
. Methylamine-HCl (Sigma)
. Bromophenol blue (Sigma)
. Acetic acid (glacial; Fisher)
. IPG buffer (Amersham Biosciences/GE Healthcare)
. Glycerol (spectral or pesticide grade; Fluka)
. Standard low-Mr agarose (Bio-Rad)
. Methanol (HPLC grade; Fisher)
. n-butanol
. Bradford reagent (Bio-Rad)
. IEF strip-cleaning detergent (Amersham Biosciences/GE Healthcare)
. RBS 35 detergent (concentrate; Pierce)
. Ethanol (absolute; Fisher)
. DryStrip cover fluid (GE Healthcare)
EQUIPMENT
. IPGphor IEF apparatus (Amersham Biosciences/GE Healthcare)
. SE660 vertical gel-electrophoresis apparatus (Hoeffer)
. Fluorescent gel imager/spot picker (custom made, drawings are available
upon request)
. Model 485 Gradient Former gradient maker (Bio-Rad)
. DryStrip rehydration tray (Amersham Biosciences/GE Healthcare)
domains causing precipitation during isoelectric focusing (IEF).
Other laboratories are working to solve this problem. Second,
labeling with the amine-reactive DIGE dyes limits one to substoichiometric labeling (also known as minimal labeling), where
less than 5% of all proteins carry a single bound dye molecule,
and the rest have no bound dye. For proteins that are 425 kDa,
there is no appreciable molecular-weight shift between labeled and
unlabeled protein, while there is a slight but predictable shift for
smaller proteins in which unlabeled proteins run about half a spot
diameter faster than their labeled counterparts. This shift problem
has been addressed with the development of cysteine-reactive
dyes. These dyes allow one to saturation label all available
cysteines, which eliminates the shift between labeled and unlabeled
proteins, as all proteins are maximally labeled13,14,21. Third, there
is a lower limit to the amount of protein required for mass
spectrometry (MS), which is B10 fmol for the average mass
spectrometer. Again, other laboratories are striving to lower the
MS detection limit. Regardless of these limitations, DIGE combined with MS is a sensitive, robust and useful approach for
comparative proteomics.
. Image-analysis software applications (e.g., IPLab, Scanalytics; QuickTime;
SExtractor)
. Protein-digestion robot (e.g., ProGest; Genomics Solutions)
REAGENT SETUP
m CRITICAL Wear gloves at all times to avoid keratin contamination, which is a
key obstacle to further analysis by MS.
Lysis buffer 7 M urea, 2 M thiourea, 4% (wt/vol) CHAPS, 10 mM DTT and
10 mM Na-HEPES (pH 8.0). m CRITICAL Never heat urea solutions above
room temperature (18–21 1C) as this will cause the formation of cyanate,
which carbamylates protein and produces charge trains in 2DE gels21. The pH
of this solution is critical for the labeling reaction. We typically store the lysis
buffer in 1-ml aliquots at –80 1C.
Dye solutions Add 25 ml DMF to each 25 nmol tube of Cy3-NHS. As the
extinction coefficient of Cy5 is greater than that of Cy3, add 37.5 ml DMF to each
25 nmol tube of Cy5-NHS. m CRITICAL Use fresh, dry DMF of the best quality.
Store dye solutions at –80 1C and allow them to equilibrate to ice temperature
before opening the tube.
Quenching solution 5 M methylamine-HCl and 10 mM HEPES (pH 8.0).
Dissolve 2.38 g HEPES in 38.8 ml of 40% methylamine aqueous solution. Slowly
add concentrated HCl with stirring, until the pH reaches 8.0. ! CAUTION This step
should be done on ice in a fume hood. You will need B60 ml acid to reach the
desired pH. The total volume should be 100 ml. Aliquot and store at –80 1C.
Rehydration buffer 7 M urea, 2 M thiourea, 4% (wt/vol) CHAPS, 10 mM DTT,
2 mM acetic acid, 0.002% (wt/vol) bromophenol blue and 1% (wt/vol) IPG
buffer. Use the appropriate IPG buffer that corresponds to the pH range of the IEF
strips in the experiment. Store rehydration buffer at 4 1C. Use within 7 d.
Equilibration stock 50 mM Tris (pH 8.8), 6 M urea, 30% (vol/vol) glycerol,
2% (wt/vol) SDS and 0.002% (wt/vol) bromophenol blue. Can be stored at
4 1C for 4–6 wk.
Equilibration buffers I and II Prepare equilibration buffers I and II as
needed using 10 ml per IEF strip: equilibration buffer I comprises 1% (wt/vol)
DTT in equilibration stock; equilibration buffer II comprises 2.5% (wt/vol)
iodoacetamide in equilibration stock.
Gradient gel solutions See Table 1 for the composition of the three
acrylamide solutions needed to form a 10–15% gradient gel that is 14 24 cm.
These solutions can be stored without SDS, APS and TEMED for 2–3 wk at 4 1C.
Tank buffer 25 mM Tris, 190 mM glycine and 0.1% (wt/vol) SDS. Can be
made or purchased as a 10 stock.
Agarose sealing solution 125 mM Tris (pH 6.8), 0.1% (wt/vol) SDS,
1% (wt/vol) agarose and 0.002% (wt/vol) bromophenol blue. Heat in a
microwave until the agarose dissolves.
Fixative 40% (vol/vol) methanol (HPLC grade) and 1% (vol/vol) acetic acid
(glacial).
NATURE PROTOCOLS | VOL.1 NO.3 | 2006 | 1353
PROTOCOL
© 2006 Nature Publishing Group http://www.nature.com/natureprotocols
IEF strips IEF strips are available in different pH ranges and sizes.
pH 3–10 NL strips are a good starting point for whole-cell extracts;
‘NL’ indicates that the strip has a non-linear pH gradient, with increased
resolution between pH 5 and 7. The 13 cm strips fit well into the Hoeffer
SE 660 system that we use for SDS-PAGE. If using 18 cm strips,
the ends will have to be cut to fit. This does not lead to appreciable
loss of proteins when using pH 3–10 NL strips, as most samples do
not have many proteins focused with pI values near the extremes.
In practice, using 18 cm pH 3–10 NL strips improves the resolution
of proteins in the region where most proteins lie. pH 4–7 strips can
be used instead of pH 3–10 NL if most proteins are within this pI range,
which is the case for bacterial samples. Narrow pH range strips
(1 pH unit) are available for closer study of proteins within a region
of interest.
TABLE 1 | Composition of acrylamide solutions needed to form a
10–15% gradient gel.
Stock solution
Acrylamide (30% T, 2.6% C)
1.5 M Tris, pH 8.8
0.5 M Tris, pH 6.8
Sucrose
SDS (20%)
H2O
APS (10%)
TEMED
Light
8.25 ml
6.25 ml
–
–
125 ml
10.375 ml
82.5 ml
8.25 ml
Heavy
12.25 ml
6.25 ml
–
3.75 g
125 ml
4.175 ml
82.5 ml
8.25 ml
Stack
400 ml
–
800 ml
–
16.5 ml
2.05 ml
16.7 ml
1.7 ml
PROCEDURE
Casting the gradient gel TIMING B1 h
1| Assemble the gel cassette using cleaned and dried plates. We use homemade 10–15% gradient gels. The glass plates used
for the SE660 vertical gel-electrophoresis apparatus are 24 18 cm. The spacers used are 1.5 mm in thickness. One can bypass
this step by purchasing pre-made gradient gels for 2DE.
2| Set up a standard two-chamber gradient maker so that the outlet tube directs the acrylamide solution into the top of the
gel cassette.
! CAUTION Acrylamide is a neurotoxin; wear gloves and use appropriate handling precautions.
m CRITICAL STEP Make sure the opening of the outlet tube is sufficiently wide that the pouring process takes o2–3 min, otherwise
the gel might begin to polymerize during the pouring process. We use a disposable 200 ml pipette tip, cut at an angle, which fits
snugly between the glass plates and allows for rapid casting of the gradient gel.
3| Add SDS to the heavy and light acrylamide solutions, and mix well. Then add 10% (wt/vol) APS and TEMED when ready
to pour the gel.
4| Pour heavy and light solutions simultaneously into the front and back chambers of the gradient maker, respectively. Open
the mixing channel and the front pinchcock simultaneously to start pouring the gel. Overlay with B750 ml water-saturated
n-butanol (top layer) and allow the gel to polymerize for Z1 h. If pouring several gels at a time, rinse the gradient maker
with water between gels.
m CRITICAL STEP Use a magnetic stirrer and stir bar in the front chamber to ensure sufficient mixing of the heavy and light
solutions.
5| Drain off the n-butanol and rinse with water to remove. Pour the stacking gel and overlay with n-butanol.
m CRITICAL STEP Gels should be allowed to polymerize for Z8 h if one intends cutting protein spots for MS. Unpolymerized
acrylamide causes side-chain and amino-terminal modification of proteins, and these might pose problems for MS. Gels can be
allowed to polymerize overnight. They should be layered with sufficient water-saturated n-butanol that the gels do not dry out.
It is alright to pour the stacking gel just 4–6 h before the electrophoresis is set up. Commercial gels might be suitable, provided
they do not contain any fluorescent contaminants.
’ PAUSE POINT Gels can be stored at 4 1C for 2 d, provided care is taken to prevent drying.
Rehydrating the IEF strip TIMING B1 h for set up and B12 h for rehydration
6| Rehydrate Immobiline DryStrips in a DryStrip rehydration tray according to the manufacturer’s instructions. We prefer to use
sample cups to load protein samples. We do not recommend including the protein sample in the rehydration buffer as this leads
to vertical and horizontal streaks and protein loss22.
m CRITICAL STEP Make sure the IPG buffer matches the pH profile of the IEF strip. The Immobiline DryStrips need to be rehydrated
in rehydration buffer for 8–22 h.
Sample preparation TIMING B1 h
7| Place the cells or tissue sample in a 1.5-ml centrifuge tube that has a fitted pestle. Sufficient material to yield 100–250 mg
protein is needed. Rinse the cells with an ice-cold low-salt Na-HEPES (pH 8.0) buffer that does not contain primary amines.
Remove excess liquid and add 100 ml lysis buffer. Homogenize the cells with a few passes or turns of the pestle. Centrifuge
the sample in a microcentrifuge for 5–15 min at 15,000g and 4 1C to remove unbroken cells and debris.
m CRITICAL STEP The majority of our samples are Drosophila embryos, which lyse easily by this method. Keep the centrifuge
tube on ice during homogenization or work in a cold room. Some cell types might require more vigorous homogenization,
such as Saccharomyces cerevisiae, which requires vortexing at high speed in the presence of glass beads after addition of lysis buffer.
1354 | VOL.1 NO.3 | 2006 | NATURE PROTOCOLS
PROTOCOL
© 2006 Nature Publishing Group http://www.nature.com/natureprotocols
A glass homogenizer may be used for larger samples, but the lysate needs to be centrifuged at top speed in a microcentrifuge
for 5–15 min at 4 1C to remove debris.
8| Measure protein concentration using a Bradford assay. As urea, CHAPS and DTT affect the Bradford assay, the standards
and samples should all be made up in lysis buffer. Add 2 ml sample/standard to 1,600 ml water in a plastic test tube and mix.
Add 400 ml Bradford reagent, mix and measure the OD at 595 nm within 1 h. If the sample is too concentrated, dilute with
lysis buffer. A standard curve should be made with BSA dissolved in lysis buffer at a concentration range of 0.5 to 2.5 mg ml–1.
The blank should be made with 2 ml lysis buffer.
m CRITICAL STEP Ideally the protein concentration of the lysate should be 1–2 mg ml–1. If the lysate concentration is too
high, dilute with lysis buffer. If the concentration is too low the sample may be concentrated by precipitation, but this could
create problems with protein loss during precipitation, re-solubilization and pH adjustment. It is preferable to start with
sufficient material to yield a suitably concentrated lysate. Another important consideration is the removal of contaminating
factors that affect IEF, such as salt, lipids, detergents and nucleic acids. There are a number of commercial protein clean-up
kits that are worth testing; however, one must be cautious about protein loss and pH effects. We have tested several protein clean-up
kits and found the ProteoHookt reagent to be the best at maintaining the relative proteome composition and to be the
most reproducible. We recommend labeling the protein samples first and then combining the samples before using a protein
clean-up protocol.
Protein labeling TIMING B1 h
9| Steps 9–12 describe a typical DIGE experiment in which protein samples denoted ‘A’ and ‘B’ are to be compared. Set up
four 1.5 ml microcentrifuge tubes, numbered 1–4. Pipette 80 ml protein sample A, which contains 80–200 mg of protein in lysis
buffer, into tubes 1 and 3. Pipette 80 ml protein sample B, which contains 80–200 mg protein in lysis buffer, into tubes 2 and 4.
Try to use equal amounts of protein in each sample. Optionally you can also add 1 ml of 1 mg ml–1 BSA in lysis buffer to each
tube as a loading control. Mix by vortexing.
10| Add 1 ml Cy3-NHS stock solution to tubes 1 and 4. Add 1 ml Cy5-NHS stock solution to tubes 2 and 3. Mix by vortexing.
Incubate in the dark on ice for 15 min. To synchronize the labeling time, add the dye to the walls of all reaction tubes. The
Cy3 and Cy5 reaction tubes containing samples to be loaded on the same gel are briefly spun, vortexed and spun again in a
microcentrifuge at top speed for a few seconds at 4 1C.
m CRITICAL STEP Allow the dye stocks to warm up to ice temperature before opening.
11| To each tube, add 1 ml quenching solution. Again, the solution is dispensed onto the walls of the tubes and the reaction
is started as described in Step 10. Incubate in the dark on ice for 30 min. The duration of quenching can be extended up to
2 h if necessary.
’ PAUSE POINT After labeling, the samples can be stored at –80 1C. Thaw on ice prior to applying to the IEF strips.
12| In a new tube labeled ‘gel 1’, combine the entire contents of tubes 1 and 2. In a new tube labeled ‘gel 2’, combine the
contents of tubes 3 and 4. Add 1.6 ml of the appropriate IPG buffer solution (1 ml for every 100 ml of sample) to the gel
1 and 2 tubes. Mix by vortexing and briefly spin in a microcentrifuge at top speed for a few seconds at 4 1C to consolidate
all of the liquid. The samples should be loaded onto IEF strips immediately after combining.
First-dimension IEF TIMING 6–12 h
13| IEF should be set up according to the manufacturer’s instructions with a few modifications. Refer to the user manual for
more details and precautions to be taken while setting up IEF. Turn on the IPGphor. Place ceramic strip holders on the IPGphor
platform, with the pointed end towards the anode.
14| Cut two 3-mm filter-paper wicks for each gel and immerse in HPLC water. The wicks should be approximately the width
of the gel. They can be made a little longer than they are wide.
15| Open the rehydration cassette assembly. Remove a rehydrated IEF strip and rinse it briefly with HPLC water. Blot excess
water. Place the IEF strip in the holder with the acidic end towards the anode. Place wicks at both ends of the strip, making
sure to blot excess water from the wicks before placing on the gel. Place an electrode on each of the wicks. Place a sample cup
near the electrode on the acidic end of the gel. Cover the surface of the gel with B1 ml of DryStrip Cover Fluid. You can also
cover the entire length of the gel between the cathodic electrode and the sample cup holder with nylon-mesh strips cut to the
width of the opening in the ceramic strip holder and the length of the exposed IEF strip. Gently press down with tweezers to
make sure the strips are contacting the surface of the gel. The nylon mesh helps retain a thin film of cover fluid over the surface
of the gel, thereby preventing it from drying out.
m CRITICAL STEP Avoid unnecessary delays during Step 15 to prevent the IEF strip from drying. The IEF gel is fragile and requires
careful handling.
NATURE PROTOCOLS | VOL.1 NO.3 | 2006 | 1355
PROTOCOL
© 2006 Nature Publishing Group http://www.nature.com/natureprotocols
16| Pipette the sample into the sample cup, taking care to
avoid bubbles. Place the lid over the strip holder. Start the
IEF program shown in Table 2, using 50 mA per strip at 18 1C.
We cover the IEF machine with an opaque cover to limit
photobleaching. The time taken to reach 30–40 kVh using
the above protocol is between 6–12 h. The duration depends
on the sample, and can vary from run to run depending on
the amount of salt and other contaminants in the sample.
Gels should be equilibrated in equilibration buffer immediately
after the run.
TABLE 2 | IEF program for Step 16.
Step
1
2
3
4
Voltage
500
4000
8000
8000
Voltage gradient
type
Step-n-hold
Step-n-hold
Step-n-hold
Step-n-hold
Duration
(h)
1
1
2–4
–
Duration
(kVh)
–
–
–
30–40
Equilibration of IEF strip for second dimension TIMING B30 min
17| Remove strips and place in 100 mm Petri dishes curled along the inside of the dishes with the gel surfaces facing inward.
Equilibrate in 10 ml room temperature equilibration buffer I for 15 min with swirling. Rinse briefly with water. Equilibrate in
10 ml room temperature equilibration buffer II for 15 min with swirling. Drain buffer. Equilibrated IEF strips can be run on the
second dimension immediately.
m CRITICAL STEP Wash all IEF accessories on finishing IEF. Use double-distilled water for washing. Wash strip holders with the
IEF strip-cleaning detergent. Use Q-Tips. Avoid scratching. Rinse thoroughly with water and then absolute ethanol. Wash
electrodes with water and ethanol. Nitex strips should be washed with RBS detergent, water and finally ethanol. Clean
strip-holder lids and the IPGphor platform.
’ PAUSE POINT After equilibration, the IEF strips can be stored at –80 1C for several weeks.
Second-dimension SDS-PAGE TIMING B6–12 h
18| Melt agarose-sealing solution in a microwave and place in a beaker of hot water to keep melted. Drain the n-butanol from
the top of the second-dimension gel and rinse well with water.
19| Remove the IEF strip from the equilibration II solution or thaw if previously equilibrated and frozen. Place IEF strip on top
of the second-dimension gel with the plastic touching the back glass and the acidic end of the strip towards the left. Make sure
the gel side is not touching the front glass. Gently push the IEF strip down until it contacts the stacking gel. Make sure not to
damage the IEF gel. Cover the IEF strip with melted agarose until it just covers the IEF strip. Dispense some from each end so
that it covers evenly. Make sure there are no bubbles. If there are bubbles, remove them once the agarose solidifies.
20| Place the gel in the electrophoresis unit, and fill the upper and lower chambers with tank buffer. The lower tank should be
filled with 3.5 l tank buffer and stirred constantly at 4 1C in a cold room.
21| Electrophorese at a constant current with a maximum voltage set at 500. Typically we set the current at 10–25 mA per
gel depending on how long we want the run to take (e.g., 25 mA per gel requires B10 h to complete and 15 mA per gel
takes B16 h).
22| At the completion of electrophoresis, remove the gels from the glass plates. The stacking gel, dye front and IEF strip should
be removed, and the gel soaked in fixative for Z2 h with gentle swirling.
’ PAUSE POINT Gels can be stored in fixative for several months without significant loss of fluorescent signal. For long-term
storage, refrigeration is recommended. However, protein spots to be identified by MS should be cut out and frozen at –80 1C
within 1 wk.
Image acquisition TIMING B30 min per gel
23| Acquire images using your chosen imaging system. The DIGE experiment described will yield four images: two each from gel
1 and reciprocal gel 2. Each image is 1,024 1,280 pixels, with a resolution of 135 mm per pixel. These images should be
stored as raw unsigned-16 bit data.
Image analysis TIMING B1 h per 24 3 18 cm gel with B1,500 protein spots
24| Perform image analysis. Image analysis in our laboratory is done using several software applications: IPLab (Scanalytics),
QuickTime and SExtractor. Visually inspect a two-frame looping QuickTime movie of the Cy3 and Cy5 gel images to detect
protein differences. The outcome of image analysis is a list of difference-protein spots that indicate significant differences
between the two protein samples being compared.
m CRITICAL STEP In general, we rely on the two-frame looping movies to identify the significant protein changes we want to
identify by MS. The exogenously added BSA serves as a loading control to balance the image-display parameters for making two-frame
1356 | VOL.1 NO.3 | 2006 | NATURE PROTOCOLS
PROTOCOL
looping movies. More precise quantification is done later using SExtractor. To accurately assess the level of protein change, the Cy3
and Cy5 images are summed and submitted to SExtractor for spot detection, which generates a list of elliptical objects that specify
individual protein spots. This list is used as a mask to determine the protein spot intensities in background-subtracted Cy3 and Cy5
images. This approach typically yields an SD of 5–7% for unchanging spots. Visual difference-protein detection requires o1 h for
an experienced user to complete. Computational spot-detection methods are becoming more reliable, but require manual editing.
The computational methods are particularly useful when comparing multiple gels.
© 2006 Nature Publishing Group http://www.nature.com/natureprotocols
Spot picking TIMING B1–2 h depending on the number of protein differences
25| Use the integrated spot-cutting tool to ‘click’ on spots of interest, cut a 1.8-mm diameter plug from the gel and deposit
it in a 96-well plate designed for a protein digestion robot (ProGest). The wells of the receiving plate should be filled with
1% (vol/vol) acetic acid. The imager software allows one to create a list of protein spots to be retrieved. After all the desired
spots are cut, the acetic-acid solution should be removed and the plate moved to the digestion robot.
m CRITICAL STEP A key difference between the gel-imaging system we use and the Typhoon imaging system is that we use an
open-gel format that is amenable to imaging and spot picking within the same device, whereas the Typhoon imager is best suited
to imaging the gel within the electrophoresis plates, so spot picking is done on a different device. The open-gel format does
not require the gel to adhere to one of the two electrophoresis plates.
’ PAUSE POINT The cut gel fragments can be stored after acetic acid removal at –80 1C for at least several weeks.
Protein identification
26| Identify the difference proteins using MS. This can be done by routine methods using a variety of instruments. DIGE
labeling with Cy3-NHS or Cy5-NHS labels only a small fraction of proteins in the lysate: B5% of all proteins have a single
dye molecule bound, whereas the rest have none. Hence, DIGE labeling does not affect the MS identification of proteins. It is
important to note however, that the DIGE imaging system is capable of detecting o0.5 fmol of protein. This is well below the
limit of identification of peptides derived from gel spots using MS, which is B10–50 fmol. To identify low-abundance difference
proteins, one must either enrich for the proteins of interest or pool protein from multiple DIGE gels.
TIMING
Casting the gradient gel: B1 h
Rehydrating the IEF strip: B1 h for set up and B12 h for rehydration
Sample preparation: B1 h
Protein labeling: B1 h
First dimension IEF: 6–12 h
Equilibration of IEF strip for second dimension: B30 min
Second dimension SDS-PAGE: B6–12 h
a
Image acquisition: B30 min per gel
Image analysis: B1 h per 24 18 cm gel with B1,500
protein spots
Spot picking: B1–2 h depending on the number of protein
differences
? TROUBLESHOOTING
There are two main reasons for poor results: insufficient
protein labeling and incomplete IEF. Insufficient labeling is
commonly due to the pH of the lysate being o8.0 or the
presence of excess primary amines, such as Tris. If there is
sufficient sample, one can test the pH using a small piece of
pH paper. Tris o50 mM does not appear to interfere with
protein labeling, and 30 mM is recommended. Incomplete
focusing is usually the result of interfering contaminants,
such as salts and nucleic acids. Salts, which can be removed
using a protein clean-up kit, prevent the IEF from reaching the
desired voltage. Nucleic acids make the sample viscous and
difficult to handle and also interfere with focusing. Nucleic
acids can be removed by commercially available clean-up kits,
such as ProteoHookt, or can be broken up by sonication or
the addition of nuclease1.
b
Figure 4 | DIGE images. (a) Color overlay of Cy3 (green) and Cy5 (red) images
of Drosophila embryo extracts. Regions of equal Cy3 and Cy5 signals appear
yellow. (b) Examples of side-by-side comparisons of subregions of the DIGE
gel shown in a, with Cy3 on the left and Cy5 on the right. The arrows indicate
proteins that have changed.
NATURE PROTOCOLS | VOL.1 NO.3 | 2006 | 1357
PROTOCOL
ANTICIPATED RESULTS
There will always be gel-to-gel variation for 2DE gels. This is due to a myriad of uncontrollable features in manufacturing, sample
preparation and electrophoretic conditions. DIGE was developed to circumvent some of this variability. The digital-imaging
system and fluorescence-labeling also provide a three or four orders of magnitude linear response, which provides much more
accurate estimation of protein abundance than silver or Coomassie blue staining of proteins. DIGE protein differences can be
visualized in a variety of ways, including color overlay, side-by-side spot comparison (Fig. 4a,b) and two-frame looping movies
(Supplementary Video 1).
© 2006 Nature Publishing Group http://www.nature.com/natureprotocols
Supplementary information is available via the HTML version of this article.
COMPETING INTERESTS STATEMENT The authors declare competing financial
interests (see the HTML version of this article for details).
Published online at http://www.natureprotocols.com
Reprints and permissions information is available online at http://npg.nature.com/
reprintsandpermissions
1. O’Farrell, P.H. High resolution two-dimensional electrophoresis of proteins.
J. Biol. Chem. 250, 4007–4021 (1975).
2. Scheele, G.A. Two-dimensional gel analysis of soluble proteins. Characterization of
guinea pig exocrine pancreatic proteins. J. Biol. Chem. 250, 5375–5385 (1975).
3. Klose, J. Protein mapping by combined isoelectric focusing and electrophoresis of
mouse tissues. A novel approach to testing for induced point mutations in
mammals. Humangenetik 26, 231–243 (1975).
4. Gorg, A., Postel, W. & Gunther, S. The current state of two-dimensional
electrophoresis with immobilized pH gradients. Electrophoresis 9, 531–546
(1988).
5. Hamdan, M. & Righetti, P.G. Proteomics Today: Protein Assessment and Biomarkers
using Mass Spectrometry, 2D Electrophoresis, and Microarray Technology (John
Wiley & Sons, Hoboken, New Jersey, 2005).
6. Unlu, M., Morgan, M.E. & Minden, J.S. Difference gel electrophoresis: a single gel
method for detecting changes in protein extracts. Electrophoresis 18, 2071–2077
(1997).
7. Lilley, K. in Current Protocols in Protein Science (eds. Coligan, J.E., Dunn, B.M.,
Speicher, D.W. & Wingfield, P.T.) 22.2.1–22.2.14 (John Wiley & Sons, Inc.,
New York, 2002).
8. Gong, L. et al. Drosophila ventral furrow morphogenesis: a proteomic analysis.
Development 131, 643–656 (2004).
9. Shaw, M.M. & Riederer, B.M. Sample preparation for two-dimensional gel
electrophoresis. Proteomics 3, 1408–1417 (2003).
10. Marouga, R., David, S. & Hawkins, E. The development of the DIGE system: 2D
fluorescence difference gel analysis technology. Anal. Bioanal. Chem. 382,
669–678 (2005).
1358 | VOL.1 NO.3 | 2006 | NATURE PROTOCOLS
11. Okano, T. et al. Plasma proteomics of lung cancer by a linkage of
multi-dimensional liquid chromatography and two-dimensional difference
gel electrophoresis. Proteomics 6, 3938–3948 (2006).
12. Wang, H. et al. Intact-protein-based high-resolution three-dimensional
quantitative analysis system for proteome profiling of biological fluids.
Mol. Cell Proteomics 4, 618–625 (2005).
13. Kondo, T. et al. Application of sensitive fluorescent dyes in linkage of laser
microdissection and two-dimensional gel electrophoresis as a cancer proteomic
study tool. Proteomics 3, 1758–1766 (2003).
14. Sitek, B. et al. Novel approaches to analyse glomerular proteins from smallest
scale murine and human samples using DIGE saturation labelling. Proteomics 6,
4506–4513 (2006).
15. Zhou, G. et al. 2D differential in-gel electrophoresis for the identification of
esophageal scans cell cancer-specific protein markers. Mol. Cell Proteomics 1,
117–124 (2002).
16. Karp, N.A. & Lilley, K.S. Maximising sensitivity for detecting changes in protein
expression: experimental design using minimal CyDyes. Proteomics 5, 3105–3115
(2005).
17. Tonge, R. et al. Validation and development of fluorescence two-dimensional
differential gel electrophoresis proteomics technology. Proteomics 1, 377–396
(2001).
18. Yan, J.X. et al. Fluorescence two-dimensional difference gel electrophoresis and
mass spectrometry based proteomic analysis of Escherichia coli. Proteomics 2,
1682–1698 (2002).
19. Bertin, E. & Arnouts, S. SExtractor: software for source extraction. Astron.
Astrophys. 117, 393–404 (1996).
20. Suehara, Y. et al. Proteomic signatures corresponding to histological
classification and grading of soft-tissue sarcomas. Proteomics 6, 4402–4409
(2006).
21. Shaw, J. et al. Evaluation of saturation labelling two-dimensional
difference gel electrophoresis fluorescent dyes. Proteomics 3, 1181–1195
(2003).
22. Zhou, S., Bailey, M.J., Dunn, M.J., Preedy, V.R. & Emery, P.W. A quantitative
investigation into the losses of proteins at different stages of a two-dimensional
gel electrophoresis procedure. Proteomics 5, 2739–2747 (2005).