1
dBug User Manual
Jiřı́ Šimša
Computer Science Department
Carnegie Mellon University
November 18, 2010
Motivation
When testing distributed systems, their concurrent nature can cause a test to execute in many
different ways. For the sake of the argument, let us assume we have a distributed system with a
fixed initial state and a test, which can execute in N possible ways from the initial state. A common
technique to address the non-deterministic execution of distributed systems is stress testing. Stress
testing repeatedly executes the same test, hoping that sooner or later all of the possible ways in
which the test could have executed (and all of the possible errors the test could have detected) are
encountered.
In case there is an error in the system and the test has a chance of P1 to execute in a way that
detects the error, stress testing is expected to discover the error in P iterations. In other words,
stress testing is good at catching likely errors, but might struggle to discover corner case errors that
occur with very low probability. Because the probability distribution of possible ways in which a
test executes can be non-uniform and architecture-dependent the value of P can be much higher
then N . In such situations, stress testing becomes a very inefficient way of searching for errors.
dBug is an alternative to stress testing of distributed systems, which compensates for the
aforementioned inefficiency. The key idea behind dBug is to control the order in which concurrent
events in a distributed system happen. The ability to order concurrent events provides dBug with
a mechanism to systematically enumerate possible executions of a test one by one. By doing so,
every possible execution becomes equally likely and dBug needs in expectation at most N2 iterations
of a test to discover an error (in case it exists).
Overview
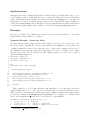
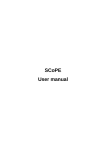
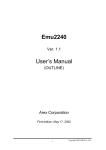
In order to control the order in which concurrent events happen, dBug uses an interposition layer
that sits between the distributed system and the operating system and shared libraries as illustrated
in Figure 1. This interposition layer at run-time intercepts calls to select library calls1 used for
coordination and communication between threads of the distributed system. Upon interception of
a library call, the interposition layer can delay the execution of the call for an arbitrary amount of
time. Optionally, the interposition layer can also decide to inject a fault by simulating an erroneous
execution of the library call.
1
For the complete list of intercepted calls see Appendix section A.
1
Application
Application
dBug interposition
OS + Libraries
OS + Libraries
Figure 1: Interposition
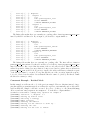
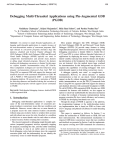
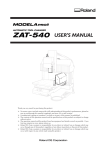
Because of the distributed nature of the system being tested, dBug uses one instance of the
interposition layer per process. In order to coordinate the activity of multiple instances of the
interposition layer, dBug also runs a process called the arbiter, which collects information from
each instance of the interposition layer. The different instances of the interposition layer and the
arbiter form a simple client-server architecture as illustrated in Figure 2. The arbiter acts as a
centralized scheduler of the distributed system and decides in what order the concurrent calls to
library routines should execute.
Original Distributed System
Thread 1
...
dBug client
Thread n
dBug client
dBug
dBug server
dBug arbiter
Figure 2: Client-Server Architecture
Finally, in order to systematically explore different executions of a test in a distributed system,
dBug uses a process called the explorer, which repeatedly sets up the initial state of the distributed
system, starts up the arbiter and provides it with a specific schedule to follow, and runs both
the distributed systems and the test on top of the interposition layer. When an execution of the
test completes, the explorer collects information from the arbiter. This information is used by
the explorer to gradually build a decision tree of all possible ways in which the arbiter can order
concurrent events of the distributed system and the test. The decision tree is in turn used to
generate arbiter schedules, which guide future iterations of the test execution towards unexplored
orderings of events.
2
Implementation
The interposition layer of dBug is implemented as a shared library. The shared library is to be preloaded2 during execution of any binary that is to be controlled by dBug. The location of the library
in the virtual machine image available for download is /usr/lib/libdbugall.so. The arbiter is
implemented as a binary executable and its location in the virtual machine image available for
download is /usr/bin/dbug-server. Finally, the explorer is implemented as a Ruby script and its
location in the virtual machine image available for download is /home/usr/dbug/explorer.rb.
Examples
If not noted otherwise, the commands used in the rest of the section are meant to be ran in the
virtual machine image available for download.
Sequential Example – Interactive Mode
We start with an example which runs the arbiter in the interactive mode. In this mode, the
user is responsible for guiding the execution of the distributed and multi-threaded program. Conceptually, running the arbiter in the interactive mode corresponds to running each process of
the distributed system in gdb, which has breakpoints set for select coordination and communication library calls. The program used in this example is listed below and can be found in
/home/usr/dbug/example-1.c.
1
2
3
4
5
6
7
8
9
10
11
12
13
14
15
16
17
# include < assert .h >
# include < pthread .h >
# include < stdio .h >
int
main ( int argc , char * argv [])
{
pthread_mutex_t mutex ;
assert ( p th re ad _m ut ex _i ni t (& mutex , NULL ) == 0);
assert ( p th re ad _m ut ex _l oc k (& mutex ) == 0);
printf (" Critical section .\ n ");
assert ( p t h r e a d _ m u t e x _ u n l o c k (& mutex ) == 0);
assert ( p t h r e a d _ m u t e x _ d e s t r o y (& mutex ) == 0);
return 0;
}
First, compile the code above into its binary form example-1. Second, start up the arbiter by
running ”dbug-server -m 1”. The option -m 1 tells the arbiter to run in the interactive mode.
Third, open a new terminal window and start the binary example-1 with the interposition library
pre-loaded by running ”LD PRELOAD=/usr/lib/libdbugall.so ./example-1”. Fourth, switch
back to the terminal window of the arbiter. You should see output similar to:
user@user - VirtualBox :~ $ dbug - server -m 1
[
server . cc ]:[...]: Strategy :
[
server . cc ]:[...]:
Thread 1 registered .
[
server . cc ]:[...]:
Thread 1 updated its process .
2
For details see LD PRELOAD in manpage for ld.so.
3
[
[
[
[
[
[
[
util . cc ]:[...]: Requests :
util . cc ]:[...]: Requests :
util . cc ]:[...]:
Request 0:
util . cc ]:[...]:
id :1
util . cc ]:[...]:
func : p thr ea d_ mu te x_ in it
util . cc ]:[...]:
status : ENABLED
util . cc ]:[...]:
command : RESOURCE_CREATE
The listing tells us that there is currently one pending call to function pthread mutex init
issued by thread 1. The status and command are not important for the sake of this example and
will be explained later. The interactive mode expects the user to repeatedly input an integer which
identifies the thread that the user wishes to proceed next. For instance, you can step through the
execution of our example by inputting 1 four times.
Concurrent Example – Interactive Mode
The next example still uses the interactive mode, but this time our example is concurrent. The
program used in this example is listed below and can be found in /home/usr/dbug/example-2.c.
1
2
3
4
5
6
7
8
9
10
11
12
13
14
15
16
17
18
19
20
21
22
23
24
25
26
27
28
29
# include < assert .h >
# include < pthread .h >
# include < stdio .h >
pthread_mutex_t mutex ;
void *
thread ( void * args )
{
assert ( p th re ad _m ut ex _l oc k (& mutex ) == 0);
printf (" Critical section slave .\ n ");
assert ( p t h r e a d _ m u t e x _ u n l o c k (& mutex ) == 0);
return NULL ;
}
int
main ( int argc , char * argv [])
{
pthread_t tid ;
assert ( p th re ad _m ut ex _i ni t (& mutex , NULL ) == 0);
assert ( pthread_create (& tid , NULL , thread , NULL ) == 0);
assert ( p th re ad _m ut ex _l oc k (& mutex ) == 0);
printf (" Critical section master .\ n ");
assert ( p t h r e a d _ m u t e x _ u n l o c k (& mutex ) == 0);
assert ( pthread_join ( tid , NULL ) == 0);
assert ( p t h r e a d _ m u t e x _ d e s t r o y (& mutex ) == 0);
return 0;
}
First, compile the code above into its binary form example-2. Second, start up the arbiter
by running ”dbug-server -m 1”. Third, open a new terminal window and start the binary
example-2 with the interposition library pre-loaded by ”LD PRELOAD=/usr/lib/libdbugall.so
./example-2”. Fourth, switch back to the terminal window of the arbiter and input 1 once. You
should see output similar to:
4
...
[
[
[
[
[
[
[
[
[
[
[
util . cc ]:[...]: Requests :
util . cc ]:[...]:
Request 0:
util . cc ]:[...]:
id :1
util . cc ]:[...]:
func : p thr ea d_ mu te x_ lo ck
util . cc ]:[...]:
status : ENABLED
util . cc ]:[...]:
command : RESOURCE_ACCESS
util . cc ]:[...]:
Request 1:
util . cc ]:[...]:
id :2
util . cc ]:[...]:
func : p thr ea d_ mu te x_ lo ck
util . cc ]:[...]:
status : ENABLED
util . cc ]:[...]:
command : RESOURCE_ACCESS
The listing tells us that there are currently two pending calls to function pthread mutex lock
issued by thread 1 and thread 2. If you input 1, you should see output similar to:
...
[
[
[
[
[
[
[
[
[
[
[
util . cc ]:[...]: Requests :
util . cc ]:[...]:
Request 0:
util . cc ]:[...]:
id :1
util . cc ]:[...]:
func : p t h r e a d _ m u t e x _ u n l o c k
util . cc ]:[...]:
status : ENABLED
util . cc ]:[...]:
command : RESOURCE_RELEASE
util . cc ]:[...]:
Request 1:
util . cc ]:[...]:
id :2
util . cc ]:[...]:
func : p thr ea d_ mu te x_ lo ck
util . cc ]:[...]:
status : DISABLED
util . cc ]:[...]:
command : RESOURCE_ACCESS
The listing tells us that there are currently two pending calls. The first call is to function
pthread mutex unlock issued by thread 1 and the second call is to function pthread mutex lock
issued by thread 2. Also, notice that the status of the second call is disabled. This is because the
arbiter keeps track of shared resources that are being accessed and recognizes when a call such as
pthread mutex lock would block. If you try to input 2, the arbiter will warn you that the request
of the thread 2 cannot be executed. To step through the rest of the execution, input the sequence
1, 2, 2, 1, 1. Notice how the arbiter detects that the thread 2 cannot be joined by the thread 1 until
the thread 2 returns (or exits).
Concurrent Example – Batched Mode
In this example, we will reuse the code of the previous example. However, this time instead of stepping through the program interactively, we will use the explorer to automatically explore all possible
ways in which the example could have executed. In order to do this, go to the /home/usr/dbug
directory and run ”ruby explorer.rb example-2”. You should see output similar to:
user@user - VirtualBox :~/ dbug$ ruby explorer . rb example -2
[ EXPLORER ] Iteration : 1 , Elapsed : 0 s
[ EXPLORER ] Setting up initial state
[ EXPLORER ] Selecting a strategy
[ EXPLORER ] Empty strategy
[ EXPLORER ] Starting the arbiter
[ EXPLORER ] Waiting for the arbiter to start up ...
[ EXPLORER ] Starting the test
[ EXPLORER ] Waiting for the test to finish
5
Critical section master .
Critical section slave .
[ EXPLORER ] Waiting for the arbiter to finish
[ EXPLORER ] Iteration : 2 , Elapsed : 1 s
[ EXPLORER ] Setting up initial state
[ EXPLORER ] Selecting a strategy
[ EXPLORER ] Non - empty strategy
[ EXPLORER ] Starting the arbiter
[ EXPLORER ] Waiting for the arbiter to start up ...
[ EXPLORER ] Starting the test
[ EXPLORER ] Waiting for the test to finish
Critical section slave .
Critical section master .
[ EXPLORER ] Waiting for the arbiter to finish
This means that the explorer explored two possible ways in which the binary example-2 could
have executed. When the explorer starts, it creates the logs directory. This directory is gradually
populated with information about the different executions of the test. Namely, for each iteration,
the logs directory contains the strategy that the arbiter initially followed, the history of the execution the arbiter explored, and detailed logs of the arbiter (the dbug-server file) and the interposition
layer (divided into the dbug-interposition and dbug-client files). For example, the strategy file for
the second iteration of the above application of the explorer looks as follows:
2
1 1
2 2
The first line identifies the number n of steps of the execution specified by the strategy. Each
of the following n lines then identifies the thread to be proceed and the total number pending calls
at that point.
The history file for the first iteration of the above application of explorer looks as follows:
1 1 1
1: pth re ad _m ut ex _i ni t : RESOURCE_CREATE :1 0 0 0 0 0 0 0 0:1759016536:
1 2 2
1: pth re ad _m ut ex _l oc k : RESOURCE_ACCESS :2 0 0 0 0 0 0 0 0:1759016536:2:
2: pth re ad _m ut ex _l oc k : RESOURCE_ACCESS :1 1 0 0 0 0 0 0 0:1759016536:2:
1 1 2
1: p t h r e a d _ m u t e x _ u n l o c k : RESOURCE_RELEASE :3 0 0 0 0 0 0 0 0:1759016536:
2: pth re ad _m ut ex _l oc k : RESOURCE_ACCESS :1 1 0 0 0 0 0 0 0:1759016536:2:
2 1 2
2: pth re ad _m ut ex _l oc k : RESOURCE_ACCESS :1 1 0 0 0 0 0 0 0:1759016536:2:
1: pthread_join : THREAD_JOIN :4 0 0 0 0 0 0 0 0:2:
2 1 2
2: p t h r e a d _ m u t e x _ u n l o c k : RESOURCE_RELEASE :1 2 0 0 0 0 0 0 0:1759016536:
1: pthread_join : THREAD_JOIN :4 0 0 0 0 0 0 0 0:2:
1 1 1
1: pthread_join : THREAD_JOIN :4 0 0 0 0 0 0 0 0:2:
1 1 1
1: p t h r e a d _ m u t e x _ d e s t r o y : RESOURCE_DELETE :5 2 0 0 0 0 0 0 0:1759016536:
The first line identifies 1) the thread whose call was executed, 2) the number m of threads whose
call could have been executed, and 3) the number n of threads with a pending call. This line is
then followed with n lines – one per each pending call. Each of these lines starts with a thread ID,
6
followed by a name of the function call, and additional information, which will not be explained in
this example.
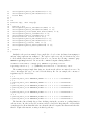
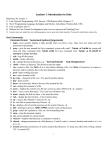
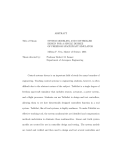
Also, besides the logs directory, the explorer creates the tree.dot file. This file can be processed by the dot tool3 to produce a visualization of the decision tree that the explorer created; for
instance, by running ”dot -T pdf -o <output name> tree.dot”. The decision tree created by
the above application of the explorer is depicted in Figure 3. The gray nodes and edges correspond
to pending calls that cannot be completed from the current state of the system.
0
Thread: 0
Action: INIT
1
Thread: 1
Action: RESOURCE_CREATE
3
Thread: 1
Action: RESOURCE_RELEASE
4
Thread: 2
Action: RESOURCE_ACCESS
5
Thread: 2
Action: RESOURCE_RELEASE
2
Thread: 1
Action: RESOURCE_ACCESS
11
Thread: 2
Action: RESOURCE_ACCESS
10
Thread: 2
Action: RESOURCE_ACCESS
12
Thread: 2
Action: RESOURCE_RELEASE
9
Thread: 1
Action: THREAD_JOIN
17
Thread: 1
Action: RESOURCE_ACCESS
13
Thread: 1
Action: RESOURCE_ACCESS
8
Thread: 1
Action: THREAD_JOIN
14
Thread: 1
Action: RESOURCE_RELEASE
6
Thread: 1
Action: THREAD_JOIN
15
Thread: 1
Action: THREAD_JOIN
7
Thread: 1
Action: RESOURCE_DELETE
16
Thread: 1
Action: RESOURCE_DELETE
Figure 3: Decision Tree
Concurrent Example – Deadlock
In this example, we extend the previous program and introduce a deadlock. We illustrate how the
explorer aids us in detecting this error and identifying the sequence of events leading to the deadlock.
The program used in this example is listed below and can be found in /home/usr/dbug/example-3.c.
1
2
3
4
5
6
7
8
9
10
11
12
# include < assert .h >
# include < pthread .h >
# include < stdio .h >
pthread_mutex_t mutex1 , mutex2 ;
void *
thread ( void * args )
{
assert ( p th re ad _m ut ex _l oc k (& mutex1 ) == 0);
assert ( p th re ad _m ut ex _l oc k (& mutex2 ) == 0);
printf (" Critical section slave .\ n ");
3
The dot tool is part of the graph visualization suite GraphViz by AT&T.
7
13
14
15
16
17
18
19
20
21
22
23
24
25
26
27
28
29
30
31
32
33
34
35
assert ( p t h r e a d _ m u t e x _ u n l o c k (& mutex2 ) == 0);
assert ( p t h r e a d _ m u t e x _ u n l o c k (& mutex1 ) == 0);
return NULL ;
}
int
main ( int argc , char * argv [])
{
pthread_t tid ;
assert ( p th re ad _m ut ex _i ni t (& mutex1 , NULL ) == 0);
assert ( p th re ad _m ut ex _i ni t (& mutex2 , NULL ) == 0);
assert ( pthread_create (& tid , NULL , thread , NULL ) == 0);
assert ( p th re ad _m ut ex _l oc k (& mutex2 ) == 0);
assert ( p th re ad _m ut ex _l oc k (& mutex1 ) == 0);
printf (" Critical section master .\ n ");
assert ( p t h r e a d _ m u t e x _ u n l o c k (& mutex1 ) == 0);
assert ( p t h r e a d _ m u t e x _ u n l o c k (& mutex2 ) == 0);
assert ( pthread_join ( tid , NULL ) == 0);
assert ( p t h r e a d _ m u t e x _ d e s t r o y (& mutex2 ) == 0);
assert ( p t h r e a d _ m u t e x _ d e s t r o y (& mutex2 ) == 0);
return 0;
}
Similarly to the previous example, let us compile the code above into its binary form example-3
and run ”ruby explorer.rb example-3”. The explorer explores a total of 6 iterations. In order
to check whether any iteration encountered an error, one can use the following command ”grep
WARNING logs/dbug-server*”. In our case the command outputs a listing similar to:
user@user - VirtualBox :~/ dbug$ grep WARNING logs / dbug - server *
logs / dbug - server -3:[...]: [ WARNING ] Encountered a concurrency error
logs / dbug - server -4:[...]: [ WARNING ] Encountered a concurrency error
The warning messages imply that during two iterations the arbiter encountered an error. In
order to investigate the error, one can look at the history file. In our example, the contents of
logs/history-3 look as follows:
1 1 1
1: p th re ad _m ut ex _i ni t : RESOURCE_CREATE :1
1 1 1
1: p th re ad _m ut ex _i ni t : RESOURCE_CREATE :2
2 2 2
2: p th re ad _m ut ex _l oc k : RESOURCE_ACCESS :2
1: p th re ad _m ut ex _l oc k : RESOURCE_ACCESS :3
1 2 2
1: p th re ad _m ut ex _l oc k : RESOURCE_ACCESS :3
2: p th re ad _m ut ex _l oc k : RESOURCE_ACCESS :2
-1 0 2
1: p th re ad _m ut ex _l oc k : RESOURCE_ACCESS :4
2: p th re ad _m ut ex _l oc k : RESOURCE_ACCESS :2
0 0 0 0 0 0 0 0:2539669330:
0 0 0 0 0 0 0 0:2454919772:
1 0 0 0 0 0 0 0:2539669330:2:
0 0 0 0 0 0 0 0:2454919772:2:
0 0 0 0 0 0 0 0:2454919772:2:
2 0 0 0 0 0 0 0:2454919772:2:
0 0 0 0 0 0 0 0:2539669330:2:
2 0 0 0 0 0 0 0:2454919772:2:
The last three lines identify the problem. At that point in the execution, no pending function
call can execute. In other words, the execution reached a deadloack. Inspecting the order in which
events happened tells us that this is the case when the thread 2 acquires the mutex1 and then the
thread 1 acquires the mutex2, creating a circular dependency.
8
Concurrent Example – Data Race
In this example, we modify the running example to introduce a data race and we illustrate how the
explorer aids us in detecting this error. The program used in this example is listed below and can
be found in /home/usr/dbug/example-4.c.
# include
# include
# include
# include
< assert .h >
< pthread .h >
< stdio .h >
< string .h >
void *
thread ( void * args )
{
char text [4] = "1:2";
printf ("% s \ n " , strtok ( text ,":"));
printf ("% s \ n " , strtok ( NULL ,":"));
return NULL ;
}
int
main ( int argc , char * argv [])
{
pthread_t tid ;
char text [4] = "1:2";
assert ( pthread_create (& tid , NULL , thread , NULL ) == 0);
printf ("% s \ n " , strtok ( text ,":"));
printf ("% s \ n " , strtok ( NULL ,":"));
assert ( pthread_join ( tid , NULL ) == 0);
return 0;
}
Similarly to the previous example, let us compile the code above into its binary form example-4
and run ”ruby explorer.rb example-4”. The explorer explores a total of 2 iterations. In order to
check whether any iteration encountered an error, one can again use the command ”grep WARNING
logs/dbug-server*”. In our case the command outputs a listing similar to:
user@user - VirtualBox :~/ dbug$ grep WARNING logs / dbug - server *
logs / dbug - server -1:[...]: [ WARNING ] Concurrent non - reentrant function calls
logs / dbug - server -2:[...]: [ WARNING ] Concurrent non - reentrant function calls
The warning messages imply that during two iterations the arbiter encountered an error. In
order to investigate the error, one can look at the history file. In our example, the contents of
logs/history-1 look as follows:
-2 2 2
1: strtok : N O N R E E N T R A N T _ F U N C T I O N :1 0 0 0 0 0 0 0 0:
2: strtok : N O N R E E N T R A N T _ F U N C T I O N :0 1 0 0 0 0 0 0 0:
The three lines identify the problem. At that point in the execution, there are two pending
function calls to a function that is not guaranteed (by standard or implementation) to be reentrant.
In other words, there is a potential data race in the program.
9
Appendix
A
Supported Library Calls
The following is a list of library calls that dBug intercepts. Some of these calls are intercepted
only for book-keeping purposes and the order in which they execute is not controlled by the centralized scheduler. For each call we include a short description of the activity that happens upon
intercepting the call. Your system and tests are free to use any other library calls. However,
the use of unsupported communication, coordination, or blocking primitives can have unexpected
consequences. In particular:
• If your system and its tests use unsupported communication and/or coordiation primitives,
dBug will not explore all possible orders in which concurrent calls to these unsupported
primitives could execute. This can result in failing to discover data races that result from
ordering events at a finer granularity than that of dBug.
• If your system and its tests use unsupported blocking primitives, the use of dBug could result
in false deadlocks. For example, consider the following scenario. There are two threads A
and B running in a distributed system. Thread A invokes a call intercepted by dBug, while
thread B invokes an unsupported blocking call. In order for the unsupported blocking call
to return, the execution of thread A needs to resume. However, this does not happen until
the arbiter receives a pending request from every thread of the system. Thus, there is now a
circular dependency as the thread A waits for the arbiter, who waits for the thread B, who
waits for the thread A.
POSIX Threads Barriers
Only the default values of barrier attributes are supported.
• pthread barrier init – Controlled by the arbiter. Upon servicing a pending call to this
routine, the arbiter creates an abstract barrier resource. This abstract resource allows arbiter
to determine when a call to pthread barrier wait would return.
• pthread barrier wait – Controlled by the arbiter. The pending calls to this routine are
postponed until the threshold specified in pthread barrier init is reached.
• pthread barrier destroy – Controlled by the arbiter. Upon servicing a pending call to this
routine, the arbiter deletes the corresponding abstract barrier resource.
POSIX Threads Conditional Variables
Only the default values of conditional variable attributes are supported.
• pthread cond init – Controlled by the arbiter. Upon servicing a pending call to this routine,
the arbiter creates an abstract conditional variable resource. This abstract resource allows
arbiter to determine when a call to pthread cond wait and pthread cond timedwait
would return.
• pthread cond wait – Controlled by the arbiter. The pending calls to this routine are
postponed until a matching signal orbroadcast event has been received.
10
• pthread cond timedwait – Controlled by the arbiter. The pending calls to this routine are
postponed until a matching signal orbroadcast event has been received or the arbiter decides
to let the call time out.
• pthread cond broadcast, pthread cond signal – Controlled by the arbiter. Upon servicing a pending call to this routine, the arbiter records this event with the corresponding
abstract conditional variable resource.
• pthread cond destroy – Controlled by the arbiter. Upon servicing a pending call to this
routine, the arbiter deletes the corresponding abstract conditional variable resource.
POSIX Threads Keys
• pthread key create – Bookkeeping only. Upon intercepting a call to this routine, the interposition layer creates an abstract key resource. This abstract resource allows the interposition
layer to determine if a call to pthread getspecific and pthread setspecific accesses an
existing key.
• pthread getspecific, pthread setspecific – Bookkeeping only. Upon intercepting a call
to this routine, the interposition layer checks if the corresponding key exists.
• pthread key delete – Bookkeeping only. Upon intercepting a call to this routine, the
interposition layer deletes the corresponding abstract key resource.
POSIX Threads Management
Only the default values of thread attributes are supported.
• pthread create – Bookkeeping only. The arbiter is notified about the creation of a new
thread.
• pthread detach, pthread exit – Bookkeeping only. The arbiter is notified about the thread
status change.
• pthread join – Controlled by the arbiter. The pending calls to this routine are postponed
until the appropriate thread becomes joinable. To this end, the arbiter collects information
about thread status changes by intercepting the above routines.
POSIX Threads Mutexes
Only the default values of mutex attributes are supported.
• pthread mutex init – Controlled by the arbiter. Upon servicing a pending call to this
routine, the arbiter creates an abstract mutex resource. This abstract resource allows arbiter
to keep track of ownership of the mutex.
• pthread mutex lock – Controlled by the arbiter. The pending calls to this routine are
postponed until the mutex becomes available.
• pthread mutex timedlock – Controlled by the arbiter. The pending calls to this routine
are postponed until the mutex becomes available or the arbiter decides to let the call time
out.
11
• pthread mutex trylock – Controlled by the arbiter. The pending calls to this routine
acquire the mutex if it is available or return failure otherwise.
• pthread mutex unlock – Controlled by the arbiter. The pending calls to this routine give
up the ownership of the mutex.
• pthread mutex destroy – Controlled by the arbiter. Upon servicing a pending call to this
routine, the arbiter deletes the corresponding abstract mutex resource.
POSIX Threads Read/Write Locks
Only the default values of read/write lock attributes are supported.
• pthread rwlock init – Controlled by the arbiter. Upon servicing a pending call to this
routine, the arbiter creates an abstract read/write lock resource. This abstract resource
allows arbiter to keep track of ownership of the lock.
• pthread rwlock rdlock – Controlled by the arbiter. The pending calls to this routine are
postponed until the lock can be shared with the calling thread.
• pthread rwlock timedrdlock – Controlled by the arbiter. The pending calls to this routine
are postponed until the lock can be shared with the calling thread or the arbiter decides to
let this call time out.
• pthread rwlock tryrdlock – Controlled by the arbiter. The pending calls to this routine
either acquire shared access to this lock if possible or return failure otherwise.
• pthread rwlock wrlock – Controlled by the arbiter. The pending calls to this routine are
postponed until the lock can be held exclusively by the calling thread.
• pthread rwlock timedwrlock Controlled by the arbiter. The pending calls to this routine
are postponed until the lock can be held exclusively by the calling thread or the arbiter decides
to let his call time out.
• pthread rwlock trywrlock – Controlled by the arbiter. The pending calls to this routine
either acquire exclusive access to this lock if possible or return failure otherwise.
• pthread rwlock unlock – Controlled by the arbiter. The pending calls to this routine give
up its access rights for the lock.
• pthread rwlock destroy – Controlled by the arbiter. Upon servicing a pending call to this
routine, the arbiter deletes the corresponding abstract read/write lock resource.
POSIX Threads Spin Locks
Only the default values of spin lock attributes are supported.
• pthread spin init – Controlled by the arbiter. Upon servicing a pending call to this routine,
the arbiter creates an abstract spin lock resource. This abstract resource allows arbiter to
keep track of ownership of the lock.
• pthread spin lock – Controlled by the arbiter. The pending calls to this routine are postponed until the lock becomes available.
12
• pthread spin trylock – Controlled by the arbiter. The pending calls to this routine acquire
the lock if it is available or return failure otherwise.
• pthread spin unlock – Controlled by the arbiter. The pending calls to this routine give up
the ownership of the mutex.
• pthread spin destroy – Controlled by the arbiter. Upon servicing a pending call to this
routine, the arbiter deletes the corresponding abstract spin lock resource.
Process Management
• execl, execlp, execle, execv, execvp, execve – Bookkeeping only. Arbiter is notified that
all threads running as part of the calling process terminate and a new thread is started.
• exit, Exit – Bookkeeping only. Normally, when a process is terminated, a destructor routine
of the interposition layer is called. The destructor routine notifies the arbiter that the calling
process terminated. However, a call to this routine bypasses this mechanism. Consequently,
upon intercepting a call to this routine, the destructor routine is triggered explicitly.
• fork – Bookkeeping only. The arbiter is notified about the creation of a new process.
• posix spawn, posix spawnp – Bookkeeping only. The arbiter is notified about the creation
of a new process.
• setpgid, setpgrp, setsid – Bookkeeping only. The arbiter is notified about the change of
process group ID.
• wait – Controlled by the arbiter. Because the wait call is potentially blocking, the arbiter
collects information from the running processes that allow the arbiter to determine when the
call can complete. This is achieved by having the interposition layer detect changes in process
status by intercepting certain function calls and signals and notifying the arbiter about these
events.
• waitpid – Controlled by the arbiter. On top of the needs of wait, the waitpid call requires
the arbiter to keep track of the process IDs and process group IDs for every process. Again,
this is achieved by having the interposition layer detect creation of new processes and changes
in process group membership and notifying the arbiter about these events.
Semaphores
Only the default values of semaphore attributes are supported.
• sem init, sem open – Controlled by the arbiter. Upon servicing a pending call to this
routine, the arbiter creates an abstract (un)named semaphore resource. This abstract resource
allows arbiter to match wait and post semaphore operations.
• sem post Controlled by the arbiter. Upon servicing a pending call to this routine, the arbiter
increases the value of the semaphore.
• sem wait Controlled by the arbiter. The pending calls to this routine are postponed until
the value of the semaphore is positive. Upon servicing a pending call to this routine, the
arbiter decreases the value of the semaphore.
13
• sem close, sem unlink – Controlled by the arbiter. Upon matching the last close operation
with an open operation, a pending unlink operation causes the arbiter deletes the corresponding abstract named semaphore resource.
• sem destroy – Controlled by the arbiter. Upon servicing a pending call to this routine, the
arbiter deletes the corresponding abstract unnamed semaphore resource.
Memory Management
• calloc, free, malloc, realloc – Bookkeeping only. The interposition layer keeps track of
(re)allocated pointers. This is used to check that each allocated pointer is freed exactly once
and no other pointer is attempted to be freed4 .
Non-reentrant Functions
Certain functions are not required to be reentrant by the POSIX standard. Consequently, the arbiter controls the order in which they execute and issues a warning if multiple threads of the same
process try to concurrently execute the same non-reentrant function. The list of non-reentrant
functions controlled by the arbiter includes: gethostbyname, gethostbyaddr, strtok, and
inet ntoa.
Miscellaneous
Certain library calls are used by dBug internally. In order to avoid introducing false positives,
dBug needs to intercept calls to the following list of functions: getaddrinfo, freeaddrinfo.
4
For much more thorough testing of the use of dynamic memory we recommend using the Valgrind tool.
14