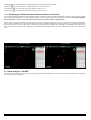
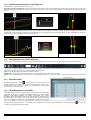
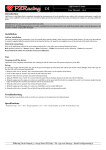
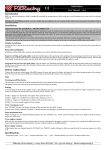
1
RacePro v2.0
User Manual - v1.0 – 22/09/2015
Indice
1 – Introduction......................................................................................................................................................................................................................... 1
1.1 – Compatibility.............................................................................................................................................................................................................. 1
2 – Installation.......................................................................................................................................................................................................................... 1
3 – User interface...................................................................................................................................................................................................................... 1
3.1 – Pulsanti “Header Bar”................................................................................................................................................................................................ 2
3.2 – Main interface........................................................................................................................................................................................................... 2
4 – Setup................................................................................................................................................................................................................................... 3
4.1 – Setup menu options .................................................................................................................................................................................................. 3
4.2 – Mathematical channels............................................................................................................................................................................................. 5
4.3 – Managing a CONFIG.CFG setting file....................................................................................................................................................................... 5
5 – Managing a new track file, *.TRK....................................................................................................................................................................................... 5
5.1 – Creating a new .TRK file (new track file) .................................................................................................................................................................. 6
5.2 – Modify and existing .TRK file.................................................................................................................................................................................... 7
6 – Opening a *.SES file........................................................................................................................................................................................................... 7
7 – Analysis on the map “TRACK”........................................................................................................................................................................................... 7
7.1 – Circuit Map controls.................................................................................................................................................................................................. 8
7.2 – Modifying the finish line/intermediate markers of a session.................................................................................................................................... 9
8 – Data analysis “CHART”...................................................................................................................................................................................................... 9
8.1 – Keyboard controls and short cuts on diagrams....................................................................................................................................................... 10
8.2 – Positioning the marker on the diagram................................................................................................................................................................... 11
8.3 – Changing the base of the diagrams.......................................................................................................................................................................... 11
8.4 – Min/Max table......................................................................................................................................................................................................... 11
8.5 – Stoichiometric ratio table......................................................................................................................................................................................... 11
8.6 – Analysis of the difference between two points......................................................................................................................................................... 12
9 – Analysis of a whole session............................................................................................................................................................................................... 13
10 – Esportazione dei dati per software RaceRender.............................................................................................................................................................. 14
1 – Introduction
RacePro is the data analysis software of the brand new dataloggers of PZRacing. With RacePro you can view all the data stored by the device, such as
GPS coordinates or the values of the various optional analogue or digital inputs which are connected to the device.
1.1 – Compatibility
RacePro has been developed for Windows operating systems (XP or following) and requires at least Framework 4.0 to work. Microsoft operating
systems already have Framework; only if you are using Windows XP and haven't installed it yet, you will need to download Framework from Microsoft's
website.
RacePro can also be used with other operating systems (Linux, Macintosh, etc.) but you will need to install a virtual machine with a compatible Windows
version.
RacePro features an easy and intuitive full screen user interface which allows you to use it also on modern tablets with a Windows 8 operating system
2 – Installation
Download the RacePro software from www.pzracing.it and extract the files from RacePro.zip in any folder of your PC. Double click on the executable file
RacePro.exe; you will be required to select your language for the installation procedure, select it from the drop-down list and click "OK".
The guided setup will run. Simply follow the instructions on the screen to install the software.
At the end of the procedure (if the option "create a desktop icon" was ticked) the relative icon will be created on the desktop
; to open the
software, double click on the icon.
3 – User interface
PZRacing Via de Gasperi 5 – 61032 Fano (PU) Italy - Tel: +39 0721 820434 – Email: [email protected]
As previously mentioned, RacePro was developed in full screen mode; this means that
Windows will not show the taskbar at the bottom of the page. This mode, besides
allowing us to develop a more catchy design, also gives the chance to take advantage of
the full screen size and allows the user to view data on a wider surface. The full screen
mode is necessary for Windows 8 tablet compatibility.
To go back to the desktop view or to switch to another software, press the "Alt" and
"Tab" keys together and select the program you wish to switch to.
3.1 – Pulsanti “Header Bar”
Starting from the top on the initial page you will find the buttons bar which, as we will see later on, will remain the same for every screen while the
buttons will activate/deactivate based on the choices made by the user.
CLOSE - This button closes the program; by clicking on it a confirmation window will pop up
IMPORT - Opens the selection window to import a new session
TRACK - Switches to the circuit and GPS coordinates view mode
CHART - Switches to the diagrams view mode
ITALIAN FLAG - Switches the language to Italian; it is only visible when the language is set to English
ENGLISH FLAG - Switches the language to English; it is only visible when the language is set to Italian
SETUP - Opens the set up window of the session; it is visible only when no more than one session is open
INFO - Opens the RacePro software info page (copyright, version, etc.)
3.2 – Main interface
Under the button bar there is the central part of the interface where you can find the three main selection buttons and the news section.
WELCOME: the section including the main news published on our website is on the left; the news will be loaded directly in Italian or English depending
on the selected language.
TRACK - Enters the circuit and GPS coordinates view mode
PZRacing Via de Gasperi 5 – 61032 Fano (PU) Italy - Tel: +39 0721 820434 – Email: [email protected]
CHART - Enters the diagrams view mode
LOAD SESSION: To load a new file
PZRACING: opens the default browser and accesses our website www.pzracing.it
4 – Setup
To enter the setup window, press the relative button on
any screen of the software and the following pop up
window will appear:
Please note: .SES files can be opened with any
text editor; as they follow very precise
formatting options and rules, they must not be
manually modified as you may damage or
corrupt them permanently. Always use the
RacePro software for any changes.
4.1 – Setup menu options
This section lists and explains all the options which can be found in the setup menu of the program.
Please note: when the text box or the drop-down list is grey, the box cannot be selected as that size has a default setting which
cannot be modified.
Driver name: name of the driver
Vehicle name: name of the vehicle
Notes: notes on the current session (visible only if a session is open)
Basic: tab which moves the screen from one of the four basic measurements to another of the device
Digital: tab which switches the screen to the digital channels
Analogic: tab which switches the screen to the analogue channels
Math: tab which switches the screen to the mathematical channels
Basic
Digital
PZRacing Via de Gasperi 5 – 61032 Fano (PU) Italy - Tel: +39 0721 820434 – Email: [email protected]
Analogic
Mathematical
SENSOR: drop-down list to choose one of the default sensors. If you are using PZRacing's sensors, when you select an option on this list your sensor will
be automatically configured (use the sensor instructions as a reference). If you wish to use another sensor, select GENERAL.
NAME: name of the size
XA: the minimum value sampled by the device which corresponds to the minimum voltage range of the sensor. The device sampling can go from "0", i.e.
0 Volts, to a maximum of 1023 which corresponds to 5V; you can discover the XA minimum value to set by executing a simple conversion =
(1023*Vmin)/5. For example, if the range of your sensor is 0,5V-4,5V, you will have to set 102,3 as XA value.
XB: the maximum value sampled by the device which corresponds to the maximum voltage range of the sensor. The device sampling can go from "0", i.e.
0 Volts, to a maximum of 1023 which corresponds to 5V; you can discover the XB value to set by executing a simple conversion = (1023*Vmax)/5. For
example, if the range of your sensor is 0,5V-4,5V, you will have to set 920,7 as XB value.
YA: the value on the diagram scale which corresponds to the minimum sampled XA. For example, the lambda probe has a tension range from 0.5V and
an output range from 0,7-1,3Δ, therefore XA=0 and YA=0.7.
YB: the value on the diagram scale which corresponds to the maximum sampled XB. For example, the lambda probe has a tension range from 0.5V and
an output range from 0,7-1,3Δ, therefore XB=0 and YB=1.3.
Please note: only whole numbers from 0 to 1023 can be inserted in the XA and XB text boxes. Figures with five whole numbers and
one decimal can be inserted in the YA and YB text boxes.
FILTER: value of the filter. The filter allows to modify the "pointiness" of the diagrams by setting a value from "0" (deactivated) to "9". The higher the
number, the more the diagram will be "smoothed". The filter can also be used to "clean" any external obstacle and to remove irregular diagram peaks.
TYPE: measurement units, being diverse, are grouped by sensor type. Therefore, by choosing the sensor type, the units of measurement of that sensor
will appear.
UNIT: choice of the units of measurement to be viewed.
CHART MIN: minimum value set for the diagram scale.
CHART MAX: maximum value set for the diagram scale.
AUTO SCALE DOWN: sets the auto scale function for the minimum threshold of the diagram, i.e. the diagram will start from the minimum value the
device has measured for that parameter. If it is active, it inhibits the value set on CHART MIN
AUTO SCALE UP: sets the auto scale function for the maximum threshold of the diagram, i.e. the diagram will start from the maximum value the device
measured for that parameter. It if is active, it inhibits the value set on CHART MAX
CIRC (only for SPEED 1 and 2): sets the circumference of the wheel in millimetres. To calculate the circumference we suggest you measure the rolling of
the wheel on an even surface.
PULSE (only for SPEED 1 and 2): sets the number of pulses measured by the sensor at each turn of the wheel. If a wheel sensor is used, set the number
of bolts measured by the sensor (usually the ones of the disc brake).
PZRacing Via de Gasperi 5 – 61032 Fano (PU) Italy - Tel: +39 0721 820434 – Email: [email protected]
4.2 – Mathematical channels
RacePro also allows the management of three predefined mathematical channels:
- n°2 derivative of an analog channel
- Difference from the two speed signals
For setting the derivative ("d1 / dt" and d2 / dt) from the CHANNEL drop-down list select the channel you want derive (such as a suspension) and set
the name to assign to the new channel in the text box NAME. For setting the channel DELTA SPEED simply select from the CHANNEL drop -down list if
you want the difference SPEED1-SPEED2 or the opposite, and name the new channel.
By clicking Save button mathemaical channels will be saved automatically; the settings are associated with the name of the driver Driver Name and the
name of the vehicle Vehicle Name, so every time you open a session with those two names will load the corresponding mathematical channel settings
associated.
Saving mathematical channels three new additional channels will be automatically created in the CHART section that will be identified with the name
set in the Name textbox (in this example VEL FORC, VEL MONO, DS)
4.3 – Managing a CONFIG.CFG setting file
As explained in your Start device instructions, the CONFIG.CFG file stores all the settings which will later be stored also in each session file (*.SES);
therefore, all the information stored in CONFIG.CFG is also stored in each session file so that the RacePro software can recognize the settings of the
various analogue and digital channels, as well as the name of the pilot and the vehicle. This peculiar characteristic allows to view a session file on any
computer which has our software installed without having to save or export your settings, as all the information is already contained in the file itself.
There are 3 different ways to create a CONFIG.CFG file:
FIRST USE: the first time you use RacePro together with Start you will have to set up the device from scratch. Open the setup menu, manually set all the
parameters, click EXPORT and select the CONFIG folder in your Start device; if the file already exists in the folder, you will have to overwrite it.
MODIFYING AN EXISTING FILE: you can modify and save the CONFIG.CFG file you are currently using. Open the setup menu, click OPEN and select
the configuration file inside the CONFIG folder of your Start device. Now you can modify any setting. When you're done, click SAVE.
EXPORTING FROM A SESSION FILE: you can create a CONFIG.CFG file extrapolating the configuration of a session file which has already been stored.
Open the setup menu, click OPEN and select the .SES file you wish to open. Now you can export the configuration of this file by clicking EXPORT and
selecting the CONFIG folder inside your Start device
5 – Managing a new track file, *.TRK
The new Start Next and Start Basic include a global tracks database stored in their memory, however you can always add a new track by exporting it
from the RacePro map.
To access the .TRK files management section press the TRACK button on the home screen without loading any session file, you will see the following
screen:
PZRacing Via de Gasperi 5 – 61032 Fano (PU) Italy - Tel: +39 0721 820434 – Email: [email protected]
As you can see, there are new active buttons on the Header Bar of this screen. They are:
FINISH LINE - Sets the finish line flag
SPLIT 1 - Sets first intermediate marker
SPLIT 2 - Sets the second intermediate marker
SPLIT 3 - Sets the third intermediate marker
CONFIRM - Confirms the position of the markers on the track
ABORT - Aborts the position of the markers on the track
OPEN – Open an existing track file
EXPORT - Exports the coordinates of the finish line and selected intermediate markers
5.1 – Creating a new .TRK file (new track file)
1 - Access the .TRK files management section
2 - Place the map on the circuit of which you want to store the coordinates using the search toolbar on the top right of the screen. You can move the map
by holding the left button down and moving the mouse. Moreover, you can modify the zoom level by rotating the mouse wheel or using the + and buttons on the top left of the map.
3 - Now you can place the finish line by holding the FL button and positioning the flag where you wish to locate the finish line; to confirm the
position click the right button of the mouse. If you do not wish to set intermediate markers, go directly to paragraph 7.
4 - Press S1 and place the first intermediate marker. Go directly to paragraph 7 if you do not wish to set other intermediate markers.
5 - Press S2 and place the second intermediate marker. Go directly to paragraph 7 if you do not wish to set other intermediate markers.
6 - Press S3 and place the third intermediate markers.
7 – Press the CONFIRM button to confirm the finish/intermediates positions.
PZRacing Via de Gasperi 5 – 61032 Fano (PU) Italy - Tel: +39 0721 820434 – Email: [email protected]
8 - Press the EXPORT button.
9 - Insert the name of the circuit in the text box and press YES.
10 - Select the TRACK folder in your Start device and click OK. You will then view a confirmation message.
5.2 – Modify and existing .TRK file
1 - Access the .TRK files management section
2 - Press the OPEN button and select the .TRK file you want to edit browsing your PC or in the "TRACK" folder of the product.
3 - Now you can place the finish line by holding the FL button and positioning the flag where you wish to locate the finish line; to confirm the
position click the right button of the mouse. If you do not wish to set intermediate markers, go directly to paragraph 7.
4 - Press S1 and place the first intermediate marker. Go directly to paragraph 7 if you do not wish to set other intermediate markers.
5 - Press S2 and place the second intermediate marker. Go directly to paragraph 7 if you do not wish to set other intermediate markers.
6 - Press S3 and place the third intermediate markers.
7 – Press the CONFIRM button to confirm the finish/intermediates positions.
8 - Press the EXPORT button, the file opened will be overwrittin with the new informations.
6 – Opening a *.SES file
As previously mentioned, all the information and settings are stored in the device, therefore opening a *.SES file is a very simple operation as you don't
need to load any setting or associate any file.
1 - Open the RacePro software
2 - Click the Load Session button on the main screen
3 - Select the *-SES file and click OPEN
4 - Now you will have to choose if you wish to analyse your data from the diagrams or the circuit. Depending on the button you press, you will view one
of the following screens:
CIRCUITO
GRAFICI
7 – Analysis on the map “TRACK”
In the previous paragraph we saw how to open a file and how to access the two different analysis areas of the software. Now we will analyse all the
elements of the "TRACK" area.
Firstly, we will illustrate some elements of the Header Bar which we haven't yet considered:
GRID - enables and disables the grid function on the map. When the grid is enabled, you will view its scale which can be
modified with the adjacent arrows.
PZRacing Via de Gasperi 5 – 61032 Fano (PU) Italy - Tel: +39 0721 820434 – Email: [email protected]
MAP - By sequentially pressing the MAP button you can choose the real mapping as follows: GOOGLE MAPS / BING / MAP OFF. An
Internet connection is required to view the maps.
Streets
STREETS - By selecting this box you will view the names of streets and cities on the map
LAT
LATITUDE - Latitude of the position of the mouse pointer (expressed in decimal degrees)
LONG
LONGITUDE - Longitude of the position of the mouse pointer (expressed in decimal degrees)
The right column contains the selection grid of lap times and a table with the statistics regarding the selected laps.
Starting from the top and analysing all the information, here's what we find:
- Closing session button
- The “info” icon
; by placing your mouse on the icon you will view all the information regarding your
session (name of the pilot, vehicle and notes)
- Start date and time of the session storage
- The "SESSION" button which opens the whole session view (see following paragraphs)
- The "REF" selection box which, as we will see, selects the reference session if more than one session is
open.
- The timing grid; by ticking the boxes next to the lap number in the "Lap" column you can
select/deselect the timing on the chosen lap. The timing grid also offers partial times if the selected track
for the current session has set the split time coordinates and indicates the “best lap” of the session as a
red helmet on the right of the line.
Remember that you can select and analyse up to 3 laps at the same time, even from different
sessions. The first selected lap will become red, the second one green and the third one yellow. If you
wish to import a second session through the IMPORT button on the Header Bar, this will be loaded
under the current one; you can scroll down and view also the full second session through the lateral
scrollbar.
Under the timing grid, the statistics table shows the value of all the measurements on the point selected
on the map. Here are all the measurements that will be shown:
Time: time passed from the beginning of the lap
Speed GPS: the speed measured by the GPS
Latitude: latitude
Longitude: longitude
Acc X: acceleration on the X axis (from the internal accelerometer)
Acc Y: acceleration on the Y axis (from the internal accelerometer)
Acc Z: acceleration on the Z axis (from the internal accelerometer)
Direction: direction angle
Battery: internal battery voltage
Power: external battery voltage (if applicable)
RPM: revolutions per minute
H2O temp: water temperature
Speed 1: speed 1
Speed 2: speed 2
Gear: gear inserted
Analog 1-8: Analogues from number 1 to number 8
The column on the right is always present also in the DIAGRAMS analysis; you can reduce it to have a wider work area by pressing the green division
line. This way the column will be reduced to a single green line on the right edge of the screen; by pressing it again, it will go back to its initial size.
7.1 – Circuit Map controls
On the central part of the screen you will find the map drawn by the GPS
coordinates which were measured by the device; by uniting the points, you will see
the trajectory of the vehicle. Thanks to the high frequency of our GPS receiver, the
drawn trajectory will be very precise and accurate.
Let's see how to carry out the analysis and which operations can be executed:
Left mouse button: you can move the map by holding the left button down and
moving your mouse
Right mouse button: by holding the right button down you will place the pointer
on the sampled point (a point on the trajectory) which is closest to your mouse
Mouse wheel: allows to zoom in and out
Arrow buttons (on the top right of the screen): alignment buttons between
the map and trajectory. Because of their offset, Google Maps and Bing maps do not
always match real coordinates; you can correct this offset by slightly moving the
trajectories.
Play button
: starts the simultaneous scrolling of all cursors at the same speed allowing a comparison between more laps
PZRacing Via de Gasperi 5 – 61032 Fano (PU) Italy - Tel: +39 0721 820434 – Email: [email protected]
Stop button
: stops the simultaneous scrolling and brings back all cursors to the chequered flag
Pause button
: stops the simultaneous scrolling leaving the cursors where they are
Forward button
: moves the pointers forward 5 samples at a time (0,1sec)
Reward button
: moves the pointers backwards 5 samples at a time (0,1sec)
7.2 – Modifying the finish line/intermediate markers of a session
As previously explained, the finish lines and intermediate marker coordinates are stored by the device inside the session file; it is also possible to modify
the coordinates of the finish line or to modify/add the coordinates of an intermediate marker through the RacePro software. The changes applied to
these coordinates are not saved on the session file, therefore you will lose them by closing the file.
The procedure to modify the split time and/or finish line is the same as creating a new track (see par. 5), so you just need to press the FINISH LINE,
SPLIT 1, SPLIT 2 and SPLIT 3 icons on the Header Bar, place the flags by clicking the right button on the map (in this case you should pay attention to
place the end of the flag exactly on the trajectory, always trying to place the flags on straight roads) and finally press CONFIRM. The result will be as
shown in the following two images. The second image will show the intermediate marker icons on the map, while the table will show the 3 intermediate
times.
SENZA INTERMEDI
TRE INTERMEDI
8 – Data analysis “CHART”
You can access the diagram data analysis at any moment by pressing the DIAGRAMS button on the main screen or the CHART button on the Header
Bar. The following screen will appear:
PZRacing Via de Gasperi 5 – 61032 Fano (PU) Italy - Tel: +39 0721 820434 – Email: [email protected]
You can immediately notice the column on the right with the timing table which is also present in the MAP section and, besides giving information, it is
also used to select/deselect the laps to analyse. Below, instead of the STATISTICS table, there is the circuit map with the position cursor; the map
features are the same of its specific section.
On the right part of the screen there are the diagrams which will be used for the analysis, below which are placed all the available channels and a text
box;
Next to each channel there is a ticking box which enables/disables the viewing of the relative diagram. The lateral text box includes the value on the X
axis corresponding to the marker (the vertical positioning bar); this value can be expressed in seconds if the diagram view refers to time, or in
meters/miles if the view refers to space (see following paragraphs).
8.1 – Keyboard controls and short cuts on diagrams
Mouse wheel: allows to zoom in/out the diagram
PGUP and PGDOWN button on the keyboard: to zoom in/out on the diagram
(like the mouse wheel)
Right mouse button: places the marker where the mouse pointer is located
Left mouse button: you can move the diagram to the left/right by holding the left
button down and moving your mouse
SX and DX arrows on the keyboard: same function of the left button of the
mouse
UP and DOWN arrow on the keyboard: moves the cursor up and down one
sample at a time
F1 button: import a new session
F2 button: move to MAP section
F3 button: move to CHART section
F5, F6, F7, F8 buttons: create a group of channels the will be displayed in the same position; this function allows a quick recall of a series of channels
that normally are analyzed together. To store a group press simultaneously CTRL and one of the buttons (F5, F6, F7, F8), to recall the group just press
the button.
Left of the diagrams, the name of the measurement shown and its relative unit of measurement on the Y axis are always indicated, while the right shows
the value of the channel on the point where the marker is placed; this value is the same colour as the lap so that it can be distinguished if more laps are
viewed at the same time.
PZRacing Via de Gasperi 5 – 61032 Fano (PU) Italy - Tel: +39 0721 820434 – Email: [email protected]
8.2 – Positioning the marker on the diagram
The marker can be placed on the diagram in two ways:
Selecting a point on the diagram: in this case the marker will be white, as well as the box indicating the time/space at the bottom of the screen, and
the cursor will appear on the map on the right (or more than one cursor if more laps are selected, as in this case) on the point the marker on the diagram
refers to.
Selecting a point on the map: in this case, the cursors on the map will be placed on the selected point, the marker (or markers if more laps are
selected) will be placed on the point the cursor on the diagram refers to and will be of the same colour as the lap, as well as the time/space box at the
bottom (if there are more laps there will be more than one box).
8.3 – Changing the base of the diagrams
You can choose to view the diagrams based on space or time through the drop-down list on the Header Bar when entering the CHARTS section:
You can choose to view the diagrams based on space or time through the drop-down list on the Header Bar when entering the DIAGRAMS section:
By clicking on the drop-down list you can select one of the following options:
Time: to view the diagrams based on the time which has passed
Speed GPS: views the diagrams based on the distance covered measured by the GPS (always available)
Speed 1: views the diagrams based on the distance covered measured by Speed 1 (it is necessary to have a speed signal connected to the Box Expander
2)
8.4 – Min/Max table
By clicking the “Min-Max” button
on the “Header Bar” you can access the table
that show all the minimum and maximum values detected during the entire session.
The table allows you to detect at a glance any abnormalities as a high engine
temperature or too high engine revs.
8.5 – Stoichiometric ratio table
The stoichiometric ratio table (air/fuel ratio) is an important tool for the optimal
carburation of the vehicle. Through this configurable table it is possible to input
different engine RPM (revolutions per minute) and throttle valve opening
thresholds, thereby obtaining the exact air/fuel ratio detected in a specific range by
the lambda probe. ECU (engine control unit) management software applications
often work with different ranges, that’s why being able to set different values on the
X and Y axis enables you to have a table comparable to the one in your engine
management software and, therefore, to be quicker in the modifications. You can access the stoichiometric table by pressing the
“Header Bar”. The following table will appear:
button on the
PZRacing Via de Gasperi 5 – 61032 Fano (PU) Italy - Tel: +39 0721 820434 – Email: [email protected]
Firstly, you will need to set the right channels for the TPS (throttle position sensor) and the lambda probe. Therefore, in the top right “Lambda channel”
drop-down list, you will need to select the channel in which the lambda probe is, while in the “TPS channel” drop-down list you will need to select the
throttle valve channel.
Secondly, you will need to set the ranges. You can add a new RPM range by typing the desired number in the text box under the “Add RPM” button (for
example, 15000) and then pressing the “Add RPM” button. A row with the set value will be created. The same applies for inputting a column with a TPS
value.
You can delete a row/column by selecting the desired value on the row/column and then pressing “Delete RPM” or “Delete TPS” depending on whether
you want to delete a row or a column.
Once you set your grid, press the bottom right “Calculate” button. The values detected by the lambda probe will be displayed in the cells in those
particular RPM and TPS ranges.
8.6 – Analysis of the difference between two points
A tool that enables you to reveal the difference between two user-selected points is available for carrying out an analysis on the graph trend. Press the
“analysis” button
to start the analysis between two points, position the mouse on the first point on the graph and right click once. A light blue
marker pinpointing the X1 point on the x-axis will be positioned. Then, position the mouse on the second point and right click again. A purple marker
pinpointing the X2 point on the x-axis will be positioned.
Along with the markers, a new x-axis values viewing area will be created on the “Header Bar”. The markers’ time or metres-based values (X1 and X2) and
their difference (ΔX) will be displayed here.
Moreover, new data viewing areas will be created on each graph. Here, the two markers’ y-axis values (Y1 and Y2) and their differences ( ΔX) will be
displayed.
PZRacing Via de Gasperi 5 – 61032 Fano (PU) Italy - Tel: +39 0721 820434 – Email: [email protected]
Inoltre verranno create delle nuove aree di visualizzazione dati su ogni grafico dove verranno
visualizzati i valori sull'asse Y dei due marker (Y1 e Y2) e le loro differenze (ΔY).
9 – Analysis of a whole session
As previously mentioned, the "SESSION" button above the timing table allows to analyse the whole
session as if it were a single lap. This function allows to check the pace of the various channels during
the whole session and quickly verify any anomalies without having to look for them in each lap.
By clicking on "SESSION", you will disable the lap selection on the timing table; in the MAP section you will view the GPS coordinates from the
beginning to the end of the session and the position of the cursor on the map will be disabled, while in the DIAGRAM section a new time line will appear,
indicating which part of the session you are analysing, and each channel will be assigned a default colour.
The SESSION mode shows the diagrams in two different modalities; you can choose which one to view by changing the settings on the Header Bar:
Separated diagrams: each channel has its own diagram like in the single laps view mode
PZRacing Via de Gasperi 5 – 61032 Fano (PU) Italy - Tel: +39 0721 820434 – Email: [email protected]
Single diagram: all the channels are featured in one diagram
10 – Esportazione dei dati per software RaceRender
All data stored by the device can be used on RaceRender software to create videos with data overlay. To export data just load the session, enter the
section CHART and select "make a .prr file" button
, set the name and click save button.
The file is a .PRR that can be loaded into the software RaceRender PZRacing edition.
PZRacing Via de Gasperi 5 – 61032 Fano (PU) Italy - Tel: +39 0721 820434 – Email: [email protected]