1
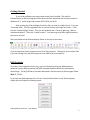
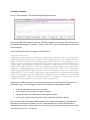
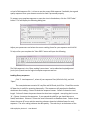
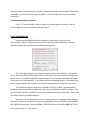
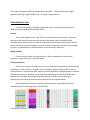
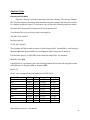
XLibraryDisplay
Version 2
User Manual
Ryan Stafford
December 2015
XLibraryDisplay Version 2 - User Manual
1
Table of Contents
General Overview_________________________________________________________________________________4
Getting Started_____________________________________________________________________________________5
DNA Analysis_______________________________________________________________________________________5
Creating a template _________________________________________________________________________6
Loading library sequences_________________________________________________________________7
Trimming sequences_______________________________________________________________________8
Filtering sequences_________________________________________________________________________8
Translating and aligning sequences_______________________________________________________9
Protein Alignment ________________________________________________________________________________9
Dataset Preparation_____________________________________________________________________________10
Right-click menu___________________________________________________________________________10
Manually marking library positions______________________________________________________10
Visualization Tools______________________________________________________________________________11
Sorting clones______________________________________________________________________________11
Hiding columns_____________________________________________________________________________11
Coloring sequences_________________________________________________________________________11
Analysis Tools____________________________________________________________________________________12
Entering activity data_____________________________________________________________________12
Correlating sequences to activity data__________________________________________________13
Excluding sequences based on activity data____________________________________________13
Picking unique leads based on activity data____________________________________________13
Weblogo analysis_________________________________________________________________________13
XLibraryDisplay Version 2 - User Manual
2
Align to structure_________________________________________________________________________14
Export a PyMOL script____________________________________________________________________14
XLibraryDisplay Version 2 - User Manual
3
General Overview
Thanks for downloading and using XLibraryDisplay – and – actually reading the user manual!
Hopefully the program is so intuitive that you do not actually need to read this.
What is XLibraryDisplay?
XLibraryDisplay is a program that helps scientists analyze sequences and experimental data for
protein engineering projects. It can also be used for routine cloning analysis or as a tool for
aligning and annotating protein sequences.
Why did you write XLibraryDisplay?
We were unable to find a program to help us efficiently analyze all the DNA sequences we
collected during our antibody and enzyme engineering projects and correlate them with
experimental data.
What’s new in version 2?
XLibraryDisplay now sports a colorful custom ribbon interface which makes sequence analysis
easier and reduces screen clutter. Many other analysis tools have been added too.
Why are there features not described in the manual?
The manual is intended to get you started. Updates to the program are also more frequent
than updates to the manual. Please email [email protected] if you have questions
about a particular feature.
Will XLibraryDisplay run on my Mac?
No, sorry. Maybe someday I will modify the code to work on a Mac.
How much does XLibraryDisplay cost?
XLibraryDisplay is free.
Where can I get XLibraryDisplay?
http://sourceforge.net/projects/XLibraryDisplay/
Where do I report bugs or offer suggestions?
Please email [email protected]. This is very helpful and sincerely appreciated.
XLibraryDisplay Version 2 - User Manual
4
Getting Started
To run XLibraryDisplay you simply need to have Excel installed. The code for
XLibraryDisplay is directly integrated into a Microsoft Excel workbook and has been tested on
Windows XP, 7, and 8 using Excel versions 2007, 2010, and 2013.
After opening the XLibraryDisplay Excel xlsm file you need to enable macros. If you see
“Protected View… This file originated from an Internet location and might be unsafe….” then
click the “Enable Editing” button. Then you will probably see a “Security Warning… Macros
have been disabled”. Then click “Enable content”. Your warnings may differ slightly based on
the version of Excel.
Now you should see the XLibraryDisplay ribbon on the top of the screen:
If you already have protein sequences then click ‘Align proteins’. Otherwise, click ‘Analyze DNA’
if you are starting from raw DNA sequences that need to be processed first.
DNA Analysis
If you don’t have a dataset of your own, you can follow along using the Methanococcus
jannaschii tyrosyl tRNA synthetase (MjTyrRS) example dataset available for download on
SourceForge. The MjTyrRS library has been described in Zimmerman et al, Bioconjugate Chem.
2014 25, 351-61.
To process raw DNA sequences first click the ‘Analyze DNA’ button on the XLibraryDisplay
ribbon which will open the following menu:
XLibraryDisplay Version 2 - User Manual
5
Creating a template
Click “1. Enter template” and the following dialog box will open:
The example MjTyrRS dataset includes an ‘MjTyrRS-template-truncated.txt’ file which you can
load into the box using the “Load file…” button. Click “OK” to use the DNA sequence in the box
as the template.
Here’s the MjTyrRS example template in FASTA format:
>MjTyrRS-truncated
atggatgaatttgaaatgattaaacgcaacaccagcgaaattattagcgaagaagaactgcgcgaagtgc
tgaaaaaagatgaaaaaagcgcgtacattggctttgaaccgagcggcaaaattcatctgggccattatct
gcagattaaaaaaatgattgatctgcagaacgcgggctttgatattattattctgctggcggatctgcat
gcgtatctgaaccagaaaggcgaactggatgaaattcgcaaaattggcgattataacaaaaaagtgtttg
aagcgatgggcctgaaagcgaaatatgtgtatggcagcgaatttcagctggataaagattataccctgaa
cgtgtatcgcctggcgctgaaaaccaccctgaaacgcgcgcgccgcagcatggaactgattgcgcgcgaa
gatgaaaacccgaaagtggcggaagtgatttatccgattatgcaggtgaacgacatccattatctcggcg
tggatgtggcggtgggcggcatggaacagcgcaaaattcacatgctggcgcgcgaactgctgccgaaaaa
agtggtgtgcattcataacccggtgctgaccggcctggatggcgaaggcaaaatgagcagcagcaaaggc
aactttattgcggtggatgatagcccggaagaaattcgcgcgaaaattaaaaaagcgtattgcccggcgg
gcgtggtggaaggcaacccgattatggaaattgcgaaatattttctggaatatccgctgaccattaaacg
cccggaaaaatttggcggcgatctgaccgtgaacagctatgaagaactg
Please note the DNA template is a critical component used as a reference for the majority of
the analysis steps. For the program to work as intended your DNA template should:
•
•
•
•
be in the reading frame you want to analyze
cover the part of the protein you want to analyze
include only the most reliable part of the sequencing data
have 5’ and 3’ ends that are found in all your sequences (default is 20 bps)
You can make your own template DNA sequence file outside of the program using Microsoft
Notepad or your favorite text editor, but it is recommended you use the tools available in
XLibraryDisplay to help. Simply copy (ctrl+c) and paste (ctrl+v) your DNA sequence into the box
XLibraryDisplay Version 2 - User Manual
6
or load a DNA sequence file. It is best to use the parent DNA sequence if available, but a good
quality sequence from your dataset can also be used if processed properly.
To prepare your template sequence to meet the criteria listed above, click the “ORF Finder”
button. This will display the following dialog box:
Adjust your parameters and select the correct reading frame for your sequence and click OK.
To help refine your template the “View ORFs” button will open the following:
The DNA sequence in the ‘Open reading frame viewer’ can be edited and copied/pasted
(ctrl+c/ctrl+v) back into the original template sequence text box.
Loading library sequences
Click “2. Load sequences”, select all your sequence files (shift+left-click), and click
“Open”.
The example dataset contains 96 .seq files and 96 Phred .phd.1 files. Phred files contain
QC data that is useful for assessing data quality. The sequences will populate the RawData
worksheet after loading. Column A shows the sequence names. Column 2 shows the read
length. Column 3 shows the percent bases that have been assigned – everything that’s not an
‘N’. Column 4 contains the sequences. If you opened the phd files you should also see a
RawQC worksheet. Columns 1-3 have the same information as RawData sheet. Column 4 now
shows the mean QC score and the remaining columns show the individual bases for each
sequence. The color coding indicates the data quality. The color key is at the bottom of the
XLibraryDisplay Version 2 - User Manual
7
RawQC sheet. Sequences on the RawData and RawQC sheets are never modified by the
program.
Trimming Sequences
Click “3. Trim sequences” and “OK” to trim using the default parameters.
The TrimmedDNA worksheet shows your sequence names again in column A. Column B
and C tell you if the 5’ and 3’ end of each sequence is “OK”, i.e. if they match the template.
Column D tells you if the trimmed sequence length is not divisible by 3 suggesting there is a
frameshift. Column E reports how many assigned bases (everything not an N) are in your
trimmed sequence. Column F shows the trimmed sequence lengths. And Column G shows the
trimmed sequences. You can adjust the “match length” and the “match required to trim”. For
example, if the match length is 20 and and the match required to trim is 18, then 18 of 20 bases
need to match on the 5’ or 3’ end of the template to trim your sequence. If you experience
trouble with trimming, you probably should consider changing your template before adjusting
the trimming parameters.
If you loaded phred phd files you will see a TrimmedQC sheet. New information
includes the mean QC score for the trimmed sequence and the total internal bad bases, i.e.
bases with low QC scores in the middle of otherwise good data. Column G shows the program’s
attempt at classifying the sequences as either “bad data”, “mixed”, “no match, but OK”, “not
clear”, and “OK”. You should probably be wary of all sequences not marked “OK” or “no match,
but OK” as there might be base miscalls or other issues – so you ought to check their
chromatograms if you want to be certain about their sequence. Please note that the “mixed”
classification is only about 50-60% accurate, but you can usually get a good idea if a sequence is
mixed by looking at the colored DNA sequences.
Filtering sequences
Click “4. Filter sequences” and click OK to use the default parameters to remove all
sequences that do not match your template.
The example dataset will transfer A06, G06, and E12 to the BadDNA sheet as they show
no match to the 5’ and 3’ end of the template, i.e. “5’ BAD” and “3’ BAD”.
Sequences that pass the filters are copied to the “GoodDNA” worksheet and those that
don’t are passed to the “BadDNA” worksheet. The default parameters are meant to be
permissive, so that nothing is excluded that shows any match to your template. Specifically, if
the sequence shows “5’ OK” or “3’ OK” it will be transferred to the “GoodDNA” worksheet. You
can also remove sequences that appear to have frameshifts, have unassigned bases (Ns), or
XLibraryDisplay Version 2 - User Manual
8
that are smaller or larger than your template. Advanced parameters are available if Phred files
are loaded. For the first pass through the dataset, it usually makes sense to use the default
parameters.
Translating and aligning sequences
Click “5. Translate & align” and then select one of the alignment methods. See the
Protein Alignment section below for additional details.
Protein Alignment
Proteins can be aligned directly by clicking the ‘Align proteins’ button on the
XLibraryDisplay ribbon or by processing raw DNA sequences as described above. Multiple
alignment options are available from the following dialog box:
The simple global alignment is usually the best option for most libraries. As a general
rule, if there is not intentional length variation in the library, then the simple global alignment
should be used. To improve alignment speed and accuracy the template should be the length
of the majority of the sequences. If you choose a different template length, it is usually best to
have a longer template than a shorter one because fixing deletions is faster than insertions.
The Needleman-Wunsch algorithm, ClustalW2, ClustalO, or MAFFT (recommended)
should be used for other libraries when the library has many different sequence lengths. Note
that ClustalW2, ClustalO, and MAFFT need to be installed before they can be used – please click
the ‘Help’ button for installation details.
Mutations can be highlighted by various coloring schemes to highlight physicochemical
differences relative to the parent template using published matrices (Grantham Science 1974,
185, 862-864; Miyata et al J Mol Evol 1979 12, 219-236; Risler et al J Mol Bio 1988 2013, 1019XLibraryDisplay Version 2 - User Manual
9
1029). This “Identity matrix” option will highlight mutations in orange. Silent mutations can be
highlighted in peach. The template sequence can also be converted to the consensus.
Dataset Preparation
For libraries made by targeted mutagenesis, the randomized “library positions” should
be marked. This can be done automatically by either clicking the ‘Auto-find library’ button on
the XLibraryDisplay ribbon or manually by using the interactive right-click menu
(recommended) as described in the next section.
For antibodies, one can use the ‘Auto-find library’ and select ‘By antibody CDRs’ to mark
the CDRs as library positions. For other scaffolds, the randomized positions can be found by the
percent mutation relative to the template. Please read the message and check the template to
make sure the correct residues are marked in magenta. Often the 3’ ends of sequences are of
poor quality, so the program has trouble finding the designed mutations in the noise. You can
adjust the parameters to get the automatic detection to work, but if there are any difficulties it
is recommended that you manually assign your library positions using the right-click menu.
Right-click menu
Right-clicking on any worksheet will open a menu:
Most of these buttons are intended to be used on the Aligned sheet except for ‘View
translated ORFs’ and ‘Export PyMOL script’ which can be used on other sheets. ‘View translated
ORFs’ works on the most DNA processing sheets (e.g. BadDNA, GoodDNA, etc…) and the
Aligned sheet.
Manually Marking Library Positions
To manually mark your library positions, right click on each column on the Aligned sheet
and select “Mark library position”. Your marked library positions will now be colored in
magenta in the template. If you marked a column that’s not a library position, you can unmark
XLibraryDisplay Version 2 - User Manual
10
it but right-clicking and selecting “Unmark library position”. Library positions are usually
apparent as having a high mutation rate, i.e. mostly orange columns.
Visualization Tools
To assist with analysis, the aligned sequences can be sorted and colored in many
different ways using the XLibraryDisplay ribbon.
Sorting
To sort your aligned clones, click “Sort by” and select one of the options. Sorting by
annotation will move all sequences that are have stop codons (red), frameshifts (blue),
unknown amino acids (yellow, Xs), deletions (light gray), and insertions (dark gray) to the top.
Clones can also be sorted according to the total number of mutations relative to the template,
by name, or alphabetically by whole sequence or just the library sequence.
Hiding columns
Columns can be hidden to help you focus on library sequences or columns with
mutations. Large insertions can also be hidden.
Coloring sequences
All the amino acids in the alignment or just the assigned library positions can be colored
according to various schemes. Residues can be colored by type according to IMGT, Lesk, or
Rasmol schemes. Several other IMGT schemes are also available to highlight groups of residues
with similar properties. Residues can be colored according to physicochemical differences
relative to the template according to Grantham, Miyata, or Risler matrices (see pg 9).
References for the coloring scheme used can be found on the Log worksheet.
Library segments can also be colored by similarity which is particularly useful for
antibody analysis to identify groups of related CDRs:
XLibraryDisplay Version 2 - User Manual
11
Analysis Tools
Entering activity data
Open the “Activity” worksheet and enter data into columns. The activity “Sample
IDs” must be uniquely associated with individual sequence names, but they don’t need to
be complete sequence names. For instance, say you have the following sequence names:
SequenceA01, SequenceB01, SequenceA10, and SequenceA11
Your Sample IDs on your Activity sheet can simply be:
A01, B01, A10, and A11
But they can’t be:
A1, B1, A10, and A11
The program will not be able to match A1 with SequenceA01. Instead A1 is a sub-string of
SequenceA10 and SequenceA11 so it is ambiguous which sequence A1 refers to.
For the same reason, it’s NOT OK to have identical sample IDs. For instance:
A01, B01, A10, A01
It would also be a problem to have the following Sample IDs because the program cannot
tell if 01 refers to SequenceA01 or SequenceB01:
01, 10, 11
Here’s some example data from Stafford et al PEDS 2014:
Sample ID
A01
3A2
3A3
3A4
*no DNA
3A6
3A7
3A8
*no DNA
3A10
VEGF
0.2164
0.2405
0.3843
1.7928
0.1209
0.9062
0.5825
0.9928
0.0959
1.6264
HER2
0.2757
0.3572
0.2123
0.3086
0.1057
0.4041
0.5499
1.1023
0.1031
0.3284
Streptavidin
0.1367
0.2288
0.1987
0.2387
0.1255
0.3196
0.3248
0.7612
0.0839
0.1719
Uncoated
0.1007
0.1757
0.1469
0.1565
0.1117
0.124
0.149
0.5218
0.0892
0.1233
XLibraryDisplay Version 2 - User Manual
12
Note the “*no DNA” sample IDs. The asterisk lets XLibraryDisplay know that this
data is intended to always be graphed. There does not need to be any sequence data for
sample IDs with asterisks. They are intended for controls. In this case, “no DNA” negative
controls were run to determine background levels for the assay. It is ok to have multiple
identical sample IDs with asterisks since they do not need to be uniquely associated with
sequences.
The program will check your data for consistency or other issues when you try to
correlate sequences to activity data, exclude by activity data, or auto-pick hits. It will help
you by pointing out any issues, so feel free to enter your data and simply try to use it.
Correlating sequences to activity data
To correlate all the sequences to the activity data, click “Correlate to activity” from
the XLibraryDisplay ribbon. To correlate a subset of sequences to activity data, select
sequences on the Aligned sheet, right-click the selection, and click “Graph activity data”. It
is useful sometimes to graph non-neighboring sequences by holding down Ctrl while
selecting different sequences.
Excluding sequences based on activity data
Click “Exclude by activity” from the XLibraryDisplay ribbon. Dialog boxes will pop
up that let you set the cut-off criteria for each column of data entered on the Activity sheet.
You can specify if you want to exclude sequences if values are below or above the cut-off.
This is useful to filter out negative clones using multiple experimental inputs. This does not
take into account sequence information, so you have the possibility of keeping redundant
clones.
Picking unique leads based on activity data
Click “Auto-pick hits” from the XLibraryDisplay ribbon. A dialog box will pop up
that lets you select a single column of activity data to pick leads. You can specify whether
you want leads to have high values or low values. You can also specify a cut-off which will
exclude clones below or above a defined value. Clones will be sorted by the specified
activity data. Top-ranked, unique clones will be picked. Sets of unique clones are grouped
into tiers. “Auto-pick hits” only takes into account one column of activity data. It is mainly
intended to maximize the diversity (minimize the redundancy) of hits.
Weblogo analysis
Click “Export sequences” from the XLibraryDisplay ribbon and select “Library AAs”
and click “Export”. Go to the weblogo server (http://weblogo.berkeley.edu/logo.cgi) and
XLibraryDisplay Version 2 - User Manual
13
upload the exported file. It should generate a weblogo plot. If it doesn’t work, then you
might need to curate your sequences to remove bad quality data.
Align to structure
Click “Analyze structure” from the XLibraryDisplay ribbon. Select the protein data
bank .pdb file which contains a homologous structure to your template. PDB files can be
downloaded here: http://www.rcsb.org/pdb/home/home.do. It is probably best to use a
sequence-based search for the most similar sequence to your translated template. Select
the chain in the .pdb file that matches your template. Click OK to align using the
Needleman-Wunsch algorithm. This will align your sequences to the chain in the .pdb file
and its secondary structure. This is useful for assessing how mutations might impact the
protein structure.
Export a PyMOL script
After aligning your sequences to a structure, you can right-click individual residues
and select “Export PyMOL script”. This creates a PyMOL readable .pml script file which
needs to be opened in the same folder as your .pdb file to work. When the .pml file is
opened, it will read in the .pdb file and color your template chain in the same manner as
your alignment. This helps to visualize mutations in 3D.
XLibraryDisplay Version 2 - User Manual
14