1
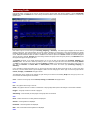
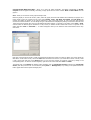
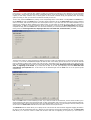
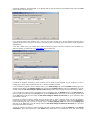
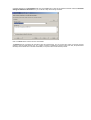
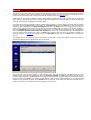
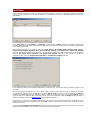
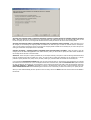
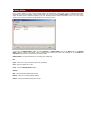
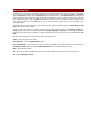
CommTraffic
User Manual
Copyright © 2003 TamoSoft, Inc.
Introduction
About CommTraffic
CommTraffic is a network utility for collecting, processing, and displaying traffic and network utilization statistics for computer
network connections, both LAN and dial-up. When monitoring a LAN segment, CommTraffic shows traffic and network utilization
statistics for each computer in the segment.
CommTraffic has a highly customizable, intuitive interface that displays statistics in graphical and numeric form. The program's main
window can be customized to display incoming, outgoing, and summary traffic statistics in a variety of styles. The program allows
you to set time and traffic limits to reflect the rates set by your ISP. Once the limit is approached, the program will alert you by
playing a sound, displaying a message, and so forth.
CommTraffic offers an array of options that allow you to generate reports that reflect the network traffic volume and Internet
connection expenses. The program supports virtually any rate plan your ISP might use, such as the one based on connection time,
traffic volume, time of the day, and other measures. This ensures that you are always aware of your Internet connection expenses.
License Agreement
Please read the following terms and conditions carefully before using this software. Your use of this software indicates your
acceptance of this license agreement. If you do not agree with the terms of this license, you must remove this software from your
storage devices and immediately cease to use the product.
Copyright
This software is copyrighted 2003, TamoSoft, Inc. CommTraffic is a trademark of TamoSoft, Inc. The use and copyright of this
software is governed by international copyright treaties. TamoSoft, Inc. retains full title and rights to this software and
documentation, and in no way does the license granted diminish the intellectual property rights of TamoSoft, Inc. You must not
redistribute the registration codes provided, on paper, electronically, or in any other form.
Evaluation Version
This is not free software. You are hereby licensed to use this software for evaluation purposes without charge for a period of 30
days. Using this software after the evaluation period violates copyright laws and may result in severe civil and criminal penalties.
Registered Version
One registered copy of this software may be used by only one person who uses the software personally on one or more computers.
Further, it may be installed on a single workstation used non-simultaneously by more than one person, but not both.
Disclaimer
THIS SOFTWARE IS PROVIDED "AS IS" WITHOUT WARRANTY OF ANY KIND, EITHER EXPRESSED OR IMPLIED, INCLUDING, BUT
NOT LIMITED TO, WARRANTIES OF MERCHANTABILITY OR FITNESS FOR A PARTICULAR PURPOSE. IN NO EVENT WILL
TAMOSOFT INC. BE LIABLE TO YOU FOR ANY DAMAGES, INCLUDING INCIDENTAL OR CONSEQUENTIAL DAMAGES, ARISING
FROM THE USE OF THIS SOFTWARE, EVEN IF ADVISED OF THE POSSIBILITY OF SUCH DAMAGES. YOU ACKNOWLEDGE THAT
YOU HAVE READ THIS LICENSE, UNDERSTAND IT, AND AGREE TO BE BOUND BY ITS TERMS.
Governing Law
This Agreement will be governed by the laws of the Republic of Cyprus.
Distribution
This software may be distributed freely in its original unmodified and unregistered form. The distribution must include all files of its
original distribution. Distributors may not charge any money for it. Anyone distributing this software for any kind of remuneration
must first contact us for authorization.
Other Restrictions
You may not modify, reverse engineer, decompile, or disassemble this software in any way, including changing or removing any
messages or windows.
Using CommTraffic
Overview
When installed on a computer, CommTraffic is a combination of two parts that work together to provide an accurate account of the
data being transmitted and network utilization. The “invisible” part is CommTraffic Service that starts automatically on Windows
boot-up, and collects and stores information about the network traffic passing through the selected network interface. The “visible”
part is CommTraffic Console that is responsible for visual representation of the collected data, drawing current throughput
graphs, and providing the interface for the program's configuration. CommTraffic Console is displayed as an icon in the Windows
system tray area.
Double-clicking on the tray icon activates the CommTraffic Console window (Toolbox) that includes the main menu, the vertical
sidebar for accessing different parts of the interface, and the status log window that displays system messages.
The Monitor tab provides current information about the network traffic. By default, it is divided into two horizontal sections that
display incoming and outgoing traffic. The number of sections, their type and appearance can be changed by right-clicking
anywhere on the Monitor tab and selecting the corresponding menu item, or by clicking on the “~” sign in the upper left corner of
a section. For each section, the type of traffic information (summary, incoming, or outgoing) can be changed by clicking on the
corresponding button in the upper left corner of the section.
Once CommTraffic Console is opened, it starts drawing graphs that represent the current network payload. Each section has an
area where the total traffic for different periods (current session, today, this week, this month, last month) is displayed. You can
change the type of information being displayed by clicking on the button below the word “Total”. The program will display either
the traffic volume, or connection times, traffic limits (if defined), or expenses (if defined).
The Reports tab provides extended network utilization reports. The program is capable of reporting the expenses incurred for the
traffic (if the tariffs are defined), as well as the overall traffic statistics for the specified period, broken down by LAN hosts.
The Alarms tab allows you to define the traffic limits based on a number of criteria, such as incoming, outgoing, total traffic
volume, connection time, or cost. You will also need to specify the ISP (network interface) for which the limit is valid, the period of
validity, and the size of the limit. Additionally, the program includes the alerting mechanism that will notify you when the limit is
about to be reached.
The Settings tab allows you to configure the program's networking, interface, and system options.
Main Menu
File
Floating monitor – opens the Floating Monitor window. This window allows you have the vital network utilization statistics
visible and available without keeping the main program window open. Right-click on the Floating Monitor caption bar and select
Stay on Top item to keep its window on top of all other windows. Selecting Screen Snap item from the same menu will make the
Floating Monitor window stick to the edge of the screen when it is dragged near the screen perimeters. The Floating Monitor
window can be customized just like the main Monitor tab, and its configuration is independent from the Monitor tab.
Close – closes the CommTraffic window. Closing the window does not stop traffic monitoring.
View
Sidebar - shows or hides the sidebar.
Page Headers – shows or hides the header (title) of the current page.
Message View – shows or hides system messages at the bottom of the program window.
Status Bar - shows or hides the status bar.
Monitor/Limits/Reports/Settings – allows you to select which of the main program tabs to display in the Toolbox.
Provider
This menu allows you to switch between providers, if you have more than one. Each provider may have different tariffs, and you
can use this menu even when you are offline to see your Internet traffic or connection time, and the amount of money spent on
each provider. You can also see the total expenses if you select All from the Providers menu. When you go online, the program
will automatically display the provider that you are connected to.
Settings
Tariff Editor … – launches the Tariff Editor window where you can add, modify, or remove tariffs.
Holiday Editor … – launches the Holiday Editor window where you can define holidays on which different ISP rates will apply.
Color Scheme – allows you to set a color scheme for the program’s main window.
Help
Contents – opens the help file.
Search For Help On – opens the CommTraffic help index.
About – shows the About window.
Network Configuration Wizard
You need to configure the networking options in CommTraffic before using the program.
Network configuration wizard will help you configure the necessary options with just a few mouse clicks. Click on the Settings
sidebar button and then on the Wizard button in the Network => Wizard tab. Click on the Next button on the Welcome screen,
and choose the correct type of network configuration on the Network Configuration screen. Select the stand-alone computer
option if your computer is not connected to a Local Area Network and has a dial-up connection to the Internet. Select the
computer is a part of LAN option if your computer connects to the Internet via a Local Area Network. The next option should be
used if CommTraffic is installed on a computer that is connected directly to the Internet and the Local Area Network and serves as
the Internet Gateway for the LAN. Selecting this option will allow you to obtain information about the Internet traffic for the entire
LAN. The last option should be used if CommTraffic is installed on a computer that is connected to the Internet and the Local Area
Network, serves as the Internet Gateway for the LAN, and obtaining the detailed statistics about the traffic of each host on the LAN
is desired. Click on the Next button to go to the network adapter selection screen.
The adapter selection screen has a drop-down menu that allows you to specify the correct network adapter for counting the traffic.
If your computer has a dial-up connection or is connected to the LAN via an Ethernet adapter, you will have only one adapter in the
menu, and you will need to select it. If your computer serves as the Internet gateway for the local network or has more than one
network adapter, you will need to select the adapter that you would like CommTraffic to monitor. If you would like to count the
Internet traffic of the entire LAN segment, including the traffic of the machine that CommTraffic is running on, you will need to tell
the program to monitor the network adapter through which the connection to the Internet is established. Whenever your goal is to
monitor the traffic of the computers on the LAN and obtain the detailed statistics for each of them, you will need to select the
network adapter that is used to connect the CommTraffic computer to the local network. Some network adapters cannot operate in
promiscuous mode. If you use such an adapter, please check the Use non-promiscuous mode box. This option must always be
selected for wireless (802.11) adapters.
The next screen allows you to specify blocks of IP addresses that CommTraffic should treat as local and excludes from the Internet
traffic statistics. The program will try to determine the block of local addresses automatically and add it to the list. If there are
additional addresses that belong to your local network, please enter them in the network address/network mask format, and click
on the Add button.
If your computer connects to the Internet via a proxy, you can specify its address and port on the next screen to make the program
add the traffic transmitted via the local proxy server to the total Internet traffic. CommTraffic can detect the proxy settings on your
computer. Click on the Detect button to determine these settings. Click on the Finish button to complete the configuration.
Monitoring Traffic
CommTraffic offers a powerful set of tools for monitoring current network traffic and network utilization. Launch CommTraffic
Console and select the Monitor tab to start viewing the traffic statistics and the network bandwidth utilization in numerical and
graphical form.
Each section may be of one of three types: Incoming, Outgoing, or Summary. The section type is displayed on the left side of
section's caption bar. The graph illustrates the current network utilization. The peak value of the graph represents the highest
bandwidth utilization within the time range shown by the graph. The peak value is displayed as a number in the graph's upper left
corner. Additional information about the traffic is available in the section's caption bar: Current indicates the network throughput
value for the past 2 seconds, Average shows the average network throughput value during the past hour, and Maximum shows
the highest throughput during the past hour.
The Monitor tab allows you to display several sections, one or more for each of the traffic types: Incoming, Outgoing, and
Summary traffic. You can close a section by clicking on the “~” sign in the upper left corner of the section and clicking Section
=> Close, or right-clicking on the section and clicking Section => Close. If you would like to add a new section, click on the “~”
sign, then click Section => Insert New => Above/Below, and choose the section type (Incoming, Outgoing, or
Summary).
If you would like to change the section type, you can click on the button with the section name next to the “~” sign in the upper
left corner, until the desired section type is displayed. Please note that changing the section type will reset the graph and the
Current, Average, and Maximum throughput values.
The appearance of the graphs can be changed by right clicking on the section and selecting Graph from the pop-up menu. The
menu contains the following items and sections:
Clear – resets the current graph and the Current, Average, and Maximum throughput values.
Data
Line – the graph is drawn using a color line.
Peaks – the graph is drawn as a number of vertical bars of varying height that represent the changes in the network utilization.
Polygon – the graph is drawn as a series of polygons.
Antialiasing – when checked, the sharp edges of the graph lines are smoothed.
Grid
None – neither horizontal nor vertical gridlines are displayed.
Vertical – vertical gridlines are displayed.
Horizontal – horizontal gridlines are displayed.
Both – both vertical and horizontal gridlines are displayed.
Scale
Compact/Normal/Wide/Extra Wide – allows you to zoom the graph horizontally. The default representation is Normal,
Compact shrinks the graph horizontally, thus fitting a longer period into the monitor window. Wide and Extra Wide zoom the
graph in.
Save – allows you to save the current graph in bitmap format.
Below the graphs you can see the counters, which, unlike the graphs, show the traffic statistics accumulated by the program for a
longer period of time. The counters can be of five types: Session, Today, This Week, This Month, and Last Month. The
counters can display the duration of the Internet connection in time units, traffic volume, as well as the limits and expenses
incurred for Internet connection. You can change the type of information that is displayed by clicking on the button under the word
Total in the section's bottom right corner until the desired information appears, or right-click on the section, select Total => Kind,
and then select the desired type of information. To add, remove, or redefine counters double click on them or right-click on the
section and select Total => Customize … . A window will appear where you can select the kind of information from the dropdown menu.
Each item on the drop-down list has a number in brackets that represent the number of counters to display. The counter names are
listed below. To add a new counter, click on the Add button and select it from the list. If you would like to remove a counter, select
it with a mouse click and click on the Delete button. You can move the counters up and down in the list by clicking on the
corresponding button. To hide the counters altogether, right-click on the section and select Total => Visible.
The bottom pane of the Monitor tab displays system messages, such as CommTraffic Console connections to CommTraffic
Service, limit alerts, and so forth. You can hide it by clicking View => Message View, or by clicking on the splitter between the
bottom graph section and the system messages pane.
Alarms
If your ISP does not offer a flat-rate plan, whether you dial-up to connect to the Internet or use a leased line, you will most likely
be interested in setting limits that would trigger configurable alarms. Limits may be defined on the basis of amount incoming,
outgoing or total traffic, connection time, or money spent on the Internet connection during the specified period. The alerting
system will notify you when you are about to exceed the limit that you have set.
To set a limit, select the Alarms tab by clicking on the corresponding button on the sidebar or clicking View => Alarms menu.
On the Alarms tab, click on the New button. A new alarm window will appear. Fill out the Alarm name field by giving an arbitrary
name to the alarm, and choose the provider from the drop-down menu. If you have more than one network interface on your
computer (for instance the dial-up adapter and a network card), you will be able to choose the one for which you would like to
obtain statistics, or Any for all network interfaces. Write your description of the limit in the Alarm description field. After you
completed this step, click on the Next button. The next screen will allow you to choose the basis for setting the limit. The available
limiting criteria are Incoming traffic size, Outgoing traffic size, Total traffic size, Connection time, and Cost.
The next screen will let you choose the period of validity for the limit, as well as its starting point. You can set the limit for one day,
one week, or one month. The From field displays the date and time of the starting point for the limit You can alter the date and
time by selecting its element (day, months, year, and so forth.), and clicking on the up or down arrows on the right side of the
field. Click on the From button to choose one of the preset starting point values: Now, Beginning of the day, Beginning of the
week, or Beginning of the month. If you would like the limit to be reset upon expiration, check the Reset this limit
automatically upon expiration box. In this case it will be activated again with the From time set to the previous period
expiration time.
Click on the Next button to continue defining the limit. If your limits are based on the traffic size, the next screen will allow you to
set the maximum traffic size for the period of time that you have just specified. Click on the arrows to set the maximum traffic limit,
and choose the traffic units from the drop-down menu. If the starting traffic is not zero, you may change its value by clicking on the
arrows next to the Initial value field and choose the traffic units from the drop-down menu.
The Threshold track bar below allows you to specify how far into the limit the alarm should be triggered. Dragging the slider to
the right or to the left will determine how far in advance you will receive the warning about exceeding the limit. The Initial value
field allows you to enter the volume of traffic that has been used from the beginning of the period up to the moment of
CommTraffic installation. This field enables you to add this traffic to the total volume for the specified period. Click on the Next
button to move to the actions screen.
If your limits are based on the connection time or cost, the next screen will allow you to set the maximum connection time or
maximum allowed amount of money for the period of time that you have just specified. Set the limits and the alerting threshold as
described above.
If your limit is based on cost, you will also need to select the tariff to be used for the Internet connection costs calculation. If no
tariffs are available, you should click on the Tariff Editor button to define one.
Click on the Next button to move to the Actions screen.
CommTraffic is capable of performing a variety of actions once the alarm has been triggered. You can configure it to show a
message, play a sound, notify a windows domain user, or execute a specified command.
If you would like the program to show a message window, go to Show Message tab, check the Enabled checkbox, type in the
message window caption in the Message Caption field, and fill out the Message text field. Click on the Test button to see the
message. Check the Use these settings as default for this action checkbox if you would like to keep these settings as default.
If you would like the program to play a sound when the limit is approached, check the Enabled checkbox in the Play Sound tab,
type in the path to the sound file in the File name field, or click the Browse button and browse for the sound file on a disk. Click
on the Test button to play the sound. Check the Use these settings as default for this action box if you would like to keep
these settings as default.
CommTraffic is capable of sending a message across NT domain when an alarm is triggered. Please note that the Messenger
service has to be running on the machine that is supposed to receive the message. To perform this action, check the Enabled box
in the corresponding tab, type in the user or computer name in the User/computer name field, and fill out the Message text
field. Click on the Test button to see the message. Check the Use these settings as default for this action box if you would
like to keep these settings as default.
You can also configure the program to execute a specific command. To perform this action, check the Enabled box in the Execute
command tab, type in the command line or click Browse button and browse for the executable file on the disk. Enter optional
command parameters in the Parameters field. Click on the Test button to execute the specified command. Check the Use these
settings as default for this action box if you would like to keep these settings as default.
Click on the Done button and the new limit will be added.
The Alarms tab will now display the information about the imposed limits. You can see the alarm name, the provider the limit
applies to, limit type (traffic amount, time, etc.), whether it is active or disabled, the maximum value of the limit, the specified alert
threshold, and the actual amount of traffic downloaded / time spend online with the selected provider.
Reports
CommTraffic can help you monitor your Internet connection expenses in real time. A wizard will guide you through the process of
creating a new expense. Another wizard will assist you in inputting the details of your tariff plan. Once the new expense is set, the
program will report the amount that you spent for the Internet connection during the specified period.
Besides expenses, CommTraffic is capable of reporting general statistics for each host on the LAN. For each host, the program can
report incoming, outgoing, and total traffic, as well as calculate the percentage of the traffic generated by a host in the total traffic
of the LAN. Each computer is identified by IP and MAC address.
If you would like to watch your Internet connection expenses with CommTraffic, you need to follow a few simple steps to configure
the program. Click on the Reports button on the sidebar, go to Expenses tab and click on the New button. Enter the name of the
expense and add its description in the Expense description field. Click on the Next button to go to the screen that will help you
specify the time period. Click on the arrows on the right side of the To and From fields to set the period for reporting expenses or
click on the Predefined button to select a predefined period of time. If you would like the expense to be reset upon expiration,
check the Reset this expense automatically upon expiration box. In this case it will be activated again with the From time
set to the previous period expiration time. Click on the Next button to select a tariff upon which your expenses are based. If no
tariffs are defined or if a new tariff is required, click on the Tariff Editor button. Click on the Done button to complete the
process.
The Expenses tab will now display the name of the expense, the tariff that is used by the expense, the period for which the
expenses are calculated, and the actual amount spent for the period.
If you would like to see the traffic statistics for each computer on the LAN, open the Hosts tab. The Host column lists the IP
addresses of the computers that generated the traffic, the Incoming, Outgoing and Total columns show the traffic for each
computer specified by direction, the Percent column indicates the share of the each computer’s traffic in the total Internet traffic of
the local network, and the MAC column displays the MAC address of each computer’s network interface. You can view the traffic
statistics for various periods by clicking on the Period button at the bottom of the window and selecting the desired period or
setting a custom period. The selected period is shown below the name of the tab.
Tariff Editor
If you would like CommTraffic to report your Internet connection expenses in real time, you will need to define the tariff that is
used by your ISP to charge you for the Internet connection. CommTraffic offers a variety of flexible settings that will cover most
tariff schemes.
Launch Tariff Editor by clicking Settings => Tariff Editor, and then click on the New button to start setting the options for the
new tariff. Type in the tariff’s name in the Tariff name field, select the provider from the drop-down list and fill out the description
in the Tariff description field.
The next screen will allow you to select the tariff type: Traffic volume / No prepaid volume included, Traffic volume /
Prepaid volume included, Connection time / No prepaid time included, or Connection time / Prepaid time included.
If your ISP charges you a specific rate per megabyte or per hour without including any traffic/connection time into the monthly fee,
select the “No prepaid volume included” or “No prepaid time included” tariff type. If your monthly fee includes free
megabytes or hours, select the “Prepaid volume included” or “Prepaid time included” tariff type.
If you selected the tariff type that includes prepaid traffic or connection time, you can enter the fixed monthly fee amount in the
next screen.
After you have selected the tariff type, you need to specify whether the rates are the same on all days or whether the rates differ
on weekends and holidays. Click on the Add button and choose Always active if the rate is the same on all days, or Custom, if
holidays and weekends differ from the weekdays in terms of traffic or connection time cost. If you selected Custom, the next
screen will allow you to specify the days of the week when the current rate is applicable. Check the Holiday checkbox if the rate is
applicable on holidays. Click on the Holiday Editor button to specify the holidays.
Connection time or traffic cost is often different at different times of the day. The next screen will allow you to specify the time of
the day when the current price is applicable. Click on the Next button to go to the screen where you need to specify the cost of
traffic/connection time.
If you selected the Prepaid volume included tariff type, the next screen will allow you to specify further details of your tariff plan
regarding the traffic included into your monthly fee. Please select one of the four options:
Incoming and outgoing traffic is calculated separately, incoming is paid if the limit is exceeded, outgoing is always
free – select this option if your ISP charges you for incoming traffic only, without limiting the use of outgoing traffic. Then you will
be able to specify the volume of incoming traffic included into the monthly fee and the cost of the extra incoming traffic.
Incoming and outgoing traffic is calculated separately, both are paid if the limit is exceeded – select this option if your
ISP charges you for incoming and outgoing traffic at a different rate and both types of traffic are included into the monthly fee.
Then you will be able to specify the volume of incoming and outgoing traffic included into the monthly fee, as well as the price for
each type of traffic after the prepaid volume is exceeded.
Summary (incoming + outgoing) traffic is calculated and is paid if the limit is exceeded – select this option if your ISP
charges you for the total traffic (regardless of the traffic direction). Then you will be able to specify the traffic volume included into
the monthly fee and the cost of the extra traffic.
Advanced – select this option to specify the details of your tariff plan manually. This option is used for defining mixed tariffs where
both the connection time and the traffic incur costs. You will be able to specify the parameters of the monthly fee. It will be
possible to specify whether time, traffic, volume, duration, traffic type, and extra traffic are included into the monthly fee.
If you selected the Prepaid time included tariff type, the next screen will allow you to specify the time included into your monthly
fee and the cost of the extra time. If your monthly fee includes free connection time, select the Connection time option and enter
the time included into the monthly fee in the field below. If the monthly fee includes free traffic, select the appropriate traffic type
(Incoming, Outgoing, or Summary) and specify its volume in the field below. Enter the price of extra connection time in the
Extra connection time cost field. If establishing the connection incurs a fixed cost, the next screen allows you to specify the fee.
When you have finished defining the time periods for the new tariff, click on the Done button and the new tariff will be added to
the tariff list.
Holiday Editor
It is a common practice for many Internet Service Providers to offer different (usually lower) rates on weekends and holidays.
Weekends are universal everywhere, however holidays differ from country to country. Holiday Editor is a tool that allows you to
specify the dates that are considered holidays by your ISP. Specifying holidays enables CommTraffic to give you a more precise
account of your Internet expenses if special holiday rates are used by your ISP.
You can open the Holiday Editor window by clicking Settings => Holiday Editor. Click on the New button in the Holiday
Editor window to define a new holiday. Type in the date of the holiday in the Date field, optionally fill out the Name and
Comment fields, and click on the OK button to add the holiday.
Holiday Editor has a menu that allows you to manage your holiday lists.
File
Open – allows you to open a file that contains a list of holidays.
Save – saves the holiday list to a file.
Close – closes the Holiday Editor window.
Holiday
Add – opens the holiday adding dialog window.
Modify – allows you to edit the selected holiday.
Delete – removes the selected holiday from the list.
Setting Options
You can customize the configuration of the program by clicking the Settings sidebar button.
The Network tab allows you to configure CommTraffic Service that is responsible for collecting and storing the information
about network traffic.
You can perform the network options configuration by running the configuration wizard from the Wizard tab or setting the options
manually in the Adapter, LAN, Proxy, and Advanced tabs.
The Adapter tab has a drop-down menu that allows you to specify the correct network adapter for counting the traffic. If your
computer has a dial-up connection or is connected to the LAN via an Ethernet adapter, you will only have one adapter in the menu.
You will need to select it. If your computer serves as the Internet gateway for the local network or has more than one network
adapter, you will need to select the adapter that you would like CommTraffic to monitor. If you would like to count the Internet
traffic of the entire LAN segment, including the traffic of the machine that CommTraffic is running on, you will need to tell the
program to monitor the network adapter through which the connection to the Internet is established. In the case where your goal is
to monitor the traffic of the computers on the LAN and obtain the detailed statistics for each of them, you will need to select the
network adapter that is used to connect the CommTraffic computer to the local network. Some network adapters cannot operate in
promiscuous mode; if you use such an adapter please check the Use non-promiscuous mode box. This option must always be
selected for wireless adapters.
Important note: If you installed a new network adapter after installing CommTraffic in Windows 98/ME, your adapter might not
show up in the list. Please uninstall CommTraffic, reboot, and then reinstall it.
The LAN tab allows you to specify blocks of IP addresses that CommTraffic should treat as local and exclude from the Internet
traffic statistics. The program will try to determine the block of addresses automatically and add it to the list. If there are additional
addresses that belong to your local network, please enter them in the network address/network mask format and click on the Add
button.
If your computer connects to the Internet via a proxy, you can specify its address and port on the Proxy tab to make the program
add the traffic transmitted via the local proxy server to the total Internet traffic. CommTraffic can detect the proxy settings on your
computer. Click on the Detect button to determine these settings.
The Advanced tab allows you to select the advanced networking options.
Ignore non-IP packets – selecting this option will make the program ignore all packets that do not belong to the IP protocol
family. The examples of such protocols are ARP/RARP, IPX, and so forth.
Do not include Ethernet headers size – check this box if your ISP does not include the Ethernet header size (the first 14 bytes
preceding the IP headers) when counting your traffic.
The Interface tab allows you to change the appearance of the program interface elements.
Application Font
Interface Font – allows you to change the default font for all interface elements.
Application hints
Show application hints – when checked, hints for buttons and other elements are displayed.
Include shortcut information – if checked, the keyboard-shortcut information is added to the text of the hint when applicable.
Hints Font – allows you to change the hint window default font.
Hint Color – allows you to select the hint window background color.
Hide pause – allows you to set the delay time for the hint to be hidden if the mouse pointer is not moved away from the program
control or menu item.
Show pause – specifies the time interval after which the hint appears when the mouse pointer is placed over a program element.
Short pause – specifies the time period to wait before displaying the next hint if a hint is already being displayed.
The System tab allows you to set system options.
Windows Startup
Run CommTraffic Console on Windows startup – if this checkbox is checked, the program will start when Windows is started.
Console Startup
Show Toolbox – if this checkbox is checked, the program Toolbox will be displayed immediately when the Console is started.
Show Floating monitor – if this checkbox is checked, the Floating monitor will be displayed immediately when the Console is
started.
System Tray Icon
The CommTraffic tray icon can be customized to display the tool tip window with basic traffic statistics when you move the mouse
over the icon. You can configure this window by right-clicking on the CommTraffic tray icon and selecting Icon => Customize.
Select the Advanced radio button and click Customize in the Icon Options window. In the Advanced Tool Tip window you will
be able to configure the number and type of counters that will be displayed when the mouse is moved over the tray icon. Each item
on the drop-down list has a number in brackets that represent the number of counters to display. The counter names are listed
below. To add a new counter, click on the Add button and select it from the list. If you would like to remove a counter, select it
with a mouse click and click on the Delete button. You can move the counters up and down in the list by clicking on the
corresponding button.
You can adjust the time interval before the tool tip window is shown or hidden by changing values in the Show delay and Hide
delay fields in the Icon Options window.
The tray icon itself may appear as a standard program icon or as graph representing the current Incoming, Outgoing, or
Summary traffic. Select one of the bottom radio buttons (Incoming, Outgoing, or Summary) in the Icon Options window to
change the type of traffic that the icon displays. To change the appearance of the tray icon right click on it and select Icon => As
Graph.
Right-click on the program icon in the system tray brings up the following menu:
Toolbox – opens the program main window.
Floating monitor – opens the Floating Monitor window.
Start with Windows – when checked, the program will start automatically when Windows starts. This option affects the
CommTraffic Console window; the invisible CommTraffic Service will run on Windows boot-up in any case.
About – shows the About window.
Icon – allows you to change the appearance of the Icon and the actions that it performes when the mouse is moved over it.
Exit – closes CommTraffic Console.
Frequently Asked Questions.
?: How do CommTraffic Service and CommTraffic Console exchange data on my computer?
!: CommTraffic Service listens on TCP port 4776, and CommTraffic Console connects to this port to exchange data with the
CommTraffic Service. Connections to CommTraffic Service are accepted only from your PC's IP address. In other words, no other
computer can connect to CommTraffic Service over the network.
?: I need to reinstall Windows, how do I save CommTraffic log files and traffic statistics?
!: If you would like to preserve the traffic statistics, you need to back up all files from the Logs subfolder of the CommTraffic folder.
When you reinstall CommTraffic, just copy the files back to the new Logs folder.
?: I have just installed CommTraffic and attempted to launch CommTraffic Console, however the program displayed
the following error message: "CommTraffic Console cannot connect to the Service." How do I solve this problem? I
am using BlackICE IDS.
!: You need to disable Application Protection in BlackICE and reboot the computer.
?: What happens if I install a new network adapter or remove one?
!: If you are running Windows 2000/XP, you don't need to do anything, your new adapter will be automatically added to the
adapter list in CommTraffic (or the old one will be removed). If you are running Windows 98/ME, please uninstall CommTraffic,
reboot, and then reinstall it.
Information
How to Purchase CommTraffic
NOTE: This beta version is being distributed free of charge and will expire on March 15,
2003. The commercial version of CommTraffic will be available in March 2003.
This program is a 30-day evaluation version. If you would like to continue using it after 30 days, you must purchase it. Below is the
pricing for the fully functional, unrestricted version of the program:
License
1 User License
Price, US
$49.00
As a registered customer you are entitled to:
•
•
•
Free updates that will be released within 1 year from the date of purchase;
Information on updates and new products;
Free technical support.
We accept credit cards orders, orders by phone and fax, checks, and wire transfers. Prices, terms, and conditions are subject to
change without notice. Please check our web site for the latest product offerings and prices.
http://www.tamos.com/order/
Contacting Us
Web
http://www.tamos.com
E-mail
[email protected] (Sales-related questions)
[email protected] (All other questions)
Mail and Fax
Mailing address:
PO Box 1385
Christchurch 8015
New Zealand
Fax: +64 3 359 0392 (New Zealand)
Fax: +1 503 213-7764 (USA)
Other Products by TamoSoft
CommView
CommView is a program for monitoring Internet and Local Area Network (LAN) activity capable of capturing and analyzing network
packets. It gathers information about data passing through your dial-up connection or Ethernet card and decodes the analyzed
data. With CommView you can see the list of network connections and vital IP statistics and examine individual packets. Packets are
decoded down to the lowest layer, with full analysis of the most widespread protocols. Full access to raw data is also provided in
real time. CommView is a helpful tool for LAN administrators, security professionals, network programmers, or anyone who wants to
have a full picture of the traffic going through one's PC or LAN segment.
More information
SmartWhois
SmartWhois is a handy utility for obtaining information about any IP address, hostname, or domain in the world. Unlike standard
whois utilities, it automatically delivers information associated with an IP address or domain no matter where it is registered
geographically. In just a few seconds, you have all you want to know about a user: domain, network name, country, state or
province, and city. Even if the IP address cannot be resolved to a hostname, SmartWhois will not fail!
More information
Essential NetTools
Essential NetTools is a set of network tools useful in diagnosing networks and monitoring your computer's network connections. It's
a Swiss Army knife for everyone interested in a set of powerful network tools for everyday use. The program includes a NetStat
utility that shows your computer's network connections and open ports and maps them to the owning application. It also features a
fast NetBIOS scanner, a NetBIOS Auditing Tool for checking LAN security, and a monitor of external connections to your computer's
shared resources. As well, there is a process monitor that displays information about all the programs and services running on your
computer. Other useful tools are included: such as Ping, TraceRoute, and NSLookup. Additional features include report generation
in HTML, text, comma delimited formats and a customizable interface. The program is an easy-to-use and powerful replacement for
such Windows utilities as nbtstat, netstat, and NetWatcher. It incorporates many advanced features that standard Windows tools
cannot and do not offer.
More information
DigiSecret
DigiSecret is an easy-to-use, secure, and powerful application for file encryption and sharing. It utilizes strong and time-proven
encryption algorithms for creating encrypted archives, self-extracting EXE files, and sharing files with your associates and friends.
DigiSecret also includes powerful and intelligent file compression; you no longer need .zip files when you can have encrypted and
compressed DigiSecret files. The program is integrated with the Windows shell. You can perform operations on files by right-clicking
on them. It also fully supports drag-and-drop operations.
More information