1
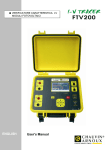
C.A 601
■ SINGLE-CHANNEL DATA LOGGER
Simple Logger
™
L100, L110, L230, L260, L600, L605
E N G L I S H
User's manual
1
Meaning of the
symbol :
Warning ! Please refer to the User’s Manual before using the instrument.
In this User’s Manual, the instructions preceded by the above symbol, should they not be carried out
as shown, can result in a physical accident or damage the instrument and the installations.
Meaning of the
symbol :
This device is protected by a double insulation or by a reinforced insulation. No linking is required
from the protection earth terminal to ensure the electrical security.
Thank you for purchasing a Simple Logger™ or a C.A 601 AC RMS Current Logger.
To get the best service from this instrument :
n read this user’s manual carefully and
n respect the safety precautions detailed
PRECAUTIONS FOR USE
■ Read this instruction manual completely before attempting to use or service this instrument and
follow all safety information.
■ Read the Safety Specifications section carefully before using the Logger.
■ NEVER exceed the maximum working voltage ratings given.
■ ALWAYS make connections from the logger to the circuit under test.
■ NEVER open the logger while connected to any circuit or input.
■ ALWAYS inspect the instrument accessories and leads prior to use.
Replace any defective parts immediately with factory parts.
■ Before any intervention:
- Models Lxxx : Disconnect all the leads from the Logger
- C.A 601 : The clamp must not clamp any conductors
WARRANTY
Our guarantee is applicable for twelve months after the date on which the equipment is made available
(extract from our General Conditions of Sale, available on request).
2
Copyright 1997 by AEMC Instruments and CHAUVIN ARNOUX. All rights reserved. No part of this
document may be reproduced in any form or by any means whatsoever (including storage on a data
processing medium or translation into any other language) without prior written agreement by AEMC
and CHAUVIN ARNOUX in accordance with international Copyright law.
The product names used in this manual belong to the following companies:
Simple Logger™ is a registered trade mark of AEMC Instruments. Windows 3.1, Windows 95 and
Microsoft Excel are registered trade marks of Microsoft Corp. Lotus 123 is a registered trade mark of
Lotus Development Corp. Licence for the Simple Logger™ software granted to AEMC Instruments
by Conservation Devices Inc. TXR™ is a registered trade mark of Conservation Devices inc.
CONTENTS
1. INTRODUCTION ............................................................................................................................... 5
1.1 How to use this manual ............................................................................................................ 5
1.2 Conventions used ..................................................................................................................... 5
1.3 Receiving Your Shipment ......................................................................................................... 5
2. THE DIGITAL LOGGER ................................................................................................................... 6
2.1 Description ............................................................................................................................... 6
2.2 Automatic scaling ..................................................................................................................... 6
2.3 Time-Extension Recording (TXR™) ........................................................................................ 8
2.4 Main components ................................................................................................................... 10
2.5 Specifications ............................................................................................................................ 11
2.6 Data storage function ................................................................................................................ 13
2.7 Precautions ............................................................................................................................ 15
3. SOFTWARE .................................................................................................................................... 15
3.1 License Agreement ................................................................................................................ 15
3.2 Minimum Computer Requirements ........................................................................................ 15
3.3 Installation .............................................................................................................................. 15
3.4 Getting started ....................................................................................................................... 16
3.5 The menu system ................................................................................................................... 18
3.6 File .......................................................................................................................................... 18
3.7 Time Set ................................................................................................................................. 25
3.8 Downloading ........................................................................................................................... 26
3.9 Port ......................................................................................................................................... 27
3.10 Function .................................................................................................................................. 28
3.11 Date Frmt ............................................................................................................................... 29
3.12 Help ........................................................................................................................................ 29
3.13 Examining Data ...................................................................................................................... 30
3.14 Zoom function ........................................................................................................................ 30
3.15 Graph Statistics ...................................................................................................................... 33
3.16 Appendix A: lmporting ‘’.TXT Files’’ from the Logger into a spreadsheet ............................. 34
3.17 Appendix B : Troubleshooting ................................................................................................ 37
3
4. GLOSSARY .................................................................................................................................... 38
5. MAINTENANCE .............................................................................................................................. 39
5.1 Changing the battery .............................................................................................................. 39
5.2 Cleaning ................................................................................................................................. 39
5.3 Metrological verification ......................................................................................................... 40
6. TO ORDER ..................................................................................................................................... 40
Optional accessories and replacement parts ................................................................................. 40
7. APPENDIX ...................................................................................................................................... 41
7.1 Error in the temperature range (L 600 and L 605) ................................................................. 41
7.2 Resolution (L 600 and L 605) ................................................................................................. 42
4
1. INTRODUCTION
1.1
How to use this manual
This manual is a reference guide for both the Logger and the graphic software. We advise you to read
this manual in full before beginning your first logging session. It will stop you wasting time during
installation and logging operations.
Section 1 contains a presentation of your Simple Logger™ and its software. The warranty information,
safety information and the conventions adopted are also in this section. Furthermore, it contains a
detailed list of the components and accessories supplied with each digital logger.
Section presents the operation of the digital logger. It includes information about how to start and stop a
logging session, theoretical operation, battery installation, the specifications, how to recover lost data
and other important information concerning the hardware part of your Logger.
Section 3 deals with full installation and use of the software supplied with your Logger. We advise you
to read it in full before using the program.
1.2
Conventions used
■ The keys that you have to use on the computer or digital Logger are indicated in bold characters and
between quotes. For example, <Enter> means press the enter key on the computer keyboard, while
<Esc> means press the Escape key.
■ The information to be typed using the keyboard is indicated in bold. For example: a:setup.
■ The selection of buttons or menus in the Logger software is indicated in italics between quotes. For
example: “File”.
■ The terms “display” and “”screen” are used interchangeably in this manual to indicate the computer
screen.
■ Operations performed with the mouse are described using the expressions “click” or “right-click”. This
means press the left or right mouse button once the cursor is on the command, instruction or object
required. The word “select” is also used to mean the act of pointing and clicking with the left mouse
button.
1.3
Receiving Your Shipment
■ Upon receiving your shipment, make sure the contents are consistent with the packing list (see § 6.
To order).
■ Notify your distributor of any missing items.
■ If the equipment appears to be damaged, file a claim immediately with the carrier and notify your
distributor at once, giving a detailed description of any damage.
5
2. THE DIGITAL LOGGER
2.1
Description
The Logger is a battery powered single channel recording device.
The Logger operates in three modes: RECORD, STAND BY and OFF. A red LED indicates the operating
mode: It flashes twice in RECORD mode, flashes one in STANDBY mode and remains lit constantly
when the signal measured exceeds the maximum value specified for the Logger input. The LED is off in
OFF mode. A membrane push-button marked <Press> on the label of the logger selects the mode of
operation.
In the STANDBY mode the logger retains recorded information for transfer to a computer. In OFF mode,
the memory is emptied and the microprocessor is inactive. This mode helps to prolong the battery
charge life. If the logger is turned off by mistake, the data can be recovered. Please refer to Recovering
Lost Data later in this section for details.
The strong point of this Logger is its ability to perform a wide range of logging tasks combining high
resolution and accuracy without the user having to configure it. This is made possible by the use of
automatic scaling and the Time Extension Recording TXR ™ system associated with a highly flexible
basic model.
Analogue information on the input is sampled and converted to a digital signal. This digital signal is
processed and stored along with scale and time information. A serial port provides for transfer of data
tram infernal memory to the computer for analysis. Figure 2-1 shows a block diagram of the Logger.
RS-232
Signal
In
8 Bit A/D
CPU
Power Source
9 V Battery
Data
Storage
Figure 2-1. Logger Block Diagram
2.2
Automatic scaling
The Logger employs a unique method of auto-ranging its scale to provide you with the best possible
resolution for the recording session.
Data logging always starts with the highest resolution and the lowest scale range. The overall scale is
divided into four ranges. A maximum of three scale changes is provided for in the data logger to coincide
with the four scale ranges.
6
The scale ranges are as follows :
■
■
■
■
Range 1: 0 -12.5% of the total scale
Range 2: 0 -25% of the total scale
Range 3: 0 -50% of the total scale
Range 4: 0 -100% of the total scale
Whenever a recorded value crosses over to a higher scale range, the logger increases its scale range by
a factor of two and repeats the reading.
Logger has 250 steps in each scale range. Resolution can be calculated by dividing the scale range in
use by 250.
To permit the host computer to interpret the data correctly, the logger notes, during the recording process,
when each change of scale takes place. Maximum resolution occurs when all the recorded samples stay
within the lowest scale range. Figure 2-2 shows the relationship between scale range and resolution.
.
100
Full Scale
90
80
r4 = F.S./250
% of Full Scale
70
60
50
1/2 of Full Scale
40
r3 = (F.S.) (0,5)/250
30
1/4 of Full Scale
20
r2 =(F.S.) (0,25)/250
1/8 of Full Scale
10
r1 = (F.S.) (0,125)/250
0
S1
S2
S3
Scale Range
S4
r1, r2, r1, r3, r4 : Resolution according to the max. value of the measurement signal
S1, S2, S1, S3, S4 : Ranges within the scale
F.S. : Full Scale (the rated value of the Logger input)
Figure 2-2. Relationship Between Scale Range And Resolution
Example 1 :
You possess an L100 logger with a full-scale value (FS) of 1000 A (with a 1000 A/1V clamp). The
recording stayed between 60 and 120 Amps for the entire session which indicates that all data is contained
in the lowest scale range.
Therefore the resolution is:
(F.S.) x (12.5%) = (1000) x (0.125)
250
250
=
125 = 0.5 A
250
Example 2 :
You possess an L100 logger with a full-scale value (FS) of 1000 A (with a 1000 A/1 V clamp). The
recording varied between 110 and 225 Amps for the entire session which represents a range change.
Therefore the resolution is:
(F.S.) x (25%)
250
= (1000) x (0.250)
250
7
=
250 = 1.0 A
250
NOTE : A standard value of 1 is assigned to the associated sensors if their full-scale output is less than
1 V or 1 A.
For example, the maximum reading on the Y2N clamp is 600 A and the output voltage at 600 A is 0.6 V.
This gives the following formula for calculating the minimum resolution corresponding to range 4 of the
scale:
1
= 1 = 1.666 A
Ouput voltage
0.6
Therefore FS = 600 A x 1.6666 = 1000 A
See table 2-1 for resolutions available on each model with respect to scale changes.
Model
Value of
Units
Resolution
full scale
S1
S2
S3
S4
L 100, L 110
10
A
0.005
0.01
0.02
0.04
with
100
A
0.05
0.1
0.2
0.4
an ammeter
500
A
0.5
1
2
4
clamp
1000
A
0.5
1
2
4
3000
A
1.5
3
6
12
L 230*
300
V
0.25
0.5
1
2
L 260*
600
V
0.5
1
2
4
L 600 and L 605
see § 7. Appendix
* The resolution is based on a 500 V full scale for the L 230 and a 1000 V full scale for the L 260
Table 2-1. Resolution vs. Scale Range
For best resolution, avoid including in the recording session signals that are above the range of interest.
For example, when recording the temperature of a freezer, allow the sensor to cool before starting
recording.
Also, if an input cable is being used, make sure that it is securely plugged in throughout the period of the
recording. If the logger is taking a reading as the input cable is being inserted or removed, unwanted
rescaling may result. When measuring AC current, be sure to clamp the ammeter clamp around the
conductor to be measured before starting the recording session.
2.3
Time-Extension Recording (TXR™)
Time extension recording is an automatic process that updates the sample rate and the number of
stored data points based on the length of the recording.
The maximum number of stored data points is 8192. When Logger starts a new recording session, it
does so at its fastest sample rate of 4096 points per hour (0.88 seconds per point).
The Logger can operate at this rate for two hours. If the session continues beyond two hours, the time
extension recording technique becomes active.
After two hours’ recording, the Logger reduces its sample rate to 2048/h (1.7 seconds per count) and
continues recording, selectively removing the data previously stored, so that the new data stored is
compatible with that recorded beforehand.
Recording continues for the next two hours at this new rate until the remaining 4096 storage points are
filled. (See figure 2-3)
8
First 2 hours
1
2
3
Next 2 hours
1
2
3
4
5
6
4096 4097
2048
8191 8192
4096 4097 4098
8192
Figure 2-3. Allocation of Time Extension Memory
The time extension recording process of selectively overwriting previously stored data and reducing the
sample rate for new stored data continues every time the memory fills up.
Table 2-2 shows the relationship between recording time and sample rate for the Logger using this
technique.
Sample Rate
per hour
Seconds per
sample
Total recording
time (hours)
Total recording
time (days)
4096
0.88
2
0.083
2048
1,76
4
0.167
1024
3.52
8
0.333
512
7.04
16
0.667
256
14.08
32
1.333
128
28.16
64
2.667
64
56.32
128
5.333
32
112.64
256
10.667
16
225.28
512
21.333
8
450.56
1024
42.667
4
901.12
2048
85.333
2
1802.24
4096
170.667
1
3604.48
8192
341.333
Table 2-2. Sample Rate vs. Recording Time
Recording continues in this way until the battery becomes low or recording stops. For convenience in data
analysis, the recording interval takes on values of fifteen minutes, one half-hour, one hour and so on.
Since there is automatic scaling, time extension recording is practically transparent for the user. For best
results, stop the recording when the measurement is completed, both to avoid including unwanted
information in the plot, and to provide maximum resolution for the period of interest.
9
MAIN COMPONENTS
Fixing tab
Push button
LED
Indicators and Buttons
See figures 2-4a and 2-4b
The Logger has only one button and one indicator.
Both are located on the front panel.
PRESS
1 V max.
INPUT
The button is used to start and stop recordings and
to switch the data logger on and off. The red LED
indicates the status of the digital Logger: OFF,
STANDBY, RECORDING or OL.
IEC 1010 600V CAT III
1 V RMS
RS-232
2.4
SIMPLE LOGGER™
RMS CURRENT MODULE L100
Inputs
Fixing tab
RS 232 interface
Figure 2-4a
Indicator
Push button
RS 232 interface
Figure 2-4b
Inputs and outputs
For Lxxx models, the left side of the data logger incorporates input connectors compatible with the
sensors for which your Logger was designed.
See table 2-3 for a further description of the input specifications and the connector system for the model
you purchased.
The RS 232 interface is located on the right side for the Lxxx model and on the front panel for the C.A
601 clamp..
10
Mounting (model Lxxx)
Your Logger is equipped with clearance holes in the base plate tabs for mounting. See figure 2-4a for
location. For less permanent mounting, the Velcro pads (supplied as accessories) can be attached to
the data logger and the surface to which the data logger will be mounted.
Battery installation
Under normal conditions, the battery will last up to a year of continuous recording, unless the logger is
re-started very frequently.
In the OFF mode, the logger puts almost no load on the battery.
Use the OFF mode when the logger is net in use, and replace the battery once a year in normal use.
If the logger will be used at temperatures below 0° C or is frequently turned on and off, replace the
battery every six to nine months.
See § 5.1 Replacing the battery
2.5 Specifications
2.5.1 Model Lxxx:
■ Number of channels: 1
■ Input: See table 2-3
■ Resolution: See table 2-1
■ Accuracy*: 1% of reading ± resolution (L 600 and L 605 models: see § 7.1. Appendix)
■ Sample Rate: 4096/h maximum
■ Data Storage : 8192 readings
■ Storage Technique : Time Extension Recording (TXR’”)
■ Power supply: 9 V Alkaline NEMA1604, 6JF22, 6LR61
■ Battery Life :
Recording: up to 1 year for continuous recording at 25°C
Standby: > 1 year with fully charged battery
■ Input: RS-232 at 1200 baud via 9 pin “D” shell connector
■ Indicators : The red LED flashes twice every two seconds in Record mode, once every 2 seconds in
Standby mode, remains lit continuously in the event of overload and is off in OFF mode.
■ Controls : One membrane switch used to start and stop recording sessions and to switch the data
logger on and off
2.5.2 Model C.A 601
Difference compared with Lxxx models:
■ Input: 600 A rms
■ Input Connection
Clamp-on
■ Accuracy*: 2% reading ± 1 point (1-100A) (L 600 and L 605 models: see § 7.2. Appendix)
2% reading (100-400A)
5% reading (400-600A)
■ Resolution:
Scale
Maximum Input
Resolution
100%
50%
25%
12.5%
600 A rms
500 A rms
250 Arms
125 A rms
4 A rms
2 A rms
1 A rms
0.5 Arms
* Reference Conditions: Accuracies are given at a temperature of 23°C ± 5C, 45% to 75% RH, 9 V
battery, Earth’s DC magnetic field, no AC Magnetic Field, no external electric field, sine wave 50/60 Hz.
11
2.5.2 Climatic specifications
■ Operating temperature: -20 to +70° C
■ Storage temperature: -20 to +80° C
■ Relative humidity: 5 to 95% non-condensing
■ Temperature Influence : max. 5 points
2.5.3 Mechanical specifications
■ Lxxx models:
- Size: 73.0 x 58.75 x 41.27 mm
- Weight: 140 g
- Mounting: Base plate holes or Velcro pads supplied as accessories.
■ Model C.A 601
- Size: 76.2 x 235 x 38.1 mm
- Weight: 400 g with its batteries
Model
Input
Impedance
Input
connectors
Applications
L 100
0...1 V~
60 kΩ
2 banana safety
sockets Ø 4 mm
Measurement of AC current via probes
with an output voltage of 1 V AC max.
L 110
0...1 A~
1Ω
2 banana safety
sockets Ø 4 mm
Measurement of AC current via probes
with an output current of 1 A AC max.
L 230
0...300 V~
2 MΩ
2 banana safety
sockets Ø 4 mm
Direct AC voltage in the Logger
L 260
0...600 V~
2 MΩ
2 banana safety
sockets Ø 4 mm
Direct AC voltage in the Logger
L 600
-20...+70°C
N/A
None
Integrated thermistor for measuring
ambient temperature
L 605
-20...+70°C
N/A
None for
the interior
Internal: Integrated thermistor for
measuring ambient temperature
Stereo jack socket
3.5 mm for
the external probe
External: temperature measurement using
an external thermistor element.
The element must possess 2 wires - type
440006 or 440031 (10 kΩ at 25°C)
Clamp-on
Clamp for AC
-20...+100°C
C.A 601
600 A
N/A
Table 2.3. Input ranges and specifications
12
2.5.4 Compliance with international norms
Lxxx: IEC 61010-1
L 601: IEC 61010-1 and IEC 61010-2-032
Casing pollution level: IEC 529
Protection against mechanical impacts: NF EN 50102
2.5.5 Electrical safety (as per IEC 1010-1)
Insulation
Operating voltage
Installation category
Pollution level
L100
Model
Dual insulation
600 V
III
2
L110
Dual insulation
600 V
III
2
L230
Dual insulation
600 V
III
2
L260
Dual insulation
600 V
III
2
L600
Dual insulation
30 V
III
2
L605
Dual insulation
30 V
III
2
C.A 601
Dual insulation
600 V
III
2
2.5.6 Electromagnetic compatibility
■ Emission (as per EN 50081-1)
■ Susceptibility (as per EN 50082-2)
2.6 Data storage function
2.6.1 Starting a recording session
The mode of operation of the logger (RECORD, STANDBY or OFF) is controlled by a button marked
<Press> on the logger front panel and indicated by a red LED to the right of the button. It is not necessary
to configure the logger in preparation for a recording session.
■ Lxx model
To record data, do the following :
1. Connect the external sensor to the input terminals (exception model L600 which has a built-in
temperature sensor).
2. Mount the data logger in its desired location.
3. Place the sensor in service in the environment to be measured.
4. Make sure the logger is in its OFF mode (indicator light not blinking). If the logger is active, press and
hold the button for at least 5 seconds to turn the logger off.
5. Press the button again momentarily to start recording.
The light will make double blinks. Check the light to confirm that the logger is operating.
■ C.A 601 Model
1. Make sure the logger is in its OFF mode (indicator light not blinking). If the logger is active, press and
hold the button for at least 5 seconds to turn the logger off.
2. Position the jaws of the C.A 601 model around the conductor to be measured. Be sure that the
positioning of the C.A 601 allows the jaws to close firmly before beginning the recording session.
3. Next, press the push-button on the front of the unit to begin the recording session. The indicator light
will double blink to indicate that the recording session has started.
13
2.6.2 Ending a Recording Session
To stop recording, press the button for less than a second. The blinks will change from double to single.
The input cable may be disconnected at this time. In the case of AC measurements, disconnect the
probe or clips from the source of measurement before removing the cable from the data logger.
The logger is now in its STANDBY mode. The data will be retained, and may be transferred to your
computer at any time. When you no longer need the data in the logger’s memory, press and hold the
button for five or more seconds. This will shut down the microprocessor and greatly conserve battery
power. When the logger wakes from the OFF mode, it will clear its memory.
2.6.3 Recovering lost data
Normally, the logger clears the portion of its memory that deals with timing and scaling when it wakes
from the OFF mode.
If you need to recover data from a logger that has been turned off, press the button three or four times
in rapid succession. This will cause the logger to skip clearing its memory and go directly from OFF into
the STANDBY mode. You can then download the data using the normal procedure. However, when the
logger was in the OFF mode, its clock was not running.
To have the time scale on the data correct, use the “Time Set” function in the Simple Logger software to
set the program’s time back by the period (recording end date and time) that the logger was turned off
before downloading the data. (If you woke the logger immediately before downloading the data, set the
program’s time to the time the logger was turned off.)
2.6.4 Downloading Recorded Data to your Computer
The manual for your computer should indicate where to find the serial port and which COM designation
it has. If your computer has a 25-pin serial port rather than a 9-pin port, you will need to get a 25-to-9-pin
adapter If your serial port is being used by your mouse, it will be necessary to disable the mouse driver
and operate the software using the keyboard (see precautions 2.7).
Serial cable
Simple
Logger
Computer
Keyboard
Figure 2.6. Connecting The Data Logger To The Computer’s Serial Port
14
2.7
!
Precautions
1. Since the instrument case is designed in accordance with the safety norms (RS 232 galvanically
insulated), it is possible to download the data while the instrument is operating. However, for
greater user safety, we advise against this.
2. Keep the logger dry.
3. Avoid condensation, which can occur when the logger is moved from a cold environment to a warm,
humid environment.
4. Avoid plugging in or unplugging the input cable when the logger is recording. Doing so could interfere
with the automatic scaling of the logger.
5. The Simple Logger ™ Model L600 has a precision internal thermistor used for recording temperature.
The internal temperature detector is perfectly adapted to measuring internal and external temperatures
over long periods. It is not recommended for applications requiring detection of short-term or rapid
temperature variations. Use Model L605 which allows the use of an external probe for these short
term applications.
3. SOFTWARE
3.1
License Agreement
This non-exclusive License gives you the right to use and display this copy of the software. You own the
disk on which the software is shipped on a read-only medium. You are not permitted to copy the software
beyond the installation of the software. This License allows you to use the software on a single computer
at a single location at any one time.
3.2
Minimum Computer Requirements
■ Processor : 386
■ Ram Storage : 4 Mb
■ Hard Drive Space : 100 Kb for the application
approximately 200 Kb for each stored file
■ Environmental conditions: Windows3.1 or Windows 95
■ Port Access : 1 serial port used to down-load separate from mouse use
1 parallel port for printer support
3.3
Installation
Your Logger software is supplied on a single 3 ½" floppy disk. To install the program on your Windows
based computer proceed as follows:
■ Windows 3.1 Systems
1. Insert the floppy disk containing the Logger software in your computer’s floppy drive (usually Drive
A).
2. From the Program Manager select “File” on the command line.
3. Next select “Run” from the pull-down menu and type a:setup in the dialog box. Click on “OK”.
4. The setup program will temporarily load onto your computer.
5. Next the setup program will offer C:\SIMPLOG as the location where the software will be installed.
Click on “Continue” to use this directory or type in a new name then click on “Continue”.
6. A bar graph will appear showing the progress of installation. When installation is complete, a message
screen will appear stating that the program has been installed. Click on “OK”. You are now ready to
use the Logger software.
15
■ Windows 95 Systems
1. Insert the floppy disk containing the Logger software in your computer’s floppy drive (usually Drive
A).
2. Click on the “Start” button on the bottom left side of the screen.
3. Next select “Run” from the menu and type a:setup in the dialog box. Click on “OK”.
4. The setup program will temporarily load onto your computer.
5. Next the setup program will offer C:\SIMPLOG as location where the software will be installed. Click
on “Continue” to use this directory or click on “Browse”, type a new name and then click on “Continue”.
6. A bar graph will appear showing the progress of installation. When installation is complete a message
screen will appear stating that the program has been installed. Click on “OK”. You are now ready to
use the Logger software.
3.4
Getting started
To begin using the Logger software follow the instructions below for the Windows system you have.
■ Windows 3.1 Systems
To begin using the Logger software follow the instructions below for the Windows system you
have.
1. Double click on the Simple Logger program group to open it.
2. After the Simple Logger program group is on screen, double click on the Simple Logger Icon to start
the program.
3. It will look like this:
4. The screen in figure 3-1a will appear.
■ Windows 95 Systems
1. Click on the “Start” button. Then select “Programs”
2. Next select the directory where the Simple Logger software is stored. This is called SIMPLOG if you
used the default setting during installation.
3. Next click on the Logger icon in the SIMPLOG directory. It will look like this:
4. When the program is running without being connected to a digital logger and with no files open, your
screen will look like figure 3-1a.
Figure 3-1b shows a typical screen with a file open and a logger connected.
16
Figure 3-1a. Main Menu Screen
Figure 3-1b. Main screen with a graph on the screen
and a digital logger connected.
17
This screen is considered the main menu. Figure 3-1b also points out all the major areas of this screen
for your convenience.
The second line is called the command line. Seven choices are available on this line.
They are :
File, Time Set, Download, Port, Function, Date Frmt and Help
Note: The “Function” command will only appear if a data logger is connected.
Each of these commands and its subordinate functions will be described in order in this section.
When you click on one of these commands, a sub-menu will appear in most cases. Some of the choices
in the sub-menus will be inactive depending on where you are in the program. Inactive choices will
appeared greyed out.
3.5
The menu system
A menu tree is shown below to assist you in finding your way through the program.
File
Time Set
Download
Save as .TXT
Open
Print Graph
Print Data
Graph to Clipboard
Scaling (4..20 mA, 0..100 mV, 0..10 V)
Baud rate (communication speed)
Exit
Month
Day
Year
Hour
Minutes
Seconds
Go to Com Port selection or Date
& Time Depending on need
(go to Communication Port selection
or Date & Time as you require)
Date Frmt
Help
Port
USA
Europe
Contents
Search
About
Com 1
Com 2
Com 3
Com 4
No Logger
3.6
Function
Depending on the model, used
to select the factor and the scale
File
The FILE menu provides four
options for plotting and
saving data. Each will be
described below.
See figure 3-2 for the File pulldown menu.
Figure3-2. The File Menu
18
■ Save as .TXT
To save the data for analysis by a spreadsheet program or for later display by the Logger software, select
“Save As .TXT” from the “File” command. In the dialog box that opens, give the new file a name. Up to
eight characters are allowed. The file extension .TXT will be added automatically. The status box at the
bottom right of the graph will change from “unsaved” to “saved” and its colour will change from yellow to
green.
The resulting file can be imported into most spreadsheet programs. It has comma separators, and it has
the date and time expressed as a number in the format that is common among spreadsheet programs.
Within the spreadsheet program, you can format the date and time column as date or time or both date
and time, or you can copy it into a second column to display both date and time separately.
See Appendix A for assistance on importing data to a spreadsheet.
NOTE: The Zoom function does not affect recording of the data. The complete recording is saved, even
if part of it is not displayed in the graph at that moment.
■ Open
To retrieve a stored file, select “Open” and then select the required file in the list of files in the dialog box.
Double click on the file or highlight the file and click on “OK” to open it. The graph will then be drawn on
screen.
Figure 3-3 on the following page shows a typical graph. A margin will exist at the front and back ends of
the graph. This is to let you see the beginning and end of the graph without vertical grid lines covering
up the data.
NOTE: It may not be possible to open files that have been altered and re-saved by other software. After
retrieving a file, it is possible to change its title and its units, but it is not possible to change its time scale.
Figure 3-3. Open File On Screen
19
■ Print Graph
To print the graph that appears on the screen, select “Print Graph” and make the appropriate choice in
the Graph Format dialog box that appears.
Figure 3-4a shows the available choices. Selecting “Yes” will print the statistics and annotation fields
underneath the graph on the printout. Selecting “No” will exclude this information in the printout. Selecting
“Cancel” will cancel printing.
Figure 3-4a Graph Format Options
After selecting Yes or No, a print dialog box will appear. Make any necessary changes and then select
“OK” to print. Figure 3-4b shows a typical printout excluding the statistics and annotations.
Figure 3-4b Typical printout
of a graph without the statistics
20
■ Print Data
To obtain a tabular listing of the data, select “Print Data”. The listing gives the date, time, value and units
for each reading. To save paper, the data is printed in small type, five columns to a page. A list may
contain from three to five pages. Here is an example of a printout with two data lines.
■ Graph to Clipboard
To place the graph in a document, select “Graph to Clipboard‘’. The graph is placed in the Windows
clipboard. From there, it can be pasted into another graphic application such as PowerPoint or Freelance.
■ Scaling
1. Scale And Engineering Unit Programming *
The data logger Models L320, L410 and L430 allow the operator to program the values for scale and
engineering units from within the software. This permits the user to display the recorded data on the
graph or in the tabular listing directly, in the units appropriate to the measurement, rather than
mathematically converting a voltage or a current to the proper scale and value after the graph is displayed.
Scales can be programmed from two locations in the software, the File menu and the Scale menu. To
create a library of scales to use with DC volt and DC current loggers, use the File menu. This will allow
the user to select a number of predefined scales. To create scales for loggers connected to the serial
port for downloading, use the Scale menu.
The Simple Logger software allows the operator to define up to 17 points along the scale for DC current
measurement type data loggers.
Any combination of points may be used to create the scale which allows the user to plot both linear and
non-linear data. (See Figures 3.5 and 3.6)
Fig 3.5
* Software version 4.0 or higher is required for this feature
21
Fig 3.6
2. Creating A Library of Scale
From the main menu, select File and then Scaling. Select the
type of logger to be scaled from the choices presented. (See
Figure 4) A window similar to Figure 5 will appear as soon as
you make your selection. This window shows the programmable
scale points and the programmable units field.
Fig 3.7
22
The left side of the screen provides the scale and unit programming while the right side displays the
profile of the programmed scale in relationship to the actual input to the data logger.
Scale values entered here will not effect the current graph should one be on screen. This window is
strictly for creating templates to be used at a later date with newly downloaded loggers.
Creating and storing the scales and units here will save you time later on, especially for frequently used
scale settings. Two buttons are available from within this window, "Clear All" and "Close". The "Clear All"
button will clear all scale numbers entered and any units entered allowing you the opportunity to start
over again.
The "Close" button will bring you back to the main menu without saving the data. To enter a scale value
in any of the slots, click on the slot and type in a number up to 5 characters in length. The minus sign and
decimal point can be used as a valid character (e.g. –10.0 would be a valid 5 character number).
As you enter numeric data in the scale slots, the scale profile will appear on the small graph in the right
side of the window. Both linear and non-linear profiles are acceptable.
Once the scale is defined, click in the Units box to program the engineering units to be displayed on the
graph. Up to 5 alphanumeric characters may be typed in this box (e.g. PSIG or GPM etc.).
After all the data is entered and you are satisfied with the template, click on File at the top left side of the
window. A small window will drop down with three choices, Open, Save and Print.
- The "Open" choice is used to retrieve a previously stored template.
- The "Save" choice is used to save the current template you just created for future use.
- The "print" choice lets you print a copy of the scale and unit programming window as seen on screen.
3. Creating a scale for use with the Logger connected to the serial port
Connect the data logger to the computer’s serial port for downloading. See § 3.8 for downloading
instructions.
Once the proper port is selected, data will appear in the update box at the top right hand side of the
screen. This is an indication that the software has made connection to the logger. The Scale command
will also appear on the task bar if the data logger detected allows scale and engineering unit programming.
To program the scale and units,
click on "Scale". A screen similar
to Figure 6 will appear. The left
side of the screen provides the
scale and unit programming
while the right side displays the
profile of the programmed scale
in relationship to the actual input
to the data logger.
23
The operator may set the scale by programming as few as two points, the low end and the right end, or
by entering as many points as necessary to define the scale up to 17 points for the 4-20 mA logger and
up to 11 for the DC volts loggers.
The points entered do not have to be linear but should be an accurate representation of the relationship
of the DC signal to the scale points.
To enter a scale value in any of the slots, click on the slot and type in a number up to 5 characters in
length. The minus sign and decimal point may be used as valid characters (e.g. –25.4).
Once the scale is defined, click in the "Units" box to program the engineering units to be displayed on the
graph. Up to 5 alphanumeric characters may be typed in this box.
If you wish to clear the entered data and start over, click on the "Clear All" button. The scale and unit
information will be cleared from the screen.
Once you have entered the correct scale and unit data, click on "OK" to proceed.
The screen below will appear giving you the opportunity to save the entered data for future use.
- Click on "Yes" to save or "No" to bypass saving the data and use one time only.
- If you click on "Yes", a dialog box will open similar to this figure where you can type in the name you
wish to use for the file. Type in up to 8 characters,
- Click on "OK" to save the file and plot the graph with the new scale and unit data.
- Click on "Cancel" to discard it and return to the scale and unit programming screen.
■ Language
Used to choose the language of the software.
■ Baud rate
Defines the communication speed between the PC and the logger (all models except L 610, L 620 and
L 630: enter 1200)
■ Exit
The “Exit” command will take you out of the Logger program and return you to the Windows program
manager or other open programs. This command will appear in several menus within the program. To
select it, place the pointer on the exit button and click on it.
24
3.7
Time Set
The software uses your computer’s clock as a reference for time stamping the data.
If your computer’s clock is incorrect, you can set it by using the Windows Control Panel. The “TIME SET”
menu option allows you to adjust the time that is used without altering the setting of your computer’s
clock. This is useful if the logger has been recording in another time zone, and when you must recover
data from a logger that has been turned off. As a reminder, the “TIME SET” menu appears automatically
the first time you download a logger during a session.
If you do not need to change the time setting, clear the menu by clicking “OK” or pressing “Enter’’.
To change any value, simply click on the up or down arrow next to the value box that you want to change
(see figure 3-8). The up arrow will increase the value by one. The down arrow will decrease the value by
one.
Figure 3.8 Time and Date Selection
Example: To change the month from December to January, click on the up arrow next to the month
value box to change the number from 12 to 1.
When you have changed all the values to obtain the required date and time, click on “OK”. You can also
click on “Cancel” at any time to leave the date and time unchanged.
25
■ Setting Time For Recovered Data From a Data Logger in OFF Mode
When a data logger is turned off, it loses all trace of the time. You must use the “Time Set” function to
correct the time if you are recovering data from a logger that was switched off accidentally.
Figure 3-9 will help you see the relationship between time tracking and the off mode of Logger.
The time duration that the data logger is off needs to be reset in the Logger software in order for any data
in the loggers’ memory to be graphed with the correct time scale. When you download this data, use the
“Time Set” command to back the dock up by the duration of the off time (7 hours for the example shown
in figure 3-6). Stated another way, set the time to the time when the data logger was turned off. If this
time is unknown, you will have to estimate it.
Make it a habit to systematically download the data recorded before switching off the data logger.
To establish the correct time on the graph, use the Time Set command and set the time back from its
current reading by 7 hours
7 Hours Off
8 Hour recording
Beginning of recording session
in STANDBY mode
Recorder Off
Recorder On
To establish the correct time on the graph, use the Time Set command
and set the time back from its current reading by 7 hours
Figure 3-9. Recording vs. Off Time
If it is not possible to download the recorded data right after the session has ended, leave the data
logger in STANDBY mode until you have the opportunity to download. In this way, the time will not need
to be reset.
This procedure of resetting the time is only needed if you are going to recover data from a data logger
that has been turned off or you are crossing into another time zone.
3.8
Downloading
It takes approximately 60 seconds to transfer the data when the logger’s memory is full. During this
period, the logger cannot record and its clock does not function. Consequently, if timing is critical, it is
recommended not to transfer data while the logger is recording.
26
■ To transfer data from the logger:
1. Select “DOWNLOAD”. The computer will re-read the logger’s configuration information and then read
the data from its memory. It will then plot the information on the screen where it may be analysed,
annotated and saved to disk as needed. Each of these functions will be discussed later in this
chapter.
2. If the units displayed on the graph do not correspond to the parameter that was recorded, make the
appropriate change using the “FUNCTION” menu.
3.9
Port
When you start the Logger software, a window will appear asking you to tell the computer where the
logger is connected. If you have previously used the Logger with your computer, the default selection will
be the port that the logger was connected to at that time. It is necessary to direct the Logger software to
the right serial port on your computer where the data logger is connected in order to download and graph
data.
Figure 3-10 shows the available choices. To select a serial port, click on “Port” in the main menu and then
click on the required port “Com port 1, 2, 3 or 4” and click on “OK”. It becomes the default port for all
subsequent downloads until you change it again. If you only wish to review data already stored on disk,
select “No Logger’’.
Note: Selecting “CANCEL” here will take you out of the program entirely.
Figure 3-10 Com Port Selection
If the logger does not respond to the computer, or if communication is unreliable, there may be a conflict
between the Logger software and software that is using another port which is served by the same
interrupt request (IRQ). Normally, lRQ4 serves ports COM1 and COM3, while lRQ3 serves ports COM2
and COM4. If you experience difficulty with communication between the logger and your computer,
check to see what device, if any, is using the COM port that shares an interrupt request with the logger.
27
You may need to disable that device when the logger is connected.
Once on line with a data logger, you will see data logger information in the upper right side of the screen.
The information will include:
first data point, last data point, sample rate, number of data points, logger ID number and com port in
use, and current data point.
Figure 3-11 shows a typical display. To obtain the mot recent data from the logger, click on the “Update”
button. The data displayed on the screen will be updated.
Figure 3-11 Data Logger Update
3.10 Function
The “Function” command allows you to select the correct engineering units for the recorded data. When
you click on “Function”, a pull-down menu appears. It proposes all the available choices compatible with
the version of the software that you have installed. This menu will only appear if a data logger is connected
to the COM port. Simply click on the desired group and then select the proper units from the window that
opens. Depending on which type of logger is connected, the pull-down menu under “Function” may be
empty. You will be returned to the main screen and the graph Y axis scale will be recalculated using the
choice you made here. Future downloads will use the units selected here for graphing as well. Figure 312 shows the selections for current outputs.
The data logger communicates to the software its basic configuration. Therefore, you will only be offered
choices that are compatible with the data logger.
28
Figure 3-12. Choosing a Scale in the “Function” Menu
If the logger’s input is no longer connected as it was during recording, the current displayed value may
non be meaningful. You can specify the function before or after downloading the data, but you must
specify it before saving the data.
3.11 Date Frmt
The” Date Format” command is used to select the way the date and time will be displayed on the graph.
The choices are USA and Europe
■ USA = Month/Day/Year and a 12 hour clock
Example: 11/22/96 03:31:24 PM
■ Europe = Day/Month/Year and a 24 hour clock
Example: 22/11/96 13:31:24
To select a date format, click on “Date Frmt” from the main menu then click on the desired choice of
“USA” or “Europe”. The date and time which appears at the top left of the screen will change to reflect the
selection made here.
3.12 Help
The HELP command allows you to view topics from within the manual on screen.You can select “Contents”
to view sections of the manual or select “Search” to type in a word or phrase and go directly to it. A third
choice called ‘’About” will show you the revision level of the software and CHAUVIN ARNOUX address
and phone numbers.
29
3.13 Examining Data
Once a graph is on screen, several annotating and analysis choices are available to assist you in
viewing the data. These include:
■ zooming in on sections of the graph
■ unzooming back to the original graph
■ entering a title for the graph
■ entering pertinent information about the graph
■ viewing trace statistics
■ finding the date, time and value of any point on the graph
3.14 Zoom function
It is possible to zoom in on a portion of the graph.
■ Place the cursor at one corner of the area of interest.
■ Press and hold the left mouse button while dragging the mouse. A dotted box will appear as you
move the mouse.
■ Stretch the box to enclose the area of interest.
■ Release the left mouse button when the box includes the entire area of interest. The computer will
then re-draw the graph, showing only the area within the box. To assist you in starting the selection of
the zoom area, the time and value of the cursor position will appear in the upper right side of the
screen. See figures 3-13a and 3-13b for examples.
■ To return to the original graph, click on the “Unzoom” button at the bottom of the graph.
NOTE: If portions of the trace are excluded by the zoom box, they will not appear on screen when the
graph is redrawn.
Figure 3-13a Section of Graph Selected for Zooming
At the bottom left of every graph is a button entitled “Annotate”. If the graph has been zoomed up, a
second button called “Unzoom” will appear. The unzoom function has been discussed previously.
30
Table 3-13b. Zoom on part of a graph
31
■ Annotate
This function allows you to type in a title that will appear at the top of the graph. It also allows for six lines
of data that can be typed in to assist you in detailing the recording.
Information about the customer’s name address and phone number could be entered for example or
conditions for the recording itself might be added. Figure 3-14 shows these fields.
To access them, simply click on “Annotate”. A dialog box is displayed. Twenty five characters is the
practical limit in all fields although more are allowed. When all the desired data is typed in, click on “OK”
to save it or “Cancel” to discard it. The Title will appear at the top left side of the graph. The other
information will be printed when the graph is printed if you so choose.
When you select “Print Graph”, you will be asked if you want to print the graph description as well. Select
“Yes” to include this information, ‘’No” to exclude it or “Cancel” to exit the print request altogether. Printing
the description will also include the graph statistics. Both will print underneath the graph on the page.
Table 3.14 Title and Data Dialog Box
32
3.15 Graph Statistics
Statistics about the graph on screen are always displayed at the bottom of the screen. The statistics that
are displayed are Max, Min and Average values of the data on screen as well as the number of data
points in the trace. These statistics will change with the zoom window to reflect just what is visible on
screen. See figure 3-15.
Figure 3.15. Statistics Box At Bottom Of Graph
■ Finding Data Points on the Graph
One other analysis function provides valuable insight into all the data on screen by cursor location.
Simply drag the mouse along the graph and you will be able to view the date, time and value of the
cursor position as shown in figure 3-16.
Figure 3-16. Cursor Position Statistics
33
3.16 Appendix A: lmporting ‘’.TXT Files’’ from the Logger into a spreadsheet
■ Opening a Logger.TXT file in Excel
The following example used Excel version 7.0 in a Windows 95 environment.
1. After opening the Excel program, click on the icon to open a file or select “File”” from the command
line and then select “Open’’
2. In the dialog box that appears, in the field that is labelled “Look In” , select the directory where your
Logger .TXT files are stored. This will be called SIMPLOG if you accepted the default choice offered
by the Logger installation program.
3. Next change the file type to “Text Files’’ in the field labelled Files of Type: All the .TXT files in the
Logger directory should now be visible.
4. Double click on the desired file to open up the “Text lmport” Wizard.
5. Review the selections in the 1st wizard screen to be sure that the following choices are stated:
- Original Data Type : Delimited
- Start lmport at Row: 1
- File Origin : Windows (ANSI)
Click on the box(es) that need changing and make the appropriate selections.
6. Click the “NEXT” button at the bottom of the Wizard dialog box to move to step 2.
7. Click on “Comma” in the “Delimiters” box. A check mark should appear.
8. Click the “NEXT” button at the bottom of the Wizard dialog box to move to step 3.
9. A view of the actual data to be imported should appear in the lower part of the step 3 wizard dialog
box. Column 1 should highlighted. In the Column Data Format window, select ‘’Date’’.
10. Next click on “Finish” to complete the process and lmport the data.
11. The data now appears in your spreadsheet in two columns preceded by information indicating the
version of the firmware, the number of counts memorized , the logger model and a non-significant
number. Columns A and B are identical to those presented in figure A-1.
This line indicates the number of the digital logger in column A and the units in
column B.
Column A contains the date and time, while column B contains the data.
Figure A.1. Sample
Data imported into
Excel
34
■ Formatting the Date and Time
Column A contains a decimal number that represents both date and time. Excel can convert this number
directly as follows :
1. Click on the A at the top of the column. The entire column should be highlighted.
2. Next click on “Format” and select “Cells’’ from the pull-down menu.
3. In the dialog box that opens, click on “Date”.
4. Next select the date format you desire and click on “OK” to reformat the column.
5. Click on the B at the top of the column. The entire column should be highlighted.
6. Next click on “Insert” and select “Columns” from the pull-down menu.
7. Next click on the A at the top of column A to select the entire column. Then click on “Copy Icon” to
copy the whole column.
8. Move your cursor into cell 1 of column B and then click on “Paste Icon” to insert a duplicate of column
A into column B. This is necessary if you want to show date and time.
9. Next click on “Format’’ and select the “Cells” from the pull-down menu.
10.In the dialog box that opens, click on “Time”.
11.Next click on the format you desire and click on “OK” to reformat the column.
Figure A-2 shows a typical spreadsheet with date, time and value displayed.
It will be necessary to change the column width to see all the data.
Figure A.2. Spreadsheet formatted with Two Columns
Displaying the Date and Time in One Column
35
■ Opening a Simple LoggerTM .TXT file in Lotus 123
The following example used Lotus 123 version 5.0 in a Windows 95 environment.
1. After opening the Lotus 123 program, click on the icon to open a file or select “File” from the command
line and then select ‘’Open”.
2. In the dialog box that appears, in the field that is labelled File Type: Select “Text”. Then change the
directory to the directory where your Logger .TXT files are stored. This will be called SIMPLOG if you
accepted the default choice offered by the Logger installation program.
3. All the .TXT files appear in the window. Double-click on the file that you want to open or highlight it
and click on “OK”
4. The data will now appear in your spreadsheet in two columns. Column A and B will look similar to that
shown in figure A-3 below.
Figure A-3. Data Imported into Lotus 123
Column A contains a decimal number that represents both date and time. Lotus can convert this number
directly as follows :
1. Click on the B at the top of the column to select the entire column.
2. Next select the “Edit” command and then select “Insert” to add a new column B to the file.
3. Next click on the A at the top of column A to select the entire column. Then click on “Copy Icon” to
copy the whole column.
4. Move your cursor into cell 1 of column B and then click on “Paste icon” to insert a duplicate of column
A into column B. This is necessary if you want to show both time and date.
5. Next click on the A again at the top of column A to select the entire column. Then select “Style”,
followed by “Number Format’’.
6. Next select the date format you would like to use from the choices within the dialog box that opens.
7. Next click on the B again at the top of column B to select the entire column. Then select “Style”,
followed by “Number Format’’.
8. Next select the time format you would like to use from the choices within the dialog box that opens.
Column A and B should now display date and time respectively while Column C displays the value, as
shown in figure A-4.
36
Figure A.4. Reformatted Data Showing
the Date and Time Columns
3.17 Appendix B : Troubleshooting
■ Symptom : After being in a damp, cold environment, the logger does not function.
Cause, Correction : Condensation may have formed inside the logger, shorting out the circuitry and
discharging the battery. Open the logger, remove the battery and allow the circuit board to dry thoroughly
in a warm location. Replace the battery with a new one.
■ Symptom : The indicator light is very dim.
Cause, Correction : The battery is low and should be replaced.
■ Symptom : The logger unexpectedly goes from the record mode to the standby mode.
Cause, Correction : Any of a number of conditions may have caused the logger to auto scale
beyond its range :
The input cable may not have been fully plugged in at some time during recording, causing a short at
the input connector.
A resistance or temperature input may have been shorted out.
An excessive voltage may have been applied to a voltage input cable.
■ Symptom : Temperature readings are decreasing when the actual temperature is increasing.
Cause, Correction : The temperature measuring probe is connected backwards. Reverse the leads
into the Simple Logger™.
37
4. GLOSSARY
In this section all terms that are peculiar to that data logger and software are listed along with a brief
definition for clarity. Some general terminology associated with the data collection process are listed
here as well for convenience. In many cases a more detailed description can be found in the general
body of this manual.
■ Baud - a unit of signal transfer speed equal to the number of elements per second.
■ Bi-Polar Inputs - The ability to accept both + and - inputs.
■ Button - An actual key on the data logger or computer keyboard or a soft key in the program on the
computer screen.
■ CMRR - Common Mode Rejection Ratio. Ability to measure only the difference between the input
conductors, while rejecting what these conductors have in common.
■ Com Port - the serial communications port on the computer used to accept the downloaded data
from the Simple Logger.
■ Cursor - A pointer or cross-hair that indicates the active position on the computer screen. It is usually
moved around with the mouse or arrow keys.
■ Data logger - a device used to sample and store electrical signals representative of physical
phenomena such as temperature, pressure and flow, for long periods of time in an unattended
environment.
■ Download - The process of transferring data from the Logger to the computer.
■ EEPROM - A storage device that can be electrically written to, erased and reused. The Logger uses
an EEPROM to store recorded data.
■ Greyed Out - A Windows software technique used to indicate that a particular function is not active
at that place in the program.
■ Hz - Hertz, a unit of measure of frequency equivalent to cycles per second.
■ I/O - Input/Output, a device or port capable of sending or receiving digital information.
■ NMRR - Normal Mode Rejection Ratio, the ability to filter out noise from external sources, such as ac
power lines.
■ Pointer - See Cursor
■ Port - A name given to any connector allowing input or output of information.
■ Processor - A computing device used to calculate and run a set of instructions.
■ Recording session - A recording session is defined as the time and data contained within the
starting and ending of a recording.
■ Resolution - The number of bits in which a digitized value will be stored. The Logger has 8 bit (28)
resolution.
■ RTD - Resistance Temperature Detector, a platinum element whose resistance changes with
temperature.
■ Thermistor - A resistive element generally made from semiconductor materials that produces a
large change in resistance for a small change in temperature.
■ Thermistor - A resistive element generally made from semiconductor materials that produces a
large change in resistance for a small change in temperature.
■ Thermocouple - Two dissimilar metals joined together, when heated produce an electrical signal
related to the temperature.
■ X Axis - The horizontal time axis of a graph
■ Y Axis - The Vertical scale axis of a graph
■ Zoom - The ability to select a section of the graph and magnify it for better readability.
38
5. MAINTENANCE
!
For maintenance, use only specified spare parts. The manufacturer will not be held responsible
for any accident occuring following a repair done other than by its After Sales Service or approved
repairers.
5.1
Changing the battery
Under normal conditions, the battery will last up to a year of continuous recording, unless the logger is
re-started very frequently.
In the OFF mode, the logger puts almost no load on the battery.
Use the OFF mode when the logger is net in use, and replace the battery once a year in normal use.
If the logger will be used at temperatures below 0° C or is frequently turned on and off, replace the
battery every six to nine months.
!
Before any intervention:
■ Lxxx models: Disconnect all the leads from the Logger
■ C.A 601 : The clamp must not clamp any conductors
1. Make sure your logger is turned off (no light blinking).
2. Turn the data logger upside down.
- Remove the four Phillips head screws from the base plate of the data logger and take off the base
plate (Lxxx models)
- Remove the captive screw on the battery compartment (C.A 601)
- Remove the old battery
3. Connect up the new battery
4. Once the connector is plugged onto the battery,
insert the battery into the holding clip on the circuit
board as shown in figure 5.1 for the Lxxx model
or in its compartment for the C.A 601.
5. Refasten the flap onto the housing using the four
screws for the Lxxx model or the captive screw
for the C.A 601.
Your data logger is now ready for use.
!
Note: For long term storage, remove battery to
prevent discharge effects.
Note: The product may switch to record mode as
soon as the battery is fitted. If this occurs, press the
pushbutton for over 5 seconds to reset it to Off.
5.2
Figure 5.1. Replacing the batteries
on Lxxx models
Cleaning
■ Clean the logger with a cloth dampened with soap and water when necessary.
■ Take precautions not to get the inside of the logger wet.
■ Dry before use.
39
5.3
!
Metrological verification
It is essential that all measuring instruments are regularly calibrated.
For checking and calibration of your instrument, please contact our accredited laboratories (list on request)
or the Chauvin Arnoux subsidiary or Agent in your country.
■ Repairs under or out of guarantee
Please return the product to your distributor
6. TO ORDER
L 100 - RMS current module (input : 0 to 1 V AC) ...............................................................
L 110 - RMS current module (input : 0 to 1 A AC) ...............................................................
L 230 - RMS current module (input : 0 to 300 V AC) ...........................................................
L 260 - RMS current module (input : 0 to 600 V AC) ...........................................................
L 600 - Temperature module (internal thermistor) ...............................................................
L 605 - Temperature module (internal thermistor and external thermistor) .........................
C.A 601 - RMS AC current logger ........................................................................................
P01.1569.11
P01.1569.16
P01.1569.21
P01.1569.26
P01.1569.31
P01.1569.36
P01.1568.02
Delivered with a digital data logger, a 3"1/2 diskette containing the Windows® software, an RS-232 cable
with 9-pin connectors at each end, a 9 V alkaline battery (NEMA 1604, 6JF22, 6LR61) and this user’s
manual.
Optional accessories and replacement parts
A variety of input cables and probes are available from CHAUVIN ARNOUX for monitoring AC current,
AC voltage, and external temperature. Several are listed below for your convenience.
■
Software, version 5.00 EU ......................................................................................... P01.1575.21
Current sensors for L100
MN 71 ammeter clamp (10 mA to 10 A)* .......................................................................... P01.1204.20
MN 13 ammeter clamp (500 mA to 100 A)* ...................................................................... P01.1204.06
C 107 ammeter clamp (100 mA to 1000 A)* ..................................................................... P01.1203.05
D 37N ammeter clamp (100 mA to 1000 A)* .................................................................... P01.1200.56A
AmpFLEX™ 45 cm flexible probe (500 mA to 100 A)* ......................................... P01.1205.03
AmpFLEX™ 45 cm flexible probe (500 mA to 1000 A)* ....................................... P01.1205.01
AmpFLEX™ 80 cm flexible probe (500 mA to 1000 A)* ....................................... P01.1205.02
AmpFLEX™ 120 cm flexible probe (500 mA to 10000 A)* .................................... P01.1205.09
■
Current sensors for L110
MN 09 ammeter clamp (500 mA to 100 A)* ...................................................................... P01.1204.02
Y1N ammeter clamp (4 A to 600 A)* ................................................................................. P01.1200.01A
C 103 ammeter clamp (100 mA to 1000 A)* ..................................................................... P01.1203.03
D 30CN ammeter clamp (1 A to 1000 A)* ......................................................... P01.1200.64
■
* Actual measurement ranges with product + associated sensor
Probes for L 600 and L 605
External 1.5m Thermistor Probe with epoxy bead ............................................................ P01.1575.17
External 1.5m Thermistor Probe with 4’’ stainless steel sheath. 4" .................................. P01.1575.18
■
40
7. APPENDIX
7.1
Error in the temperature range (L 600 and L 605)
Error in °C
Input temperature in °C
Range
1
2
3
4
5
41
7.2
Resolution (L 600 and L 605)
Range
Resolution in °C
1
2
3
4
5
Temperature in °C
42
07 - 99
Code 906 121 568 - Ed. 2
Deutschland : CA GmbH - Straßburger Str. 34 - 77694 Kehl / Rhein - Tel : (07851) 99 26-0 - Fax : (07851) 99 26-60
España : CA Iberica - C/Roger de Flor N° 293 - 08025 Barcelona - Tel : (93) 459 08 11 - Fax : (93) 459 14 43
Italia : AMRA CA SpA - via Torricelli, 22 - 20035 Lissone (MI) - Tel : (039) 2 45 75 45 - Fax : (039) 48 15 61
Österreich : CA Ges.m.b.H - Slamastrasse 29 / 3 - 1230 Wien - Tel : (1) 61 61 9 61 - Fax : (1) 61 61 9 61 61
Schweiz : CA AG - Einsiedlerstrasse 535 - 8810 Horgen - Tel : (01) 727 75 55 - Fax : (01) 727 75 56
UK : CA UK Ltd - Waldeck House - Waldeck road - Maidenhead SL6 8br - Tel : (01628) 788 888 - Fax : (01628) 628 099
USA : CA Inc - 99 Chauncy Street - Boston MA 02111 - Tel : (617) 451 0227 - Fax : (617) 423 2952
USA : CA Inc - 15 Faraday Drive - Dover NH 03820 - Tel : (603) 749 6434 - Fax : (603) 742 2346
190, rue Championnet - 75876 PARIS Cedex 18 - FRANCE
4473 89 - http://www.chauvin-arnoux.com
Tél. (33) 01 44 85 44 85 - Fax (33) 01 46 27