1
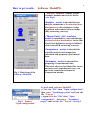
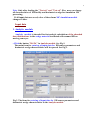
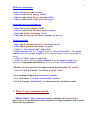
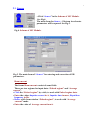
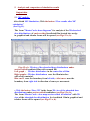
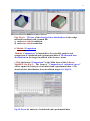
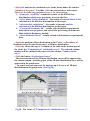
1
Software ModeDW for Quality Control
of Radiation Processing
User Manual
2
The software ModeDW (Modelling of Dosimetric Wedge)
The software ModeDW is the special modules of information system RT-Office 3 which
are used for computer modeling of dosimetric devices.
Software ModeDW is intended for modeling an EB 3-D dose distribution in dosimetric film
placed along the sloping surface between the two wedges made of an arbitrary materials.
The dosimetric wedge irradiate with scanned EB on industrial radiation facility that is based
on the pulsed or continuous type of electron accelerators in the electron energy range from 0.1 to
25 MeV.
Schematic representation of the EB facility used for simulation of the electron depth-dose
distributions in the dosimetric wedge with dosimetric films irradiated with scanned EB and on
moving conveyor is shown in Fig. 1.
In the Fig.1 two wedges are stacking together to form a rectangular block. Dosimetric
film is inserted along the sloping surface between the two wedges made of an arbitrary
materials. The rectangular block can be located under arbitrary angles relatively incident
electron beam axis.
Fig. 1. Model of the dosimetric wedge with
dosimetric film irradiated by scanned EB.
axis X - direction of EB incidence,
axis Y - direction of EB scanning,
axis Z - direction of conveyer motion.
Simulation of EB dose distributions in an irradiated films located in the wedge was
accomplished by the MC method in a tree-dimensional (3-D) geometrical model by the
programs ModeDW.
In accordance with the schematic representation of electron beam facility and heterogeneous
target presented in Fig.1 a source of electron beam including spectral characteristics, a scanner, a
conveyor line, an irradiated target are considered as uniform self-consistent geometrical and
physical models.
The physical model of an irradiation process in dosimetric wedge includes the following
principal elements: EB irradiator characteristics, the systems parameters which provide the
necessary spatial characteristics in radiation processing, radiation and physical characteristics of
irradiated product. Besides, the set of processes of interaction of ionizing radiation with wedge
material which are necessary for description of results with the established accuracy are included
in physical model at the theoretical analysis and computer modeling of ionizing radiation expose
on wedge.
The following processes of interaction of an EB with material and their modeling conceptions
were included in the physical model:
• electrons lost energy by two basic processing: inelastic collisions with atomic electrons and
bremsstrahlung;
• inelastic electron collisions with atomic electrons lead to excitation and ionization of the atoms
along the path of the particles (model of grouping of the transferred energy);
• emission of the secondary electrons (model of the threshold energy);
• electrons participated in elastic collisions with atomic nuclear lead to changes in the electron
direction (model of grouping of transferred pulse).
In the energy range of incident electrons from 100keV to 10 MeV and irradiated materials
with atomic number Z≤ 30, the model uncertainty is less than 5% for calculated dose and charge
depositions in the field of the basic EB energy absorption.
The 3-D dose distribution in an irradiated dosimetric films located in the wedge is represented
3
as a function of two coordinates: the film width along the scan direction (axis Z), and the film
length along conveyer motion (axis Y), the dose value integrated along film thickness (axis X).
Modeling of EB transport from the exit window of accelerator to the incident surface of the
irradiated target takes into account scattering of electrons in an air gap. The requirements for
computer modeling were chosen so that in selected range of absorbed doses the relative rootmean-square statistical error was less than 1%.
The software ModeDW provides the end-user with: data sets in the graphic and tabular form
for an absorbed dose within the dosimetric devices irradiated with a scanned EB; comprehensive
comparative analysis of output data; cognitive visualization of output data; decision of
optimization problems with using dynamic and statistical databases; presentation of physical and
operational characteristics for radiation processing.
Developed software can be used for the following problem tasks in radiation processing:
1. Determination of dependence of an absorbed dose distribution in a film as function of: density
and a chemical composition of film material; width and thickness of a film; geometrical
arrangement of a film in a wedge and stack; density and a chemical composition of a wedge and
stack materials; geometrical sizes of a wedge and stack; an orientation angle of a wedge and stack
relatively to incident electron beam.
2. Examination of dependence of an absorbed dose distribution in a film as function of: an EB
current and speed of a conveyer motion; an angular distribution of electrons in a beam; a spatial
distribution of electrons in a beam; a width of EB scanning; an angular characteristics of a scan
process; a time sweep of the scanner; an air gap between the scanner and a target.
3. The comparative analysis of visual and numerical difference of the depth-dose distributions in a
film for: various parameters of calculation; various calculation models; an experimental and
calculated depth-dose distributions in a film.
The feature of the software ModeDW are the following:
1. Built-in tools for statistical analysis.
2. Built-in tools for uncertainties estimation of results simulation due to uncertainties of input
data for radiation facility.
3. Estimation of uncertainties for physical models.
4. Comparison Modulus for visual and a numerical analysis of calculated and experimental data
and for decision of optimization tasks in radiation processing.
5. Built-in tools for processing of experimental dosimetric data and their comparison with
simulation predictions.
The software have intuitively clear graphical interface for the end-users with the following
features:
1. Detailed decomposition of input data for main elements of source and target (including
spectral characteristics for irradiation source).
2. Two levels for entering of input data via configuration files and manually.
3. Expert control for the range of input data and co-ordination for the set of geometrical and
physical input data.
4. Compatibility of export an input data to different modules.
4
How to get results.
Software ModeDW.
Software ModeDW consists of four
thematic modules and service blocks.
(See Fig.1).
•Analytic module is intended for fast
analytic estimations of the absorbed dose
distributions in the dosimetric wedge
irradiated with scanned electron beam
(EB) on moving conveyer.
• “Monte Carlo” (MC) simulation
module is intended for exact calculations
of absorbed dose distributions in the film
located into dosimetric wedge irradiated
with scanned EB on moving conveyer.
Comparison module is intended for
scientific analysis and comparison
calculated and prepared experimental
data.
Fig.1. Main form of the
Software ModeDW
Fig.2. Frames
"Open configuration”
Dosimetry module is intended for
preparing of experimental data.
This block allows to load data files, invert
and move each experimental curve, cut
and scale, transform to format of
Comparison module.
To work with software ModeDW • Click the "File" then "Open configuration",
then select "Irradiating system" and load the
file "Test.rts".
• Again click the "File" then "Open
configuration", then select , "Irradiated
target" and load the file "Test.rtt". SeeFig.2
5
Note. Only after loading the "Test.rts" and "Test.rtt" files, user can change
all characteristics of EB facility and dosimetric wedge for simulation EB
processing.
If all input data are saved, color of the scheme MC simulation module
changes to blue.
Input data
1. Analytic module
Analytic module is intended for fast analytic calculations of the absorbed
dose distributions in the wedge material irradiated with scanned EB on
moving conveyer.
• Click the button "DATA" in Analytic module. See Fig.1.
The main form for entering of input data for EB source parameters and
dosimetric wedge characteristics will be opened. See Fig.3.
Fig.3. The form for entering of input data for EB source parameters and
dosimetric wedge characteristics in the Analytic module.
6
EB Source parameters
•
•
•
•
Enter the Beam current in mA.
Enter a value of the Energy in MeV.
Enter a value of the Energy spread in MeV.
Enter a value of the Angle spread in degree.
Scan and conveyer parameters
•
•
•
•
Enter the Scan Frequency in Hz.
Enter a value of the Maximal Angle in degree.
Enter the Width of scanning in cm.
Enter the Moving rate of conveyer system in cm/sec.
Wedge materials
• Enter the Width and thickness of the target in cm.
• Enter the target material density in g/cm3.
• Click the "List of materials" with a tick.
• Select a material for the "Target" from the "List of materials". The atomic
number Z and the atomic weight A of the material appear in the corresponding
boxes.
• Click the "Mean values" with a tick.
• Enter the mean values of atomic number Z and the atomic weight A for
materials (compounds and mixtures) not given in the " List of material".
• Module Analytic provides a loading of saved data from the MC module.
To do it, Click the button "Load data from MC block" .
• After loading all input data in Analytic module,
Click the button "Save data and close this window".
• Click the button “Calculation”, to obtain analytic calculation results.
2. Monte Carlo simulation module
“Monte Carlo” (MC) simulation module calculates the absorbed dose
distributions in the film located into dosimetric wedge irradiated with scanned
EB on moving conveyer.
7
2.1. Source
• Click “Source” in the Scheme of MC Module.
See Fig.4.
The main form for Source – Electron Accelerator
parameters will be opened. See Fig.5.
Fig.4. Scheme of MC Module.
Fig.5. The main form of “Source” for entering and correction of EB
parameters.
Beam current
The frame Beam current consist of some fields.
There are two regimes for input data: “Pulsed regime” and “Average
current”.
• Click the “Pulsed regime” by a tick, to work with Pulsed regime data.
• Enter the values Impulse current in A, Impulse time in msec, Repetition
frequency in Hz.
• Delete a tick from window “Pulsed regime”, to work with “Average
current” mode.
• Enter the value of Average current in mA.
8
EB energy spectrum
Fields for EB energy are placed into the frame Spectrum.
• Click the field “MonoEnergy” with a tick, to work with MonoEnergy mode.
• Enter a value of the Energy.
• Click the field “Spectrum” with a tick, to work with EB energy spectrum
mode.
• Enter a rows number in the table, Click button "Correct table".
• Enter or edit table data.
A left mouse button allows to insert a row in the table or delete selected
row. When rows number is changed by left mouse button, the field N rows
will change accordingly. At this point Energy field will be inaccessible.
Angular spread
• Click the field MonoDirect by a tick, to work with MonoDirect mode.
The target will be irradiated with non-divergent scanned electron beam.
• Click the field Angular spread by a tick, to work with Angular spread mode.
• Enter a rows number in the table, Click button "Correct table".
• Enter or edit table data for the beam angle spread.
You work with this table by analogy with the table of EB energy spectrum.
• Enter data of space spread, to work with the frame Space spread.
• Click the field “Point beam” by a tick, to work with Point beam mode.
• Click the field “Distributive beam” by a tick, to work with space spread
mode.
• Enter data of Beam diameter in cm and Full width on half maximum in cm.
• Click the button "Save data and close this window".
Image of "Source" in the Scheme of Monte Carlo Module change into blue
color.
2.2. Scanner
• Click “Scan” in the Scheme of Monte Carlo Module. See Fig.4.
The main form for Scanner and Conveyer parameters will be opened.
See Fig.6.
• Enter values of Speed in cm/sec and Width in cm in the frame Conveyer.
• Enter values of Frequency in Hz and Height of scan horn in cm in the
frame Scanning horn.
9
Fig.6. The main form for the Scanner and Conveyer parameters.
• Enter values of Distance scan-conveyor in cm and Width of scanning
in cm in the frame Geometry.
• Enter values of X angle of target in degree.
The wedge with dosimetric film will be inclined on a conveyer platform under
X angle relatively incident EB axis in plane of EB scanning XY.
Angle X can be changed in the range from 00 to ± 900.
• Click the field “Non-divergent beam” by a tick, to work with parallel ray
scanned electron beam.
The target will be irradiated with non-divergent scanned electron beam.
• Click the field “Triangular scanning” by a tick, to work with triangular
scanned electron beam.
The target will be irradiated with triangular scanned electron beam.
• Click the window “Default mode” by a tick, to work with
linear time-current curve in scan magnet (saw-tooth form of current).
• Click the window “Custom mode” by a tick, to work with the nonlinear
time-current curve.
• Enter a rows number of the table.
• Click the button "Correct table" and work as well as with tables for an
electrons source. The values of time and current are dimensionless.
• Click the button "Save data and close this window".
Image of "Scan" in the scheme of MC Module change into blue color.
10
2.3. Wedge and Film
Geometrical model of dosimetric wedge
Fig. 7 demonstrates the geometrical model of dosimetric wedge irradiated
with non-diverging EB on moving conveyor. In the Fig.7 two wedges are
stacking together to form a rectangular block. Dosimetric film is inserted
along the sloping surface between two wedges with angle φ made of an
arbitrary materials.
Rectangular block with dosimetric film is located on a conveyer platform
in a such way that length of dosimetric film is coincided with direction of EB
scanning.
Angle φ can be changed in the range from 00 to 900.
The rectangular block can be located on the conveyer platform under
arbitrary angles X relatively incident EB axis in plane of EB scanning XY.
Fig. 7. Geometrical model of dosimetric wedge with dosimetric film
irradiated with scanned EB.
Axis X - direction of EB incidence,
axis Y - direction of EB scanning,
axis Z - direction of conveyer motion.
D-Displacement.
Length of dosimetric film is located in direction of conveyer motion.
Angle φ can be change in the range from 00 to 900.
Angle X can be change in the range from 00 to ±900.
Displacement can be change in the range from 0 to ½ of wedge length.
Input data for wedge and film characteristics
• Click “Target” in the Scheme of MC Module. (See Fig.4.).
The form for entering of input data for irradiated Wedge (Film and
wedge) will be opened (See Fig.8).
11
Fig.8. The form for entering of input data for irradiated Film and Wedge.
Film and Wedge materials
• Enter the "Density of film material" in g/cm3. (See Fig.8, left side in the
"Target material" frame).
• Select a material for the "Film" from the "List” of materials.
The atomic number Z and the atomic weight W of the material appear in the
corresponding boxes.
• Select the button “Another material” for materials not given in the " List of
material".
• Enter the values of Z and W for another material.
• For compounds and mixtures, Click the window “Table” (right up corner in the
"Target material" frame) (See Fig.8).
The frame “Correct table for film” will be opened (See Fig.9).
• Enter the necessary number N constituent elements for
compounds and mixtures in window “Rows”.
• Click the button “Correct table for film”.
The table with N rows will be opened.
• Enter the atomic number Zi and the atomic weight Wi for ith
constituent elements.
Fig.9. Frame “Correct table for film”.
12
Input data for wedge materials are entered in a similar way to film
materials.
Film and Wedge geometrical characteristics
• Enter the "Film width”, “Film thickness" and “Film displacement" in cm.
(See Fig.8, right side in the "Target geometry" frame).
• Enter the "Wedge width”, “Wedge thickness" and “Wedge length" in cm.
• Click the button “Show”. The scheme of the Film arrangement into Wedge
will appeared on the Fig.8 in the "Target geometry" frame.
• Click the button “Undo”. The previous variant of the scheme of the Film
arrangement into Wedge will appeared on the Fig.8 in the "Target geometry"
frame.
• Click the button "Save data and close this window".
Image of "Target" in the Scheme of MC Module change into blue color.
Start calculation
After loading all input data for EB radiation facility and irradiated target,
• Enter the "Number of trajectories" .
• Select the mode of calculations “Mode 1" or “Mode 2". (Default mode is
“Mode 1").
• Click the button "Simulation".
The Software ModeDW will show starting time and
define time required for calculation. (See Fig.10).
Fig.10. Frame simulation.
• Click "Stop" to interrupt calculation and reenter
data.
• When MC simulation will be ended, the button “View
results after MC calculation” will be active.
You can select item and work with results. (See Fig.11).
Fig.11. Frame with simulation results.
13
5. Analysis and comparison of simulation results
Output data.
5.1. MC module.
After finish MC Simulation, Click the button “View results after MC
calculation”
(See Fig.11).
The form "Monte Carlo: dose diagrams” for analysis of the 2D absorbed
dose distributions of one/two-sided irradiated film located into wedge
in graphical and tabular forms will be opened (see Figs.12 a, b).
Figs.12 a, b. 2D view of the absorbed dose distributions under
one/two-sided irradiated film with scanned EB.
Left graph - 2D dose distribution in the center line of film.
Right graphs - 2D dose distributions near the film interface
with wedge material.
Blue curve near the boundary from left side, violet curve near the
boundary from right side in direction of conveyer movement.
• Click the button “Dose 3D” in the forms 2D view of the absorbed dose
distributions under one/two-sided irradiation. (see Figs.12 a, b).
The form “Monte Carlo : dose map one/two-sided irradiation” with 3D
view of the absorbed dose distribution for irradiated film in graphical and
tabular forms will be opened (see Figs.13 a, b).
14
Figs.13. a, b. 3D view of the absorbed dose distributions in the film
irradiated with scanned EB.
a) under one-sided irradiation,
b) under two-sided irradiation.
The 3-D dose distribution in irradiated dosimetric films located in the wedge
is represented as a function of two coordinates: the film width along conveyer
motion (axis Y), and the film length along scan direction (axis Z), the dose
value integrated along film thickness (axis X).
• Click the button “view input data” in the forms 2D view of the absorbed
dose distributions under one/two-sided irradiation.
(see Figs.12 a, b, left side).
The form “Configuration data for Monte Carlo calculation” will be opened
(see Fig.14).
Fig.14. Table with all input data of radiation facility, regimes irradiation,
irradiated target, which are used at MC simulation.
15
• Click the button “store results” in the forms 2D view of the absorbed dose
distributions under one/two-sided irradiation. (see Figs.12 a, b, left side).
The form “Store results” will be opened (see Fig.15). The MC calculation
results will be stored in the folder “RTData”.
Fig.15. The form “Store results”.
• Click the Plot “Centre/Boundary” by the mouse right button in the form
2D view of the absorbed dose distributions under one/two-sided irradiation.
(see Figs.12 a. b).
The window “Plot view (2D/3D), Plot image to clipboard, Plot data to
clipboard” will be opened (see Fig.16). These options allow to save and
manipulate with image and calculated data.
Fig.16. The window “Plot view (2D/3D), Plot image to clipboard,
Plot data to clipboard”.
16
5.2. Analytic module.
After download all input data for EB radiation facility and irradiated target
in the Analytic module,
• Click the button "Calculation".
After finish Calculation, Click the button “View results after analytic
calculation”. (See Fig.1).
The form "Analytics: dose plots” for analysis of the 2D absorbed dose
distributions of one/two-sided irradiated film located into wedge
in graphical and tabular forms will be opened (see Figs.17. a, b).
Figs.17. a, b. Frames with analytic calculation results.
2D view of the absorbed dose distributions in a wedge material under
one/two-sided irradiated with scanned EB.
a) under one-sided irradiation,
b) under two-sided irradiation.
• Click the button “Dose 3D” in the in the forms 2D view of the absorbed
dose distributions under one/two-sided irradiation. (see Figs.17 a, b).
The form “Monte Carlo: dose map one/two-sided irradiation” with 3D
view of the absorbed dose distribution for irradiated wedge material in
graphical and tabular forms will be opened (see Figs.18 a, b).
• Additional information related to EB absorbed dose distributions are
presented in this form:
• Average dose
• CSDA range.
• Extrapolated range.
17
Figs.18 a, b. 3D view of the absorbed dose distributions in the wedge
material irradiated with scanned EB.
c) under one-sided irradiation,
d) under two-sided irradiation.
6. Module “Comparison
Module “Comparison” is intended for the scientific analysis and
comparison of calculated and experimental data of 2D absorbed dose
distributions in the target irradiated with electron beam.
• Click the button “Comparison” in the Main form of the Software
ModeDW (See Fig.1). The form of " Comparison of calculated curves”
will be opened for analysis of calculated and experimental data of 2D
absorbed dose distributions in an irradiated target (See Fig.19).
Fig.19. Form for analysis of calculated and experimental data.
18
• Select for analysis the calculated curve in the frame under the window
“Number of the curve”. For that, click the selected curve with cursor.
There are the following variants of curves for the selection:
1. “Some user result file”- simulation results of the EB 2D dose
distributions which were previously stored in the files.
2. “After Monte Carlo calculation” –the results of current Monte Carlo
calculation of the EB dose distributions in the target.
3. “After analytic calculation” - the results of current Analytic
calculation of the EB dose distributions in the target.
4. “Converted dosimetric file” –results with dosimetric experimental
data which were prepared and saved after processing of dosimetric
films with the Dosimetry module.
5. “After dosimetric block” - results related with dosimetric experimental
data.
• Select the position of dose distribution in the Center or Boundary of
irradiated target for the chosen curve of 2D dose distribution.
• Select by cursor the any of 5 columns of the table in the bottom part of
the form the "Comparison of calculated curves”. The selected column
number will be automatically entered to the window “Number of the
curve”.
• Click the button “Load selected curve”.
The characteristics of the 2D dose distribution curve will be appeared in
the chosen column. And the graph of the 2D dose distribution curve will be
appeared in the graph area.
In a such way you can enter for analysis up to 5 curves of 2D dose
distributions in the graph area. (See Fig.20).
Fig.20. The form of "Comparison of calculated curves”.
19
Example of 2D EB dose distributions in two-sided irradiated wedge with
film.
Curve 1 – EB dose distribution in the center line of film (in direction of
EB scanning) calculated with MC method.
Curve 2 – EB dose distribution in the center of a wedge material
calculated with Analitical method.
Curve 3 – EB dose distribution near the film boundary with wedge material
calculated with MC method.
You can “Delete selected curves” and make for all curves
“Normalization”.
• The function of button "Compare" (right down side in the "Comparison
of calculated curves " frame) allows to make comparison of 2D dose
distributions for 2 any curves to obtain the values of differential and
integral deviations in % between compared curves. (see Fig. 20).
• For that, select the numbers of 2 compared curves and click the button
"Compare ".
• To copy the results comparison into your document, Click the button “Plot
mode 2D/3D”, if it is necessary, and then Click the button "Plot to clipboard"
and paste them to your document.
8. Dosimetry module
Block “Dosimetry” is intended for processing of dosimetric films with
experimental data and for preparing data for “Comparison” module.
• Click the button “Dosimetry” in the Main form of the Software
ModeRTL (See Fig.1). The form of “Preparing of experimental
dosimetric data” will be opened for analysis of calculated and experimental
data of 2D absorbed dose distributions in an irradiated target
(See Fig.21.a).
• Load a text file with experimental data from hard disk. A file may contains
three or two columns (X and Y, or X, Y1, Y2). (See Fig.21 b).
Loaded data are showing into the plot and into a grid and the buttons Move
and Invert, Cut and Scale, Convert data for Comparison appear.
(See Fig.22 a, b).
• To move selected curve to left or invert one you need to use the control
panel that will open when the button Move and Invert is pressed. To save
changes, press the button Apply.
• Click the button Cut and Scale, to cut and scale curves data.
• To cut a part of curves, select by a tick the Marker 1 and move a mouse
pointer to the plot. In this point a vertical red line appears into plot. You
move it and place by left mouse clicking. It is a first limited line.
You make the same with Marker 2 and place a second red line.
(See Fig.22. a).
20
Fig.21 a, b. The forms for “Preparing of experimental dosimetric data”.
Fig.22 a, b. The forms for “Processing of experimental dosimetric data”.
• Click the button “Apply”, to scale the curves. A part of curve placed
between two Markers will saved, a plot will repaint and a grid will rewrite
(See Fig.22. b).
The button Convert data for Comparison and its control panel provides the
data for Comparison block. If you have made a scale of curves the pressing
of Apply creates a new red curve onto plot and show new data in the grid.
(See Fig.22. b).
These data may be stored to a file with using Save as “*.flm” file.
You can work with a film file if load it.
9. Service blocks
The Software ModeDW has service blocks: open and save input data about
configuration of irradiation process.
Click the File in the Software ModeDW master menu.
21
Select “Save configuration”, enter file name and save input data for MC
calculations. If you want to continue calculation that you made earlier and
saved data configuration, you need click File in the Software ModeDW master
menu and Select “Open configuration” from list.
The Software ModeDW has some programs for visualization of calculated
results. There are two viewers:
• The 2D viewer "Dose distributions after MC and Analytic calculations"
with 2D absorbed dose distributions in graphical and tabular forms for
irradiated target.
This viewer is intended for analysis of the plots with 2D absorbed dose
distributions for film center and near the boundary of film with wedge
materials or with air.
• The 3D viewer “Dose Map” is used for analysis of 3D view of dose
distribution in irradiated target.
“Dose Map” is viewer for showing:
3D view of the dose distributions (Dose Map, along length (axis Y) and
along width (axis X)) in graphical and tubular forms for irradiated target.
You can see diagram, data table, and some important characteristics. You
can turn figure of diagram and choose optimal angle, you can send figure to
clipboard. At the bottom of viewers screen form there are hints about
buttons actions.
To exit viewer you can use button Close.
• Every page with figures has button To clipboard. To send plot to
clipboard you need to click on this plot and to press To clipboard.
• You can write calculated result on hard disk as file “*.mon” or “*.ana”
after MC or analytic calculations respectively.
•You can increase some area selected on the plot to have the better sight.
To do it you need to place cursor above this area. You press left mouse
button ( it is the left top corner of rectangle) and holding down this button,
draw down rectangle around plot area. The point where you release left
mouse button is right bottom corner of rectangle.
The increasing of selected area is a moving down cursor from left corner to
right corner. The decreasing of the area (coming back), is a moving upwards
cursor from right corner to left corner.