1
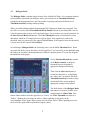
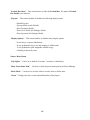
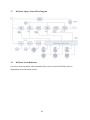
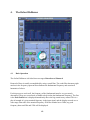
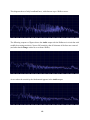
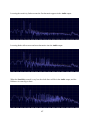
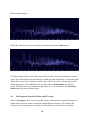
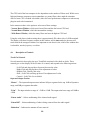
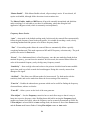
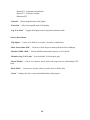
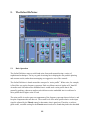
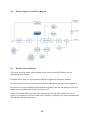
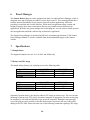
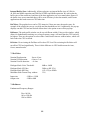
Operation Manual
1
Sonnox Restore Operation Manual
1.
Introduction
The Sonnox Restore suite is a collection of three plug-ins designed to clean the sound of digital
audio recordings that are damaged:
• by pops, clicks, or crackle;
• by hum, buzzes and whines;
• or by noise.
The tools are not just for restoring old material, but also for removing the clicks, pops, buzzes
and background noises that can sometimes accidentally occur in new recordings.
A great deal of time has been put into making the Sonnox Restore suite as intuitive as possible in
terms of providing excellent visual and graphical feedback. They also include some innovative
solutions not seen before in the restoration field, the intention being to enable quick and accurate
repair of a variety of spoiled recordings.
Restoration Processing Workflow
It is usual practice to use the DeClick process first, particularly if there are large disturbances
present that require repair.
The optimal order for DeNoise and DeBuzz is probably dependent on the programme material. If
a loud buzz is dominating low-level noise it would be sensible to remove the buzz first; on the
other hand the presence of significant noise might make it more difficult for the DeBuzz detector
to lock on to a low level buzz component.
2.
Supported Platforms
Digidesign ProTools (LE, RTAS, M-Powered)
VST
Audio Units
Mac OSX 10.4 or later (PowerPC and Intel)
Windows XP
See supplement for platform specific details.
2
3.
The Oxford DeClicker
3.1
Basic Operation
The Oxford DeClicker has three main sections: DePop, DeClick and DeCrackle. These three
sections deal with events that are up to 10ms, 3ms and 0.4ms in duration, respectively.
Each of the three sections calculates an Excitation Profile for a given block of samples. The
excitation profile is the residual signal left after harmonic components have been removed, and is
a representation of how much the actual signal is deviating from the predicted signal. A big
excitation usually represents a big unexpected event such as a click.
Each section provides a Threshold control. This control is used to adjust a threshold level within
the excitation profile to capture an event. If a peak on the excitation profile is below the
threshold, it will not be registered as an event to be repaired. If a peak breaches the threshold
line, then it is registered as a detected event and can be repaired. When you touch the Threshold
control, by default the excitation profile is displayed visually on the graph. Usually there is a
background level of “noise” at the bottom with the occasional peak lifting above the background.
3
You can imagine a click as a triangular shaped peak in the excitation profile, wider at the bottom
and tapering to a point at the top. Keeping this in mind, you have two potential strategies for
detecting and repairing a click.
The first is to lower the threshold in the
excitation profile until it is just above the
noise floor, near the base of the triangle.
(You can do this either with the Threshold
slider, or drag the threshold line on the
graph itself.) This means that the true
width of the event is more likely to be
found because the threshold is further
down the triangle at the base.
The problem with this approach is that
now many events are registered for
potential repair. As the Sensitivity setting
is reduced, more and more detected events
are rejected and discarded, starting with
the smallest. Thus a low sensitivity means only the largest of the detected events go forwards to
the repair section.
The “Threshold” control determines how many events are detected, and the
“Sensitivity” control determines how many of those detected events go on to be
repaired.
The best setting for the Threshold slider is to put it where the threshold line on the excitation
profile is just above the noise floor, and to lower the Sensitivity slider until the required number
of repairs are occurring.
The other approach is to lower the Threshold until it is just under the top of the peaks. With
Sensitivity at maximum, you are then only correcting the events that breach the threshold. One
potential problem with this method is that it is possible that only the middle of the event is
actually repaired because the width of the event is perceived to be narrower than it actually is
(because the Threshold is at the peak of the triangle where it is narrowest.) In practice, however,
any partial repairs can be fully repaired later on by the DeCrackle section which does tend to
clean up the repairs done in the DePop and DeClick sections.
4
The DePop section can detect events from 10ms down to 1ms. However, it is best to adjust the
DePop Threshold and Sensitivity to ensure that the fewest repairs are done in this section. Use a
low DePop Threshold and a minimum of Sensitivity to achieve this.
If possible, use the DeClicker section to capture the longest and widest of the clicks. Again use a
low DeClick Threshold and a minimum of Sensitivity to achieve this.
3.2
Output Panel
The listen section of the Output Panel contains an option to listen to the difference between the
input and the processed output. This is labeled “Diff”. This is particularly useful in this plug-in
for hearing what has been repaired, and for listening to the quality of the repairs without being
distracted by the audio material. You can also listen for breakthrough of audio on the pops,
meaning that the repair is too wide (you need to raise the DePop Threshold a bit). You can listen
for a constant scratching sound, which means that the DeCrackle section may be doing too many
repairs, particularly if you can’t hear that scratching sound in the original. You can listen to make
sure that the sound of the clicks is as close as possible to the sound of the clicks in the original. If
they are brighter, it may mean that the DeClick Threshold slider needs to go lower to capture the
true width of the clicks.
3.3
The Events Graph
The events graph is an important visual display, showing events as they are being detected. The
events are shown with duration along the X-axis and amplitude/energy along the Y-axis. It is
worthwhile playing with the Threshold and Sensitivity controls to see their effect on the number
of events that are detected, and at what level and width they are displayed on the event graph.
For example, you will notice that as you bring the Threshold lower, not only are more events
detected, but the events tend to move to the left, meaning the events are being detected as longer
duration. Then as you move the Sensitivity down, you will notice that the smallest events
disappear first, leaving the largest events.
The graph shows green bubbles (DePop), blue bubbles (DeClick) and white bubbles
(DeCrackle). The size of the bubbles indicates how loud they are, as does their height above the
horizontal axis. Each section has an IN button, and if you disable a section using the IN button,
their bubbles are displayed as Red, meaning these events have been detected but not repaired.
5
Clicking in the Events Graph will remove any popup graphs such as the Excitation Profiles to
expand your view of the Events.
3.4
The Exclude Box
The Events Graph allows an important new feature to be implemented. The idea of the exclude
box is to stop over-corrections. For example, you may be happy with a piece of music and the
associated repairs, except for a section with brass instruments - at which point too many high
energy events are detected and corrected. Likewise, with dialogue you sometimes find that the
need for repairs diminishes as the dialogue becomes louder, because the dialogue masks the
clicks. Threshold and Sensitivity settings that work for the background noise of the dialogue
may be too sensitive when the dialogue is active and loud. The graphic representation of the
detected events makes this visually very obvious, and can be further demonstrated by listening to
the diff signal.
One way to remedy these situations is to
use an Exclude Box. Simply click the
pointer in the event graph area to create a
box and drag it to where it needs to be to
exclude the repairs that were undesirable.
Every event that occurs inside the box
will not be repaired and is displayed in
red. You can drag the whole box or use
the drag handles (left, right, top, bottom)
to re-position or re-size the box
accurately.
The diagram shows the tell-tale signature
of a loud brass section of music. If these
events were to be “repaired” by the
declicker, the section would lose all brightness and authenticity. Using the exclude box the
events can be marked for exclusion from the repair processing.
There are two further controls for the Exclude Box; one to enable or disable the feature (Exclude
Box Enable), and one to show or hide the box (Exclude Box Show). Both of these controls
leave the box position unchanged. These controls are automatable, as are the drag handles. Only
one exclude box can be active at a time.
6
3.5
Dialogue Mode
The Dialogue Mode is another unique feature of the Oxford DeClicker. It is a complete solution
to the problems associated with dialogue where you need one set of Threshold/Sensitivity
settings for the background level, when the speaker is pausing, and a quite different set of
Threshold/Sensitivity settings whilst speaking.
When you enable Dialogue Mode the background GUI changes to display an extra panel. You
now have two entire sets of Threshold/Sensitivity/Enable controls at your disposable. One set
is for the quieter parts, and one set for the louder parts. Access to these two sets of controls is via
the Above Set and Below Set buttons. The Voice Threshold control is a threshold level that
determines which set of controls processes a given signal. If the signal level is above the
threshold, then it is processed by the controls labeled Above. If the signal is below the threshold,
it is processed by the controls labeled Below.
On switching to Dialogue Mode, the first thing to do is set the Voice Threshold slider. When
you touch this slider you see the history of the signal level. You can easily set the threshold using
the fader to be just above the background level while the speaker pauses. You can also drag the
threshold line on the graph.
Set the Threshold/Sensitivity controls
of the Below controls, or drag the
threshold lines on the graphs to
appropriate background settings.
Then click the Above Set button, to
switch the controls over to displaying
the “Above Set” of controls. Set these
Threshold/Sensitivity controls or drag
the threshold lines on the graphs to
appropriate settings for the speech.
The final feature of the Dialogue Mode
that makes it even more flexible is the
incorporation of a Side-Chain. This
feature further defines when the signal level is “Above” the Voice Threshold and when it is
“Below”. Without the side-chain, the Above / Below splitting occurs purely on the
level/amplitude of the signal. When you use the side-chain, Above / Below splitting occurs on
the level of the signal within a particular frequency band.
7
3.6
Description of Controls
Touch Pad Controls
Several controls in these plug-ins use a Touch Pad associated with a knob or slider. These
controls give a clear display of the SI value of a control, and respond to the following actions:
- Left-Click and drag up/down: Increase/decrease the value
- Right-Click and drag up/down: Fine adjustment of value
- Double Click: Directly edit value
- Shift + Left-Click and drag up/down: Fine adjustment of value
- Control + Left-Click: Set to default
Input and Output Sections
“Meters” – The input and output meters indicate 1dB per segment for the top 18dB of dynamics
range, and 2dB per segment thereafter.
“Trim” – The input trim has a range of +12dB to -12dB. The output trim has a range of 0.0dB to
-12dB
“Listen Audio” – Selects auditioning of the cleaned audio signal.
“Listen Diff” – Selects auditioning of what is being removed from the audio signal.
“Listen Side Chain” – Selects auditioning of the side chain.
“Dialogue Mode” – Selects the Dialogue Mode and displays the Dialogue control panel.
“Master Enable” – With Master Enable selected, all processing is active. If not selected, all
repairs are disabled, although all the detection circuits remain active.
The Master Enable, Audio and Diff buttons all provide smoothly interpolated and glitchless
audio switching. It is advisable to use these for auditioning, rather than using the host
application’s Bypass switch (which is commonly not interpolated).
DePop, DeClick and DeCrackle Sections
“Threshold” – This control is used to adjust a threshold level within the Excitation Profile to
capture an event. If a peak on the Excitation Profile is below the threshold, it will not be
8
registered as an event to be repaired. If a peak breaches the threshold line, then it is registered as
a detected event and can be repaired.
“Sensitivity” – This control determines whether detected events are discarded, starting with the
smallest. A low Sensitivity means only the largest of the detected events go forwards to the
repair section.
“Enable” –With the section disabled, the detectors are still monitoring the audio and any
detected events are shown on the Events Graph as red bubbles. Setting the section IN will
present the detected events to the repair processing section.
“Detect Meter” – The Detect meter display combines two indications. The main rising column
indicates the sum of the energy of events that have been detected. With the “Enable” button deselected (ie. the repair circuit disabled), this column is coloured orange/red. With the repair
circuit active the column is coloured blue. The bottom segment of the meter is an indication of
each individual detected event.
Dialogue Mode
“Voice Threshold” – This control determines the threshold at which detected events are
allocated between the two sets of Detect/Repair settings. Any event detected while the level is
above the threshold (coloured blue) will be allocated to the Above Set; any event detected while
the level is below the threshold (coloured red) will be allocated to the Below Set.
“Above Set” – With Above Set selected, the Detect/Repair controls are used on events that are
above the Voice Threshold.
“Below Set” – With Below Set selected, the Detect/Repair controls are used on events that are
below the Voice Threshold.
“Side-Chain LF Filter” – Sets the LF limit for the side-chain.
“Side-Chain HF Filter” – Sets the HF limit for the side-chain.
Display Controls
“Exclude Box Enable” – This control enables or disables the Exclude Box. This the box
enabled, any event inside the box will not be repaired.
9
“Exclude Box Show” – This control shows or hides the Exclude Box. The status of Exclude
Box Enable is not affected.
“Pop-ups” – This control enables or disables the following display modes:
- Disable Pop-ups
- Pop-ups follow touch (Default)
- Show Excitation Profile
- Show Level Profile (for Dialogue Mode)
- Show Spectrum (for Dialogue Mode)
“Display Options” – This control enables or disables many display options:
- Events decay, or persist indefinitely;
- X-axis graduated in log or lin, and samples or milliseconds;
- Y-axis graduated in peak amplitude or RMS energy
- Labelling of detected events
Sonnox Menu Button
“Clip Lights” – Can be set to hold for 2 seconds, 5 seconds, or indefinitely.
“Show Preset Name Path” – Can show or hide the preset name path in the Preset Manager.
“Knob Mode” – Can be set to circular, relative circular, linear or follow host.
“About” – Displays the date, version and build number of the plug-in.
10
3.7
DeClicker Signal / Control Flow Diagram
3.8
DeClicker Stereo Behaviour
For correct stereo operation, when instantiated into a stereo track the DeClicker has two
independent detect and repair circuits.
11
4.
The Oxford DeBuzzer
4.1
Basic Operation
The Oxford DeBuzzer is divided into two stages: Detection and Removal.
Removal of buzz is usually accomplished by using a comb filter. The comb filter has many tight
notches in the frequency spectrum that eliminate the fundamental frequency and associated
harmonics of a buzz.
For this process to work well, the frequency of the fundamental must be very accurately
determined. There are several tools available to help isolate the fundamental frequency. The first
is the Peak Profile that is displayed immediately above the big central rotary control. This is a
plot of strength of a given nominal frequency in the input signal, and the display extends over a
wide range either side of the nominal frequency. With the nominal set to 50Hz, any peak
frequency between 45Hz and 55Hz will be displayed.
12
The second tool to help isolate the fundamental is the large FFT display. The FFT displayed by
default in this graph is no ordinary FFT of the input signal, but can accumulate FFT data. It is
designed to accentuate any frequency components that are consistently present, and average out
everything else. Any buzzes, hums, whines or whistles that are consistently present tend to stand
out in the plot.
A third method of isolating the nominal frequency is a tone generator. In the same way as you
can tune a guitar, as you home into the fundamental, the beat frequency between the tone and the
fundamental will become slower and slower the closer you get.
The FFT graph will automatically mark the three highest peaks found. You can click on one of
these peaks to directly set the nominal frequency to the exact frequency found in the graph. You
can also drag the marker in the graph, or use the rotary control. The small red triangle on the
frequency axis notifies the nominal, and it can be dragged to re-position the frequency knob.
Once the nominal frequency is found and set, the removal section uses this frequency to calculate
the coefficients required for the comb filter to remove this frequency and its harmonics from the
input signal.
4.2
Tracking Modes
By default the plug-in assumes Auto Mode. This means that the plug-in is continuously hunting
either side of the nominal frequency for a peak profile, and then steps the centre of the profile
closer to the peak. Once the lock strength rises to be above a certain level, the plug-in
automatically sets the nominal frequency to the frequency of the peak found. In Auto mode, the
filters follow the detected frequency, not the nominal frequency set by the position of the knob.
So if the hum is wandering in frequency, the detector will follow.
If the nominal is set to within about 5Hz of a 50Hz or 60Hz hum frequency, the plug-in will
automatically move towards the correct frequency and set itself up to remove that frequency.
Once you hear the hum disappear, you can then click on Freeze to set the nominal to this exact
frequency and stop the detector from hunting.
For removing whines and whistles it is best to set Freeze Mode, and then use the FFT to find the
frequency of the whines. These show up as peaks on the plot, and then you can click on a peak to
set up the plug-in to remove that frequency.
Auto Mode is suitable for tracking a weak, slowly wandering fundamental and operates over all
three frequency bands. Fast tracking mode allows the removal filters to automatically follow a
13
quickly wandering fundamental. This mode operates on MF and HF frequency selections only
(if Fast is selected in the LF range, the mode is forced to Auto and the Auto button flashes).
Auto and Fast modes are both applicable to Comb or Para-EQ settings. Fast mode is most
appropriate for quickly drifting high frequency buzzes possibly generated by lighting
interference.
4.3
Removal Filters
The default removal filter is a Comb filter. However, you can also select Para-EQ mode, which
means using sharp parametric EQ sections to remove the fundamental and harmonics. Generally,
if the buzz contains many harmonics, or if the frequency of the buzz is wandering, it is best to
use the Comb filter. If there are only one or two harmonics to remove, then you may find that
you prefer the sound of the parametric EQ filters.
The Comb filter has equal width notches when viewed on a linear frequency scale, which means
that the notches will be narrow at higher frequencies. For removing a wide-band buzz that has a
low frequency fundamental the Comb filter will do least damage at HF.
For similar settings of fundamental frequency and Q, the Para-EQ filters will be narrower at LF
than the Comb, but will widen as the harmonics and frequency increase and at HF will be wider
than the equivalent Comb filter section. With parametric EQ filters, the notches have equal
width when viewed on a log frequency scale, but when viewed on a linear scale they will appear
to widen as the frequency increases. This means the notches will tend to merge together at higher
frequencies, so this is not recommended for removal of wide-band buzzes as it is likely to cause
unnecessary damage to the original audio.
14
The CPU usage in Para-EQ mode is dependent on the number of filter sections operative; this is
not the case in Comb mode. This is another reason why Para-EQ should be used with care with
a low frequency fundamental.
The Para-EQ filters offer several advantages over the Comb filter. The first is that you can
reduce the amount of attenuation as you increase in frequency. You use the Slope control to do
this.
Secondly, with Para-EQ mode you can choose to notch out only odd harmonics, or both odd and
even harmonics. Frequently you only need to remove odd harmonics, which will inflict less
damage to the signal.
Thirdly, Comb filters become less effective when the fundamental is at higher frequencies
(greater than around 2kHz), so Para-EQ mode is much better at the removal of loud whistles or
whines at higher frequencies.
4.4
Sensitivity Modes for Optimal Removal of Buzz
The correct setting for the Sensitivity control is crucial for best repair and least damage to the
original audio. There are two modes for using the Sensitivity control.
The Default Mode of Buzz removal
With the Sensitivity control fully clockwise (so most sensitive), the detection circuits will be
removing some elements of the signal as well as the buzz. As the sensitivity is reduced, fewer
signal elements will be removed from the audio signal and the quality of the repair will improve.
However, as the sensitivity is further reduced some elements of the buzz will also start to be
excluded from the removal circuits and the buzz will become audible. The best compromise is
with the sensitivity as low as possible while there is still no audible buzz in the signal output.
One way to illustrate this is by considering the Diff output. Auditioning the Diff output at full
sensitivity will reveal full buzz and some distorted signal. Reducing the sensitivity will reduce
the signal content, but will soon also start to change the tonality of the buzz. As you reduce the
sensitivity you are moving signal and buzz elements out of the Diff output into the Audio output.
15
This diagram shows a fairly broadband buzz, with elements up to 10kHz or more:
The following sequence of figures shows the Audio output with the DeBuzzer in circuit but with
steadily decreasing sensitivity. Note at full sensitivity that all elements of the buzz are removed
(and note that the Range control is set to about 10kHz):
As we reduce the sensitivity the fundamental appears in the Audio output:
16
Lowering the sensitivity further means the first harmonic appears in the Audio output:
Lowering further allows more and more harmonics into the Audio output:
When the Sensitivity control is very low the whole buzz will be in the Audio output, and the
DeBuzzer is removing no buzz:
17
Clearly here the Sensitivity is far too low. The optimal setting is just before the fundamental
appears in the Audio output.
The Alternative Mode of Buzz Removal
There is a second mode of Buzz removal that might be more appropriate under some
circumstances. The sequence above is using the default mode of repair. If Alt Mode is selected,
the characteristics of the sequence reverse, with the harmonics appearing in the Audio output
first, and finally the Fundamental. The following sequence of figures shows the Audio output
with a reducing sensitivity, but this time with Alt Mode on.
Sensitivity at maximum:
Lowering sensitivity with the higher harmonics appearing in the Audio output:
18
More harmonics appear:
Finally the whole buzz spectrum including the fundamental is in the Audio output:
The final settings will be a trade-off between removal of buzz elements and quality of repaired
signal. This will depend on the characteristics of both the signal and the buzz. As both the signal
and the buzz can be almost infinitely variable, there will be cases when each sensitivity mode
will be appropriate. For broadband buzzes it is likely that the Default mode gives the best
results. If the hum has only a fundamental and maybe one or two harmonics, the Alternative
Mode might bring more pleasing results.
4.5
The Frequency Detection Window and CPU usage
Above the Frequency knob is the peak profile display, which shows the strength of frequency
content within a narrow window around the nominal detector frequency. The width of this
window in Hz is determined by the number of comb filters used in the detector algorithm.
19
The CPU load of the host computer is also dependent on the number of filters used. While newer
high-performance computers can accommodate very many filters, there might be situations
where a lower CPU overhead is desirable, either for lower performance computers or when many
plug-ins need to be instantiated.
In the menu area there is the option to select one of three settings:
- Narrow Detect Window, which uses fewest filters and has the lowest CPU load,
- Normal Detect Window, which has intermediate settings,
- Wide Detect Window, which has many filters and uses the highest CPU load.
Using the wide detect window setting there is approximately 5Hz either side of a 50Hz nominal.
The display will show frequency content in this window, and in Auto mode the detector will
track towards the strongest element. It is important to note that it is the width of the window that
is selectable, not the frequency resolution.
4.6
Description of Controls
Touch Pad Controls
Several controls in these plug-ins use a Touch Pad associated with a knob or slider. These
controls give a clear display of the SI value of a control, and respond to the following actions:
- Left-Click and drag up/down: Increase/decrease the value
- Right-Click and drag up/down: Fine adjustment of value
- Double Click: Directly edit value
- Shift + Left-Click and drag up/down: Fine adjustment of value
- Control + Left-Click: Set to default
Input and Output Sections
“Meters” – The input and output meters indicate 1dB per segment for the top 18dB of dynamics
range, and 2dB per segment thereafter.
“Trim” – The input trim has a range of +12dB to -12dB. The output trim has a range of 0.0dB to
-12dB
“Listen Audio” – Selects auditioning of the cleaned audio signal.
“Listen Diff” – Selects auditioning of what is being removed from the audio signal.
“Reduction” – Indicates the amount of buzz removal.
20
“Master Enable” – With Master Enable selected, all processing is active. If not selected, all
repairs are disabled, although all the detection circuits remain active.
The Master Enable, Audio and Diff buttons all provide smoothly interpolated and glitchless
audio switching. It is advisable to use these for auditioning, rather than using the host
application’s Bypass switch (which is commonly not interpolated).
Frequency Detect Section
“Auto” – Auto mode is the default tracking mode. In this mode the removal filters automatically
follow the peak frequency found in the peak profile. It is suitable for tracking a weak, slowly
wandering fundamental and operates over all three frequency bands.
“Fast” – Fast tracking mode allows the removal filters to automatically follow a quickly
wandering fundamental. This mode operates on MF and HF frequency selections only. The peak
profile is not active for Fast mode.
“Freeze” – For a fundamental that is a fixed frequency, once the auto mode has found the best
nominal frequency, you can freeze the nominal. In freeze mode, the removal filters follow the
value of the nominal frequency set by the big rotary frequency control.
“Sensitivity” – Start at a high value and reduce to the point at which the hum becomes audible
again, then push it up a little to make the hum disappear. Doing this correctly ensures least
damage to the signal.
“Alt Mode” – This allows two different modes for hum removal. Try both modes with the
sensitivity knob, and use the mode that allows the lowest setting of the sensitivity.
“Tone On” – Enables the onboard tone generator which can be useful for finding the frequency
of unusual hums, whines or whistles.
“Tone dB” – Allows you to set the level of the tone generator.
“Fine Adjust” – Sets the Frequency control to have a much finer range so that it is easy to
home into a precise frequency value. Holding down shift while moving the Frequency knob
enables an extreme fine adjust, where the frequency can be accurately determined to 0.0001 Hz.
If Fine Adjust is selected while in Auto tracking mode, the detector is forced into Freeze mode
and the Freeze mode button flashes. Exiting Fine Adjust returns to Auto mode.
21
“LF”, “MF”, “HF” – These three buttons set which frequency band the big rotary control will
operate over. LF = 20Hz to 160Hz. MF = 160Hz to 1280Hz. HF = 1280Hz to 20kHz.
“Hz”. The Frequency control in the centre is used to set the nominal frequency about which in
Auto mode the detection algorithms hunt for a peak in the peak profile. In Freeze mode it
determines the frequency of the removal filters. The frequency can be selected using the scribble
tab in units of 1Hz (normal), 0.01Hz (Fine adjust) and 0.0001Hz (extreme fine adjust).
Remove Section
“Comb” – Sets the removal filters to be a comb filter. Comb is best for auto mode, and for when
there are many harmonics in a buzz.
“Para-EQ” – Sets the removal filters to be a narrow notching parametric EQ. You may prefer
the sound of these filters when there are few harmonics. Also, it is probably best to select ParaEQ to remove an HF whine; if the user selects the HF frequency band while in Comb mode a
small red indicator flashes on this button as a reminder.
“+Even” – When using the Para-EQ option, by default even harmonics are not notched out
because frequently they are not present. Enabling this control will notch out even harmonics.
“Range” – This sets the frequency above which there are no notches. This needs to be as low as
possible to avoid loss of MF and HF information, but high enough to take out all the harmonics
of a buzz. Range cannot be set lower than 10% above the fundamental.
“Sharp/Q” – Adjusts the width or sharpness of the notches. When too sharp, the filters tend to
ring. When too wide, the filters take out too much of the audio around the harmonics. So
adjusting this is a matter of finding a suitable compromise.
“Atten” – Set this to the minimum attenuation that will make the hum or buzz inaudible.
Display Controls
“Display Mode” – This control switches between the following display modes:
- Instant FFT
- Averaged FFT
22
- Smart FFT – permanent accumulation
- Smart FFT – with time constant
- Minimum FFT
“Zoom In” – Allows magnification of the display.
“Zoom Out” – Allows de-magnification of the display.
“Log / Lin Select” – Toggles the display between log mode and linear mode.
Sonnox Menu Button
“Clip Lights” – Can be set to hold for 2 seconds, 5 seconds, or indefinitely.
“Show Preset Name Path” – Can show or hide the preset name path in the Preset Manager.
“Default to 50Hz / 60Hz” – Sets the default fundamental frequency to 50 or 60 Hz.
“Default to Log / Lin X-Axis” – Sets the default X-Axis display grid.
“Detect Window” – Can be set to narrow, mid or wide; with respective low, mid and high CPU
loads.
“Knob Mode” – Can be set to circular, relative circular, linear or follow host.
“About” – Displays the date, version and build number of the plug-in.
23
4.7
DeBuzzer Signal / Control Flow Diagram
4.8
DeBuzzer Stereo Behaviour
For correct stereo operation, when instantiated into a stereo track the DeBuzzer has two
independent repair circuits. There is a single mono detection circuit.
24
5.
The Oxford DeNoiser
5.1
Basic Operation
The Oxford DeNoiser removes wide-band noise from audio material using a variety of
sophisticated techniques. The key to good de-noising lies in helping the user produce pleasing
and accurate results, rather than encouraging over-aggressive use of the controls.
The Oxford DeNoiser is based around the concept of a “noise profile”. White noise, for example,
is flat all the way up the frequency spectrum. Pink or red/brown noise is louder at LF than HF.
An audio track with white noise embedded into it would need a noise profile that is flat,
generally speaking, whereas an audio track with brown noise embedded into it would need a
noise profile that is higher at the LF end.
The noise profile is used to gate-out components of the frequency spectrum that are below it, and
keep the components that are above it. The overall level of the noise profile relative to the input
signal is adjusted by the Thresh control to determine what is gated out. Therefore, to achieve
good results, a suitable setting for the Thresh control needs to be found that pitches the threshold
25
well below valid signal components, but well above the noise floor. If Thresh is set too high,
some of the signal will be attenuated; if it is set too low, the noise removal will be less effective.
The Oxford DeNoiser provides different means to arrive at an appropriate noise profile. The
default method is called Auto mode. In Auto mode the frequency spectrum of the signal is
examined to automatically acquire the general shape of the noise profile by looking for levels in
the frequency spectrum that are consistently there. In Auto mode the threshold level is a value
relative to the general signal level. The advantage of Auto mode is that the threshold follows the
signal level so that noise removal will always be a fixed number of dBs below the level of the
actual signal. As the level of the material dips closer to the noise floor, it does not get removed
along with the noise.
Another method to arrive at an appropriate noise profile is to use the Freeze button to freeze the
automatic noise profile, and use that fixed profile from then on. This is useful for capturing the
profile from a section of material containing only background noise, and then applying it to the
rest of the material. In Freeze mode, both the noise profile and the level at which it is applied
are fixed. The advantage of Freeze mode is that the threshold is always set to remove the correct
level of noise from the material, meaning that as the level of the material climbs, the noise
removal is less destructive. However, as the level of the material dips closer to the noise floor,
more and more of the actual material gets removed along with the noise.
A third method is to use Manual Mode. In this mode you manually specify a simple coloured
noise profile. In Manual mode, both the noise profile and the level at which it is applied are
fixed.
Generally, you will want to leave the Auto mode on because in this mode the level of the
threshold will follow the general level of the signal, and this tends to give the most sympathetic
results.
5.2
Noise Threshold Bias Controls
For additional manual control over the noise threshold profile, there is a 17-step threshold bias
curve coloured red. This adjustment of the threshold profile works in all three modes – Auto,
Freeze or Manual. Using this bias curve and the drag handles, you can easily make the
threshold, and thus the noise removal, more sympathetic at critical frequencies. Lowering the
bias handles will reduce the noise reduction there and preserve more of the original audio.
Lifting the handles will increase the noise removal.
26
The 17 handles are distributed over the entire frequency range. With the display set to linear
view (HF view), 10 handles are visible from 2kHz to 20kHz. When the view is set to Log (LF), 9
handles are visible from 20Hz to 4kHz. Two of the handles (at 2kHz and 4kHz) are visible in
both Linear and Log views, hence there are 17 separate handles in total. The shape of the profile
as modified by the bias handles is preserved while switching between views. The Reset Bias
button is half-bright when any handle is not at its null position. Clicking the Reset Bias button
will reset only the handles that are visible in the current log or linear view. Holding down shift
while clicking the Reset Bias button will reset all 17 handles in both views.
These threshold bias handles are useful when trying to de-noise band-limited signals. The
contour of the threshold profile is likely to drop rapidly at the bandwidth limit, and it is possible
that noise elements will peek over the threshold. This behaviour could result in the introduction
of musical noise. Raising the threshold bias handle just to the HF side of the bandwidth limit will
rectify this and reduce the musical noise.
There are some shortcuts for adjusting the bias curve on the graph:
Left Click + Drag: adjusts a single bias handle.
Right Click + Drag: adjusts that handle and all others above it to the end of the HF. This
allows a very quick way to add gentle de-hissing – right click at 8kHz and drag up.
Shift + Left Click + Drag: adjusts that handle and all handles below it down to start of
LF.
5.3
Noise Reduction Bias Controls
For additional manual control over the noise reduction, there is a 17-step noise reduction bias
curve that is very similar in operation to the threshold bias. This curve is coloured yellow. The
adjustment of the noise reduction works in all three modes – Auto, Freeze or Manual. Using
this reduction bias curve you can easily reduce the amount of noise reduction at particularly
critical frequencies, for example where piano transients are brightest and most obvious. This
ability to tailor the noise reduction allows for a much more musical result that shows good noise
reduction while also being sympathetic to the character and ambience of the original.
The Bias Select toggle button is used to switch between the Threshold Bias and the Reduction
Bias. The control of the reduction bias handles is identical to the control of the threshold handles,
which is described above. The Reset Bias button glows to show that one or more handles on the
27
current bias display are not at their null position. A small red or yellow dot appears on the Reset
Bias button to indicate that the non-selected bias curve is non-null.
5.4
DeHisser Section
The Oxford DeNoiser also contains a dedicated DeHisser section. This DeHisser is not as
musical as the de-hissing that can be achieved with the de-noiser algorithms, but it does allow
more aggressive reduction of hiss levels. This makes it very useful for dialogue and movie sound
tracks where there is not a lot of high frequency material that needs preserving, and where the
priority is to reduce the hiss to an acceptably clean level. However, music containing lots of
cymbals or other HF content will generally not sound good using the DeHisser. The DeHisser
section is a tool to keep handy for some jobs where its character is appropriate.
To use the DeHisser, simply select a Cutoff frequency that is safely above the signal content, and
lower the reduction fader according to taste.
5.5
Sweetening
Having removed the noise, in some circumstances it is desirable to add something back to the
signal that has been taken away. For example, the act of de-noising can make the material sound
a little flat compared with the original. The Oxford DeNoiser has a “Warmth” control in the
output section that can quickly add some richness back into the material.
5.6
Mid / Side Mode
Mid-Side channel configuration allows better control over the way a stereo signal degrades to a
mono signal. This is important in broadcast where, for example, a stereo TV program needs to
play correctly on a mono TV, or an FM radio broadcast can degrade to mono in less than perfect
conditions, without phase effects. With a Mid-Side signal, you can simply drop the Side signal to
create the mono signal.
You can convert a Left-Right stereo pair of channels into Mid-Side by adding the two together to
create the Mid signal, and taking the difference to create the Side signal:
Mid = Left + Right
Side = Left - Right
In other words the Mid signal is what is common to both Left and Right, and the Side signal is
what is different between Left and Right. You can achieve this in a DAW host by sending the
28
Left and Right channels to a bus called Mid, and sending the Left and the phase inverted version
of the Right to a bus called Side.
Likewise, you can convert a Mid-Side pair of channels into Left and Right by adding the two
together to make the Left, and Subtracting the Side from the Mid to make the Right:
Left = Mid + Side
Right = Mid - Side
Although it is possible to convert from Mid-Side to Left-Right and vice versa, signals that are
intended for broadcast should be recorded using the Mid-Side microphone technique, which
ensures there is no actual left-right phase difference.
The Oxford DeNoiser has a Mid-Side mode of operation that causes the plug-in to de-noise only
the Side signal content of the Left-Right signal, leaving the Mid content alone. The Left-Right
signal is first converted to Mid-Side, then the Side is de-noised, then the signal is converted back
to Left-Right.
If you have a recording that is already in Mid-Side format, you can simply de-noise the side
channel as a mono signal. But if the Mid-Side recording has been converted to Left-Right, you
need to use the Mid-Side mode of the DeNoiser to de-noise just the side contents.
To de-noise just the Side channel is useful in two circumstances. Firstly, for FM stereo
broadcast, switching between stereo and mono modes as signal strength wanes should not cause
a noticeable change in dominant noise content. DeNoising only the Side channel means that
mono operation is entirely unaffected while stereo operation produces a cleaner stereo image
without affecting the central sound. Secondly, recordings made with the Mid-Side microphone
technique often have more noticeable noise in the Side signal because the Side signal is mainly
ambiance. If the Mid-Side recording is then converted to Left /Right at some point, the Mid-Side
mode of the DeNoiser allows you to de-noise just the Side content.
5.7
Description of Controls
Touch Pad Controls
Several controls in these plug-ins use a Touch Pad associated with a knob or slider. These
controls give a clear display of the SI value of a control, and respond to the following actions:
- Left-Click and drag up/down: Increase/decrease the value
- Right-Click and drag up/down: Fine adjustment of value
- Double Click: Directly edit value
- Shift + Left-Click and drag up/down: Fine adjustment of value
- Control + Left-Click: Set to default
29
Input and Output Sections
“Meters” – The input and output meters indicate 1dB per segment for the top 18dB of dynamics
range, and 2dB per segment thereafter.
“Trim” – The input trim has a range of +12dB to -12dB. The output trim has a range of 0.0dB to
-12dB
“Listen Audio” – Selects auditioning of the cleaned audio signal.
“Listen Diff” – Selects auditioning of what is being removed from the audio signal.
“Warmth” – Can quickly add warmth into the signal if desired.
“Master Enable” – With Master Enable selected, all processing is active. If not selected, all
repairs are disabled, although all the detection circuits remain active.
The Master Enable, Audio and Diff buttons all provide smoothly interpolated and glitchless
audio switching. It is advisable to use these for auditioning, rather than using the host
application’s Bypass switch (which is commonly not interpolated).
DeHisser Section
“Cutoff” – This control can have any value from 3kHz to 15kHz. Hiss removal is performed on
the HF side of this setting.
“Reduction” – This sets how many dBs of hiss reduction will be applied.
“Enable” – If Master Enable is also IN, this makes the DeHisser active using glitchless
switching.
DeNoiser Detect Section
“Thresh” – This is the most critical control to get right. It sets the level of the threshold about
which noise reduction takes place. Frequency components below the threshold get attenuated,
whereas components above the threshold are left alone.
“Smooth” - Adjusts the peakiness of the noise profile.
30
“Tune” – In some situations can help to remove musical noise.
“Auto” Mode - Enables automatic updating of noise profile and the noise profile level relative
to the input signal.
“Freeze” Mode – Once you have obtained a good profile, this button will freeze the profile to
prevent it updating.
“Manual” Mode – In this mode, the profile is forced flat. You can then use the Colour, Air or
bias controls to modify the shape of the profile.
“Colour” – Modifies the LF shape of the noise profile.
“Air” – Modifies the HF shape of the noise profile.
DeNoiser Removal Section
“Reduction” – sets the amount of attenuation of broadband noise components below the
threshold.
“HF Cut” – This is a simple low pass filter with a fixed -18dB attenuation. It is active when the
DeNoiser Enable and Master Enable are both active.
“Makeup” – Provides a way to adjust the level of the de-noised signal to compensate for any
loss in level due to the denoising process. This makes it easier to perform with and without denoising comparisons using the master IN button.
“Mid/Side” Mode – For stereo inputs, this applies noise reduction to the Side channel. The Mid
channel is unaffected.
“Enable” – If Master Enable is also IN, this makes the broadband DeNoiser active using
glitchless switching.
Display Controls
“Bias Select” – This toggles between the red bias curve that modifies the shape of the noise
threshold profile, and the yellow bias curve that modifies the shape of the noise reduction.
31
“Reset Biases” – When a bias handle is moved this button lights half-bright to indicate that the
bias curve is non-null. A single press nulls the bias control handles for the currently active and
visible bias curve; using shift-click will reset the bias handles for both the LF and HF sections of
the currently active bias curve. A small red or yellow dot indicates that the non-selected bias
curve is non-null.
“Log /Lin Select” – Switches the display between logarithmic (LF) and linear (HF) modes.
Sonnox Menu Button
“Clip Lights” – Can be set to hold for 2 seconds, 5 seconds, or indefinitely.
“Show Preset Name Path” – Can show or hide the preset name path in the Preset Manager.
“Default to Log / Lin X-Axis” – Sets the default X-Axis display grid.
“Knob Mode” – Can be set to circular, relative circular, linear or follow host.
“About” – Displays the date, version and build number of the plug-in.
32
5.8
DeNoiser Signal / Control Flow Diagram
5.9
DeNoiser Stereo Behaviour
For correct stereo operation, when instantiated into a stereo track the DeNoiser has two
independent repair circuits.
In Manual mode, there is only one noise profile that is applied to both stereo channels.
In Freeze mode, there are two separate noise profiles, and both are displayed in the graph area.
In Auto mode, a single combined left and right noise profile is derived and displayed. This is so
that the stereo separation and sound field is preserved.
If there is a distinct difference in the noise content of the left and right channels in a stereo
signal, it is preferable to use Freeze mode where possible, or perhaps use a mono instantiation on
the individual left and right sources.
33
6.
Preset Manager
The Sonnox Restore plug-ins come equipped with their own onboard Preset Manager, which is
displayed at the top of the plug-in window as if the host created it. The reasoning behind this is
to allow increased portability of your presets across all the host applications, while also
providing a consistent and versatile interface. While most host platforms allow creation and
loading of presets, those host-created preset files are not portable between different host
applications. With the new preset manager for Oxford plug-ins, you can create a named preset in
one host application and load it while using an alternative application.
The Sonnox Preset Manager is described in full in the accompanying document (“The Sonnox
Preset Manager Manual”), which is available from the documentation pages on the Sonnox
website.
7.
Specifications
7.1 Sample Rates
The supported samples rates are 44.1, 48, 88.2 and 96kHz only.
7.2 Delays and CPU usage
The sample delays (latency) of each plug-in are in the following table:
ProTools RTAS
DeClicker
DeBuzzer
DeNoiser
44.1 / 48 kHz
3122 / 3200
7041
8064
88.2 / 96 kHz
6180 / 6336
14337
16384
VST
DeClicker
DeBuzzer
DeNoiser
44.1 / 48 kHz
2226 / 2304
6145
7168
88.2 / 96 kHz
4132 / 4288
12289
14336
Separately from the latency, the plug-ins address CPU usage in various ways. The user can take
advantage of advances in CPU power of modern computers if appropriate, but also use the plugins extensively with older and possibly lower-powered computers. Remember that generally,
even if the plug-in repair sections are not IN, the detection circuits are still active and will be
adding to the CPU load. Please also take note of the following comments regarding CPU usage:
34
Internal Buffer Sizes: Additionally, all three plug-ins use internal buffer sizes of 1024 for
44.1kHz and 48kHz operation and 2048 for 88.2kHz and 96kHz operation. We advise that the
buffer sizes of the sound card, and thus of the host application, are set to match these figures. If
the buffer sizes are not matched there will be an in-efficiency in the data transfer, and in some
applications this leads to uneven CPU behaviour.
DeClicker: The graphical area can be CPU-intensive if there are many detected events, for
example if the sensitivities are set very high and the thresholds are low. Additionally, the pop-up
displays can add CPU load and for that reason there is the option to turn off the pop-ups.
DeBuzzer: The peak profile window can be set to different widths. Using a wide window, which
allows for fundamental searching over a large frequency range, will mean that the CPU load will
be highest. There are the options to select either a mid-sized or narrow width window, which will
both reduce the CPU overhead.
DeNoiser: De-activating the DeHisser will reduce CPU load. De-activating the DeNoiser will
not affect CPU load significantly. There is little difference in CPU load between the Auto,
freeze, manual modes.
7.3 DeClicker
Nominal Pop duration:
Nominal Click duration:
Nominal Crackle duration:
2ms to 10 ms
0.1ms to 3 ms
< 0.4 ms
Dialogue Mode Voice Threshold:
Dialogue Mode LF Filter:
Dialogue Mode HF Filter:
Minimum Side-Channel Freq window:
Input trim:
Output trim:
0dB to -96dB
20Hz to (HF-15%)
(LF+15%) to 20kHz
15%
-12dB to +12dB
-12dB to 0dB
7.4 DeBuzzer
Fundamental Frequency Ranges:
20 to 160 Hz
160 to 1280 Hz
1280 to 20kHz
35
Width of the Frequency Detect window:
Narrow
Normal
Wide
LF
3%
12%
20%
MF
2%
8%
12%
Resolution of Frequency Adjustment:
Normal:
1.0 Hz
Fine:
0.01 Hz
Shift-fine:
0.0001 Hz
Bandwidth Range:
Sharp/Q:
Attenuation:
Tone:
75 Hz to 20kHz
16 to 160
0dB to -144dB
-96dB to -6dB
Input trim:
Output trim:
-12dB to +12dB
-12dB to 0dB
7.5 DeNoiser
DeHisser Section:
Cutoff:
Reduction:
3 kHz to 15 kHz
0dB to -24dB
Broadband Denoiser:
Threshold:
Reduction:
Tune:
Makeup:
24dB to -24dB
0dB to -24dB
3dB to 12dB
0dB to 12dB
HF Filter:
HF Cut:
Reduction:
1 kHz to 22 kHz
-18dB
Bias Handles:
18dB to -18dB
Input trim:
Output trim:
-12dB to +12dB
-12dB to 0dB
36
HF
0.5%
1.5%
2%
8.
Copyright and acknowledgements
The Sonnox Restore suite was developed by the design team at Sonnox Ltd., which includes
Nicolas Haynes, Nick Wiggins, Eric Smith, Josep Sola, Marcello Gagliardi, Matt Morton, Luke
Snape and Rod Densham. Caroline Dempster, Nathan Eames and Adam Gillicker also added
invaluable help to bring the product to market.
Trademarks and content copyright © 2009-Present Sonnox Ltd. All rights reserved.
These products are protected by several Patents pending in the UK, EU and the USA.
This product is manufactured and supplied by Sonnox Ltd.
DIGIDESIGN, AVID, and PRO TOOLS are trademarks or registered trademarks of Digidesign
and / or Avid Technology, Inc. All other trademarks are the property of their respective owners.
VST is a Trademark of Steinberg AG.
All other product and company names are trademarks or registered trademarks of their respective
holders.
9.
Manual Revision History
Version 1.0 date 20th November 2009 – First public version.
37
Platform Specific Supplement
S1. Supported Platforms
Digidesign ProTools (LE, RTAS, M-Powered)
VST Native
Audio Units Native
Mac OSX 10.4 or later (PowerPC and Intel)
Windows XP
S2. System Requirements
For latest System requirements, please see www.sonnoxplugins.com
Pro Tools
• Windows XP or Apple Mac OSX 10.4 or higher
• Approved Digidesign CPU and hardware configuration
• Pro Tools LE, M-Powered or HD v7.2 or above.
• iLok USB key, loaded with the appropriate authorisations.
VST Native
• Windows XP or Apple Mac OSX 10.4 or higher
• VST compliant host application (e.g. Nuendo, Cubase, Ableton Live, Acid, etc.)
• iLok USB key, loaded with the appropriate authorisations
Audio Units
• Approved Apple CPU and OSX 10.4 or higher
• Audio Unit Host application
• iLok USB key, loaded with the appropriate authorisations
38