1
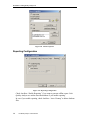
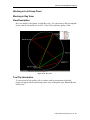
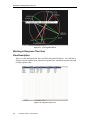
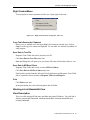
DVSINFO Link Quality Analyst 1.0 User Manual Revision 1.0 May 2003 DVSINFO’s Link Quality Analyst 1.0 ______________________________________________________ 2000-2002 by DVS Informatics Pvt. Ltd.. All rights reserved. Link Quality Analyst 1.0 to use with Microsoft Windows 9x, Windows ME, Windows NT, Windows 2000. Microsoft, Windows 95, Windows 98, Windows ME, Windows NT, Windows 2000 are trademarks of Microsoft Corp. Cisco is registered trademark of Cisco System Corp. Limited Warranty DVS Informatics Pvt. Ltd. warrants that the media on which the Software is distributed will be free from defects for a period of sixty (60) days from the date of delivery of the Software to you. Your sole remedy in the event of a breach of this warranty will be that DVS Informatics Pvt. Ltd. will, at its option, replace any defective media returned to DVS Informatics Pvt. Ltd. within the warranty period or refund the money you paid for the Software. DVS Informatics Pvt. Ltd. does not warrant that the Software will meet your requirements or that operation of the Software will be uninterrupted or that the Software will be error-free. Information in this manual is furnished for information use only. Its subject to change without notice. DVS Informatics Pvt. Ltd. doesn’t take any responsibility or liability for any error or inaccuracies that may appear in this manual. REGARDLESS OF WHETHER ANY REMEDY SET FORTH HEREIN FAILS OF ITS ESSENTIAL PURPOSE, IN NO EVENT WILL DVS BE LIABLE TO YOU FOR ANY SPECIAL, CONSEQUENTIAL, INDIRECT OR SIMILAR DAMAGES, INCLUDING ANY LOST PROFITS OR LOST DATA ARISING OUT OF THE USE OR INABILITY TO USE THE SOFTWARE EVEN IF DVS HAS BEEN ADVISED OF THE POSSIBILITY OF SUCH DAMAGES. IN NO CASE SHALL DVS Informatics Pvt. Ltd. LIABILITY EXCEED THE PUR-CHASE PRICE FOR THE SOFTWARE. The disclaimers and limitations set forth above will apply regardless of whether you accept the Software. Copyright and License The software which accompanies this license (the "Software") is the property of DVS Informatics Pvt Ltd and is protected by copyright Law. While DVS Informatics continues to own the Software, you will have rights to use the Software after your acceptance of this license. Your rights and obligations with respect to the use of this Software are as follows: • You may: 1) Use one copy of the Software on a single computer; 2) Make one copy of the Software for archival purposes, or copy the software onto the hard disk of your computer and retain the original for archival purposes; 3) Use the Software on a network, provided that you have a licensed copy of the Software for each computer that can access the Software over that network; • You may not: 4) copy the documentation which accompanies the Software; 5) sublicense, rent or lease any portion of the Software; 6) reverse engineer, decompile, disassemble, modify, translate, 7) Make any attempt to discover the source code of the Software, or create derivative works from the Software; or use a previous version or copy of the Software after you have received a disk replacement set or an upgraded version as a replacement of the prior version. 2000-2003 DVS Informatics Pvt. Ltd. 3 DVSINFO’s Link Quality Analyst 1.0 Ordering Link Quality Analyst To Purchase Link Quality Analyst License contact at DVS Informatics Pvt. Ltd. 31, Electronics complex, Pardeshipura Indore MP 452010 INDIA Email: [email protected] URL for Online order: www.dvsinfo.com Technical support DVS Informatics Pvt. Ltd. provides technical support as follows. By Fax at +91-731-5072058 By Phone at +01-731-5030024, 5032405 between 10:30 AM to 6:30 PM (GMT+5.30) By Email at [email protected] DVS Informatics Pvt. Ltd. provides free support for 1 year after purchase of License at no charge. Your invaluable suggestion, feedbacks are welcome. Please submit your suggestions, feedbacks, corrections or bug report at Fax or Email mentioned above. 4 Link Quality Analyst 1.0 User Manual ______________________________________________________ About the Guide Welcome to Link Quality Analyst 1.0 for monitoring and analyzing WAN utilization. This Manual is divided in 4 chapters and appendix. Chapter 1 will give you Introduction and Overview of Link Quality Analyst. This chapter also contains System Requirements for working with Link Quality Analyst. Chapter 2 contains instruction for Installation of Link Quality Analyst, Registering Link Quality Analyst and basic configuration of Cisco Link. Chapter 3 will give you detail of various GUI part of Link Quality Analyst. Chapter 4 provides you enough information to start working with Link Quality Analyst. Appendix A provides straightforward way to using Link Quality Analyst in various applications. 2000-2003 DVS Informatics Pvt. Ltd. 5 DVSINFO’s Link Quality Analyst 1.0 6 Link Quality Analyst 1.0 User Manual Table of Contents Limited Warranty ................................................................................................................3 Copyright and License ........................................................................................................3 Ordering Link Quality Analyst ..............................................................................................4 Technical support ...............................................................................................................4 About the Guide..................................................................................................................5 Table of Contents...........................................................................................................7 List of Figures .................................................................................................................9 Chapter 1 ........................................................................................................................11 Introduction to Link Quality Analyst .......................................................................11 Overview of Link Quality Analyst........................................................................................ 11 Important features......................................................................................................... 11 Minimum Requirements ................................................................................................ 12 Chapter 2 ........................................................................................................................13 Installation and Configuration ..................................................................................13 Installing Link Quality Analyst in Win9x/NT/2000 ................................................................. 13 Licensing.......................................................................................................................... 18 Registering ....................................................................................................................... 19 Chapter 3 ........................................................................................................................21 Display of Link Quality Analyst ................................................................................21 Link Tree Panel ................................................................................................................ 21 Link Group Tree............................................................................................................ 21 Right Click Menus ......................................................................................................... 22 View Panel ....................................................................................................................... 23 Link Group Panel .......................................................................................................... 23 Link Panel .................................................................................................................... 27 Main Menu ....................................................................................................................... 30 File Menu..................................................................................................................... 30 Edit.............................................................................................................................. 30 View Menu ................................................................................................................... 30 Tools Menu .................................................................................................................. 31 Window Menu .............................................................................................................. 31 Help Menu ................................................................................................................... 31 Toolbar ............................................................................................................................ 31 Chapter 4 ........................................................................................................................33 Working with Link Quality Analyst ..........................................................................33 Adding Link ...................................................................................................................... 33 General Configuration................................................................................................... 33 IP Configuration............................................................................................................ 34 Bandwidth Configuration ............................................................................................... 35 Polling Configuration ..................................................................................................... 35 Response Configuration ................................................................................................ 36 Alarm Configuration ...................................................................................................... 37 Reporting Configuration ................................................................................................ 38 Working in Link Group Panel ............................................................................................. 39 Working in Ray View ..................................................................................................... 39 View Description ........................................................................................................... 39 Tool Tip Information...................................................................................................... 39 Working in Response Time View ....................................................................................... 40 View Description ........................................................................................................... 40 Right Context Menu ...................................................................................................... 41 Working in Link Bandwidth View ........................................................................................ 41 2000-2003 DVS Informatics Pvt. Ltd. 7 DVSINFO’s Link Quality Analyst 1.0 View Description ........................................................................................................... 41 Right Context Menu ...................................................................................................... 42 Working in Packet Loss View............................................................................................. 43 View Description ........................................................................................................... 43 Right Context Menu ...................................................................................................... 43 Working in Link Panel ....................................................................................................... 44 Working in Table View .................................................................................................. 45 View Description ........................................................................................................... 45 Right Context Menu ...................................................................................................... 45 Working in Graph View...................................................................................................... 46 Graph Description......................................................................................................... 46 Right Context Menu ...................................................................................................... 47 Working in Alarm Log view ................................................................................................ 49 View Description ........................................................................................................... 49 Right Context Menu ...................................................................................................... 50 Working in Report view ..................................................................................................... 51 View Description ........................................................................................................... 51 Right Context Menu ...................................................................................................... 53 Report Header Right Context Menu ............................................................................... 53 Report Body Right Context Menu (In the Grid)................................................................ 54 Report Body Right Context Menu (on the Graph) ............................................................ 55 8 Link Quality Analyst 1.0 User Manual List of Figures Figure Figure Figure Figure Figure Figure Figure Figure Figure Figure Figure Figure Figure Figure Figure Figure Figure Figure Figure Figure Figure Figure Figure Figure Figure Figure Figure Figure Figure Figure Figure Figure Figure Figure Figure Figure Figure Figure Figure Figure Figure Figure Figure Figure Figure Figure 3-1. Link Quality Analyst Display ................................................................................ 21 3-2. Link Tree Panel .................................................................................................. 22 3-3. Link Tree............................................................................................................ 22 3.4. Right Click Menu on Link Group........................................................................... 22 3-5. Right Context Menu on Link Node........................................................................ 23 3-6. Link Group Panel ................................................................................................ 24 3-7. Color Indication .................................................................................................. 24 3-8. Ray View............................................................................................................ 25 3-9. Response Time View .......................................................................................... 25 3-10. Link Bandwidth View ......................................................................................... 26 3-11. Packet Loss View ............................................................................................. 26 3-12. Link Panel ........................................................................................................ 27 3-13. Table View ....................................................................................................... 28 3-14. Graph View ...................................................................................................... 28 3-15. Alarm Log View ................................................................................................ 29 3-16. Report View...................................................................................................... 30 3-17. Tool Bar ........................................................................................................... 31 4-1. Add Link ............................................................................................................. 33 4-2. General Configuration ......................................................................................... 34 4-3. IP Configuration.................................................................................................. 34 4-4. Bandwidth Configuration ..................................................................................... 35 4-5. Polling Configuration ........................................................................................... 36 4-6. Response Configuration ...................................................................................... 36 4-7. Alarm Configuration ............................................................................................ 37 4-9. Reporting Configuration ...................................................................................... 38 4-10. Ray View.......................................................................................................... 39 4-11. Tool Tip Information .......................................................................................... 40 4-12. Response Time View ........................................................................................ 40 4-13. Right Context Menu on Response Time view ...................................................... 41 4-14. Link Bandwidth View ......................................................................................... 42 4-15. Right Context Menu on Link Bandwidth view....................................................... 42 4-16. Packet Loss View ............................................................................................. 43 4-17. Right Context Menu on Packet Loss view........................................................... 44 4-18. Table View ....................................................................................................... 45 4-19. Right Context Menu on Table View .................................................................... 46 4-20. Graph View ...................................................................................................... 46 4-21. Right Context Menu on Graph View ................................................................... 47 4-22. X-Axis Configuration ......................................................................................... 48 4-23. Y-Axis Configuration ......................................................................................... 48 4-24. Series color configuration .................................................................................. 49 4-25. Alarm Log View ................................................................................................ 50 4-26. Right Context Menu on Alarm Log view.............................................................. 50 4-27. Report header .................................................................................................. 51 4-29. Right Context Menu on Report Header ............................................................... 53 4-30. Right Context Menu on Report Body (on the Grid)............................................... 54 4-31. Right Context Menu on Report Body (on the Graph)............................................ 55 2000-2003 DVS Informatics Pvt. Ltd. 9 DVSINFO’s Link Quality Analyst 1.0 10 Link Quality Analyst 1.0 User Manual Introduction to Link Quality Analyst Chapter 1 Introduction to Link Quality Analyst Overview of Link Quality Analyst Link Quality Analyst monitor quality of point-to-point link in terms of response time, packet loss and available bandwidth. It also provides notification system to alarm for failure of Link or degradation in Link quality. Real time statistics of link quality parameters combine with Graphical view to provide more visual effect for link quality analysis. Offline viewing or reporting provides historical interpretation. Easy report generation make management documentation more simple. Important features 1. Real time monitoring of Link Quality i.e. Response time, Packet Loss, Available Bandwidth. 2. Event Notification for Link Failure or link quality degradation. 3. Provides Graphical view of real time statistics. 4. Reporting for historical interpretation and assessment of third party service level agreement. Real time Monitoring Link quality can be defined by response time, available bandwidth and percentage of packet loss. All three parameter can be monitor in two different views, table and line graphs. Table view gives real time values of link quality parameters. Line graphs for each facile ate to visualize trends in link quality. Event Notification Event will generate if link falls in any of category out of unavailable, poor and marginal. Thresholds values can be defined by user for each category. Different color icons setup for varying level of link degradation. Trigger or alarms can be set to cause event to generate alarms for link failure or link quality degradation. Alarm action includes playing user defined sound, change of Icon colors, sending an email and keeping a log. 2000-2003 DVS Informatics Pvt. Ltd. 11 DVSINFO’s Link Quality Analyst 1.0 Reporting for offline analysis and SLA assessment All events and real time statistics keep in database for future analysis and for third party Service level Agreement assessment. All problem and issues can be documented for providing to management or service providers. Minimum Requirements Hardware Pentium 300 MHz. 32 MB RAM, Mouse, Color VGA Monitor running at 800x600 and Network Interface card configured for TCP/IP. Operating System Link Quality Analyst can work on PC running Windows 9x, Windows Millennium Addition, Windows NT and Windows 2000 with Winsock 2.0 compliant TCP/IP on network interface card 12 Link Quality Analyst 1.0 User Manual Installation and Configuration Chapter 2 Installation and Configuration Link Quality Analyst can install from either Link Quality Analyst CD or from Internet. If you are installing Link Quality Analyst from CD, insert Link Quality Analyst CD into CD drive and run Link Quality Analyst1.0.exe from D:\install\setup.exe (assuming CD drive is D: on your system). Another way is to download Latest Version of Link Quality Analyst from www.dvsinfo.com, and run setup program. Link Quality Analyst always install as Evaluation Version, Licensing Section contains instruction to bring Link Quality Analyst into Registered Version. Installation of current version of Link Quality Analyst doesn’t require uninstalling previous version of Link Quality Analyst. Installing Link Quality Analyst in Win9x/NT/2000 If you are installing Link Quality Analyst in WinNT/2000, make sure you have log on with Administrator User Account. Installation of Link Quality Analyst is straightforward. Start installation by double click setup.exe. Setup will display Welcome screen. Click Next 2000-2003 DVS Informatics Pvt. Ltd. 13 DVSINFO’s Link Quality Analyst 1.0 Setup will Display Software License Agreement, Click Yes if agree to Continue. Setup will display Readme file of Link Quality Analyst 1.0. Click Next after reading it completely. Setup will ask for user information. Enter your and your Company Name and click Next. 14 Link Quality Analyst 1.0 User Manual Installation and Configuration Setup will ask to choose folder, where Link Quality Analyst will install. Click Next after selecting destination folder. If you choose default option, setup will install Link Quality Analyst in program files folder of your windows system. Setup will display information you have entered. Click Next if you are confirmed that information you entered are right otherwise click Back and change it. Setup will ask for user information. Enter your and your Company Name and click Next. Setup will ask for user to select the setup Type to install. Click the type of setup you prefer then click next . 2000-2003 DVS Informatics Pvt. Ltd. 15 DVSINFO’s Link Quality Analyst 1.0 Setup will add program icons to the program folder listed below. You may type a new folder name , or select one from the existing folder list , Click Next to continue. Setup has enough information to start copying the program files . if you want to review or change any settings, click Back , if you are satisfied with the settings , click Next to begin copying files. 16 Link Quality Analyst 1.0 User Manual Installation and Configuration Setup will now copy Link Quality Analyst files into appropriate folder. 2000-2003 DVS Informatics Pvt. Ltd. 17 DVSINFO’s Link Quality Analyst 1.0 Click Finish,and that’s it. After successful installation you can run Link Quality Analyst by double clicking Link Quality Analyst 1.0 icon in Link Quality Analyst 1.0 Program Group. Licensing When Link Quality Analyst installed first time on system, it will work for 30 days of evaluation period with full functionality. After that you need to purchase License and Register Link Quality Analyst. You can Register Link Quality Analyst at any time during evaluation period or after expiration of Link Quality Analyst Evaluation version. Launch Link Quality Analyst Application Click Purchase Now, you will automatically go to our Web site from where you can purchase Link Quality Analyst online. 18 Link Quality Analyst 1.0 User Manual Installation and Configuration After getting order confirmation, Link Quality Analyst License Key will be E- mailed to you. To continue registration process Click Enter Keys Enter License Key that you have got by Email and press Register. Please keep this License Key in safe and secure place. After key validation Evaluation Version will convert to licensed version Registering If you have licensed Link Quality Analyst, please register your information into our database. It will help us to keep you update for new releases and other important news releases. Click on Help->Register menu. It will launce your default browser and open registration form from our website. Fill your information and click on Submit. You will be our register user now. 2000-2003 DVS Informatics Pvt. Ltd. 19 DVSINFO’s Link Quality Analyst 1.0 20 Link Quality Analyst 1.0 User Manual Display of Link Quality Analyst Chapter 3 Display of Link Quality Analyst Link Quality Analyst GUI is buildup with 4 parts. Main Menu, Link tree Panel, View Panel and Toolbar. Figure 3-1. Link Quality Analyst Display Link Tree Panel Link Group Tree All Links are member of Link tree in Link tree Panel. Every time when you add new Link (See Section Adding Link of Chapter 4) an entry is created in tree with the same name as of Link Name given while adding Link. 2000-2003 DVS Informatics Pvt. Ltd. 21 DVSINFO’s Link Quality Analyst 1.0 Figure 3-2. Link Tree Panel Color indicator adjacent to link name shows quality of that link. Red Indicator indicates link is down, green indicates link quality is poor, green indicates links quality is marginally good while green indicator indicates link quality is good. Figure 3-3. Link Tree Right Click Menus Different Operation can be performed on Link Group and Link, Add Link, Remove Link, Link Configuration, Database Cleanup, Start Polling and Stop Polling. Right Click Menu on Link Group Figure 3.4. Right Click Menu on Link Group Add Link – Add New Link entry in Link Group Tree. 22 Link Quality Analyst 1.0 User Manual Display of Link Quality Analyst Right Click Menu on Link Node Figure 3-5. Right Context Menu on Link Node Start Polling – Start Polling of the selected link. Stop Polling – Stop Polling of the selected link. Link Configuration – Show Link Configuration Sheet with all configurations relates to selected link. Database Cleanup – Show Database Cleanup Dialog Box with all the database files in the list from where user can select and clean the Database. Remove Link – Remove the selected link from the Link Group. View Panel Right panel of main windows is named as View Panel. Here you will get output of all operations. View panel have two different type of panel Link Group Panel and Link Panel Link Group Panel There are four different views on Link Group Panel Ray view, Response Time view, Link Bandwidth view, Packet Loss view. 2000-2003 DVS Informatics Pvt. Ltd. 23 DVSINFO’s Link Quality Analyst 1.0 Figure 3-6. Link Group Panel View Panel - It contain all View in the Link Panel. Scroll Panel - It control the Scrolling movement of the Tab Panel. Tab Panel - It contain Tabs for Each View in the View Panel. Ray View Ray View displays all Links added in Link Group by color Ray terminated on two points of big circle. These two points corresponds to end points of Link. Color of ray indicates quality of Link. Figure 3-7. Color Indication 24 Link Quality Analyst 1.0 User Manual Display of Link Quality Analyst Figure 3-8. Ray View Response Time View This view have table showing response time of all links added in link group. Figure 3-9. Response Time View 2000-2003 DVS Informatics Pvt. Ltd. 25 DVSINFO’s Link Quality Analyst 1.0 Link Bandwidth View This view have table showing bandwidth of all links in link group Figure 3-10. Link Bandwidth View Packet Loss View This view have table showing packet loss at all links. Figure 3-11. Packet Loss View 26 Link Quality Analyst 1.0 User Manual Display of Link Quality Analyst Link Panel Each Link is having its own panel window Link Panel, which again having four different views on this Link Panel Table view, Graph view, Alarm Log view, Report view. Figure 3-12. Link Panel View Panel - It contain all View in the Link Panel. Scroll Panel - It control the Scrolling movement of the Tab Panel. Tab Panel - It contain Tabs for Each View in the View Panel. Polling Panel - It Show/Control the Polling State of the Link. Table View Current values of Link Quality parameters, these are Response Time, Link Bandwidth and Percentage Packet Loss display in tabular form. Values of this parameters refresh on every refresh rate configured for this link. 2000-2003 DVS Informatics Pvt. Ltd. 27 DVSINFO’s Link Quality Analyst 1.0 Figure 3-13. Table View Graph View Graph view display 24 hour trends of Response time, Packet Loss, and Link Bandwidth in line chart. Red color series in each chart displays link downtime period. Figure 3-14. Graph View Alarm Log View On user defined events alarms tiger to notify user for that event. Alarm log view display when and why alarm tigers. 28 Link Quality Analyst 1.0 User Manual Display of Link Quality Analyst Figure 3-15. Alarm Log View Report View Historic Interpretation and offline analysis of selected Link can be done in this view. This view generate reports in table and graph both. 2000-2003 DVS Informatics Pvt. Ltd. 29 DVSINFO’s Link Quality Analyst 1.0 Figure 3-16. Report View Main Menu File Menu Save Link Group – This menu option take save a mirror copy of all links in link group with all link configurations in the text file. Save Links – Save links take backup of only the selected link configuration in text file. Load Links/Link Group – Load Links/Link Group load links / link group from text and configure the Link Quality Analyst software Exit – For exiting from Link Quality Analyst. Edit Copy – Copy the selected data to the clipboard. View Menu Toolbar – The View Panel show/hide the Toolbar. Status Bar – The View Panel show/hide the Status Bar. 30 Link Quality Analyst 1.0 User Manual Display of Link Quality Analyst Link Group – The View Panel show/hide the Link Group Panel. Tools Menu Add Link – Add New Link entry in Link Group Tree. Remove Link – Remove Selected Link from Link Group Tree. Link Configuration – Modify configuration of currently selected link. Database Cleanup – Manually clean report database of selected link. Start Polling – Start polling on selected link. Stop Polling – Stop polling on selected link. Window Menu Cascade – cascades the specified Link windows. Tile – Tile the specified Link windows. Help Menu Contents – Open Online Help. Purchase – Redirect to URL where you can purchase Link Quality Analyst license online. Register – If you have purchase licensed and have convert Evaluation version of Link Quality Analyst to Licensed version, this menu will enabled. This is to register Licensed user’s information in our database so that, user can be informed about new releases and other news. About Link Quality Analyst – Shows Link Quality Analyst license information. Toolbar Figure 3-17. Tool Bar 2000-2003 DVS Informatics Pvt. Ltd. 31 DVSINFO’s Link Quality Analyst 1.0 32 Link Quality Analyst 1.0 User Manual Working with Link Quality Analyst Chapter 4 Working with Link Quality Analyst Adding Link The very first step to start working with Link Quality Analyst is to add Link Name in Link tree and a configuration parameters need to be given. All operations on Link can be performed, after adding entry in Link tree. First time when you launch Link Quality Analyst, you will see Link tree panel with only single entry named Link Group and a blank View Panel. All newly added Link will come under Link Group. Right Click on Link Group to open a Popup Menu and then click Add Link. Figure 4-1. Add Link Add Link tab dialog box will popup. General Configuration Link Name – Give a friendly name of Link, this will be displayed in Link Tree Panel under Link Group. Description – Give some meaning description related to Link so it helps in recognizing and remembering link and this description will show in tool tip. 2000-2003 DVS Informatics Pvt. Ltd. 33 DVSINFO’s Link Quality Analyst 1.0 Figure 4-2. General Configuration IP Configuration IP Configuration tab can’t be open until Link Name string are not given. End Point1 – End Point1 must be near end of link. End Point1 – End Point1 must be far end of link. Figure 4-3. IP Configuration 34 Link Quality Analyst 1.0 User Manual Working with Link Quality Analyst Bandwidth Configuration This functionality is reserved for the future Expansion Figure 4-4. Bandwidth Configuration Polling Configuration Enable – Enable means enable the auto polling of link so it start polling link. Disable – Disable means disable the auto polling of link so it stop polling link. Size of Small Packets – To measure bandwidth Link Quality Analyst sends ICMP echo packets of two different size. Enter size of small ICMP packet. Size of Large Packets – Enter size of Large ICMP packet. Timeout – Enter ICMP echo timeout. Frequency of Polling – After how much time poll end points for refreshing link quality parameters. 2000-2003 DVS Informatics Pvt. Ltd. 35 DVSINFO’s Link Quality Analyst 1.0 Figure 4-5. Polling Configuration Response Configuration Figure 4-6. Response Configuration Link Quality categorize into Unavailable, Poor, Marginal and Good. You can define category by entering response time for that link. Response time is corresponds to small size ICMP packet you configured in polling configuration. 36 Link Quality Analyst 1.0 User Manual Working with Link Quality Analyst Alarm Configuration Figure 4-7. Alarm Configuration Alarm tiger on user defined event. In this tab you can configure event for which alarm will tiger and alarm action for each event. Events for which alarm tiger are if Link is down, Link quality is poor, marginally good or good. Check checkbox of particular event if you want to generate alarm for this event. To configure alarm action click on |Setting…| button. Alarm Properties dialog box will open. 2000-2003 DVS Informatics Pvt. Ltd. 37 DVSINFO’s Link Quality Analyst 1.0 Figure 4-8. Alarm Properties Reporting Configuration Figure 4-9. Reporting Configuration Check checkbox “Enable Reporting” if you want to generate offline report. Link Quality Analyst save online data into database if you enable reporting. In case if you enable reporting, check checkbox “Auto Cleanup” to delete database files. 38 Link Quality Analyst 1.0 User Manual Working with Link Quality Analyst Working in Link Group Panel Working in Ray View View Description Ray view display Link Quality in Light Ray style. Two end points of link corresponds to two point on circumference of circle. Color of Ray indicates quality of link. Figure 4-10. Ray View Tool Tip Information To exact detail of link quality, roll over mouse on Ray corresponds to that link, tooltip will appear which will having current value of Response time, Bandwidth and Packet Loss. 2000-2003 DVS Informatics Pvt. Ltd. 39 DVSINFO’s Link Quality Analyst 1.0 Figure 4-11. Tool Tip Information Working in Response Time View View Description This view table having all link name and their end points IP address. For each link it displays current response time, minimum response time, maximum response time and average response time. Figure 4-12. Response Time View 40 Link Quality Analyst 1.0 User Manual Working with Link Quality Analyst Right Context Menu You can perform various operation on this view. Open right click menu… Figure 4-13. Right Context Menu on Response Time view Copy Table Data to the Clipboard Select a row or multiple rows and open Right click menu on selected area, click on Copy. It will copy row content on clipboard. Yu can either use shortcut key ctrl+c for same purpose. Save Data in Text File Response Time Table data can be saved as text file. Click Save Data in Text File menu item. Save As Dialog box will open to let you choose file name and location where to save. Save Data in MS Excel Sheet Response Time Table data can be saved as MS Excel Sheet. Click Save Data in MS Excel Sheet menu item. Link Quality Analyst launches Microsoft Excel application and Response Time Table data is exported to sheets, named as Response Time Overall Report. Print Click Print menu item. In the print dialog box, select desired printer and click Ok. Working in Link Bandwidth View View Description This view table having all link name and their end points IP address. For each link it displays current link bandwidth, minimum bandwidth, maximum bandwidth and average bandwidth. 2000-2003 DVS Informatics Pvt. Ltd. 41 DVSINFO’s Link Quality Analyst 1.0 Figure 4-14. Link Bandwidth View Right Context Menu You can perform various operations on this view. Open right click menu… Figure 4-15. Right Context Menu on Link Bandwidth view Copy Table Data to the Clipboard Select a row or multiple rows and open Right click menu on selected area, click on Copy. It will copy row content on clipboard. you can either use shortcut key ctrl+c for same purpose. Save Data in Text File Response Time Table data can be saved as text file. Click Save Data in Text File menu item. Save As Dialog box will open to let you choose file name and location where to save. 42 Link Quality Analyst 1.0 User Manual Working with Link Quality Analyst Save Data in MS Excel Sheet Response Time Table data can be saved as MS Excel Sheet. Click Save Data in MS Excel Sheet menu item. Link Quality Analyst launches Microsoft Excel application and Response Time Table data is exported to sheets, named as Response Time Overall Report . Print Click Print menu item. In the print dialog box, select desired printer and click Ok. Working in Packet Loss View View Description This view table having all link name and their end points IP address. For each link it displays current percentage packet loss, minimum percentage packet loss, maximum percentage packet loss and average percentage packet loss. Figure 4-16. Packet Loss View Right Context Menu You can perform various operations on this view. Open right click menu… 2000-2003 DVS Informatics Pvt. Ltd. 43 DVSINFO’s Link Quality Analyst 1.0 Figure 4-17. Right Context Menu on Packet Loss view Copy Table Data to the Clipboard Select a row or multiple rows and open Right click menu on selected area, click on Copy. It will copy row content on clipboard. you can either use shortcut key ctrl+c for same purpose. Save Data in Text File Response Time Table data can be saved as text file. Click Save Data in Text File menu item. Save As Dialog box will open to let you choose file name and location where to save. Save Data in MS Excel Sheet Response Time Table data can be saved as MS Excel Sheet. Click Save Data in MS Excel Sheet menu item. Link Quality Analyst launches Microsoft Excel application and Response Time Table data is exported to sheets, named as Response Time Overall Report. Print Click Print menu item. In the print dialog box, select desired printer and click Ok. Working in Link Panel Link Panel corresponds to particular link only. You can open Link Panel of selected link by double click on link name in link tree. More then one Link Panel window can be open. 44 Link Quality Analyst 1.0 User Manual Working with Link Quality Analyst Working in Table View View Description This view displays values of link quality parameters of selected link in tabular form. Link Quality parameters are Response Time i.e round trip delay on that link. It measures by sending ICMP ping packets. Link bandwidth measures in Kb/Sec. Packet loss measures by difference in number of transmitted and received packets. Each parameter has four values. Current, Minimum, Maximum and Average. Current value gets while latest refresh. Minimum is minimum of all those values got up to now. Same for maximum and for average values. Link bandwidth doesn’t means with available link bandwidth. Its actual bandwidth of link. Figure 4-18. Table View Right Context Menu 2000-2003 DVS Informatics Pvt. Ltd. 45 DVSINFO’s Link Quality Analyst 1.0 Figure 4-19. Right Context Menu on Table View Start Polling Click Start Polling menu item to start auto polling of link. Stop Polling Click Stop Polling menu item to stop auto polling of link. Copy Select a row or multiple rows and open Right click menu on selected area, click on Copy. It will copy row content on clipboard. you can either use shortcut key ctrl+c for same purpose. Link Configuration Click Link Configuration menu item. Link Configuration Property Sheet will open with all Configuration Details. user can modify the Link Configuration and save by click ok Button. Working in Graph View Graph Description Click on Graph tab of Tab Panel. Graphs view will be activated. There are three different chart for three link quality parameters. Graphs shows trends of 24 hours from 12.00 A.M to 12.00 PM. Red color series indicates link downtime period. Figure 4-20. Graph View 46 Link Quality Analyst 1.0 User Manual Working with Link Quality Analyst Right Context Menu Figure 4-21. Right Context Menu on Graph View Start Polling Click Start Polling menu item to start auto polling of link. Stop Polling Click Stop Polling menu item to stop auto polling of link. Link Configuration Click Link Configuration menu item. Link Configuration Property Sheet will open with all Configuration Details. user can modify the Link Configuration and save by click apply/ok Button. Chart Configuration Click Chart Configuration menu item. Each chart has their own configuration related to X-Axis and Y-Axis and Series Color. Chart Configuration Property Sheet will open with all Configuration Details. user can modify the Chart Configuration and save by click apply/ok Button. X-Axis Configuration Time interval is interval between two labels on x axis and Pixel per interval is no of pixels between two time interval labels. Various combination of both of this parameters decide the 2000-2003 DVS Informatics Pvt. Ltd. 47 DVSINFO’s Link Quality Analyst 1.0 Figure 4-22. X-Axis Configuration Y-Axis Configuration Auto Size will automatically adjust the maximum value of the Y-axis based on the maximum value of its associated Series. Force Maximum will forcefully Set the maximum value of the Y-axis based on the maximum value given in the Y-Axis Property Page. Figure 4-23. Y-Axis Configuration Series color configuration Series Color - Color in which the Series points will be drawn on. 48 Link Quality Analyst 1.0 User Manual Working with Link Quality Analyst Figure 4-24. Series color configuration Save as Picture Select the desired Chart(if more than one) on the View to saved in a image format. 1. Right click to open Popup menu on selected area, 2. Click on Save as picture. A file dialog box will open where you can select path and file name to save charts bitmap image. Working in Alarm Log view View Description Click on Alarm Log tab of Tab Panel. Alarm Log view will be activated. These view will maintain and show when and which type of alarm was generated as per Alarm Setting and Link Quality. 2000-2003 DVS Informatics Pvt. Ltd. 49 DVSINFO’s Link Quality Analyst 1.0 Figure 4-25. Alarm Log View Right Context Menu Figure 4-26. Right Context Menu on Alarm Log view Start Polling Click Start Polling menu item to start auto polling of link. Stop Polling Click Stop Polling menu item to stop auto polling of link. Copy Select a row or multiple rows and open Right click menu on selected area, click on Copy. It will copy row content on clipboard. you can either use shortcut key ctrl+c for same purpose. 50 Link Quality Analyst 1.0 User Manual Working with Link Quality Analyst Link Configuration Click Link Configuration menu item. Link Configuration Property Sheet will open with all Configuration Details. User can modify the Link Configuration and save by click ok Button. Log Cleanup Log Cleanup Clean the log of Selected link from view and from file. It is basically manual cleanup of the log. Click Log Cleanup menu item. Before Cleaning log detail Link Quality Analyst show a confirmation message box to confirm before Deletion. Working in Report view View Description Click on Report tab of Tab Panel. Report view will be activated. These view contain two parts Report Header and Report Body . Report Header will take all input parameter for the generation of the report Figure 4-27. Report header Report Header contain :Report Type - Report type means Link Quality Analyst will generate two type of report 1. Link Quality Analysis – In these all over the analysis of the link data like for Response time , Link Bandwith ,Packet Loss and link down an up. 2. Link Down Time Analysis – In these type report only down time analysis happen like when link is down. Report Properties – contain Report period and Average Time Interval and Custom Report Period. Report Period – It is a period for which the report will generate. 2000-2003 DVS Informatics Pvt. Ltd. 51 DVSINFO’s Link Quality Analyst 1.0 Custom Report Period – It become enable when report period set to Custom, It is a user defined report period Average Time Interval – It is Interval as the link data will accumulate Generate Report Button – After all setting user have just click on the Generate Button to generate the report Report Body: - Contain two type of the view 1. Link Quality Analysis view 2. Link Down Time Analysis view Link Quality Analysis view – will show Report period data in both grid and graph, it contain individual grid and graph for Response Time, Link Bandwidth, Packet Loss. Link Down Time Analysis view – will show down time data in the grid. Figure 4-28. Report Body 52 Link Quality Analyst 1.0 User Manual Working with Link Quality Analyst Right Context Menu Report Header Right Context Menu Figure 4-29. Right Context Menu on Report Header Start Polling Click Start Polling menu item to start auto polling of link. Stop Polling Click Stop Polling menu item to stop auto polling of link. Link Configuration Click Link Configuration menu item. Link Configuration Property Sheet will open with all Configuration Details. user can modify the Link Configuration and save by click ok Button. Database Cleanup Database Cleanup Clean the Database of Selected link. It is basically manual cleanup of the Database. Click Database Cleanup menu item. Database Cleanup Dialog Box will open containing all database existing file in the list control, user can manually select which day data want to delete select that day file (database file name will contain first the link name and then the date in the mm.dd.yyyy format). Then click clean Button. Show Report Body Show Report Body will resize the both the part (Report Header and Report Body). Click Show Report Body will maximize the Report Body. 2000-2003 DVS Informatics Pvt. Ltd. 53 DVSINFO’s Link Quality Analyst 1.0 Report Body Right Context Menu (In the Grid) Figure 4-30. Right Context Menu on Report Body (on the Grid) Start Polling Click Start Polling menu item to start auto polling of link. Stop Polling Click Stop Polling menu item to stop auto polling of link. Copy Table Data to the Clipboard Select a row or multiple rows and open Right click menu on selected area, click on Copy. It will copy row content on clipboard. You can either use shortcut key ctrl+c for same purpose. Save Data in Text File Response Time Table data can be saved as text file. Click Save Data in Text File menu item. Save As Dialog box will open to let you choose file name and location where to save. Save Data in MS Excel Sheet Response Time Table data can be saved as MS Excel Sheet. Click Save Data in MS Excel Sheet menu item. Link Quality Analyst launches Microsoft Excel application and Response Time Table data is exported to sheets, named as Response Time Overall Report. Print Click Print menu item. In the print dialog box, select desired printer and click Ok. 54 Link Quality Analyst 1.0 User Manual Working with Link Quality Analyst Link Configuration Click Link Configuration menu item. Link Configuration Property Sheet will open with all Configuration Details. User can modify the Link Configuration and save by click ok Button. Database Cleanup Database Cleanup Clean the Database of Selected link. It is basically manual cleanup of the Database. Click Database Cleanup menu item. Database Cleanup Dialog Box will open containing all database existing file in the list control, user can manually select which day data want to delete select that day file (database file name will contain first the link name and then the date in the mm.dd.yyyy format). Then click clean Button. Show Report Header Show Report Header will resize the both the part (Report Header and Report Body). Click Show Report Header will maximize the Report Header. Report Body Right Context Menu (on the Graph) Figure 4-31. Right Context Menu on Report Body (on the Graph) Start Polling Click Start Polling menu item to start auto polling of link. Stop Polling Click Stop Polling menu item to stop auto polling of link. Link Configuration Click Link Configuration menu item. Link Configuration Property Sheet will open with all Configuration Details. user can modify the Link Configuration and save by click ok Button. 2000-2003 DVS Informatics Pvt. Ltd. 55 DVSINFO’s Link Quality Analyst 1.0 Save as Picture Select the desired Chart (if more than one) on the View to save in a image format. 3. Right click to open Popup menu on selected area, 4. Click on Save as picture. A file dialog box will open where you can select path and file name to save charts bitmap image. Database Cleanup Database Cleanup Clean the Database of Selected link. It is basically manual cleanup of the Database. Click Database Cleanup menu item. Database Cleanup Dialog Box will open containing all database existing file in the list control, user can manually select which day data want to delete select that day file (database file name will contain first the link name and then the date in the mm.dd.yyyy format). Then click clean Button. Show Report Header Show Report Header will resize the both the part (Report Header and Report Body). Click Show Report Header will maximize the Report Header. 56 Link Quality Analyst 1.0 User Manual