1
Compact Manual Edition 1/2007
COMPACT MANUAL
MicroSAM
TM
and MaxumTM
pro
ces
s
p
GAS CHROMATOGRAPHY
Compact Manual
MicroSAM and Maxum
Revised Printing – Jaunuary 2007
2000683-002
Copyright Notice
© 2007 by Siemens
All rights reserved.
This publication is for information only. The contents are subject to change without notice and should not
be construed as a commitment, representation, warranty, or guarantee of any method, product, or device
by Siemens.
Reproduction or translation of any part of this publication beyond that permitted by Sections 107 and 109
of the United States Copyright Act without the written consent of the copyright owner is unlawful.
Inquiries regarding this manual should be addressed to:
Siemens Energy & Automation, Inc.
7101 Hollister Road
Houston, TX 77040 U.S.A.
Trademarks
Maxum, Maxum edition II and MicroSAM are trademarks of Siemens.
Table of Contents
Technical Support......................................................................................................................... iii
Safety Practices and Precautions
v
Introduction
1
MMI / MMI Emulation...................................................................................................................... 2
EZChrom General Description...................................................................................................... 3
System Manager............................................................................................................................. 4
Installation
5
Minimum PC Requirements .......................................................................................................... 5
Workstation Software .................................................................................................................... 6
Configure the Network Address for a GC ................................................................................... 7
GC Operation
9
Alarms ............................................................................................................................................. 9
MMI Procedure .......................................................................................................................... 9
System Manager Procedure.................................................................................................... 10
Backup & Restore ........................................................................................................................ 11
Backup/Restore a Stream Sequence ...................................................................................... 11
Backup/Restore EZChrom Methods........................................................................................ 11
Backup/Restore GC Configuration .......................................................................................... 12
Load/Unload a Database Text File.......................................................................................... 12
Load/Unload a Modbus Map ................................................................................................... 13
Calibration .................................................................................................................................... 14
Auto-Calibrate an Application.................................................................................................. 14
Change Auto-Calibration Margins ........................................................................................... 15
Connect to a Remote GC ........................................................................................................ 15
Manually Calibrate an Application ........................................................................................... 17
Update a Calibration Blend ..................................................................................................... 18
Chromatograms ........................................................................................................................... 19
Re-analyze a Chromatogram .................................................................................................. 19
Save Chromatograms.............................................................................................................. 19
View a Real-time Chromatogram ............................................................................................ 20
View Chromatograms .............................................................................................................. 21
Cycle.............................................................................................................................................. 22
Change Cycle Time ................................................................................................................. 22
Run a GC Application .............................................................................................................. 22
Detectors....................................................................................................................................... 23
Bridge Current of TCD (MicroSAM Only) ................................................................................ 23
Ignite the FID (MAXUM Only).................................................................................................. 23
Ignite the FPD (MAXUM Only) ................................................................................................ 24
Polarity of Detector Signals ..................................................................................................... 25
Status and Settings of Detector............................................................................................... 25
I/O, Discrete .................................................................................................................................. 26
View/Modify I/O ....................................................................................................................... 26
2000683-001
Table of Contents • i
Table of Contents, Continued
Integration..................................................................................................................................... 27
Modify Data Acquisition Time .................................................................................................. 27
Modify Peak Detection and Integration ................................................................................... 27
LED’s ............................................................................................................................................. 29
MaxBasic....................................................................................................................................... 30
Change a MaxBasic Program Schedule (Frequency or Time of Day) .................................... 30
Change a MaxBasic Program Schedule (from an event)........................................................ 31
Run a MaxBasic Program Manually ........................................................................................ 32
View/Change Program Parameters......................................................................................... 32
Passwords .................................................................................................................................... 34
Pressure Controller ..................................................................................................................... 35
Change a Pressure Controller Set Point ................................................................................. 35
Enable/Disable a Pressure Controller ..................................................................................... 35
Results .......................................................................................................................................... 36
Save Results ........................................................................................................................... 36
Transmit Results...................................................................................................................... 37
View Component Results for an Application ........................................................................... 44
Software Upgrade ........................................................................................................................ 46
Upgrade Maxum Software from 4.1 Workstation .................................................................... 46
Upgrade MicroSAM Software from 4.1 Workstation ............................................................... 47
Streams ......................................................................................................................................... 48
Enable/Disable a Stream......................................................................................................... 48
Force a Stream........................................................................................................................ 48
Temperature Controller ............................................................................................................... 49
Change a Temperature Controller Set Point........................................................................... 49
Enable/Disable a Temperature Controller............................................................................... 49
Time & Date .................................................................................................................................. 50
Set GC Time/Date ................................................................................................................... 50
Set GC Time Server ................................................................................................................ 51
Validation ...................................................................................................................................... 52
Change Auto-Validation Values & Margins ............................................................................. 52
Validate an Application ............................................................................................................ 52
Adjustments
53
MMI Display Contrast Adjustment (Maxum only) ..................................................................... 53
Adjust MMI Contrast ................................................................................................................ 53
How to Obtain Additional Help
55
Glossary
57
Acronyms...................................................................................................................................... 57
Important Definitions ................................................................................................................... 58
ii • Table of Contents
2000683-001
Technical Support
Getting Help
At Siemens we take pride in the on going support we provide our customers. This User's manual should answer your technical questions;
however, our technical support service provides a special “hot” line as an
added source of information.
If you require assistance call:
In the United States: (800) 448-8224
Internationally: 001-918-662-7030
Before You Call
Before you call one of our technical support lines, please have the
following information available to help our representative answer your
questions:
1. Unit Serial Number and Date of Installation
2. Description of Problem
3. LEDs Status on CAN I/O Modules
2000683-001
Table of Contents • iii
Safety Practices and Precautions
Product Safety
This product has been designed and tested in accordance with IEC Publication 1010-1, Safety requirements for electrical equipment for measurement, control, and laboratory use - Part 1: General requirements, and
has been supplied in a safe condition. This manual contains information
and warnings, which have to be followed by the user to ensure safe operation and to retain the product in a safe condition.
Terms in This Manual
WARNING statements identify conditions or practices that could result in
personal injury or loss of life.
CAUTION statements identify conditions or practices that could result in
damage to the equipment or other property.
Terms as Marked on
Equipment
DANGER indicates a personal injury hazard immediately accessible as
one reads the markings.
CAUTION indicates a personal injury hazard not immediately accessible
as one reads the markings, or a hazard to property, including the equipment itself.
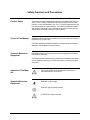
Symbols in This Manual
This symbol indicates where applicable cautionary or
other information is to be found.
Symbols Marked on
Equipment
DANGER - High voltage
Protective ground (earth) terminal
ATTENTION - Refer to Manual
2000683-001
Table of Contents • v
Safety Practices and Precautions, Continued
Hazardous or
Poisonous Gases
WARNING
If hazardous or poisonous gases are analyzed or used in the analyzer,
all national and international requirements must be fulfilled to protect personnel and the environment against any hazard that could arise, in the
event that a leak occurs. To avoid leaks, scheduled preventive maintenance and inspection for leaks should be performed by the customer.
Disregarding this warning could result in serious injury or death and
damage to equipment.
Correct Operating
Voltage
Before switching on the power, check that the operating voltage listed on
the equipment agrees with the available line voltage. Ensure that the
power supply switch is to the correct input voltage.
Danger Arising from
Loss of Ground
Any interruption of the grounding conductor inside or outside the equipment or loose connection of the grounding conductor can result in a dangerous unit. Intentional interruption of the grounding conductor is not
permitted.
Safe Equipment
If it is determined that the equipment cannot be operated safely, it should
be taken out of operation and secured against unintentional usage.
Use the Proper Fuse
To avoid fire hazard, use only a fuse of the correct type, voltage rating
and current rating as specified in the parts list for your product. Use of
repaired fuses or short-circuiting of the fuse switch is not permitted.
Safety Guidelines
DO NOT open the equipment to perform any adjustment, measurements, maintenance, parts replacement or repairs until all power supplies have been disconnected.
Only a properly trained technician should work on any equipment with
power still applied.
When opening covers or removing parts, exercise extreme care "live
parts or connections can be exposed".
vi • Safety Practices and Precautions
2000683-001
Chapter 1
Introduction
Description
This manual covers commonly required operations for Maxum GCs,
Maxum NAUs and MicroSAMs. It is intended to be an “easy reference
guide” which allows the user to quickly find assistance relating to specific
tasks.
Who is the Intended
Audience?
The user with some familiarity with using process instruments
The user with a basic idea of chromatography, methods and applications.
Maxum and/or MicroSAM Training Class attendance is recommended for each technician maintaining GC and NAU equipment.
The manual is organized around the concept of explaining how to
accomplish common tasks in the Maxum GC, NAU or MicroSAM
GC. Each section contains the information pertinent to that task.
Terms that are unfamiliar can be looked up in the Glossary (Appendix A).
The manual will provide the simplest procedure for performing one of
the tasks. In other words, if we can do something from the MMI or
the workstation, but one is much simpler or advantageous than the
other, then the more advantageous method will be shown. If there
are advantages to showing both procedures, then we will show both,
and note which one is preferable. Keep in mind that the user can always emulate the MMI from a workstation. Where the choice is arbitrary, the MMI method is illustrated.
How Should This
Manual be Used?
Conventions &
Notations
2000683-001
Where a sequence of user inputs is required in a procedure, a shorthand
notation is used.
Right arrows separate User actions, >.
Selections from lists on the display are shown in quotes “ “.
Soft keys selections are shown within square brackets [ ].
All “hard” keys will be shown these brackets { }
Introduction • 1
MMI / MMI Emulation
Description
There are three operating levels for the MMI / MMI Emulation. They have
different permission levels and passwords which limits access to only
those parts of the system needed for different personnel.
{Home}>[SELECT MENU]>”Monitor Menu”
The Monitor Level is used for routine operation of Analyzers. This includes:
1. Selection of which analyzer to view, Putting Analyzers into Run
or Hold
2. Viewing and acknowledging or clearing Alarms
3. Viewing Streams
4. Viewing Detectors and Realtime Chromatograms
5. Viewing Results and stored Chromatograms
6. Initiating an Auto Validation Sequence
7. Initiating an Auto Calibration Sequence
{Home}> [SELECT MENU]>”Maintenance Menu”
The Maintenance Level is used for routine maintenance of analyzers.
The following selections are available:
1. Selection of which Analyzer to control, Putting Analyzers into
Run or Hold
2. Viewing and acknowledging or clearing Alarms
3. Viewing and selecting Applications
4. Viewing and selecting Stream Sequences
5. Viewing Detectors and Realtime Chromatograms
6. Viewing Results and stored Chromatograms
7. Selecting Methods, performing Calibration and Validation including changing of blends and calibration factors
8. Viewing and changing I/O, Temperatures and Pressures
9. Saving program to Flash
{Home}>[SELECT MENU]>”Configure Menu”
The Configuration Level is used to make non-routine changes to an Analyzer. The following selections are available:
1. System Setup and information about software and communications
2. Viewing and acknowledging or clearing Alarms
3. Selection of Printers
4. Selection of Host Computers
5. Enabling BASIC events
6. Viewing and changing Parameters
7. Viewing and changing System I/O
8. Viewing and changing Users and Passwords
9. Saving program to Flash
2 • Introduction
2000683-001
EZChrom General Description
EZChrom is the chromatogram storage, display and integration software
that runs on a Workstation. An embedded version of EZChrom resides in
the Analyzer software and performs integration, and calculations of
chromatographic Results. EZChrom can be used on a Workstation to
create or modify Methods, re-integrate Chromatograms, Calibrate a
Method, display and print Chromatograms, log Chromatograms, view
Real time Chromatograms, and Create and modify Sequences. The cycle clock of an Analyzer can be viewed and the Analyzer can be put into
Run or Hold from the Application Control module.
To use EZChrom on a Workstation, a software “Instrument” must be created in EZChrom. A separate software Instrument must be created for
each Application in a physical Analyzer one wishes to access. The Instrument must also be “Configured”. Once created, the Instrument will
stay available until deleted.
NOTE
Each Application requires a separate “Instrument”!
To create an Instrument from EZChrom
“File”>”New”>”Instrument”
“File”>”Configure”>”Instrument”
Enter a name for the Instrument [Set Database]
[Configure]
[Set Database]
Select the desired Application [OK]
[Auto Configuration]
[OK] [OK]
Double Click on the desired Instrument to open EZChrom for that Analyzer Application.
2000683-001
Introduction • 3
System Manager
Description
System Manager gives a high level overview of the analytical system.
This interface allows the user to monitor the status of all units in the analytical system on one screen and access those units to perform configuration or maintenance functions. All Maxum, NAU, Advance Optichrom,
Process Quantra and MicroSAM units automatically populate the icon list
at the bottom of the main window as they broadcast on the network. The
icons show the current state of each analyzer. A “grayed-out” icon is one
that has not communicated with System Manager. A green icon shows
the unit is in a normal state, a yellow icon denotes a warning alarm and a
red icon a fault alarm.
System Manager allows the user to select an analyzer and view its database in tabular form to make configuration changes beyond those allowed by MMI/MMI Emulation. In addition to configuration changes, the
user can back-up/restore analyzer databases to/from files on the PC or
upgrade software. From this interface the user can also access Datalogger, EZChrom, MMI emulation or the MaxBasic Editor (if installed).
Once a device icon has been selected, the “Windows Explorer” type of
interface allows the user to select the type of table to be accessed. Application tables contain records that are unique to each application and
are accessed by highlighting an application folder, selecting “Tables” and
then selecting a table of interest in the directory tree. System tables contain records that have information common to all applications and are
selected by highlighting “System” and then selecting a table of interest in
the directory tree. All table displays are static (snapshot) with the following exceptions: active updates are maintained for the Alarm Log, Results
(results folder under each application), and the System View (analyzer
icon list).
Once a table is displayed, help information in the lower portion of the
window describes each field in the table displayed. Additional help information is available for each table from the main menu by selecting:
[Help] > “Maxum Reference” > “Maxum Database Reference” > “Tables” > then select the type table of interest.
4 • Introduction
2000683-001
Chapter 2
Installation
Minimum PC Requirements
Software
a) Windows NT 4.0 (Service Pack 4 or greater), Windows 2000 Professional, Windows XP Professional or later.
b) Internet Explorer 5.01 (Service Pack 2 or greater)
c) TCP/IP installed
d) User logged in with Administrator Privileges
Hardware
2000683-001
166 MHz Pentium processor, 64 Mbytes RAM;
Installation • 5
Workstation Software
Description
The workstation tools are available on multiple CDs. The primary CD is
Maxum System Tools. The other CDs are installed based on their need
as described below. Each of the CDs is copy protected. The “Software
Key” label used in the installation process is affixed to the outside of
each CD case. This case or a copy of the “Software Key” label should be
kept in a secure location in the event of a need to uninstall and reinstall
on another PC. For the default installation (recommended) follow the
procedure shown below for the Maxum System Tools CD. The other
CDs will not have the exact same installation selections, but the choices
will be similar.
NOTE
During the load process read the information in each pop-up window to
familiarize yourself with product information, verification of PC specifications and the software license that you are acknowledging.
Maxum System Tools CD
The base workstation software is available on the “Maxum System
Tools” CD. This software provides tools for routine maintenance on most
analyzers and includes Maxum System Manager, Maxum Utilities and
Maxum EZChrom.
MaxBasic CD
The MaxBasic Editor on this CD is required for the user to modify MaxBasic programs in the GC or NAU.
Maxum OPC Server CD
This product is required in order to interface Maxum devices to DCS systems or other devices via OPC.
Simulated Distillation CD
This software is required if the user has a Simulated Distillation application running on one or more GC’s. These additions to EZChrom allow the
user to import and/or export Simulated Distillation methods.
Procedure
1.
2.
3.
4.
5.
Results
6 • Installation
Insert the CD into the PC and make sure that the “Software Key”
from the CD case is available.
Select [Information] to learn more about the applications about to
be installed
Select [Maxum EZChrom] > [ok] > [Next] > [Next] > [Yes] > Enter
the “Software Key” > [Next] > Verify the Registration information
and select [Yes] > [Next] > [Next] > When the install is complete
press [Finish]
Select [Maxum System Manager] > [ok] > [Next] > [Next] > [yes]>
Enter the “Software Key” > [Next] > Verify the Registration information and select [Yes] > [Next] > [Next] > When the install is complete press [Finish]
Remove CD and store with case in a secure location.
The applications from the CD should now be installed on the PC.
2000683-001
Configure the Network Address for a GC
Description
Each GC or NAU has a unique Ethernet network address. This allows
exchange of data and display information with other devices on the network. The GC subnet mask must exactly match the subnet mask of the
other devices on the same segment of the network. The IP address for
the GC must be unique. If an IP address has not been assigned for the
GC, one must be obtained from the local network administrator.
MMI Procedure
1. “Configuration Menu” > “System Setup” > [IP Set Info] > “1
Lan 1 IP adr” > Enter the new IP address and accept entry.
2. “2 Lan 1 IP mask” > Enter the new IP mask.
3. Reset the GC in order for the changes to take effect.
Results
The GC will now broadcast its new IP address on power up and will be
accessible through other devices.
NOTE
The “Logical Analyzer ID” must also be unique in the network. If the GC
is placed in a network with Advance Optichrom devices a unique “ADH
loop” and “ADH unit” number must also be assigned. “Configuration
Menu” > “System Setup” > [Comm Info] > “Logical Analyzer ID” >
Enter the new Analyzer ID and accept entry. > (Enter ADH loop and unit
if needed.)
2000683-001
Installation • 7
Chapter 3
GC Operation
Alarms
Description
The Maxum system monitors many different functions and generates
alarms to warn the user of abnormal operation. These include electronic
self diagnostics, chromatographic conditions, and in some cases sample
conditions such as low flow or pressure. These alarms are broken into
two categories Fault Alarms and Warning Alarms. In general Warning
Alarms tell the user that a problem has been detected and maintenance
will be needed but analyzer data is probably usable. Fault Alarms generally indicate that current data is suspect. Alarms can be viewed, acknowledged and cleared. Acknowledging an alarm shuts off the warning
display until the next occurrence of the alarm.
NOTE
Clearing an alarm erases all information about that alarm from the system memory.
EZChrom Procedure
“Control”>”Application” This will open a small window that floats on top of
the EZChrom window. If an alarm is present the analyzer status above
the Hold/Run button (run/hold) will change from blue to red. If a fault
alarm is present an exclamation mark (!) will precede the analyzer
status. If a warning alarm is present a question mark (?) will precede the
analyzer status. Holding the cursor over the analyzer status opens an
information box which gives more information about the alarm. Right
click on the analyzer status to open a box which allows one to “Clear
current alarm” or “Clear all alarms”.
MMI Procedure
Alarms can be viewed and cleared from all three Menus. Details of the
alarm are only available from the Maintenance or Configure Menus.
“Monitor Menu”>”View and Clear Alarms” Use the up and down arrows
to select the desired alarm. Use [ACKN] to acknowledge the alarm use
[CLEAR] to clear that specific alarm or [CLEAR ALL] to clear all the
alarms.
or
“Maintenance Menu”>”Alarms” Use the up and down arrows to select the
desired alarm. Use [ACKN] to acknowledge the alarm use [CLEAR] to
clear that specific alarm or [CLEAR ALL] to clear all the alarms. Use
[DETAILS] to get more information about the alarm
2000683-001
GC Operation • 9
Alarms, Continued
System Manager Procedure
“System”>Open Connection> click on analyzer of interest [Connect]. The
alarms will be listed. Right click on an alarm to get a menu. Select “Acknowledge Alarm”, “Clear Alarm” or “Clear All Alarms”.
10 • GC Operation
2000683-001
Backup & Restore
Backup/Restore a Stream Sequence
Description
Backup/Restore of stream sequences is done through EZChrom’s Import/Export utilities. These utilities allow stream sequences to be saved
to a file (.aes) on a workstation from a unit and to be saved onto a unit
from a file on the workstation. The Import/Export can be done on a working unit or from a backup copy (.amd) of the unit.
EZChrom Procedure
Open the EZChrom instrument. “File” > “Online Sequence” > “Import”
(or “Export”)
Result
The stream sequence from the unit will be formatted and opened in EZChrom. If a permanent file copy is needed (.aes), “File” > “Online Sequence” > “Save As”. This will open a browse window and allow you
to name the file and save it in an appropriate folder for future use. A file
that is saved can later be opened in EZChrom and saved (exported) to a
unit.
Backup/Restore EZChrom Methods
Description
Backup/Restore of EZChrom methods is done through EZChrom’s Import/Export utilities. These utilities allow methods to be saved to a file on
a workstation from a unit and to be saved onto a unit from a file on the
workstation. The Import/Export can be done on a working unit or from a
backup copy (.amd) of the unit.
EZChrom Procedure
Open the EZChrom instrument. “File” > “Method” > “Import” (or “Export”)
Result
The imported method from the unit will be formatted and opened in EZChrom. If a permanent file copy is needed (.met), “File” > “Method” >
“Save As” This will open a browse window and allow you to name the
file and save it in an appropriate folder for future use. A file that is saved
can later be opened in EZChrom and saved (exported) to a unit.
2000683-001
GC Operation • 11
Backup/Restore, Continued
Backup/Restore GC Configuration
Description
A database configuration can be saved (backup) to a file on a workstation and a file on the workstation can be placed on an analyzer (restore). The workstation file can be opened on the workstation for the
purpose of viewing the configuration and making extract files.
System Manager
Procedure
“System” > “Unit Backup / Restore”
Result
During backup a file with extension .amd will be made at the selected
location. During restore, the selected file will be sent to the unit and a
reset will occur to activate the file.
CAUTION
Files restored to a unit must match in the primary version. i.e., a file for a
4.0 unit must not be restored to a 3.0 unit. If a change in version is required, the Maxum Utilities “Tools” > “Upgrade Unit” should be used.
Follow instructions on windows to backup/restore the unit.
Load/Unload a Database Text File
Description
A database text file can be made as a version independent configuration
of a unit, except for EZChrom methods and Modbus address maps. The
text file can be edited or used as is to perform version upgrades or transfer the configuration to a new unit.
NOTE
Database text file load/unload is automatically done as a part of the
Maxum Utilities Upgrade Unit. Normally it is unnecessary to run this independently.
System Manager
Procedure for Database Unload
Tools > Maxum Utilities “Loader > “Database Unload” Select a unit and a
file. [Continue]
Result
A file (.txt) will be created at the designated location. The file can be
viewed and edited in a text editor, like NotePad.
CAUTION
Editing the text file can be tricky. Slight changes in the format usually
cause a failed or incomplete load of the file onto a unit. The file should
not be renamed or moved, since it is paired with a second file (.bin) that
contains MaxBasic programs.
12 • GC Operation
2000683-001
Backup/Restore, Continued
Load/Unload a Database Text file, Continued
System Manager Procedure for Database
Load
Tools > Maxum Utilities “Loader > “Database Load”. Select a unit and a
file to be loaded. [Continue]
Result
The target unit will contain the applications and other application configuration. EZChrom methods will need to be restored using EZChrom restore and Modbus address maps will need to be restored used Modbus
Load.
Load/Unload a Modbus Map
Description
Modbus Address maps can be loaded onto a unit or unloaded into a text
file suitable for editing with Excel. Excel is the tool normally used to develop an address map for a unit. An address map can be easily
unloaded, edited, and loaded to make changes.
System Manager Procedure for Modbus
Unload
Tools > Maxum Utilities “Loader > “Modbus Unload”
Result
A file will be created at the designated location. This file can be opened
in Excel and edited. It can be reloaded to the unit or another unit.
System Manager Procedure for Modbus
Load
Tools > Maxum Utilities “Loader > “Modbus Load”. Select a unit and
a file to be loaded. This file must be the proper comma-delimited format
created in Excel.
Result
The target unit will have a Modbus address map that can be set up to
participate in serial Modbus communications.
2000683-001
GC Operation • 13
Calibration
Auto-Calibrate an Application
Description
From the Monitor menu, Auto Calibration is the only form of calibration
available. This procedure can be performed if Auto Calibration was configured for the application needing to be calibrated. The user documentation sent with the GC will show whether Auto Calibration is configured.
While navigating the menus, the analyzer may prompt the user for a
password that is required to enter the level associated with the menu or
function operation. When running Auto Calibration most users have
automated systems to start calibration gasses flowing through the analyzer. If manual connection of calibration gasses is used, the application
should be placed in Hold and the calibration gas should be connected
(opened) prior to beginning this procedure.
MMI Procedure
“Monitor Menu” > “Calibration” > [START AUTO] > If the application is
in HOLD at this point, press [Run]
Result
A message indicating that Calibration is in Progress will be printed to the
screen. When calibration is complete, a message will be printed on the
screen. At the end of the auto calibration sequence the response factor’s
percent change for each method will be tested against the Percent Calibration Margin set in the method’s peak table. If the response factor’s
percent change calculated during auto calibration are within the Percent
Calibration Margins (Calibration Pass) then all of that method’s response
factors will be updated. If auto calibration fails the Percent Calibration
Margins, then no factors are updated for that method.
NOTE
If the procedure started with the GC in Run mode, it will exit the calibration and return to the stream running when autocal was scheduled automatically at the end of the calibration sequence. If the procedure was
started in the Hold mode to allow for manual Calibration connections, the
GC will have to be placed in Run after the Process connections have
been restored.
14 • GC Operation
2000683-001
Calibration, Continued
Change Auto-Calibration Margins
Description
Auto-Calibration allows the user to recalibrate an Application automatically based upon a time (e.g. time of day and day of week), or by simply
activating the Activating the Auto-Calibration Sequence from the MMI.
The Analyzer compares the new Response Factors achieved with the
Old Response Factors and, if they are within the allowed Margin, updates the Response Factors in the Method. These Margins can be
changed if desired.
MMI Procedure
“Maintenance Menu”>“Method, Calibration and Validation”>”Adjust
Peaks, Blends and Factors”>{2}
Use the up and down arrows to select the desired component
[CHANGE MARGIN]>(new value)>[ACCEPT CHANGE]
Repeat for each component that needs to be changed.
CAUTION
Too large of a tolerance may allow the Application to recalibrate when
the Analyzer is not working properly.
Connect to a Remote GC
Description
Remote GC’s may be selected and viewed through the MMI (ManMachine Interface), System Manager, or Maxum EZChrom. The MMI can
be accessed from any GC or NAU (Network Access Unit) front panel or
launched from within System Manager as a Windows application.
MMI Procedure
“Monitor or Maintenance Menu” > “Select Analyzer” > Press [Select]
> Press [▲] or [▼] to select the desired remote GC > Press [Remote
Connect]
Result
The remote analyzer menu is displayed. The remote analyzer number,
name, application name, stream name, date, time is displayed in the upper left corner.
2000683-001
GC Operation • 15
Calibration, Continued
Connect to a Remote GC, Continued
System Manager
System Manager provides several ways to display and view remote analyzer data.
To connect to a remote GC and display a tree view of the analyzer database tables complete one of the following connection steps.
1. Double click the analyzer icon in the System View Window (located
under the ALL tab). The System View Window is typically located in
the bottom portion of the System Manager display.
2. Right click on the analyzer icon in the System View Window (located
under the ALL tab). Select "Connect" from the drop-down menu.
3. From the main menu select “System” > “Open Connection”. From
the Analyzer Selection dialog box scroll down, select the desired
analyzer and click on [Connect].
4. From the main toolbar click on the Connect icon (second from left)
From the Analyzer Selection dialog box scroll down, select the desired analyzer and click on [Connect].
Result
The remote analyzer database table structure is displayed in the Analyzer Frame Window.
To connect and view the remote analyzer using MMI complete one of the
following connection steps:
1. From System Manager’s main menu select “Tools” > “MMI”. From
the Analyzer Selection dialog box scroll down, select the desired
analyzer, and click on [Connect].
2. From System Manager’s main toolbar click on the MMI icon. From
the Analyzer Selection dialog box scroll down, select the desired
analyzer, and click on [Connect].
3. From System Manager right click on the analyzer icon in the System
View Window (located on the ALL tab). Select "MMI" from the dropdown menu.
Result
16 • GC Operation
The remote analyzer Monitor Menu is displayed. The remote analyzer
number, name, application name, stream name, date, time is displayed
in the upper left corner.
2000683-001
Calibration, Continued
Connect to a Remote GC, Continued
EZChrom
To connect and view a remote analyzer using Maxum EZChrom complete one of the following connection steps:
1. From System Manager’s main menu select “Tools” > “EZChrom”.
Double-click the remote analyzer’s icon to connect and access the
remote analyzer.
2. From System Manager’s main toolbar click on the EZChrom icon.
Double-click the remote analyzer’s icon to connect and access the
remote analyzer.
Result
The remote analyzer is connected and the EZChrom Instrument window
is displayed.
Manually Calibrate an Application
Description
Each Application in the analyzer is normally calibrated with a Calibration
Blend. For Manual Calibration the calibration blend is normally turned on
by hand. Once the flow of Calibration Blend is established, the Analyzer
is instructed to perform a Manual Calibration.
Select Stream to Calibrate
{Home}>[SELECT MENU]>”Maintenance Menu”>“Method, Calibration
and Validation”>”Calibration and Validation”
Use the up and down arrows to select the desired stream or [NEXT
SEQNCE] until the desired stream is available for selection
[START MANUAL] [RUN]
When finished [STOP CALIB]
To accept Response Factors
[RESP FACTORS]>[ACCEPT FACTORS]
To return Analyzer to Run [RUN]
NOTE
If the blend is different than the last time calibration was performed the
Blend Values must be updated. See “Update A Calibration Blend“ in the
Calibration section.
If multiple levels of calibration are required, a stream will be defined for
each level. Repeat this procedure for each level.
2000683-001
GC Operation • 17
Calibration, Continued
Update a Calibration Blend
Description
Each time a calibration bottle is changed, the calibration blend values
must be updated in the methods that use that blend. The values are
used to calculate the correct GC response factors the next time the GC
application is calibrated.
MMI Procedure
“Maintenance Menu” > “Method, Calibration & Validation” > “Adjust
Peaks, Blends & Factors” > {2}
Use the up and down arrows to select the desired component
[Change Blend]>(new value)>[Accept Change]
Repeat for each component that needs to be changed.
Result
The new blend values will be displayed in the New Blend column on the
display.
NOTE
These values will not replace the old blend values until a calibration is
performed and accepted. For multi-level calibrations, repeat the above
procedure for all levels needing to be adjusted by using [Next Level].
To change a blend again after a successful adjustment, it is necessary to
first run a process stream before activating the calibration stream again.
CAUTION
18 • GC Operation
If the values are changed in an EZChrom Method and downloaded to the
Analyzer they will be active immediately and may cause errors until Calibration is actually performed.
2000683-001
Chromatograms
Re-analyze a Chromatogram
Description
A selected chromatogram(s) from the last completed analysis cycle or
one that has been archived may be re-analyzed to evaluate a parameter
change in the method (peak detection window, integration selections,
etc.).
MMI Procedure
(This function does not exist for the MMI.)
EZChrom Procedure
With analyzer connected, and the current chromatogram displayed, from
top menu bar, click on “Analysis”. From drop down menu, select “Analyze”.
NOTE
Refer to EZChrom sections for instructions regarding modification of
method.
Result
Chromatograms on screen are re-analyzed using latest workstation
method for that stream.
Save Chromatograms
Description
The chromatogram(s) from the last completed analysis cycle may be
saved in memory on the analyzer or workstation for future reference.
MMI Procedure
“Maintenance Menu” > “Results & Chromatograms” > press [^] or [V] to
select stream > [ADD to ARCHV].
Result
Chromatograms for selected stream are saved in archive file on GC per
date, time, and stream designation.
EZChrom Procedure
With analyzer connected, and the current chromatogram displayed, from
top menu bar, click on “File”. From drop down menu, select “Data”. From
its drop down menu, select “Save as 32 bit…”. In dialog box, use normal
WINDOWS commands to select folder, enter desired file name, etc.
Result
Chromatograms for selected stream are saved in a file on workstation in
folder specified.
2000683-001
GC Operation • 19
Chromatograms, Continued
View a Real-time Chromatogram
Description
A detector signal may be selected to be viewed in real time during the
cycle to avoid waiting until the end of an analysis cycle to observe the
effect of a parameter change. The function may also be used to view the
detector baseline if the analyzer is in HOLD.
MMI Procedure
“Monitor Menu” > “View Detectors & RealTime chroms” > press [^] or [V]
until detector is selected > press [View Chrom]
Maintenance Menu” > “Detectors & RealTime chroms” > press [^] or [V]
until detector is selected > press [View Chrom]
Result
Detector signal is displayed across MMI screen.
NOTE
The vertical scale can be changed by pressing [change Max Y] and inputting a new value in the pop-up box, followed by [accept change].
Press “Back” or “Home” to exit this function.
EZChrom Procedure
With analyzer connected, from top menu bar, click on “Data”. From drop
down menu, select “Real-Time Chromatogram”. From dialog box select
detectors to monitor (may be multiple), and press [Start]. Click [OK] on
warning box.
In next dialog box, enter User Name (operate, calibrate, maintain, configure, super) and the appropriate password for the User Name entered.
Followed by [OK].
Result
Detector signal is displayed across workstation screen.
To exit this function, Click on “Data” on menu bar; from drop down menu,
select “Real-Time Chromatogram”. From dialog box select [Stop], then
[Done].
20 • GC Operation
2000683-001
Chromatograms, Continued
View Chromatograms
Description
The chromatogram(s) from the last completed analysis cycle may be
viewed on the MMI. This function can be used to indicate appropriate
presence of peaks during the cycle.
MMI Procedure
“Monitor or Maintenance Menu” > “View Results & Chromatograms” >
press [^] or [V] until desired stream is selected > press [Select Chrom].
Stream number and detector name will appear; use [Next Channel] to
select desired detector > press [Display Chrom].
Result
Detector signal for entire cycle is displayed across MMI screen.
NOTE
The horizontal and/or vertical scale can be changed by pressing [Manual
Zoom] and inputting new values in the pop-up box, followed by [accept
change].
Press “Back” or “Home” to exit this function.
EZChrom Procedure
With analyzer connected, from top menu bar, click on “File”. From drop
down menu, select “Data”. From its drop down menu, select “Import”. In
dialog box click on desired stream and [Import].
Result
Detector signal(s) are displayed across workstation screen. From top
menu bar, click on “Window”, and from drop-down menu, select different
detectors to be viewed as desired.
NOTE
To enlarge an area of the displayed chromatogram, left-click & drag to
highlight the desired area, which will be then displayed. To return to displaying full chromatogram, right-click on it, and select “Full Unzoom”.
Normal Windows commands may be used to maximize, restore, minimize, close, etc. each view as necessary. Use “Window”, and from the
drop-down menu select “Tile Horizontally” to display all detectors on the
screen.
2000683-001
GC Operation • 21
Cycle
Change Cycle Time
Description
Each method used by an application has a unique cycle time. This is the
time allotted for the analysis cycle to run. It may need to be changed if
the application changes and you desire to shorten or lengthen the cycle
time.
MMI Procedure
“Maintenance Menu” > “Method, Calibration & Validation” > Press
[Next Method] until the correct method is displayed > “Adjust Channel &
Cycle” > [Change Cycle]
Result
The cycle time on the display should show the value just entered. This
value will be used the next time the method runs.
Run a GC Application
Description
Each application can be activated to analyze samples independently
from other applications. This allows an application to be placed in “Run”
or “Hold” regardless of the state of other applications. This independence
allows one application to be modified or calibrated while another application continues to “Run” normally.
MMI Procedure
“Monitor, Maintenance or Configuration Menu” > Press [Next App] until
the desired application is displayed at the top of the MMI screen >
[RUN]
Result
The running cycle clock and progress bar will be displayed at the top
right hand corner of screen.
NOTE
If two applications are related as Master/Slave, the Master application
must be the one started. The slave application will be started automatically by the Master application.
22 • GC Operation
2000683-001
Detectors
Bridge Current of TCD (MicroSAM Only)
Description
The detector bridge current can be adjusted to meet the requirements of
a particular application.
MMI Procedure
“Maintenance Menu” > “Detectors & RealTime Chroms” > press [^] or [V]
until detector is selected > press [Details]> press [^] or [V] until bridge
current is selected> press [Modify]> enter the value> press [Done]
**See Caution below.
Result
Bridge current is immediately set to the new value.
CAUTION
Setting the bridge current too high for a given flow rate will damage or
destroy the filament.
NOTE
There is no bridge current adjustment for Maxum. The Maxum circuit
automatically adjusts for maximum sensitivity for a given carrier and flow
rate, and protects the filament from burnout.
Ignite the FID (MAXUM Only)
Description
Manual FID ignition sequence
MMI Procedure
“Maintenance Menu” > “Detectors & RealTime Chroms” > press [^] or [V]
until detector is selected > press [Ignite]
Result
The ignition sequence will start for the selected detector.
NOTE
If ignite fails, check DPM connections and fuel and air flows against supplied documentation and retry.
Automatic FID Ignition is available and is the preferred process.
NOTE
2000683-001
Flame Status indication is not valid for the Maxum II FID. Flame Status
can only be verified by checking for condensation at the detector vents
or by special software and or database configuration.
GC Operation • 23
Detectors, Continued
Ignite the FPD (MAXUM Only)
Description
Manual ignition sequence. To ignite the FPD, it is necessary to increase
the air to fuel ratio. This is done by increasing the air pressure using the
EPC for the FPD air supply. Review supplied documentation for the correct ignition and normal-operation settings for the EPC. The ignite setting
is typically about 3 times the air pressure used during normal operation,
but usually no more than 60 psi. In the example below, 24 psi is used as
the setting for normal operation, and 60 psi is used for the ignite setting.
MMI Procedure
“Maintenance Menu” > “App I/O, Temperature, & Pressure”> “Pressure
Controller”> highlight “FPD_Air”> [Change Set Pt]> {6}> {0}> [Accept
Change]> [Home]> “Detectors & RealTime Chroms” > press [^] or [V]
until detector is selected > [Ignite]
After ignition: “Maintenance Menu” > “App I/O, Temperature, & Pressure”> “Pressure Controller”> highlight “FPD_Air”> [Change Set Pt]> [2]>
[4]> [Accept Change]> [Home]
Result
Ignite sequence executes.
NOTE
If ignite fails, check DPM connections and fuel and air flows against supplied documentation and retry.
Automatic FPD ignition is available and is the preferred process.
NOTE
24 • GC Operation
Flame Status indication is not valid for the Maxum II FPD. Flame Status
can only be verified by checking for condensation at the detector vents
or by special software and or database configuration.
2000683-001
Detectors, Continued
Polarity of Detector Signals
Description
Some applications result in inverted peaks due to the properties of the
sample with respect to the carrier gas being used. This can be corrected.
MMI Procedure
“Maintenance Menu” > “Detectors & RealTime Chroms” > press [^] or [V]
until detector is selected > press [Details]> press [^] or [V] until “Invert” is
selected> press [Modify]
Result
The selected detector signal will be immediately inverted. Negative
peaks will become positive. The status will change to show that invert is
“On”. Pressing Modify again will turn invert “Off”.
NOTE
Some applications will contain software that changes the state of the DO
that controls inversion. In this case, the software will override the manual
settings when a cycle is run.
Status and Settings of Detector
Description
Detector status and current settings may be viewed on the “Detectors &
RealTime Chromatograms” screen. Additional information is available in
the Maintenance Menu by pressing [Details].
MMI Procedure
“Maintenance Menu” > “Detectors & RealTime Chroms” > press [^] or [V]
until detector is selected > press [Details] “Monitor Menu” > “Detectors &
RealTime Chroms”
Result
Detector status and settings are visible.
2000683-001
GC Operation • 25
I/O, Discrete
View/Modify I/O
Description
Each individual Input/Output channel can be viewed and/or modified.
The I/O may consist of individual or a combination of Analog Inputs, Analog Outputs, Digital Inputs and Digital Outputs. It may be necessary to
check what the actual input or output device is reading and/or change it
to verify if an internal or external device is operating normally. The I/O
screens are used for troubleshooting, to verify that data is being sent or
received, and to manually control a particular I/O.
MMI Procedure
[Select Menu], “Maintenance Menu”, “App I/O, Temperature & Pressure”.
Scroll down [V] and push [SELECT] or press the number on the keypad,
for the type of I/O you want to view and/or modify. [Disable] or [Enable]
will change the status of the selected I/O. [Details] will display the details
of the selected I/O. When displayed, [Modify] will allow modification of
the selected detail. When modification is complete, [DONE].
Result
The modified detail will be displayed in the details screen.
26 • GC Operation
2000683-001
Integration
Modify Data Acquisition Time
Description
The analyzer only acquires (stores) detector signals when instructed to
do so. Many methods do not require Data Acquisition during the entire
Analyzer Cycle. The Data Acquisition time can be different for different
detectors. It must be continuous and there can be only one acquisition
time for each detector per cycle. The detector signal must be stored for it
to be processed (e.g. integrated or displayed later). The times can be
modified if chromatographic conditions change such as adding longer
columns.
MMI Procedure
“Maintenance Menu”>”Method, Calibration and Methods”>”Adjust Channel and Cycle”. Use the up and down arrows to select the desired detector. [Change Cycle]> Use [Next Field] and [Accept Change] to make the
desired changes.
EZChrom Procedure
Click on the “Instrument Setup” icon on the first Tool Bar (Monitor below
“Control” on the Menu Bar. Click on the “Detector “tab. The “Start” and
“Stop” times can be modified in the table for each detector.
NOTE
No changes take place in the analyzer until the method is exported to the
Analyzer.
Modify Peak Detection and Integration
Description
2000683-001
There are a number of Integration Events that can be adjusted in EZChrom that will affect peak detection and integration. Only three of these
are used routinely. This section will only address these three Integration
Events. The method of changing the other Integration Events is analogous the procedures listed here. Peak Width and Peak Threshold are
required Integration Events and affect the sensitivity of peak detection.
The Peak Width is normally set to match the width of the narrowest peak
of interest in the chromatogram. The Peak Threshold is then set to
achieve peak detection without integrating noise (non peaks). The third
Integration Events commonly used is Integration Off. Integration Off can
be used to prevent integration of chromatographic artifacts such as valve
switching upsets. In some cases these upsets can interfere with proper
baseline assignment if Integration Off is not used.
GC Operation • 27
Integration, Continued
Modify Peak Detection and Integration, Continued
MMI Procedure
“Maintenance Menu”>”Method, Calibration and Validation”>”Adjust Integration Events”
Use [NEXT CHANNEL] to select the desired Detector.
Use the up and down arrows to select the Integration Event to be adjusted then [MODIFY]
Use [NEXT FIELD] to select the time or value to be modified
Use [ACCEPT CHANGE] to accept the changes.
NOTE
Only Integration Events that were created within EZChrom on the Workstation can be modified here.
EZChrom Procedure
To modify or create Integration Events it is helpful to have a chromatogram loaded into EZChrom. Select the Detector chromatogram from
“Window”>”Detector desired” (e.g. L_FID). Also, select the detector from
the Detector Selection drop down box in the upper left portion of the
screen on the top Tool Bar.
NOTE
The detector selected from the drop down must match the chromatogram or errors will likely occur. The changes made to the Integration
Events apply to the detector selected not to the chromatogram. EZChrom does not automatically match them up for you.
Select the Integration Events table by clicking on the Integration Events
icon (green icon directly below “Reports). Editing existing events can be
done by clicking in the table at the desired point. “Start Time”, “Stop
Time” and “Value” can be edited. A new event can be created by using
the drop box on the last (empty) line under “Event”. Existing events can
be disabled by clicking on red check mark after the event #.
NOTE
28 • GC Operation
No changes take place in the analyzer until the method is exported to the
Analyzer.
2000683-001
LED’s
Description
There are 4 LED’s on the MMI. These LED’s give a quick visual indication of the alarm status of the analyzer.
Purge LED
A red LED that indicates a failure of the electronics purge system.
CAUTION
This condition may affect the safety of the analyzer.
Fault LED
A red LED that indicates a Fault Alarm(s) exists for this analyzer.
Warning LED
A yellow LED that indicates a Warning Alarm(s) exists for this analyzer.
Power LED
A green LED that indicates the analyzer electronics has electrical power.
2000683-001
GC Operation • 29
MaxBasic
Change a MaxBasic Program Schedule (Frequency or Time of Day)
Description
MaxBasic programs can be scheduled by frequency or time of day. This
type of scheduling is independent of an analysis cycle.
MMI Procedure
“Configure Menu” > “BASIC Events” > [VIEW SCHED]
Result
A list of the current scheduling information appears. Adding and modifying the program schedule must be done using System Manager.
System Manager
Procedure
“System Tables” > “Program Schedule”
Result
A list of all program schedules for all the MaxBasic programs on the
viewed unit.
To Add a schedule: “Edit” >
“Add Record”
Select a program to schedule and give it a unique schedule number. It is
possible to enter multiple schedules for a program.
To Change a schedule
Time of Day scheduling
Enter time in attribute Schedule_time (examples: 10:00, 13.00, 9)
Enter day of week mask in Schedule_day: This is an integer constant (1127 or 201-231) that specifies the days of the week, or day of the month,
that the program will be scheduled. For days of the week, the precise
number is determined by adding the numbers for all desired days together.
Saturday = 1, Friday = 2, Thursday = 4, Wednesday = 8, Tuesday = 16,
Monday = 32, Sunday = 64
Example:
127= 1111111 – every day
21=0010101 – T Th Sa
42=0101010 – M W F
Or
Enter day of month + 200 in Schedule_day (examples: 201, 216,
220)
Frequency Scheduling:
Enter units in Freq_Unit(1=hour, 2=minute, 3=day, 4=sec)
Enter amount in Freq_amt
NOTE
A program cannot be scheduled more frequently than 5 seconds. A disabled program will not run (see enable attribute in Program table).
30 • GC Operation
2000683-001
MaxBasic, Continued
Change a MaxBasic Program Schedule (from an event)
Description
MaxBasic programs can be scheduled by an internal or external event.
These can be run from a cycle_event within a method, an external Advance DataHiway command or Maxum command, a limit/alarmhandler,
another program, or at the end of a cycle.
Cycle Event
After the program is saved into the program table from MaxBasic, reconfigure the EZChrom instrument. Select the program as an event to run at
a particular cycle time by attaching the program to a cycle event in EZChrom and enabling it. Export the method to the analyzer.
EZChrom Procedure
Open the EZChrom instrument and edit the method by importing the
method from the analyzer: . “File” > “Method” > “Import”.
View events: “Method” > “Instrument Setup” > “Events”.
Insert or modify an event to run a program at a certain cycle time.
Export to analyzer: “File” > “Method” > “Export”.
System Manager
Procedure
Mvrpgm (end of cycle) - “Tables” > “Stream Method”
NOTES
Enter the program id into the mvrpgm attribute of the stream and method
that will run the program.
The Program must be designated to release the end of cycle processing
after the program runs by placing a “99” in the pgmfunction attribute of
the Program table (“System Tables” > “Program”)
A disabled program will not run.
2000683-001
GC Operation • 31
MaxBasic, Continued
Run a MaxBasic Program Manually
Description
MaxBasic programs can be run on demand from the MMI.
MMI Procedure
“Configure Menu” > “BASIC Events” > [RUN]
Result
The MaxBasic program will run on the analyzer. The status of the program will be Run and, when the program is complete, Ok or Error. If the
program finishes with Error status, there will be an alarm.
NOTE
A program that is disabled can still be run manually.
View/Change Program Parameters
Description
MaxBasic programs use parameters in order to get variable information.
This information may be constant information or settings or it may be
information that comes from other database tables. The value of a parameter is passed to the program at its run time through program arguments or may be directly accessed from within the program.
MMI Procedure (View
Parameters)
“Configure Menu” > “BASIC Events” > “Details” > [View Args]
Result
A list of the parameters that are passed at run time to the selected program.
NOTE
A program might use other parameters by accessing them with SQL
statements.
32 • GC Operation
2000683-001
MaxBasic, Continued
View/Change Program Parameters, Continued
System Manager
Procedure (Change
Parameters)
“System Tables” > “Parameter” > [Continue]
Result
A list of the parameters for all applications and all programs are listed.
NOTE
Parameters may be shared by programs. Also, a parameter that appears
in the list more than once may be specific to an application or stream.
To add a new parameter: “Edit” > “Add Record”
To modify a parameter:
Enter “Appcontext” > use –1 for all applications
Enter “Streamcontext” > use –1 for all streams
Caution: a specific stream must be entered if using “Qtypes” 3,4,5,6,7
Enter “Parameter_Name” > used for easy reference when editing the
table
Enter “value” > used as a constant, if “Qtype” is null or 0.
Or
Enter “Qid” > id in queried table – used to make execution time queries
to a table designated in “Qtype”
And enter “Qtype”>
table for query
null = use parameter “value” as a constant
0=none
1= AI
2= DI
3= buffered result
4= saved result
5= external result
6= stream current error
7= stream current warning
8= application current error
9= application current warning
10=flowing stream
11=application mode
12=active sequence id
13= next sequence id
14= DO
2000683-001
GC Operation • 33
Passwords
Description
The selection of Users and the associated passwords can be used to
provide different levels of authorization for various analyzer operation or
maintenance activities. When a maintenance person accesses the GC
with the correct user/password combination, they can modify any menu
items or parameters assigned to that user level.
There are five predefined user levels. The items that can be modified at
these user levels are defined in the system manager. The available user
levels are:
Operate (Monitor)
Calibrate
Maintain
Configure
Super
IMPORTANT
Remember to Log Out when your work is finished (from any menu, [Select Menu] > “Logout”). Unauthorized people can cause problems if your
password is still active.
MMI Procedure
“Configure Menu” > “Users/Passwords”. Use [Next User] to scroll though
the user choices until “super” is selected. Enter the correct password for
that level (default is 555). “Configure Menu (reappears) > “User/
Passwords”. A table will appear with the users and all passwords listed.
Use [^] or [V] to select the desired user. Press [Modify]. Enter the new
password (numeric, 1 to 6 digits), press [Done].
NOTE
The passwords can only be modified with a “super” level authorization.
Result
Table should now show the new password for that user.
34 • GC Operation
2000683-001
Pressure Controller
Change a Pressure Controller Set Point
Description
Changing the set point on pressure controllers can be used for troubleshooting, fine tune a method, verify that a method is working correctly
and to manually set up a method.
MMI Procedure
From home menu, [Select Menu], “Maintenance Menu”, “App I/O, Temperature & Pressure”. Scroll down [V] to “Pressure Controller” or press
the number [6] on the keypad, press [SELECT]. A list of Pressure Controllers will be displayed. Scroll down [V] to the Pressure Controller to be
modified and press [CHANGE SET PT]. Enter new set point and press
[ACCEPT CHANGE].
Result
The new Pressure Controller set point will be displayed in the Cur Setpt
column.
Enable/Disable a Pressure Controller
Description
Enabling and disabling pressure controllers can be used for troubleshooting, to verify that a method is working correctly and to manually set
up a method.
MMI Procedure
From home menu, [Select Menu], “Maintenance Menu”, “App I/O, Temperature & Pressure”. Scroll down [V] to “Pressure Controller” or press
the number [6] on the keypad, press [SELECT]. A list of Pressure Controllers will be displayed. Scroll down [V] to the Pressure Controller to be
enabled or disabled and press [ENABLE] or [DISABLE].
Result
If enabling the Pressure Controller an asterisk will be removed from in
front of the Pressure Controller name. If disabling the Pressure Controller an asterisk will be placed in front of the Pressure Controller name
indicating that it is disabled.
2000683-001
GC Operation • 35
Results
Save Results
Description
The analytical results from a completed analysis cycle may be saved in
memory on the analyzer or workstation for future reference.
MMI Procedure
From home menu, select “Maintenance Menu” > “Results & Chromatograms” > press [^] or [V] to select stream > [ADD to ARCHV].
Result
The component concentrations for the last completed analysis cycle on
the selected stream are saved in archive file on GC per date, time, and
stream designation.
System Manager
(DataLogger)
Procedure
In System Manager, from top menu bar, select “Tools”. From drop-down
menu, select “Maxum Utilities”. From Maxum Utilities top menu bar, select “Data Logger”. From drop-down menu, select “New Log Setup”.
From “IP Address Selection” dialog box, select desired analyzer and
[OK]. From “Log Setup” box, select stream(s) to be logged by clicking in
“Enable” column; and then [OK].
To select which results are to be logged, on Maxum Utilities top menu
bar, select “Data Logger”. From drop-down menu, select “Modify Log
Setup”. In the “DataLogger Modify Settings” dialog box, select the application/stream desired, and then select the “Results”, “Others” desired,
and click on [Select Peaks]. In “Peak Setup” dialog box, select the peaks
to be logged, and click [OK]. [Close] the “DataLogger Modify Settings”
dialog box.
On Maxum Utilities Screen, right click on the desired stream, select and
left click on the “Start Logging” choice. (The choice will be “Stop Logging” for a stream which is already logging.)
NOTE
Default file names are “analyzer name”-1-“stream #”.txt. Once datalogging has been stopped, the saved file name can be changed using normal WINDOWS commands.
Result
The selected results for each analysis on the selected stream(s) will be
saved in a file on the workstation in subdirectory: Maxum System Manager\Results\). This will continue until the logging is stopped.
36 • GC Operation
2000683-001
Results, Continued
Save Results, Continued
EZChrom Procedure
(Chrom Logging)
With analyzer connected, from top menu bar, click on “Data”. From drop
down menu, select “Log Stream”. In “Stream Chromatogram Logging”
dialog box, use cursor to select the ID (stream) to be logged, and click
[Apply]. (Normal WINDOWS commands may be used to modify the file
name and folder path, etc.)
NOTE
The logging format is normally set to numeric.
Result
Chromatograms and associated results for each analysis cycle for the
selected stream are saved in the selected file on workstation in folder
specified until this menu sequence is repeated and [Stop all] is applied.
Transmit Results
Configure a DCS
Connection for (Modbus, OPC, HCI-A, HCIC01, HCI-C04)
Maxum analyzers support multiple communication protocols for transferring process analytical data to a Distributed Control System. Maxum edition II and MicroSam support Maxum Modbus (NAU) or OPC communication protocols. In addition, Maxum edition II also supports the Optichrom Host Computer Interface protocols HCI-H (Modbus), HCI-A, HCIC01, and HCI-C04.
Advance Optichrom analyzers support all of the Optichrom Host Computer Interface protocols, Maxum Modbus, and OPC. Optichrom analyzers require an Optichrom Data Server (NAU w/Gateway) when using
Maxum Modbus or OPC.
Maxum Modbus, HCIH, HCI-A, HCI-C01,
HCI-C04 Procedure
Setup a GC to transmit
results to a Host Computer Interface.
2000683-001
1.) Add a Host Computer Interface record to the GC’s host table.
Using System Manager, connect to the remote GC.
Display the host table: [system tables]-> [host].
Add an entry to the host table: From the Main Menu select [edit] ->
[add record].
From the Add Record dialog box enter the host_id. Typically
host_id’s start at ‘1’ and continue sequentially. [1]->[OK].
GC Operation • 37
Results, Continued
Transmit Results, Continued
2.) Follow this step when transmitting results to an Advance Optichrom Host Computer Interface board (HCI-H, HCI-A, HCI-C01,
HCI-C04)
IMPORTANT: MicroSam does not support Optichrom Host
Computer Interface communication. Use the Maxum Modbus
(NAU) protocol.
Configure the host record added in step #1 for operation with
an Advance Optichrom Host Computer Interface.
a) Set the Host Computer Interface Loop and Unit number in
the host record. Every node or device on the Optichrom Advance Data Hiway must be assigned a unique Loop (1-8) and
Unit (1-31) number. Using System Manager, edit the host entry
added in step #1 above.
Display the host table: [system tables]-> [host]. Select the loop
column and enter the Host Computer Interface Loop number {18}. Then, select the unit column and enter the Host Computer Interface Unit number {1-31}.
b) Set the Host Computer Interface protocol type in the host
record. The type attribute defines the communications protocol
the GC will use when sending results to the Optichrom Host
Computer Interface. Set the type field equal to the type of Optichrom Host Computer Interface board used. (1=HCI-C01,
2=HCI-C04, 3=HCI-H, 4=HCI-A).
Using System Manager, edit the type attribute in the host table.
Display the host table: [system tables]-> [host]. Select the type
attribute from the host record. Enter the chosen protocol number
in the type field.
c) Set the scale_factor attribute in the host record.
This step is required only if using the HCI-H or HCI-C04 boards.
Scale_Factor is an attribute or column in the host table, host record used for component scaling. Both the HCI-H and HCI-C04
protocols transmit component values as a fraction of range.
Each component or result in the result table has an associated
attribute called EUHI (Engineering Units, High). EUHI defines
each component’s full scale value.
38 • GC Operation
2000683-001
Results, Continued
Transmit Results, Continued
Scale_Factor defines the numeric value (counts) that full scale
will be represented by. (scale_factor * Result value) / EUHI =
scaled result
Example :
If the component concentration is 35 mole % and the EUHI is set
to 50 mole % and the desired scale is 0 to 9,999. Then the value
transmitted to the Host Computer Interface is: 9999 * 35 / 50 =
6999
To set the scale_factor using System Manager, display the host
table: [system tables]-> [host]. Select the scale_factor attribute in
the host record and enter the value to be used as the scaling
factor for all components. Typical values for scale_factor are
999, 4095, 9999.
d) Assign an Advance Data Hiway address (Loop & Unit number) to the GC.
Every device communicating on the ADH must have a unique
network address assigned. ADH addressing consists of a Loop
(subnetwork) (1-8) and Unit (device address) (1-31) number.
Using System Manager, edit the loop and unit attributes located
in the system_control table. Display the system_control table:
[system tables]-> [system_control]. Select the loop column
and enter a valid Loop number {1-8}. Then select the unit column
and enter a valid Unit number {1-31}.
3.) Follow this step when transmitting results to a Maxum NAU configured as a Host Computer Interface. (Maxum Modbus)
a.) Enter the NAU’s anlzref in the host record. Anlzref is an attribute or column in the host table, host record and should contain a logical reference to the Host Computer Interface (NAU). A
logical reference or LID is a system unique, user assigned, numerical value used to reference a particular device. Anlzref must
be assigned the NAU’s LID. First determine the NAU’s LID.
Then, using System Manager, display the host table: [system tables]-> [host]. Click on the host record’s anlzref column created
in step #1 to display a drop-down list box. Click on [▼] to display
a list of the available devices (LID). Scroll down and select the
NAU’s LID. If the NAU’s LID does not show up in the list, wait ten
minutes. System Manager will automatically update the list when
a device broadcast is received. Each analyzer or NAU broadcasts its’ LID every ten minutes.
2000683-001
GC Operation • 39
Results, Continued
Transmit Results, Continued
b.) Set the Host Computer Interface protocol type in the host
record. Using System Manager, edit the type attribute in the
host table.
Display the host table: [system tables]-> [host]. Select the type
attribute from the host record. Enter the protocol number in the
type field. For NAU Maxum Modbus set type = 6.
(6 =Maxum Modbus, 7=Maxum Modbus freeform).
4. Set host_def to enable transmission of results.
Using System Manager, edit the host_def attribute in the host table.
Display the host table: [system tables]-> [host]. Set the host_def
attribute equal ‘1’ to enable the transmission of results to the Host
Computer Interface. Results can be sent to multiple Host Computer
Interface boards (or NAUs) by setting host_def equal to ‘1’ in each
host table record.
5. Set autotrt attribute in the stream_method table.
Setting the autotrt attribute in the stream_method table enables the
automatic transmission of results at the end of each cycle.
Using System Manager, display the stream_method table. [application]-> [tables]->[stream_method]. Set the autotrt attribute equal to
‘1’.
Set autotrt on each application/stream of interest.
6. Set trtval attribute in the result table.
The trtval attribute, located in the result table, defines the order results are sent to the Host Computer Interface. Set the trtval attribute
for each stream/result to be sent to the Host Computer Interface.
Trtval values can be assigned in any order provided the sequence
starts with a ‘1’. Duplicates are not allowed. Repeat this step for
each application/stream. Using System Manager, display the result
table. [application]-> [tables]->[result]. Assign each application/stream/
result a sequential integer value based on the desire transmission
order. Save and close the result table.
Result
40 • GC Operation
Communication between the analyzer network and the DCS system
should now work with no alarms generated on the transmitting GC’s.
2000683-001
Results, Continued
Transmit Results, Continued
Setup NAU for
Maxum Modbus
1.) Configure the NAU communication port for DCS communications.
Using System Manager, display the system_control table.
[system tables]-> [system_control]. Enter a value in the modbus_setting attribute based on the following parameters.
Y = serial port address (1 for the RS-232, 2 for RS-485)
a = baud rate (50, 75, 110, 134, 150, 200, 300, 600, 1200, 1800,
2400, 4800, 9600, 19200, 38400)
b = parity (e, o or n)
c = data bits (8 only)
d = stop bits
Y:a,b,c,d(example--1:19200,n,8,1)
For Maxum:
For MicroSAM: Y is COM1(example--COM1:19200,n,8,1)
2.) Load the Modbus address map.
Using System Manager’s Load MODBUS utility, (located under
Tools/Maxum Utilities/Loader/Load MODBUS) to add the address
map to the GC or NAU.
3.) This step is only needed when using Advance Optichrom Analyzers with Maxum Modbus (NAU).
a.) Assign a Loop and Unit number to the NAU.
The NAU must have a loop and unit number defined to communicate with Advance Optichrom devices. ADH addressing consists of a Loop (subnetwork) (1-8) and Unit (device address) (131) number.
Using System Manager, edit the loop and unit attributes located
in the system_control table. Display the system_control table:
[system tables]-> [system_control]. Select the loop column
and enter a valid Loop number {1-8}. Then select the unit column
and enter a valid Unit number {1-31}.
b.) Modify the Advance Optichrom analyzer(s) Host Event (typically Event32) to transmit results to the newly assigned
NAU loop and unit number. Edit and/or create the Host Event
in the Advance Optichrom analyzer(s) to send results to the NIU
address (Loop & Unit). Typically Evt32 is used to transmit results
at the end of cycle with Advance Optichrom.
Result
2000683-001
Communication between the analyzer network and the DCS system
should now work with no alarms generated on the transmitting GC’s.
GC Operation • 41
Results, Continued
Transmit Results, Continued
Setup a GC to transmit results to an OPC
Server
1.) Configure the remote GC or NAU database. Using System Manager, connect to the analyzer and display the system_control table.
Set the opcflag attribute to a ‘1’ in the system_control table.
2.) Set the autotrt attribute in the stream_method table. Using System Manager, display the stream_method table and set the autotrt
attribute to a ‘1’ for each stream. Repeat this step for each application and stream. Save and close the stream_method table.
3.) Set the transmit sequence order. Using System Manager, display
the result table and set the trtval attribute to the desired transmit sequence number. Transmit sequence numbers must be sequential,
starting with 1. Duplicates are not allowed. Results (components)
that do not have the trtval set will not show up in the OPC Server
configuration screens. Repeat this step for each application. Save
and close the result table.
4.) This step is required for Advance Optichrom analyzers only.
a.) Advance Optichrom analyzers use a Maxum GC or NAU to collect and convert analysis results into Maxum database format.
Using System Manager, display the system_control table and set
the adh_trt attribute equal to the host computer format supported
in the Optichrom analyzer(s): 0=HCI-H, 1 = HCI-C01, 2 = HCIC04, 3 = HCI-A.
b.) Assign a unique Loop and Unit number to the GC or NAU. Using
System Manager, display the system_control and set the loop
and unit attributes to an unused value. Legal values for loop are
in the range 1 – 8. Legal values for unit numbers are in the range
1-31. Duplicate unit numbers are not allowed.
c.) Modify the Optichrom analyzers Transmit Event (typically Event
32) to send to the Loop and Unit number assign above.
5.) Run at least one analysis cycle on each stream. The OPC table
located in the analyzer database must be initialized before configuring the OPC Server. Run at least one cycle on every stream that will
report results to OPC Server, including any calibration streams. OPC
table entries are automatically created and updated at the end of the
analysis cycle.
6.) Configure Maxum OPC Server.
42 • GC Operation
2000683-001
Results, Continued
Transmit Results, Continued
NOTE
The attributes in these tables must be setup correctly prior to adding the
analyzer(s) to Maxum OPC Server. If the tables are not setup correctly
the OPC Server will not recognize the analyzer during setup and/or
some attributes will not be available for OPC Server. Maxum OPC
Server is compatible with firmware version 4.0 and greater.
Results
Communications between the analyzer network and the DCS system
should now work with no alarms generated on the transmitting GC’s.
Important Note
Maxum OPC Server is compatible with any OPC Data Access 2.0 client.
Some DCS vendors provide the OPC Server interface only. A third party
client-to-client interface may be required to store and forward data between the OPC servers. Contact the DCS vendor to obtain a recommended list of OPC client-to-client programs and other useful OPC related utilities.
Modify a Maxum
Modbus Address Map
Description
The Maxum Modbus Address Map is a text file used by the Network Access Unit (NAU) to map analyzer results to Modbus addresses (registers
and coils) for Host computer access. An Address Map is typically created
with Microsoft Excel then downloaded to the NAU using “System Manager”>[TOOLS]>[Maxum Utilities]> [Loader]->[Modbus Load]. Once
the Address Map has been loaded onto the NAU, it may be viewed and
values may be edited with System Manager. However, records should
be added with the procedure below.
System Manager
Once the Address Map has been loaded onto the NAU, it may be
viewed and edited with “System Manager” >[System Tables]>
[MODBUS_addmap]. The recommended procedure for adding records or making other significant changes to the Modbus Map is to
export the map to a text file, modify the text file, then re-load the
file.
1.) UnLoad (save) the Address map file using Maxum Utilities:
Using System Manager, select [TOOLS]>[Maxum Utilities]>
[Loader]->[Modbus UnLoad]. When the Modbus Address map
unload dialog box is displayed enter the desired saved file
name in the File name list box.
2.) Using Microsoft Excel or any standard text editor modify the saved
Address map file.
2000683-001
GC Operation • 43
Results, Continued
Transmit Results, Continued
3.) Load (download) the edited Address map file back to the NAU.
Using System Manager, select [TOOLS]>[Maxum Utilities]>
[Loader]->[Modbus Load].
Result
A modified Modbus Address map is loaded onto the NAU. The results can be viewed using “System Manager” >[System Tables]>
[MODBUS_addmap].
View Component Results for an Application
Description
Results in the form of component concentrations can be viewed on a per
stream basis for each application.
MMI Procedure
If not already at the monitor menu, press <HOME> to get to the main
screen, then press [SELECT MENU] and select 1. “Monitor Menu”.
Check the upper left hand corner of the screen to ensure you are viewing
the correct application.
Press [NEXT APP] until the appropriate application is displayed on the
screen.
Select menu item 5. “View Results & Chromatograms”. Use the [^] and
[V] soft keys to select the stream of interest and press [VIEW RESULTS].
System Manager
Procedure
44 • GC Operation
Double-Click the Icon of the unit that you wish to view results. The window that opens up for the Analyzer will show a tree in the left pane that
shows all the applications in the analyzer. Double-Click the application
icon of interest and select the Results icon from the list that opens up
underneath the icon. All results of all streams from that application will
be displayed.
2000683-001
Results, Continued
View Component Results for an Application, Continued
EZChrom Procedure
2000683-001
Double-Click icon associated with the instrument and application of interest. From the File Menu select Data ⇒ Import. From the dialog box
select the stream of interest. The system will load all the results and
chromatograms for the stream. The trace display shows the results of
the analysis. If the desired result does not appear, right-click the mouse
on the desired trace and select the Annotations… option. Select from the
“Available Annotations” list the result items that you wish to view. Press
the right arrow button to add these annotations to the list. Press the [OK]
button and the results will be present on the trace.
GC Operation • 45
Software Upgrade
Upgrade Maxum Software from 4.1 Workstation
Description
Each device has multiple pieces of software that must be upgraded
when software is upgraded. The Operating System (OS) for the Syscon
board shares the processor resources between communications and the
following software modules: Database, Display Manager. The SNECON
board also has an OS and an application that must be matched to the
Database. The upgrade tool available in 4.1 automatically selects the
software components that should be upgraded for the select version and
manages the process.
Step
1.
2.
3.
4.
Results
46 • GC Operation
Procedure
Place the applications in hold for the device to be upgraded.
If the device is a GC, open EZChrom on the Workstation
and import all methods for the analyzer to be upgraded.
(See “Import a Method” in the Methods section)
From Advance Utilities select –> [Tools] > “Upgrade
Unit…” > Select unit to upgrade from the list box > Select
the Upgrade Directory if the latest version is not desired >
[OK]
If the device is a GC, open EZChrom on the Workstation
and export all methods for the analyzer to be upgraded.
(See “Export a Method” in the Methods section)
The software components in the selected device should now match the
revisions listed in the file Versions.txt found in the directory that you used
in step 2.
2000683-001
Software Upgrade, Continued
Upgrade MicroSAM Software from 4.1 Workstation
Description
Procedure
Each device has multiple pieces of software that must be upgraded
when software is upgraded. The Operating System (OS) for the CAC
board shares the processor resources between communications and the
Database. The RSP board also has software that must be matched to
the CAC board software. The upgrade tool available in 4.1 is used to
upgrade the MicroSAM database. For other MicroSAM software components refer to the MicroSAM documentation.
Step
1.
2.
3.
4.
Results
2000683-001
Procedure
Place the applications in hold for the device to be upgraded.
Open EZChrom on the Workstation and import all methods
for the analyzer to be upgraded. (See “Import a Method” in
the Methods section)
From Advance Utilities select –> [Tools] > “MicroSAM” >
“Software Upgrade” > Select unit to upgrade from the list
box > Select the Upgrade Directory if the latest version is
not desired > [OK]
Open EZChrom on the Workstation and export all methods
for the analyzer to be upgraded. (See “Export a Method” in
the Methods section)
The software components in the selected device should now match the
revisions listed in the file Versions.txt found in the directory that you used
in step 2.
GC Operation • 47
Streams
Enable/Disable a Stream
Description
When an analyzer has more than one stream, it can be useful to disable
one or more of them. If a stream is disabled, sampling and analysis will
be skipped for that stream. The analyzer proceeds to the next active (enabled) stream and performs a measurement on that stream.
MMI Procedure
“Maintenance Menu” > “Stream Sequences” > press [^] or [V] until
stream is selected > press [Disable]
Result
The disabled stream will be skipped; no sampling or analysis will be performed. Also, the [Disable] button becomes an [Enable] button which is
used to enable the stream and resume analysis.
NOTE
Disabling the current stream (the one being analyzed) will cause the
stream to be marked for disabling at the end of the current cycle.
Force a Stream
Description
When an analyzer has multiple streams, it can be forced to analyze a
particular stream on the next cycle.
Refer to the section that describes disabling and enabling streams for
more information that can be helpful in circumstances where it might be
desirable to Force a Stream.
MMI Procedure
“Maintenance Menu” > “Stream Sequences” > press [^] or [V] until desired stream is selected > press [Set Active]> [More]> [More]> [Stream
Step]
Result
The selected stream becomes the next to be analyzed, and sample from
that stream begins flowing through the sample valve.
NOTE
The [Stream Step] portion of the command is necessary to switch the
sample to the new stream so that the new sample can flush the previous
sample from the sample valve and sample loop. If this is not done with
sufficient time to completely flush the previous sample before the next
sample injection occurs, then the analysis will likely have inaccurate results.
To return to normal operation hit [Resume Sequence]
48 • GC Operation
2000683-001
Temperature Controller
Change a Temperature Controller Set Point
Description
Changing the set point on temperature controllers can be used for troubleshooting, fine tune a method, verify that a method is working correctly
and to manually set up a method.
MMI Procedure
[Select Menu], “Maintenance Menu”, “App I/O, Temperature & Pressure”.
Scroll down [V] to “Temperature Controller” or press the number [5] on
the keypad, press [SELECT]. A list of Temperature Controllers will be
displayed. Scroll down [V] to the Temperature Controller to be modified
and press [CHANGE SET PT]. Enter new set point and press [ACCEPT
CHANGE].
Result
The new Temperature Controller set point will be displayed in the Cur
Setpt column.
Enable/Disable a Temperature Controller
Description
Enabling and disabling temperature controllers can be used for troubleshooting, to verify that a method is working correctly and to manually set
up a method.
MMI Procedure
[Select Menu], “Maintenance Menu”, “App I/O, Temperature & Pressure”.
Scroll down [V] to “Temperature Controller” or press the number [5] on
the keypad, press [SELECT]. A list of Temperature Controllers will be
displayed. Scroll down [V] to the Temperature Controller to be enabled
or disabled and press [ENABLE] or [DISABLE].
Result
If enabling the Temperature Controller an asterisk will be removed from
in front of the Temperature Controller name. If disabling the Temperature
Controller an asterisk will be placed in front of the Temperature Controller name indicating that it is disabled.
2000683-001
GC Operation • 49
Time & Date
Set GC Time/Date
Description
The GC uses the current time and day to tag analyzer data and trigger
time of day MaxBasic programs. The user can set the time/date, time
zone and daylight savings transitions.
MMI Procedure
From the MMI Main screen; [SELECT MENU]>”Configure Menu” > ”System Setup” > [TIME INFO]. Use the numeric keypad to select the settings to be changed. After entering any change, press [ACCEPT
CHANGE] to implement, [CANCEL CHANGE] to go back to the screen
without saving changes.
1. Local Date: Enter the date in the form MM.DD.YYYY, where MM
is the month code (01-12), DD is the Day code (01-31) and
YYYY is the year code.
2. Local Time: Enter the time in the form HH.MM.SS, where HH is
the hour in 24-hour format, MM is the minutes and SS is the seconds.
3. TimeZone: Enter in the number of minutes west of UTC (Universal Coordinated Time). I.E. U.S. Central time is 6 hours west of
UTC and uses a value of 360.
4. day light on: Set the date/time at which daylight savings time is
enabled of the form MM.WW.DD.mmm, where MM is the month
of the change (1-12), WW is the Week of the Month (1 - 5), DD is
the Day of the Week (0 – 6) and mmm is the minutes after Midnight that the change occurs. A setting of 0.0.0.0 disables the
daylight savings feature.
5. day light off: Sets the date/time at which daylight savings is
turned off. It uses the same settings as day light on:
Results
Local Time and Data updates the system local time. After setting TimeZone, and daylight savings settings there will be a two-tone beep emitted
by the unit indicating a save of the parameters to flash.
CAUTION
If the unit is reset before the completion of the two-tone beep sequence,
analyzer parameters can be lost and hamper instrument operation.
CAUTION
When editing the data field that changes the parameters, use the [BACK]
soft key to backspace over characters. Use of the fixed key <BACK> will
revert the screen back to the Maintenance Main menu without changing
any values.
50 • GC Operation
2000683-001
Time & Date, Continued
Set GC Time Server
Description
Time for the Analyzer can be synchronized with a common server. This
can be another Maxum unit, or a workstation running the Maxum TFTP
server program.
MMI Procedure
From the MMI Main screen; [SELECT MENU]>”Configure Menu” > ”System Setup” > [IP SET INFO]. Use the numeric keypad to select setting 7.
Time Server IP adr. Enter the IP Address of the workstation or analyzer
with which the system needs to be synchronized. After entering any
change, press [ACCEPT CHANGE] to implement or [CANCEL CHANGE]
to go back to the screen without saving changes.
Results
After setting there will be a two-tone beep emitted by the unit indicating a
save of the parameters to flash. The system will then synchronize with
the Server at that point and on a roughly 24 hour periodic basis.
CAUTION
If the unit is reset before the completion of the two-tone beep sequence,
analyzer parameters can be lost and hamper instrument operation.
NOTE
When editing the data field that changes the parameters, use the [BACK]
soft key to backspace over characters. Use of the fixed key <BACK> will
revert the screen back to the Maintenance Main menu without changing
any values.
2000683-001
GC Operation • 51
Validation
Change Auto-Validation Values & Margins
Description
A Validation Blend (or Sample) is a sample that has previously analyzed
and is used to verify the operation of an Analyzer. It can be a synthetic
blend or a process sample that is kept for validation. If the validation
sample is changed the Blend Values must be updated in the Analyzer.
The allowed Margin between the Analyzer Result and the Blend Value
determines if a Validation Passes or Fails. This Margin can be changed
in the same location as the Blend Values. Each component has its own
Blend Value and Margin.
MMI Procedure
“Maintenance Menu” > “Method, Calibration & Validation” ”
“Calibration & Validation”
Select the Validation Sequence by pressing [NEXT SEQNCE]
[VIEW RESULTS]
[VIEW CONFIG]
Select the component desired using the up and down arrows
[MODIFY]
Enter the new blend value and then [ACCEPT CHANGE]
Or [NEXT FIELD] to modify the Margin
Repeat for each component
Validate an Application
Description
A Validation Blend (or Sample) is a sample that has previously analyzed
and is used to verify the operation of an Analyzer. It can be a synthetic
blend or a process sample that is kept for validation. The results of the
validation run will be compared with the Blend Values stored in the Analyzer. The allowed Margin between the Analyzer Result and the Blend
Value determines if a Validation Passes or Fails.
MMI Procedure
“Monitor Menu” > “Validation” >[START VAL]
The Analyzer will run the Validation Sequence and determine whether it
passes or fails.
NOTE
52 • GC Operation
Validation will only show up if there is a validation sequence defined in
the application.
2000683-001
Chapter 4
Adjustments
MMI Display Contrast Adjustment (Maxum only)
Adjust MMI Contrast
Description
Due to changes in the operating environment or aging, it is possible that
the MMI display contrast may require adjustment. If the display appears
washed out, has turned dark, or has dark streaking, adjusting the contrast should remedy the problem. To make the adjustment, a small
screwdriver or potentiometer adjustment tool is required. It is recommended that the adjustment tool be non-conductive.
MMI Contrast
Adjustment
Procedure
While the analyzer is operating, open the analyzer door and locate a
small round hole in the cover on the back of the MMI. Looking into the
hole, you should be able to see the potentiometer and the adjustment
screw. Using the adjustment tool, rotate the potentiometer adjustment
screw until the display appearance improves. One direction will make the
display characters darker. The other direction will make them lighter.
CAUTION
Though there is no danger of electrocution, it is possible to damage the
printed circuit board if the screwdriver should slip out of the slot on the
potentiometer. Therefore, it recommended that a non-conductive tool be
used for making the adjustment, preferably a potentiometer adjustment
tool which is made expressly for this purpose.
2000683-001
Adjustments • 53
Chapter 5
How to Obtain Additional Help
On-line help is available for each of the Workstation tools. The access point is through standard
“Windows” help conventions via a “help” selection in the toolbar at the top of the screen. In addition to
information concerning the workstation tools, this help often provides valuable details concerning GC
functionality.
Another source of information is the Maxum Manual Library CD (Part # 2000597-001) and the printed
version of the Manual Set (Part # 2000597-002). This additional information is available in English.
For more detailed information on use of the MMI, the Training Manual has a significant amount of detail,
with pictures. Refer to the chapter titled “MMI Ver 4 Menu Overview”. For convenience, this training
manual chapter has been included as part of the CD with this compact manual.
If you need further assistance contact one of the following offices:
To Contact Us:
Siemens AG
A&D PI 2 MIS Process Analytics
Oestliche Rheinbrueckenstr. 50
76187 Karlsruhe
Germany
Siemens Energy & Automation, Inc.
7101 Hollister Road
Houston, TX 77040
USA
Siemens Pte. Limited
A&D PI 2 Regional Headquarters
The Siemens Center
60 MacPherson Road
Singapore 348615
Tel:
Fax:
E-mail:
Tel:
Fax:
E-mail:
Tel:
Fax:
E-mail:
+49 721 595 4234
+49 721 595 6375
[email protected]
+1 713 939 7400
+1 713 939 9050
[email protected]
www.siemens.com/processanalytics
www.usa.siemens.com/ia
Training
Tel:
+49 721 595 4035
E-mail: [email protected]
Training
Tel:
+1 800 448 8224 (USA)
Tel.
+1 918 662 7030 (International)
E-mail: [email protected]
Spares
Tel:
+49 721 595 4288
E-mail: [email protected]
Support
Tel:
E-mail:
+49 721 595 7216
[email protected]
2000683-001
www.siemens.com/processanalytics
Spares
Tel:
+1 800 448 8224 (USA)
Tel:
+1 918 662 7030 (International)
Fax:
+1 918 662 7482
E-mail: [email protected]
Support
Tel:
Tel:
E-mail:
+65 6490 8702
+65 6490 8703
[email protected]
+1 800 448 8224 (USA)
+1 918 662 7030 (International)
[email protected]
Siemens Industrial Automation
Shanghai
Siemens Process Analytics Ltd., Shanghai
PI and Analytics Technical Service Center
12 workshops, 175 XiMaoJing Road
Export Processing Zone, SongJiang
Shanghai, 201611
Peoples Republic of China
Tel:
Fax:
E-mail:
+86-21-5774 9977
+86-21-6774 7181
[email protected]
www.ad.siemens.com.cn
How to Obtain Additional Help • 55
Appendix A
Glossary
Acronyms
10 Base T
The ethernet standard specified in IEEE 802.3, which uses unshielded
twisted pair cable transmitting at 10Mbps
10 Base2
The ethernet standard that uses thin coaxial cable
ABH
Air Bath Heater
ADH
Advance Data Hiway
BOOTP
Bootstrap Protocol
CAN
Controller Area Network
CF
Compact Flash
DPM
Detector Personality Module
EC
Electronic Enclosure
ECD
Electron Capture Detector
EPCM or EPC
Electronic Pressure Control Module
FID
Flame Ionization Detector
FPD
Flame Photometric Detector
I2C
Inter-Integrated Circuit
MMI
Man Machine Interface
NAU
Network Access Unit
PECM
Power Entry Control Module
PWM
Pulse Width Modulation
SLIV
Siemens Liquid Injection Valve
SNE
Sensor Near Electronics
SNECON
Sensor Near Electronics Controller
SVCM
Solenoid Valve Control Module
SYSCON
System Controller
TCD
Thermo Conductivity Detector
TCP/IP
Transmission Control Protocol/Internet Protocol
TFTP
Trivial File Transfer Protocol
WDB
Wiring Distribution Board
2000683-001
Glossary • 57
Important Definitions
Actual Retention Time
The time it takes for a peak to travel through the columns, from sample
inject until it reaches the detector.
ADH Default Application
When connecting a Maxum to an Advance Data Hiway communication
system, remote access is limited to only one application because the
advance data hiway does not understand multiple applications. If a
Maxum has more than one application in the database a default application must be selected. The default application is what is displayed when
a remote connection is made over the Advance Data Hiway.
ADH Loop
One of eight networking segments used with the Optichrom analyzer
with a limited number of units on each used for networking communications.
ADH Unit
Unique Optichrom analyzer identification number (0 thru 31) within one
of up to eight loops used for networking communications.
Applications
Applications share the GC hardware. Parts of the system table are assigned to each application through the configuration of application tables.
An application can be thought of as a virtual GC. Each application is typically independent from other applications. An application can have sample flows, one or more sample sequence lists, inputs/outputs, EZChrom
methods, basic programs, chromatograms, temperature controllers,
pressure regulators, and results that are independent of other applications. Each GC can have several applications that are configured to work
independently or in concert with one other on the same GC. An application has a cycle clock that is unique from the other applications. This allows applications to be placed in run or hold without affecting other independent applications.
Chromatograms
Cold Start
Refers to restarting the analyzer with the saved database.
Cycle Time
Stop time of an application’s cycle run clock.
Database
All parameters of a chromatograph are saved in a database. This contains configuration data and applications of the System Manager, EZChrom methods, sample sequences, archive and alarm log. This database can be viewed in static or dynamic mode.
Static corresponds to a snapshot of the database, i.e. tables are imported from the database into the PC, edited, and subsequently exported
to the chromatograph again. The display is not automatically updated.
The data must be imported again in order to view modifications.
Dynamic values are updated as soon as they change. Most of the MMI
displays are dynamic. With the System Manager, only the result and
alarm displays are dynamic. EZChrom displays are always static, except
for the Control Window and Real Time Chromatogram Displays, which
are dynamic. In the System Manager, copies of the database can be
saved on the hard disk or saved databases can be loaded into the GC
(file extension .AMD).
58 • Glossary
2000683-001
Important Definitions, Continued
Database Version
The current version level of the database.
Datanet
Datanet is one of the choices available for connecting multiple devices
on a network together. Datanet is a redundant, proprietary network
communication protocol used in the Maxum analyzer.
DM Version
The current version level of the display manager.
Expected Retention Time
The time a peak of interest is expected to take to reach the detector from
inject under normal operation.
Flash
Flash memory (sometimes called “flash RAM”) is a type of constantlypowered nonvolatile memory that can be erased and reprogrammed in
units of memory called blocks. It is a variation of electrically erasable
programmable read-only memory (EEPROM) which, unlike flash memory, is erased and rewritten at the byte level, which is slower than flash
memory updating. Flash memory is often used to hold control code such
as the basic input/output system (BIOS) in a personal computer. When
BIOS needs to be changed (rewritten), the flash memory can be written
to in block (rather than byte) sizes, making it easy to update. On the
other hand, flash memory is not useful as random access memory
(RAM) because RAM needs to be addressable at the byte (not the block)
level.
GC
Gas Chromatograph refers to the Maxum or MicroSAM product.
Import/Export
When working within EZChrom, methods, data, and sequences are not
automatically updated and must be imported to view and modify the database. Once changes have been made in EZChrom to a method it must
be exported to the analyzer’s database for the changes to take effect.
Injection Lag
Start time of an application’s cycle run clock, can be a negative number.
LAN 1 IP Address
In the most widely installed level of the Internet Protocol (IP) today, an IP
address is a 32-bit number that identifies each sender or receiver of information that is sent in packets across a network. Each analyzer must
have a unique static IP address when connecting multiple devices together on a network. This is the address for the 10 Base T connection
located on front of the SYSCON and used for network communications.
LAN 2 IP Address
In the most widely installed level of the Internet Protocol (IP) today, an IP
address is a 32-bit number that identifies each sender or receiver of information that is sent in packets across a network. This is the address for
the 10 2 wire that is connected from the SYSCON to the SNEs for internal network communications.
LAN 1 IP Mask
Part of the local address can identify a subnet work or subnet address,
which makes it easier for a network that is divided into several physical
subnet works (for examples, several different local area networks or) to
handle many devices.
2000683-001
Glossary • 59
Important Definitions, Continued
LAN 2 IP Mask
Part of the local address can identify a subnet work or subnet address,
which makes it easier for a network that is divided into several physical
subnet works (for examples, several different local area networks or) to
handle many devices.
Level
Type in the exact amount of each compound (corrected for purity) in your
first calibration standard in the column labeled “Level1”.
Load Information
Boot
Options
Some options are available that prevent some actions from happening:
•
•
•
•
•
0 = normal
1 = no warm start
2 = no database save
16 = no ADH
32 = no BOOTP
TFTP Host IP
The network address of the database where the
TFTP software is running, with the TFTP software
running the analyzer can initiate an upload from the
database to the analyzer.
Start Mode
Location of file to load at start up:
•
•
•
1 = Flash Module
2 = Always TFTP
3 = One time TFTP
DB last save
The last time the database was saved.
DB save interval
Interval that the analyzer will initiate a save to flash
command.
Logical Analyzer ID
Unique Maxum analyzer identification number used with networking
communications.
Metastable
A state of stability that is barely stable. Metastable states may be easily
stimulated to become unstable.
Methods
A method contains information required to analyze a sample stream:
configuration data for detectors, valves etc., peak detection parameters,
evaluation parameters, and time programs. Methods are generated using EZChrom and exported to the chromatograph's database.
60 • Glossary
2000683-001
Important Definitions, Continued
MMI
Man-Machine-Interface refers to the user interface present on the front of
most Maxum GC’s. It is made up of a one quarter VGA screen with an
associated keypad. The local MMI on a Maxum can be used to access
any other Maxum, MicroSAM or Optichrom GC attached to the analytical
network.
MMI Emulation
Man-Machine-Interface Emulation refers to one of the applications on the
Maxum Workstation. This application graphically emulates the physical
MMI located on the front of a Maxum GC. The MMI Emulation Application can be used to access any other Maxum, MicroSAM or Optichrom
GC attached to the analytical network.
MODBUS
Communication protocol developed by Modicon; widely used in process
control applications. The Maxum Modbus Address map allows a host
system to read and write some Boolean, integer, and floating point values. Most of the values read are data from the analyzers. Some of the
values read are generated by the Maxum Modbus interface.
OS Version
The current version level of the operating system.
Peak Width
One of two required integration events for each detector run within a
method Peak Width is set using the width of the narrowest peak and use
to calculate the sampling rate for the chromatogram used by the EZChrom software.
Printer
A printer can be set up for logging results and alarms using network
communications or serial ports located on the SYSCON. The Maxum
used LPD/LPR Short for line printer daemon/line printer remote, a
printer protocol that uses TCP/IP to establish connections between printers and workstations on a network. The technology was developed originally for BSD UNIX and has since become the de facto cross-platform
printing protocol.
The LPD software typically is stored in the printer or print server and the
LPR software must be installed in the client device. The LPR client
sends the print request to the IP address of the LPD printer/server, which
in turn queues the file and prints it when the printer becomes available.
Remote DM Version
The current version level of the remote display manager.
Response Factor
A numeric value calculated from a measured peak area to equal that of
the known concentration for that peak.
Retention Time
The calibrated peak’s expected retention time.
2000683-001
Glossary • 61
Important Definitions, Continued
Retention Window
Retention time window for calibrated components, used for identification
of calibrated peaks.
Router IP Address
A router is a device or, in some cases, software in a computer, that determines the next network point to which a packet should be forwarded
toward its destination. The router is connected to at least two networks
and decides which way to send each information packet based on its
current understanding of the state of the networks it is connected to. A
router is located at any gateway (where one network meet another), including each Internet point-of-presence. A router is often included as part
of a network switch.
The router IP address must be set in the analyzer in order to forward
information through the router.
Scripts
In computer programming, a script is a program or sequence of instructions that is interpreted or carried out by another program rather than by
the computer processor (as a compiled program is).
Soft Key
These are keys that are displayed at the bottom of the MMI screen. They
are called soft keys, because their meaning changes depending on what
screen you are currently displaying.
Stream Sequences
These are lists of sample streams and assigned methods, which are
used to control the order of analysis for multi-stream GC’s. Each application has at least one normal sequence and one calibration sequence.
Although an application can have several sequences, only one is active
at a time.
SYSLOG IP Address
Address of the location for logging debug information when using CompactFlash. Logging debug information increases system resource usage
and system performance will be lower.
You modify the SysLogIP attribute (A.B.C.D) and change A to 255 to enable CF logging, Set C nonZero to get output to the file debug1.log, set D
to nonzero to continue to get debug info out the serial port.
After the debug1.log files reaches 1 Mib in size, it changes its name to
debug2.log then continues to gather data in debug1.log.
Text Version
The current version level of the text file (screen messages).
Threshold
One of two required integration events for each detector run within a
method. Threshold is set using a section of flat baseline to calculate the
triggering voltage used during integration to identify and set gate times
by the EZChrom software.
62 • Glossary
2000683-001
Important Definitions, Continued
Time Service IP Address
The IP address of the server being used on the network for synchronizing time on network devices.
Warm Start
Refers to restarting the analyzer with the open database.
2000683-001
Glossary • 63
Siemens Energy & Automation, Inc.
7101 Hollister Road, Houston, TX 77040
Phone 1+ 713 939-7400, Fax 1+ 713 939-9050
1/2007 Edition 2000683-002
Siemens Energy & Automation, Inc.
7101 Hollister Road, Houston, TX 77040
United States
Phone +1 (713) 939-7400
Fax +1 (713) 939-9050
www.usa.siemens.com/ia