1
Development of a wind turbine emulator
control system
Brian Davison (02014147)
Supervisor: Tom Grassie
MSc Energy and Environmental Engineering
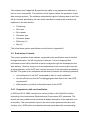
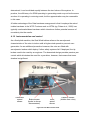
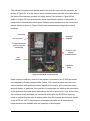
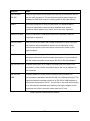
Gaia Wind premises in Glasgow (with pylon in the background)
1
Abstract
Wind turbine design and development is currently a very dynamic industry, and
designers need appropriate tools and resources to experiment with innovations and
to evaluate the effect of modifications. However, access to installed turbines in situ
for testing and monitoring is typically difficult. Hardware-in-the-loop simulation offers
a solution to this problem. A wind turbine emulator uses a real or scaled-down drive
train but typically replaces the prime mover with an electric drive.
Based on a review of previous work on wind turbine emulators, this project proposes
a control system designed to reproduce a variable wind profile taking into account
torque oscillations due to wind shear and tower shadow.
Initial software development is undertaken to provide a basic human machine
interface to emulator hardware. The software does not attempt to implement the
turbine model at this stage.
Results from evaluation and software testing identify limitations of the current
configuration. A series of follow-on projects is outlined.
2
Acknowledgements
I am indebted to Derek Robertson, the Gaia Wind electrical engineer, who was
instrumental in agreeing the project at the beginning, and who was patient and
supportive throughout the development period. I am also grateful to Jonnie Andringa,
Gaia Wind CEO, for allowing me to spend time with the company.
I would also like to thank my supervisor, Tom Grassie, and the Module Leader, Alan
Edgar, for their flexible approach to administrative processes during my extended
negotiations with possible partner companies.
Last but not least, I would like to thank my partner, Bridget Webster, for picking up
the domestic slack while I was otherwise occupied.
3
Symbols and abbreviations
Symbols
A
Swept area of turbine rotor (m2)
V
Actual velocity of air stream (m/s)
CP
Power coefficient
V0
Wind velocity at reference height h0 (m/s)
CQ
Torque coefficient
Vh
Wind velocity a height h (m/s)
D
Aerodynamic drag force
W
Width of tower shadow
d
Direct component of stator current (A)
x, y, z
Linear distances (m)
f
Distribution network frequency (Hz)
Z
Aerofoil zero lift line
Jgenerator
Moment of inertia of generator rotor (kg m2)
z0
Ground roughness length
Jrotor
Moment of inertia of turbine rotor (kg m2)
α
Angle of attack (rad)
L
Aerodynamic lift force
β
Blade pitch angle (rad)
n
Gear ratio (n:1)
Δ
Maximum airstream velocity deficit
N
Number of poles in EM
η
Efficiency
ns
Synchronous speed
ηd
Drive efficiency
P
Power (W)
ηdgb
Drive gearbox efficiency
Q
Torque (Nm)
ηg
Generator efficiency
q
Quadrature component of stator current (A)
ηggb
Generator gearbox efficiency
Qcorr
Corrected torque
ηu
Efficiency factor for unknown losses
Qdrive
Torque associated with EM drive (Nm)
λ
tip-speed ratio
Qerr
Torque error
ρ
Density of air (1.225kg/m3 at sea level)
Qgenerator
Torque associated with generator (Nm)
Φ
Wind direction relative to rotor plane (rad)
Qmech
Mechanical torque
φ
Azimuthal turbine blade angle (rad)
Qref
Reference torque
Ω
Angular velocity of turbine rotor (rad/s)
Qrotor
Torque associated with turbine rotor (Nm)
ω
Angular velocity of drive train component (rad/s)
R
Radius of turbine rotor (blade length) (m)
ωgenerator
Angular velocity of generator rotor (rad/s)
S
Slip
ωr
Angular velocity of EM rotor (rad/s)
T
Tower diameter (m)
ωs
Angular velocity of stator magnetic field (rad/s)
U
Uninterrupted wind speed (m/s)
4
Abbreviations
Units
AC
Alternating current
A
Ampere (current)
CPU
Central processing unit
kWh
kilowatt-hour (energy)
CRC
Cyclic redundancy check
m
metre (distance)
DC
Direct current
N
Newton (force)
DFIG
Doubly fed induction generator
rpm
Rotations per minute
EM
Electromechanical machine
s
second (time)
EMI
Electromagnetic interference
V
Volt (potential difference)
FITS
Feed-in tariff scheme
W
Watt (power)
FOC
Field-oriented control
HAWT
Horizontal axis wind turbine
HIL
Hardware-in-the-loop
HMI
Human machine interface
HSS
High speed shaft
HUT
Hardware under test
IEC
International Electrotechnical Commission
IGBT
Insulated gate bipolar transistor
LSS
Low speed shaft
NMEA
National Marine Electronics Association
NREL
National Renewable Energy Laboratory
PC
Personal computer (Windows)
PHIL
Power hardware-in-the-loop
PI
Proportional-integral
PID
Proportional-integral-derivative
PLC
Programmable logic controller
PMSM
Permanent magnet synchronous machine
PWM
Pulse width modulation
SCIM
Squirrel cage induction machine
STP
Shielded twisted pair
USB
Universal Serial Bus
V/f
Voltage/frequency
VFD
Variable frequency drive
VVW
Voltage Vector Weg
WLP
Weg ladder programming
WTE
Wind turbine emulator
5
Contents
1
2
Introduction ....................................................................................................... 10
1.1
General ....................................................................................................... 10
1.2
Aims and objectives .................................................................................... 10
1.3
Structure of report ....................................................................................... 11
Literature review................................................................................................ 12
2.1
Wind energy context ................................................................................... 12
2.2
Turbine design issues ................................................................................. 14
2.2.1
Conceptual design ................................................................................ 14
2.2.2
Blade design ......................................................................................... 17
2.2.3
Materials ............................................................................................... 19
2.2.4
Mechanical construction ....................................................................... 21
2.2.5
Torque oscillations ................................................................................ 24
2.2.6
Electrical systems ................................................................................. 27
2.2.7
Control .................................................................................................. 31
2.3
2.3.1
Drive selection ...................................................................................... 37
2.3.2
Turbine model....................................................................................... 39
2.3.3
Instrumentation and control .................................................................. 40
2.3.4
Input data.............................................................................................. 42
2.4
3
Turbine emulation ....................................................................................... 34
Conclusion .................................................................................................. 43
Methodology ..................................................................................................... 44
3.1
Introduction ................................................................................................. 44
3.2
Project selection .......................................................................................... 44
3.3
Literature review.......................................................................................... 45
3.4
Project scope .............................................................................................. 46
3.4.1
Evaluate hardware setup ...................................................................... 46
3.4.2
Establish communication with VFD ...................................................... 47
3.4.3
Establish communications with turbine controller ................................. 47
3.4.4
Construct HMI....................................................................................... 47
3.4.5
Evaluate results .................................................................................... 47
3.5
Timescale .................................................................................................... 48
3.6
Investigation of hardware configuration ....................................................... 48
6
4
3.7
Software development ................................................................................ 49
3.8
System design............................................................................................. 49
3.9
Evaluation of results .................................................................................... 51
3.9.1
Comparison with real installation .......................................................... 51
3.9.2
WTE efficiency...................................................................................... 52
3.9.3
Duration test ......................................................................................... 53
Results .............................................................................................................. 54
4.1
4.1.1
Overview............................................................................................... 54
4.1.2
Instrumentation and control .................................................................. 57
4.1.3
SCIM..................................................................................................... 59
4.1.4
Inverter ................................................................................................. 60
4.1.5
VFD control........................................................................................... 62
4.1.6
Summary .............................................................................................. 63
4.2
Software application .................................................................................... 64
4.2.1
Overview............................................................................................... 64
4.2.2
HMI and general system features ......................................................... 64
4.2.3
Resolved issues ................................................................................... 67
4.2.4
Communications ................................................................................... 68
4.2.5
Residual issues .................................................................................... 71
4.2.6
Evaluation ............................................................................................. 71
4.3
5
Hardware configuration ............................................................................... 54
Test results.................................................................................................. 72
Forward plan ..................................................................................................... 75
5.1
Limitations of current implementation .......................................................... 75
5.2
Alternative implementations ........................................................................ 76
5.2.1
Excel ..................................................................................................... 76
5.2.2
Weg Ladder Programming.................................................................... 76
5.2.3
Real-time operating systems ................................................................ 76
5.2.4
MATLAB ............................................................................................... 77
5.2.5
Increased instrumentation .................................................................... 77
5.3
Inclusion of turbine model ........................................................................... 77
5.3.1
Vector control ....................................................................................... 77
5.3.2
Steady torque control ........................................................................... 78
5.3.3
Variable torque control.......................................................................... 78
7
5.3.4
5.4
6
Advanced control investigation ............................................................. 78
Laboratory-based simulation ....................................................................... 78
5.4.1
Weg inverter simulation ........................................................................ 79
5.4.2
Other simulations .................................................................................. 79
Conclusions ...................................................................................................... 80
6.1
Comparison with aims and objectives ......................................................... 80
6.1.1
Review of current relevant literature ..................................................... 80
6.1.2
Hardware investigation ......................................................................... 81
6.1.3
Software development .......................................................................... 81
6.1.4
Evaluation of the project outcomes ....................................................... 81
6.1.5
Definition of programme of future work ................................................. 82
6.2
Personal reflection ...................................................................................... 82
Appendix A: Email to potential partners ................................................................... 84
Appendix B: Initial company brief ............................................................................. 85
Appendix C: Project proposals ................................................................................. 87
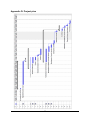
Appendix D: Project plan .......................................................................................... 90
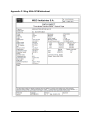
Appendix E: Weg 50Hz SCIM datasheet.................................................................. 91
Appendix F: Weg 60Hz SCIM datasheet .................................................................. 92
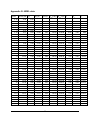
Appendix G: NREL data ........................................................................................... 93
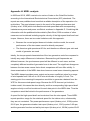
Appendix H: NREL analysis ..................................................................................... 94
Appendix I: M-NET protocol ..................................................................................... 99
Appendix J: Weg CFW-11 block diagram............................................................... 101
Appendix K: System specification .......................................................................... 102
1
Introduction ..................................................................................................... 102
1.1
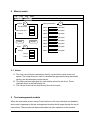
Overview ................................................................................................... 102
1.2
Manual and automatic operation ............................................................... 103
2
Class diagram ................................................................................................. 104
3
Interface design .............................................................................................. 105
3.1
Menu items................................................................................................ 105
8
4
5
Automatic mode .............................................................................................. 106
4.1
Notes ......................................................................................................... 106
4.2
Validation .................................................................................................. 107
4.3
Changing speed ........................................................................................ 108
4.4
XML file format .......................................................................................... 109
Manual mode .................................................................................................. 111
5.1
Notes ......................................................................................................... 111
6
Test management module .............................................................................. 111
7
Inverter communications ................................................................................. 112
7.1
Setup ......................................................................................................... 112
7.2
Initialisation ............................................................................................... 114
7.3
Start action ................................................................................................ 114
7.4
Acceleration .............................................................................................. 114
7.5
Deceleration .............................................................................................. 115
7.6
Stop action ................................................................................................ 115
7.7
Status polling............................................................................................. 116
7.8
Communications protocol .......................................................................... 116
8
Turbine controller communications ................................................................. 116
9
Additional features .......................................................................................... 117
9.1
Graphical output ........................................................................................ 117
9.2
Excel export .............................................................................................. 117
Appendix L: Communications regarding data collection ......................................... 118
9
1 Introduction
1.1 General
Wind turbine design and development is currently a very dynamic industry. With the
increasing costs associated with traditional fuels, the extraction of energy from a
renewable resource like the wind is extremely attractive. To maximise the value of
such extraction, the efficiency of turbine designs from the aerodynamics of the
blades to the software that controls their operation is paramount. Designers need
appropriate tools and resources to experiment with innovations and to evaluate the
effect of modifications. Because wind resource is typically most abundant in remote
and inaccessible places, monitoring and testing in situ is difficult. Simulation offers a
solution to this problem, but although software simulation is becoming quite
sophisticated, building an adequate software model can be very time-consuming and
expensive. An alternative is to use the hardware in the loop (HIL) approach in which
real or scaled-down turbine hardware is used with a simulated wind resource. Such a
system can be referred to as a wind turbine emulator (WTE). This project focuses on
the requirements for an effective WTE through an exploration of the relevant
background literature and a practical development exercise.
1.2 Aims and objectives
The aim of this project is to establish a basic control system for a WTE. In order to
do this, the following objectives will be addressed:
A review of current relevant literature
An investigation of the capabilities of a specific hardware configuration
The specification and development of a software application to provide a
human machine interface (HMI) and communications with the hardware
components
An examination of the limitations of the developed application
The definition of a series of future projects that build upon the current work
10
1.3 Structure of report
Chapter 2 of this report summarises the main relevant aspects of wind turbine design
and operation and ends with a review of previous WTE studies. Chapter 3 discusses
the methods used during the project and summarises some of the organisational
processes. Chapter 4 presents the results of the project work, while chapter 5
outlines a series of potential follow-on projects based on this work. Chapter 6
summarises the conclusions from the project and includes a personal reflection on
the project experience. Appendix material follows, and the list of references is
positioned at the end for easy access.
11
2 Literature review
This section explores a range of aspects of wind turbine design that need to be taken
into account when constructing a WTE. The section ends with a review of previous
work on WTEs.
2.1 Wind energy context
Although wind energy has been used for centuries to do useful work such as driving
ships and grinding grain into flour, it is only since the oil crisis in the 1970s that it has
been considered as a serious candidate for electricity generation (Gross, 2007).
Today, energy security continues to be a major driver for the development of wind
energy devices, along with the abatement of airborne pollution from fossil fuel power
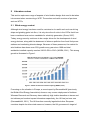
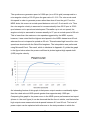
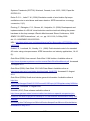
stations and combating climate change. Because of these pressures, the market for
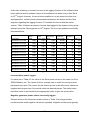
wind turbines has shown over 20% growth every year since 1998 and total
worldwide installed capacity reached 196.63 GW in 2010 (WWEA, 2011). This strong
growth is illustrated in Figure 1.
Figure 1: World wind turbine installed capacity (WWEA, 2011)
Focussing on the situation in Europe, a recent report by RenewableUK (previously
the British Wind Energy Association) shows a very uneven deployment of turbines.
Whereas Denmark and Germany have relatively high turbine densities at eleven and
six turbines per hundred square kilometres respectively, the UK has just over one
(RenewableUK, 2011). The UK therefore currently lags behind other European
countries despite its richer wind resource; however, the UK government‘s target of
12
producing 15% of its electricity from renewable sources by 2020 (DECC, 2010)
would require among other things that onshore turbine density increases to around
2.44 turbines per hundred square kilometres (RenewableUK, 2011). The market for
wind energy in the UK is therefore promising in the short term with its underexploited
capacity and positive economic pressures.
There are wide differences in the deployment of turbines among the constituent
nations of the UK. Scotland already sources 15% of its electricity from wind and
accounts for 61% of UK installed capacity while making up only 32% of its
geographical area (RenewableUK, 2011).
Country-level statistics are typically based on the deployment of multi-megawatt
turbines in windfarms, and much effort goes into the design of turbines with larger
and larger capacity in order to better exploit the resource at a particular site. One of
the largest turbines currently deployed, for example, is the 7.5 MW Enercon E126,
while several larger units are currently under development and will be delivered in
the next few years. The Azimut consortium led by Spanish company Gamesa aims
to deliver a 15 MW turbine by 2014 (Gamesa, 2010). At the other end of the scale,
however, the development and deployment of smaller turbines also shows strong
growth. A market report by RenewableUK describes an extremely active industry in
which installed capacity in the UK rose 65% during 2010 from 8.62 MW at the
beginning of the year to 14.23 MW at the end (RenewableUK, 2011b). One of the
factors that contributed to this growth was the introduction in April 2010 of feed-in
tariffs (FITS) as a financial incentive for small-scale renewable electricity generators
(DECC, 2011). Under the scheme, the operator receives a payment for generating
electricity, which currently ranges from 4.7 to 36.2 pence per kilowatt hour depending
on the installed capacity. If the generated electricity is also exported to the grid a
second payment is made of 3.1 p/kWh. A rough calculation shows that for a 10 kW
turbine costing around £40000 and operating at a modest 15% capacity factor the
FITS payments would mean a financial payback period of approximately 10 years.
This makes small scale wind generation an attractive investment for small
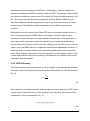
landowners such as farmers. Table 1 summarises RenewableUK‘s classification of
turbine sizes and the corresponding FITS rates for a single turbine. Note that the
FITS scheme has additional bands with lower rates which allow for the installation of
13
multiple turbines. The largest capacity allowed under the scheme is 1.5 MW for
which the rate is 4.7 p/kWh.
Category
Rated power (kW)
Installed cost (£k)
FITS rate (p/kWh)
Micro
0 – 1.5
0.5 – 5
36.2
Small
1.5 – 15
2 – 50
28
Small-medium
15 – 100
50 – 250
25.3
Table 1: Turbine categories and corresponding FITS rates (RenewableUK, 2011b; Ofgem, 2011)
2.2 Turbine design issues
The effective design of wind turbines relies on detailed knowledge of several distinct
subject areas which are briefly summarised in the sections below.
2.2.1 Conceptual design
All wind turbines operate by using a proportion of the kinetic energy in an air flow to
develop torque in a shaft. Early European windmills drew upon the seafaring
experience of the local cultures and used sails to drive the shaft. Although
arrangements with many sails were possible, the typical design was based on four
sails to simplify the construction of the supporting frame (Burton et al., 2001, p.340).
All current designs rely on more or less rigid rotors based on the principles of
aerodynamics, and usually have two or three rotor blades mounted on a horizontal
axis. Vertical-axis designs are also in use, but they are less popular due to their
lower efficiencies and higher cost (Gross, 2007, p.104). The explanation for the
design convergence in horizontal-axis machines requires reference to some basic
theoretical concepts.
As for any other energy conversion device, it is important to have a means of
expressing the efficiency of a wind turbine. Fundamentally, this is ratio of the actual
power production of the machine to the total energy available, and gives a
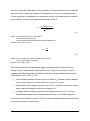
dimensionless power coefficient, CP, whose basic formula is given by Eq. 1.
By optimising the formula for CP, it can be shown that the maximum possible value is
0.593, known as the Betz limit. Because the Betz limit is derived from theoretical
principles rather than with reference to any particular turbine design (Burton et al.,
2001, p.45), it provides a fixed upper bound for the efficiency of any turbine. The
actual value of the power coefficient is affected by the geometry of the rotor blades
14
and also varies with wind speed. The interaction of these quantities can be captured
with reference to another proportional characteristic known as the tip speed ratio, λ.
The tip speed ratio is defined as the tangential velocity of the spinning rotor divided
by the velocity of the uninterrupted wind as given by Eq. 2.
(1)
where ρ is the density of air (1.225 kg/m3)
U is the wind velocity (m/s)
A is the circular area swept by the turbine blades (m2)
(Burton et al., 2001, p.44)
(2)
where Ω is the angular velocity in radians per second
R is the rotor radius in meters
(Burton et al., 2001, p.49)
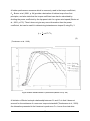
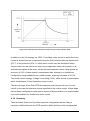
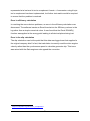
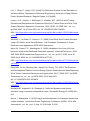
The power coefficient can be plotted against tip speed ratio for a given turbine
design to give a characteristic performance curve. Figure 2 shows this curve for
turbines with different numbers of blades, from which several observations can be
made (Burton et al., 2001, p.175):
Fewer blades produce a broad, flat curve where CP remains roughly constant
over a wide range of λ, but the maximum value of CP is low.
More blades give a higher maximum value for CP, but the curve has a narrow
peak making the design sensitive to changes in λ.
A design with three blades produces the highest maximum CP, but a two
bladed design gives more consistent performance over a wider range of λ.
It should be noted that the curves in Figure 2 assume that the blades themselves are
of similar dimensions in each case.
15
A further performance measure which is commonly used is the torque coefficient,
CQ. Burton et al. (2001, p. 64) provide a derivation of turbine torque from first
principles, and also state that the torque coefficient can also be calculated by
dividing the power coefficient by the tip speed ratio for a given wind speed (Burton et
al., 2001, p.176). Thus it does not give any more information than the power
coefficient, but can be useful in determining instantaneous torque Q using Eq. 3
(3)
(Teodorescu et al., 2003)
Figure 2: Effect of blade number on performance (Burton et at. p. 175)
A limitation of Burton‘s simple relationship between CP and CQ is that it does not
account for the existence of a non-zero torque at standstill (Teodorescu et al., 2003).
An alternative presented in the literature is produce a CQ-λ curve from test data
16
(Lopes et al., 2005; Weiwei Li et al., 2007; Munteanu et al., 2008) which leads to a
polynomial expression for CQ as a function of λ. In their derivation of CQ, Yaoqin Jia
et al. (2007) assume a value for startup torque as a given parameter, while Weiwei Li
et al. (2007) also suggest using a lookup table which amounts to the same thing.
2.2.2 Blade design
It should be acknowledged from the outset that any brief consideration of the design
of turbine blades requires many simplifying assumptions. Issues such as the nonuniformity of air flow in real situations, the smaller aerodynamic effects that occur at
specific points on a blade, and the variation in blade geometry along its length are all
worthy of exploration. For a detailed look at such issues, please refer to Burton et al.
(2001).
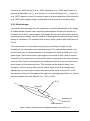
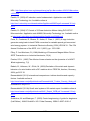
The cross section of a rotor blade at any given point along its length can be
modelling in two dimensions as a standard aerofoil. The characteristic shape of an
aerofoil gives rise to the phenomenon of aerodynamic lift when air flows over it at a
given angle. The lift force acts at right angles to the actual air flow, while a second
component of the total force on the aerofoil known as drag acts in the same direction
as the air flow. Figure 3 summarises the aerodynamic forces on an aerofoil set at a
given angle α to the incident air flow. This is known as the angle of attack, and
variations in α have a large effect on the relative sizes of the lift and drag forces.
Specifically, once the angle of attack reaches a critical value of around 10° to 16°,
the behaviour of the air flow leads to the drag force outweighing the lift force, and the
aerofoil is said to be in stall (Burton et al., 2001, p.166).
Lift (L)
Drag (D)
α
Aerofoil zero
lift line (Z)
Wind direction
Figure 3: Aerofoil lift and drag forces (Adapted from Burton et al., 2001, p. 61)
17
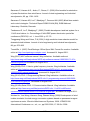
Because the blades of a wind turbine are rotating, an air flow is also induced in the
opposite direction to the rotation, which is to say perpendicular to the air flow due to
the wind. It is common therefore to talk about the vector sum of these two flows as
the air flow experienced by the rotor blade. It is the angle of attack relative to the
resultant air flow which is relevant when calculating the forces on the blades of a
rotating turbine, and Figure 4 shows its derivation. Also shown in Figure 4 is the
blade pitch angle, β. The pitch angle is significant because it is a controllable design
parameter whereas the angle of attack varies with local conditions.
Induced air flow due to
rotation
β
α
Wind direction
Z
Φ
Resultant (experienced) air flow
Fig 4.
(=α+β)
Figure 4: Resultant airflow on rotating blade (Adapted from Burton et al., 2001, p. 61)
Because we are interested in the torque applied to the rotor shaft, a final
decomposition of the lift and drag forces is required to determine the component that
acts in the direction of rotation. By simple vector decomposition, this turns out to be
where L and D are the lift and drag forces, and Φ is the angle between the airflow
experienced by the blade and the plane of rotation (ie α + β). This decomposition is
shown in Figure 5 which also shows the considerably larger force acting
perpendicularly to the plane of rotation (Burton et al., 2001, p.61).
18
L cosΦ + D
sinΦ
L
Φ
D
L sinΦ + D
cosΦ
Figure 5: In-plane and out-of-plane forces on turbine blade (Adapted from Burton et al., 2001, p. 61)
The actual aerodynamic behaviour of the rotor blades depends on their detailed
design features. Some of the parameters that can be modified are the rotor radius,
the width of the blades at different points along their length, the variation in the pitch
angle along the blade length and the degree of camber in the aerofoil cross section.
Although it is the aerodynamic construction of the blades that determines the torque
they generate, the mathematical complexity involved is considerable. In practice, the
torque developed by a rotor is typically calculated on the basis of empirical
measurements.
2.2.3 Materials
The choice of materials for a machine of any kind is driven by several potentially
conflicting goals. The performance of the machine should be maximised, which in
the case of a wind turbine means for example that the blades should be as light as
possible. At the same time it should be robust enough to resist damage under
extreme conditions (Burton et al., 2001, p. 377). A trade-off is therefore required to
balance these requirements. In the case of the rotor, this has a significant effect on
the behaviour of the machine. The rotor is subject to a range of forces, some of
which are required for its successful operation. Other forces such as the component
of the aerodynamic force perpendicular to the plane of rotation are actually
undesirable but nevertheless have to be accommodated. In general, there are two
significant categories of forces that need to be taken into account: bending moments
which arise from the long thin shape of the typical rotor, and fatigue forces which
arise from typically small but persistent variations in operating conditions. A rotor of
19
light construction has a low moment of inertia and is better able to withstand the
bending moment due to gravity when the blades are horizontal. However it is likely to
be prone to buckling under the out-of-plane aerodynamic force. The force of gravity
on a rotating blade is also a source of fatigue since the direction of the force
reverses with each rotation (Burton et al., 2001, p. 236). A further major source of
fatigue is the variation in angle of attack which occurs when the plane of the rotor is
not perpendicular to the direction of the wind. All wind turbines rotate in the
horizontal plane to bring the rotor to face into the prevailing wind direction, a motion
known as yaw. Under real operating conditions, a wind turbine cannot react quickly
enough to variations in wind direction to maintain perfect orientation, and therefore
experiences variable aerodynamic forces most of the time (Burton et al., 2001, p.
96).
Steel plate has been used in rotor construction in early commercial turbines, but its
low strength to weight ratio makes it less than ideal. Most modern turbines use glass
fibre, carbon fibre or wood composites. Because of their layered construction, these
materials have a relatively high strength to weight ratio and also lend themselves to
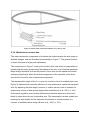
moulding which again is not possible with steel. Although carbon fibre gives the best
performance, fibreglass is usually preferred on cost grounds. Figure 6 shows the
typical construction of a fibreglass rotor in cross section showing an internal
structural web which helps to provide rigidity and resistance to buckling. Variations
on this general design include a larger number of internal webs and variations in
shell materials between the leading and trailing edges.
For other turbine components, the choice of materials is more limited. The
supporting tower, for example, could be made of steel or concrete, but steel is
almost invariably preferred because of the logistical associated with transporting
large concrete members (Burton et al., 2001, p.453).
20
Figure 6: Turbine blade construction (Burton et al., 2001, p. 379)
2.2.4 Mechanical construction
The main mechanical components of a turbine are similar despite the wide range of
detailed designs, and are illustrated schematically in Figure 7. The general function
of these elements is largely self-explanatory.
The components in Figure 7 make up the turbine drive train which is responsible for
transferring the torque produced by the blades to the rotor of an electrical generator.
Major design decisions such as the position of the rotor and the speed and control
strategies significantly affect the actual arrangement of the elements of the drive
train and the need for other mechanical components.
The characteristic shape of the CP-λ curve for a turbine with a fixed blade pitch (see
Figure 2) indicates that maximum efficiency is only achieved at a particular tip speed
ratio. By adjusting the pitch angle, however, a turbine can be made to maintain its
rated power output at wind speeds higher than rated (Burton et al., 2001, p. 181).
Active pitch regulation requires that additional mechanical features to allow each
blade to rotate about its own longitudinal axis. This necessarily includes a shaft and
bearings for each blade, but the selection of individual or central actuator is a
function of detailed turbine design (Burton et al., 2001, p. 351).
21
Figure 7: Mechanical construction of horizontal axis wind turbine (Munteanu et al., 2008)
A teeter hinge can also be added to the turbine design in order to limit undesirable
loads on blades, low speed shaft, nacelle and yaw mechanism (Burton et al., 2001,
p. 347). Most often used on two-bladed turbines, a teeter hinge allows the rotor to
pivot by a small amount at the hub. This allows small out-of-plane moments, periodic
forces arising from the rotation of the blades and random forces due to turbulent air
flow to be absorbed rather than being transferred to the main structural components.
Despite the wide range of mechanical considerations illustrated above, it is the drive
train that is of most interest in terms of dynamic behaviour. For larger turbines where
blade flexibility is significant, Anaya-Lara et al. (2009) propose a three mass model
of the drive train which includes the generator, hub and blades as independent
masses connected by torsional springs. However, they derive an effective two-mass
22
system similar to that presented by Hansen et al. (2003) which is sufficient for most
studies. In the two-mass system shown in Figure 8, a large rotating mass
representing the rotor is connected to a smaller mass representing the generator via
a low-speed shaft, an ideal 1:n gearbox and a high-speed shaft. The moments of
inertia of the shafts and gearbox are deemed negligible. Some authors go a step
further and represent the turbine as a single-mass system by ignoring the dynamic
characteristics of both shafts (Neammanee et al., 2007; Munteanu et al., 2010;
Kojabadi and Chang, 2011). In this case, the dynamic behaviour of the turbine can
be represented by
(
)
(4)
where Qmech is mechanical torque
n is the gear ratio
Jrotor is the rotor inertia
Jgenerator is the generator inertia
ωgenerator is the rotational speed of the generator
Qgenerator is the generator torque
(Kojabadi and Chang, 2011)
Qrotor
Jrotor
ωgenerator
Low
speed
shaft
Jgenerator
Gearbox
Qgenerator
High
speed
shaft
Jrotor
Jgenerator
Qrotor
Qgenerator
ωgenerator
= Rotor inertia
= Generator inertia
= Rotor torque
= Generator torque
= Rotational speed of the generator
Figure 8: 2-mass model of turbine drive train
23
2.2.5 Torque oscillations
The majority of large turbines employ a design in which the rotor blades are oriented
into the wind in front of the nacelle and tower by an electric motor known as the yaw
drive. The alternative arrangement is to place the rotor downwind of the nacelle so
that the wind itself maintains the rotor in the ideal position. This passive yaw control
makes the yaw drive redundant. The simplicity of the second option means reduced
manufacturing cost, reduced maintenance and lower power consumption than the
first; however, the downwind arrangement is more susceptible to the phenomenon of
tower shadow. The tower presents an obstacle to the flow of air both upwind and
downwind and as a rotor blade passes the tower it experiences a momentary drop in
air flow. The effect is much weaker in the upwind direction and can generally be
ignored in electrical calculations (Chan et al, 1984); however, it must still be taken
into consideration in relation to blade loading (Burton et al., 2001, p. 234). In the
downwind direction the drop in velocity of the air flow due to tower shadow can be of
the order of 20%, and is therefore significant in both cases (Chan et al., 1984).
Tower shadow can be reduced by placing the rotor further from the nacelle, although
the effect can still be significant at a distance equivalent to four tower diameters
(Burton et al., 2001, p. 373). A lattice tower can be used rather than a tubular one to
reduce the effect (Burton et al., 2001, p. 233), although this approach can make the
remaining effect dependent on wind direction (Burley et al., 1979 cited by Chan et
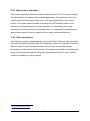
al., 1984). A number of studies exist that deal with tower shadow in upwind threebladed turbines (eg. Sørensen et al., 2002; Dolan and Lehn, 2006) and several
mathematical models are available of varying complexity; however, the potential flow
model used in Garrad Hassan‘s modelling application, GL BLADED, can equally well
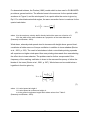
be applied to two-bladed machines (Bossanyi and Quarton, 2003). In this model, a
120° sector of the rotor swept area is deemed to be influenced by tower shadow as
shown in Figure 9. The wind speed at a point within that zone of influence is given by
Eq. 5.
24
(
( )
(
(
)
)
)
(5)
where U is the uninterrupted wind speed
T is the tower diameter
x is the lateral displacement of the point from the tower centre line
z is the minimum distance between the plane of the rotor and the centre of the tower
(Bossanyi and Quarton, 2003)
60
°
x
z
Figure 9: Tower shadow
When a blade is within 60° of top dead centre, it is assumed that V = U. For all other
rotor positions the factor in brackets in Eq 5 is modified to
(
( ))
(
( ))
where F represents the bracketed term in Eq. 5, and φ is the blade azimuthal angle
measured from top dead centre of the swept area.
25
For downwind turbines, the Powles (1983) model which is also used in GH BLADED
provides a general solution. The affected zone is the same as for the upwind model
as shown in Figure 9, and the wind speed V at a point within the sector is given by
Eq 6. For other blade azimuthal angles, the same correction factor is made as for the
upwind calculation.
(
(
))
(6)
where Δ is the maximum velocity deficit directly behind the tower as a fraction of U
W is the width of the tower shadow as a proportion of the tower diameter d
(Bossanyi and Quarton, 2003).
Wind shear, whereby wind speeds tend to increase with height above ground level,
constitutes a further source of torque oscillation in addition to tower shadow (Burton
et al., 2001, p. 233). The result of wind shear is that a rotor blade pointing upwards
will experience a higher wind speed than one pointing downwards thus exacerbating
the effect due to tower shadow. The problem can be further compounded if the
frequency of the resulting oscillation is close to the resonant frequency of either the
blades of the tower (Burton et al., 2001, p. 267). Wind shear can be modelled as a
logarithmic function given by
( ⁄ )
( ⁄ )
(
)
(7)
where Vh is wind speed at height h
V0 is wind speed at a reference height h0
z0 is the ground roughness length which takes values from Table 2
(Bossanyi and Quarton, 2003).
26
Type of terrain
Roughness length z0 (m)
Cities, forests
0.7
Suburbs, wooded countryside
0.3
Villages, countryside with trees and hedges
0.1
Open farmland, few trees and buildings
0.03
Flat grassy plains
0.01
Flat desert, rough sea
0.001
Table 2: Roughness length values (Burton et al., 2001, p. 19)
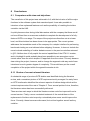
2.2.6 Electrical systems
It is clear from Figure 7 that the main electrical element of interest is the generator;
however, the type of generator and the requirement for other electrical components
depends on the detailed turbine design. Firstly, it is important for later discussions to
note that an electric generator is simply an electromechanical machine (EM) used in
generating mode (Gross, 2007, p. 79). The same physical device can be used either
as a generator where a kinetic input is converted to an electrical output, or as a
motor where an electrical input passes through the same circuitry to produce a
kinetic output.
Although other energy conversion applications typically rely on synchronous
permanent magnet EMs, the natural operation of a wind turbine introduces periodic
fluctuations into its output which degrade the power quality. Using an induction
generator on the other hand introduces a damping action which reduces the
unwanted fluctuations to acceptable levels (Burton et al., 2001, p. 364). Whereas
with a permanent magnet EM, the rotor is locked to the rotational speed of the
magnetic field in the stator, the rotor of an induction EM rotates at a different speed
which varies depending on the electrical and mechanical loads. The difference
between the speed of the stator field and the rotor is known as the slip speed and is
usually expressed as a percentage of synchronous speed as defined by Eq 8.
27
(8)
where S is slip
ωs is synchronous speed
ωr is rotor speed
When slip is positive, the rotor speed is less than that of the stator field and the EM
is operating in motoring mode. In contrast, negative slip indicates that the rotor is
moving more quickly than the stator field and the EM is therefore in generating
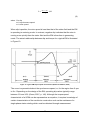
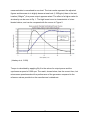
mode. The actual relationship between slip and torque for a typical EM is illustrated
in Figure 10.
Figure 10: Typical EM torque-speed characteristic (Bakshi and Bakshi, 2009)
The curve is symmetrical about the synchronous speed, ns, for the region from 0 rpm
to 2ns. Depending on the design of the EM, operating slip values typically range
between 2% and 10% (Gross, 2007, p. 146). Although the torque-speed
characteristic of a SCIM can be expressed as an equation, it requires knowledge of
certain characteristics of the machine‘s construction such as the resistance of a
single-phase stator winding which must be obtained through measurement.
28
However, a simpler relationship exists between the torque applied in generating
mode, the output power and synchronous speed as shown in Eq. 9.
(9)
where Q is torque
P is power
ωs is synchronous speed
The simplest electrical arrangement for a turbine is for the generator to be directly
connected to the distribution network, and in that situation the network frequency
determines its rotational speed. This arrangement is very common, and is known
either as the Danish model or more descriptively as a fixed speed turbine (Müller et
al., 2002). The synchronous speed is given by the formula
(10)
where f is the network frequency
N is the number of poles in the EM
(Parekh, 2003).
Thus for a 6-pole EM connected to the UK electricity grid which runs at 50 Hz, the
synchronous speed is 1000 rpm. When the torque generated by the blades is
sufficient to turn the EM rotor at more than 1000 rpm therefore, the turbine will export
power to the network. At lower speeds, the turbine will actually draw power from the
network unless it is isolated.
The major disadvantage of the fixed speed design is that the turbine will operate
sub-optimally at wind speeds that do not correspond to the peak tip-speed ratio
(Burton et al., 2001, p. 360). In order to allow a turbine to operate at variable speed,
the generator must be decoupled from the network by interposing a frequency
converter; however, this significantly increases the complexity of the design and
29
hence the cost (Müller et al., 2002). An appropriate frequency converter would be a
back-to-back inverter. In this device, an alternating current (AC) of arbitrary
frequency is first converted to a direct current (DC) and then into an alternating
current which matches the frequency of the network as shown in Figure 11.
Gearbox
Back-to-back inverter
Synchronous
Generator
Grid
=
3~
=
3~
Figure 11: Inline adjustable speed generator (Müller et al., 2002)
With this arrangement any rotational fluctuations in the power output can be
smoothed by the frequency converter, and an induction EM is no longer required.
However, when the frequency converter is in line with the generator, it has to carry
the full power rating of the system which makes it expensive (Müller et al., 2002). An
alternative arrangement, shown in Figure 12, is to use a doubly fed induction
generator (DFIG). Here the rotor is of the wound construction rather than the simpler
squirrel cage design, and is fed with a variable voltage supplied by the frequency
converter. Control of the rotor current compensates for variations in speed, and the
output can remain at the required frequency. The main advantage over the in-line
design is that the frequency converter only needs to carry around 25% of the total
system power, and is therefore significantly cheaper (Müller et al., 2002).
30
Gearbox
Grid
DFIG
Back-to-back inverter
=
3~
=
3~
Figure 12: Adjustable speed generator with DFIG (Müller et al., 2002)
As discussed earlier, more complex turbine designs, which include yaw drives or
active pitch control for example, require additional electric motors. These are
typically fed directly from the distribution network, and do not therefore affect the
operation of the drive train components.
2.2.7 Control
The main purpose of control is to ensure that a complex technical process responds
in a desired manner to operational changes and external disturbances both to
protect the plant and to optimise its operation (Schleicher and Blasinger, 2003;
Munteanu et al., 2008, p. ). Wind turbine control can be subdivided into three
separate categories (Burton et al,. 2001, p. 472). The first is supervisory control in
which an operator brings the turbine into a particular operating state. The second is
closed-loop control in which the adjustment of operating parameters is controlled
automatically by a digital controller in response to sensor readings, and the third
concerns mechanisms for dealing with potentially dangerous or fault conditions such
as excessive tower vibration. Although safety control also depends on sensor
readings, it differs from closed loop control in that it typically brings the machine into
an exceptional fail-safe state rather than one that is associated with normal
operation.
31
In the context of wind turbine design, it is the external changes in airflow which drive
the majority of control actions. Munteanu et al. (2008, p. 5) identify three distinct
types of control system in wind turbines:
Aerodynamic power control
Generator control
Grid interface control and power conditioning
Intuitively, the more power a turbine delivers the better. In practice, however, a
machine that operates beyond its rated value risks damage to components such as
the generator. It is therefore important to limit the power developed at high wind
speeds so that safe limits are not exceeded. A simple way to enforce power control
is to select a blade geometry which induces a stall condition above a particular wind
speed. Referring to the CP-λ curves in Figure 2, this ensures that the power
generated by the turbine declines after a predictable point. This arrangement is
known as passive stall control, since it is simply a feature of blade shape (Burton et
al., 2001, p.350), and is necessarily only concerned with system protection
(Munteanu et al., 2008, p. 26). In contrast, turbines which include the facility to
control the pitch angle of the blades can not only avoid potentially dangerous
conditions but can also actively optimise the angle of attack for a given prevailing
wind speed. This can be done by increasing the angle of attack to induce stall, or by
reducing the angle of attack to reduce the aerodynamic lift force, a process known as
blade feathering. The additional energy extracted by active pitch control is only about
4% (Burton et al., 2001, p. 351), but allows the turbine to better track the ideal power
curve as shown in Figure 13.
32
Figure 13: Effect of pitch regulation on performance (Burton et al., 2001, p. 342)
Active manipulation of the aerodynamic behaviour of the blades requires sensors
such as anemometers to provide information about prevailing conditions, and digital
controllers to select the appropriate settings for blade pitch actuators. This lays the
basis for closed-loop control in which operating parameters are adjusted in response
to changes in a process variable such as shaft rotation speed to bring the system
behaviour closer to a known optimum. The desired value of the process variable is
known as the set point, and in the case of wind turbines where external changes
account for the majority of adjustments, the set point is determined by reference to a
mathematical model of optimum system performance. Closed-loop control is also
essential in turbines with yaw drives to maintain the optimum orientation of the rotor
plane (Burton et al., 2001, p. 477).
While aerodynamic control is primarily protective, the goal of generator control is
concerned with maximising the efficiency of the power conversion. This is most
obvious in the case of variable-speed turbines with DFIG generators which provide
many opportunities for adjusting operating conditions. For simpler turbine designs
with fewer controllable parameters, generator control is still important in order to
isolate the turbine from the grid at lower speeds to avoid drawing power.
33
For smaller turbines, the need for control over their interface with the distribution
network is minimal. For larger turbines, however, the quality of their output can affect
other devices attached to the network through phenomena such as voltage
transients due to wind speed variations, harmonics caused by frequency conversion
equipment and periodic fluctuations known as flicker (Burton et al., 2001, p. 580).
The requirements for power quality control can be summarised as follows (Sørensen
et al., 2005, cited by Munteanu et al., 2008, p. 101).
1. Power/frequency control ability with focus on:
a. primary control—fast, automatic adjustment of power to frequency
b. secondary control—slower, automatic or manual regulation of the
power to the power reference imposed by the system operator at any
time.
2. Voltage control ability with focus on voltage regulation and reactive power
capability.
3. Dynamic stability with focus on the ability of wind turbines to remain
connected to the grid during some specific grid faults.
2.3 Turbine emulation
From the foregoing discussion, it is clear that wind turbines can be very complex
pieces of equipment that require complex and expensive components. The industry
is also developing very quickly with larger models and new designs frequently being
produced. Efficient methods are therefore required for the evaluation of existing
design performance and the experimental testing of new designs. Although this is
true for most industries, wind turbine designers and manufacturers are also faced
with the additional problem that turbines are typically installed in locations that are
difficult to access thus making in situ evaluation difficult. Static models of turbine
behaviour however cannot capture the real wind regime at a turbine location or the
short-term dynamics of drive train components reacting to oscillating torque,
resonance and other operational phenomena (Rabelo et al., 2004). This dilemma
has led several teams of researchers to propose a range of turbine emulators that
can be used to recreate realistic loads on a turbine in a laboratory situation. Different
motivations have been invoked including those shown in Table 3.
34
Motivation
References
Development of control algorithms and
techniques
Teodorescu et al., 2003
Chinchilla et al., 2004
Kojabadi et al., 2004
Rabelo et al., 2004
Moore and Ekanayake, 2010
Munteanu et al, 2010b
Analysis of the dynamics of drive train
components
Kojabadi et al., 2004
Helsen et al., 2010
Investigation of fault conditions
Mauri et al., 2008
Moore and Ekanayake, 2010
Condition monitoring and fault diagnosis
Yang et al., 2008
Yang et al., 2010
Crabtree, 2011
Johnson and Fleming, 2011
Power quality and network transient analysis
Seman et al., 2005
Mauri et al., 2008
Table 3: Motivations for the use of wind turbine emulators
The basic requirement for a wind turbine emulator (WTE) is that it should reproduce
as faithfully as possible the torque generated by a turbine for a particular wind speed
(Kojabadi and Chang, 2011). Monfared et al. (2008) summarise required elements of
a WTE model as:
A variable wind speed
Turbine inertia
Wind shear and tower shadow
Steady state characteristics
The specific purpose of the WTE can influence its actual form. For example,
because Helsen et al (2010) are primarily concerned with the performance of the
gearbox, it is important that their model isolates that particular component and they
therefore take a multi-body modelling approach which leads to significant complexity
and calculation times. For other purposes, however, the effective two-mass model
described by Anaya-Lara et al. (2009) is usually sufficient. With this in mind, the
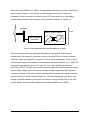
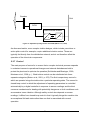
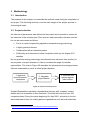
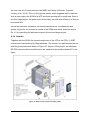
basic structure of a WTE can be derived from the schematic representation of a wind
35
turbine in Figure 14 where the components inside the dashed boundary are replaced
by an alternative source of torque, typically an electrical drive. A computer model of
the rotor characteristics provides a reference torque value (Lopes et al., 2005), and a
control algorithm ensures that the torque produced corresponds to the reference
torque. This arrangement, shown in Figure 15, is ideal for examining the control of
the generator and the conditioning of the output power. Because it combines virtual
elements with real ones it is often referred to as hardware-in-the-loop (HIL)
(Munteanu et al., 2010b) or power hardware-in-the-loop (PHIL) (Ayasun et al., 2007).
Strictly speaking, PHIL designates a system in which real power is passed between
real and virtual components whereas in a HIL system only information signals are
exchanged.
Gearbox
Wind
Grid
Low
speed
shaft
Generator
High
speed
shaft
Figure 14: Schematic representation of wind turbine
Sensor
feedback
Grid
Generator
Electrical
drive
Turbine
model
Reference
torque
Figure 15: Schematic representation of wind turbine emulator
36
Clearly, the schematic in Figure 15 represents a very general model of a WTE, and
additional hardware components would be required to emulate more complex
designs which include, say, a DFIG generator. Likewise, an appropriate computer
model would be required for the particular turbine design being emulated. It is also
worth noting that given an appropriate model of the prime mover, the arrangement
shown is not restricted to wind turbine emulation, and could equally well be applied
to other forms of electricity generation. This generic approach is the one taken by
Mauri et al. (2008) and Munteanu et al. (2010).
A distinction can be made between the set of physical WTE components and those
that replace elements of the real environment such as the prime mover. Testing
usually focuses on the behaviour of the former, which in PHIL terms is designated
the hardware under test (HUT).
2.3.1 Drive selection
Several teams of researchers have suggested using a DC electric motor as an
alternative source of torque in a WTE (Chinchilla et al., 2004; Lopes et al., 2005;
Monfared et al., 2007; Weiwei Li et al., 2007; Mauri et al., 2008; Martinez et al.,
2009; Moore and Ekanayake, 2010; Munteanu et al., 2010, 2010b; Crabtree, 2011).
The attraction of a DC machine is that the torque it produces is directly proportional
to the armature current, and is therefore very easy to control (Lopes et al., 2005). In
fact, Martinez et al. (2009) propose a WTE for fixed pitch turbines which consists of
nothing more than a DC motor connected in series with a resistance and a variable
voltage source. However, no detailed evaluation is presented, and the main
justification for the design is that the power curve of the DC motor is roughly the
same as that of a fixed pitch turbine.
Permanent magnet synchronous machines (PMSM) have also been proposed for
use in WTEs (Dolan et al., 2005; Weihao Hu et al., 2008). The main benefits of a
PMSM are that it offers higher impulse torque and power density and faster speed of
response in comparison to a DC machine (Dolan et al., 2005). Because it does not
require an excitation system, the PMSM also has the advantage that there are no
associated field losses (Gross, 2007); however, torque control is more difficult
because its relationship with the three-phase sinusoidal current is complex. Using a
mathematical operation known as Park‘s Transform, the three AC phase currents
37
can be reduced to two DC components in a rotating frame of reference (Lee et al.,
1984). In the rotating frame of reference, a direct current component (d) rotates at a
90° phase angle from a quadrature component (q). The torque in the PMSM can be
shown to be proportional to the quadrature current (Pillay and Krishnan, 1988). Once
the required current in the q-axis has been calculated, the equivalent AC supply to
the PMSM can be found by applying the inverse Park transformation. This method
for controlling a PMSM is known as field-oriented control (FOC) and can be
accomplished relatively easily using a microprocessor (Gabriel et al., 1980).
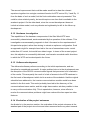
A third group of WTE studies use a squirrel-cage induction machine (SCIM) to
provide the required torque, usually citing the SCIM‘s rugged design and lower cost
as benefits (Teodorescu et al., 2003; Kojabadi and Chang, 2004; Ming Qiao et al.,
2007; Neammanee et al., 2007; de Oliveira et al., 2007; Yaoqin Jia et al., 2007). The
torque produced by a SCIM can be controlled using FOC in the same manner as for
a PMSM. As a consequence of choosing this type of drive, a reliable variable voltage
source is also required and Kojabadi and Chang (2004) propose an inverter based
on insulated gate bipolar transistors (IGBT). This type of inverter is typically
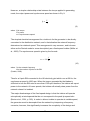
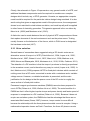
composed of two main components as shown in Figure 16. The rectifier converts the
standard AC supply to DC, and the inverter component whose basic structure is
shown in Figure 17 uses a set of IGBTs under microprocessor control to produce a
series of pulses in three phases. The resulting output in each phase uses pulse
width modulation (PWM) to synthesise a sinusoidal voltage of the required frequency
as shown in Figure 18. The inverter therefore converts the problem of frequency and
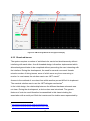
voltage magnitude control into one of IGBT switch timing (Gross, 2007).
Figure 16: General configuration of PWM motor drive (Gross, 2007)
38
Figure 17: The three-phase IGBT circuit diagram (Gross, 2007)
Figure 18: Approximation of a sine wave using PWM (Adapted from Gross, 2007)
2.3.2 Turbine model
The purpose of the turbine model is to provide a reference torque for the WTE drive.
It therefore consists of a static element which describes the torque produced by the
rotor as a function of wind speed using Eq. 3 and a dynamic element that describes
the torque oscillations produced by wind shear and tower shadow using Eq. 7 and
either Eq. 5 or Eq. 6 The static element requires an understanding of the turbine‘s
performance at different wind speeds. As noted by Teodorescu et al. (2003), the
distribution of torque coefficient with tip speed ratio is more useful in this case than
the power coefficient. The torque-speed characteristic can be obtained from test data
where available, or derived from the turbine manufacturer‘s published data. Yaoqin
Jia et al. (2007), for example, provide a procedure for deriving CQ from the
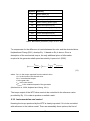
parameters shown in Table 4.
39
Symbol
Quantity
R
Rotor radius (m)
J
Inertia (kg/m3)
PW
Rated power (kW)
ωW
Rated rotating speed (rpm)
VW
Rated wind speed (m/s)
ωM
Maximum rotating speed (rpm)
VS
Startup wind speed (m/s)
VIN
Cut-in wind speed (m/s)
VOUT
TS
Cut-out wind speed (m/s)
Startup torque (Nm)
Table 4: Wind turbine parameters (Yaoqin Jia et al., 2007)
To compensate for the difference in inertia between the rotor and the electrical drive,
Kojabadi and Chang (2011) develop Eq. 11 based on Eq. 4 above. Given a
description of the mechanical torque, the only additional piece of information
required is the generator shaft speed as noted by Lopes et al. (2005).
(
)
(11)
where Qdrive is the torque required from the electric drive
Jdrive is the inertia of the electric drive
Qmech is mechanical torque
n is the gear ratio
Jrotor is the rotor inertia
ωgenerator is the rotational speed of the generator
(Monfared et al., 2008; Kojabadi and Chang, 2011).
The torque output of the WTE drive needs to be controlled to the reference value
provided by Eq. 11 in order to produce a realistic result.
2.3.3 Instrumentation and control
Knowing the torque produced by the WTE is clearly important if it is to be controlled
with reference to the turbine model. There are essentially three options, the first of
40
which is to estimate the torque based on known characteristics of the drive. This is
the approach taken for example by Martinez et al. (2009), Ming Qiao et al. (2007)
and Monfared et al. (2008). Details of the process for estimating the drive torque are
not provided; however, Monfared et al. include a component in their reference torque
calculation aimed at compensating for the inertia of the drive itself. This was a
problem identified by Dolan et al. (2005) as one of the reasons for including a torque
transducer.
The second option is to take direct measurements from the WTE drive and calculate
the torque. This is easier in the case of a DC-based WTE because of the direct
relationship between torque and current. Moore and Ekanayake (2010) and
Munteanu et al. (2010), for example, calculate torque in this way. Neammanee et al.
(2007) on the other hand use a SCIM in their WTE, and use the speed of the
generator shaft as a surrogate for torque. Exactly how this is done is not explored in
the paper. De Oliveira et al. (2007) who also use a SCIM rely in contrast on the
relationship between torque and slip illustrated in Figure 10.
Finally, torque can be measured directly using a torque transducer1. Crabtree (2011)
takes this approach and also collects a wide range of other sensor readings because
of his interest in fault diagnosis. Dolan et al. (2005) also measure torque directly as
mentioned earlier in order to compensate for motor inertia.
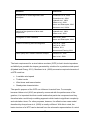
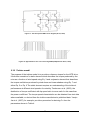
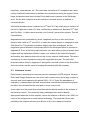
Only extremely simple WTEs in the literature rely on open-loop control (Martinez et
al., 2009). All others implement a form of closed-loop control in which the torque
delivered by the emulator is compared to the reference torque value supplied by the
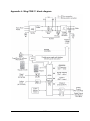
turbine model as shown in Figure 19. Note that the diagram shows the rotational
speed of the drive/generator shaft being used to calculate actual torque using the
relationship between torque and slip. This element could equally well be replaced by
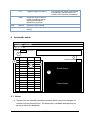
a torque transducer to measure torque directly.
1
See for example http://www.datum-electronics.co.uk/how-to-measure-torque.aspx
41
Wind
speed
Qref
Qcorr
Qerr
ω
= reference torque
= corrected torque
= torque error
= rotational speed of drive/generator shaft
Turbine model
Variable Frequency Drive
Qref
+/-
Qcorr
IGBT
inverter
SCIM
Generator
Qerr
SCIM model
ω
Figure 19: Block diagram for WTE torque control
2.3.4 Input data
The final element required for a WTE is a source of wind speed data. The three main
options here are
Directly-controlled wind speeds
Artificially generated time sequence
Logged time sequence
The choice of input type is determined by the type of test being conducted. Many
research teams use the first option because it facilitates the observation of system
behaviour under controlled conditions (Bouscayrol et al., 2005; Hsu Wen-Ko, 2010;
Kojabadi et al., 2004; Lopes et al., 2003; Mansouri et al., 2003; Munteanu et al.,
2010b; de Oliveira et al., (2007); Seman et al., 2006; Teodorescu et al., 2003;
Weihao Hu et al., 2008; Weiwei Li et al., 2007). Direct control over wind speed
42
allows for steady state observations, step changes in wind speed and steadily
ramped speed changes.
Where testing is focussed on aspects of turbine operation with a strong stochastic
element such as fault diagnosis or the characterisation of effects due to turbulence,
time series data is preferred. In these situations, wind models such as those
described by Diop et al. (2007) can be used to generate synthetic time series, or real
logged data can be used (Chinchilla et al., 2004). Examples of both approaches are
found with Crabtree (2011) preferring synthetic data and Dolan et al. (2005) opting
for logged data. Monfared et al. (2007) and Yaoqin Jia et al. (2007) use time series
data but do not specify the type, and Neannamee et al. (2007) use all three types of
input signal because of their interest in testing the capabilities of their WTE.
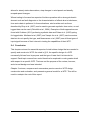
2.4 Conclusion
This chapter reviews the essential aspects of wind turbine design that are needed to
specify and construct a WTE. As noted in §2.3, the specific design of a WTE
necessarily follows from its purpose and the type of tests that it is intended to
support. Each topic covered here could therefore be explored in much greater detail
with respect to a specific WTE. That was not the purpose of the review, however,
and a broad background was intended.
Chapter 2 reviews, compares and summarises previous work on WTE design,
construction and evaluation, and presents a general model for a WTE. This will be
used to underpin the rest of this report.
43
3 Methodology
3.1 Introduction
The purpose of this chapter is to describe the methods used during the completion of
the project. The following sections cover the main stages of the project process in
chronological order.
3.2 Project selection
An initial set of parameters was defined for the project which provided a context for
the selection of the actual project. Each criterion was personally motivated, and the
list can be summarised as follows:
Focus on control engineering applied to renewable energy technology
A highly practical element
Collaboration with an industrial partner
Sufficiently short timescale to allow completion within by the August 2011
deadline
No one particular energy technology was deemed more attractive than another for
the purposes of project selection in order to increase the range of potential
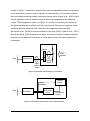
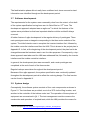
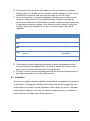
opportunities. The chart in Figure 20 describes the subsequent three-stage process
that was undertaken to arrive at a final project decision.
1. Approach
potential partner
companies
2. Negotiate
project details
3. Evaluate final
options against
initial criteria
Figure 20: Project selection process
Scottish Renewables maintains a membership directory with company contact
details which is accessible on their Web site2. Currently there are just over 300
companies listed. During the week beginning 18th April 2011, all entries in the list
were examined to filter out unlikely partner organisations such as local authorities,
2
http://www.scottishrenewables.com/members/membership-directory/
44
legal firms, consultancies, etc. The result was a shortlist of 31 companies who were
mainly small and locally based to facilitate communications during the project. Some
larger companies were also included if they had known interests in the Edinburgh
area. The list also contained a small number of research centres in addition to
commercial firms.
All shortlist members were contacted on 22nd April 2011 by email using a variation of
the text in Appendix A and a CV was included as an attachment. Between 22nd April
and 31st May, 11 replies were received, out of which 5 were polite refusals. This left
6 possibilities.
Negotiations were undertaken by email, telephone and face to face until a final
decision was made on 9th June 2011 to select the current project in cooperation with
Gaia Wind Ltd. This decision was taken slightly later than anticipated, but the
negotiation period allowed a clear project brief to be developed which is provided in
Appendix B. Prior to the final project selection, two alternative project proposals were
lodged with the dissertation Module Leader, one related to the Gaia Wind project,
and another as a backup which did not rely on any external collaboration. This was a
contingency in case of problems during the negotiation process. The two initial
proposals can be found in Appendix C along with a second version of the Gaia Wind
document which was the result of scoping discussions with the company.
3.3 Literature review
Early literature searching focussed on previous examples of WTE projects. Science
Direct and Google Scholar were the most useful search tools, and a large number of
sources were found spanning the period 2003 – 2011. Given the abundance of
examples, a representative set was selected that covered the indicated time period,
but which concentrated for the most part on more recent work.
It was clear from the outset that some theoretical subjects needed to be included in
the literature review. The University library catalogue was used to identify
appropriate textbooks for this purpose, hence the reliance on Burton et al. (2001) for
much of the background on wind turbine technology. This particular choice was
justified by the frequent references to Burton et al. in the research literature.
45
Further reference material was identified during the literature search and review
process by following up references in the papers themselves. This led to the
identification of several authors who filled important gaps in the background.
Two main approaches were taken to organise the identified references. The first was
to make paper copies of those papers relating to WTE studies and to highlight
important passages. These were later copied into an early draft of the literature
review so that they could be incorporated into the text at the appropriate points. The
second approach was to collect electronic copies of all available references onto a
PC. This facilitated fast electronic search within the documents.
When setting out the structure of the literature review, the outline view in Microsoft
Word was used to develop short notes which were developed into complete sections
as a second stage.
3.4 Project scope
The overall aim of the development was to create a general purpose WTE which
could be used to recreate arbitrary wind conditions to test the response of the Gaia
Wind turbine controller. However, it was agreed that this would not be possible within
the time constraints on the project. The WTE development was therefore split into
two phases of which this project is the first with the general aim of establishing
communications with the VFD and turbine controller via a PC-based human machine
interface (HMI). Thus the initial system will not include a turbine model. Instead of
wind speed as input, a target speed of rotation will be specified by the user. This is
sufficient to satisfy the immediate requirement of the company for a means for
performing benchmark tests. The introduction of the turbine model, the provision of
wind speed data as input and closed-loop torque control are therefore deferred to the
second phase. The following sections discuss the specific objectives related to the
aim of the first phase project.
3.4.1 Evaluate hardware setup
Gaia Wind has already put in place the hardware for a WTE. The adequacy of this
setup needs to be evaluated with respect to the requirements discussed in the
literature review. This evaluation will set the limits on what is possible with the
current configuration, and suggest ways that the hardware setup could be improved.
46
3.4.2 Establish communication with VFD
The VFD, of which a Weg CFW-11 IGBT inverter is the main component, provides a
range of control opportunities via its programmable parameters. To achieve this
objective, those opportunities need to be identified, a suitable method of
communication needs to be selected, and the communication management software
needs to be written. Part of the brief from the company is that this should take the
form of an identifiable module within the overall software development.
3.4.3 Establish communications with turbine controller
The existing turbine controller is supplied by Danish company Mita Teknik, and
provides information on a range of operational parameters. The achievement of this
objective will depend on developing a familiarity with the communication protocol
implemented by the controller, and writing the communication management
software. Again, the company brief specifies that this should be an identifiable
module within the overall software application.
3.4.4 Construct HMI
The company brief specifies that the HMI should take the form of a PC application
written in Microsoft Visual C#. The basic requirement is therefore to develop an
interface which provides a means to control the hardware as specified and to log
performance data during a test run which includes generator efficiency and
generator slip. This implies integration with both communications modules, and
some basic calculations based on the data that they supply. The company brief can
be found in Appendix B and the final functional specification in Appendix K.
The appropriateness of the selected development tools is also considered.
3.4.5 Evaluate results
The initial development is quite simple in comparison to the WTE projects covered in
the literature review. The evaluation therefore consists mainly in verifying that the
HMI is operating as specified. However, the data available from the system provides
a means for evaluating the reliability of the values delivered by the inverter and
controller interfaces.
47
3.5 Timescale
The initial project plan can be found in Appendix D. The overall duration was already
fixed as discussed previously given the target deadline of August 25th. During
negotiations with Gaia Wind, it became apparent that it would be advantageous to
have access to the hardware during the main software development period and that
an intense period on site at the company premises in Glasgow would be necessary.
A mutually convenient period of three weeks was identified from 27th June – 15th July
2011. This essentially split the project into three phases as described in Table 5. The
gap in the timeline from 16th – 28th July was due to a holiday.
Phase Activities
Dates
1
Literature review
Familiarisation with Visual C# and Microsoft Visual Studio
Initial work with equipment manuals
First draft of system design
10th June – 26th June
2
Detailed familiarisation with hardware
Software development
27th June – 15th July
3
Evaluation
Write-up
29th July – 25th August
Table 5: Overall project structure and schedule
3.6 Investigation of hardware configuration
The hardware for the WTE had already been assembled by Gaia Wind. It was
therefore important to become familiar with the components that were already in
place. The central component was the Weg CFW-11 IGBT inverter (Weg, 2008) and
familiarisation largely consisted of working systematically through the programming
manual to identify the relevant operational parameters that would need to be
manipulated. The detailed results of this work can be found in the Inverter
Communications section of the system specification document in Appendix K.
The other main pieces of equipment that were included in the investigation were the
turbine itself and the Weg SCIM generator whose datasheet can be found in
Appendix E. Turbine details were obtained from test documentation from the Unites
States National Renewable Energy Laboratory (NREL) relating to the Gaia Wind
turbine (NREL, 2009), and from various Gaia Wind publications (Gaia Wind, 2008,
2009, 2009b).
48
The familiarisation phase did not really have a defined end, since new and revised
information was identified throughout the development period.
3.7 Software development
The requirements for the system were reasonably clear from the outset, a first draft
of the system specification having been sent to Gaia Wind on 23rd June. The
development approach adopted was an agile one3 in which the features of the
system were prioritised so that less important details could be omitted if delays
occurred.
A further feature of agile development is the regular delivery of prototypes. Three
main prototypes were envisaged corresponding to the three main modules of the
system. The initial intention was to complete the inverter interface first, followed by
the turbine controller interface and then the HMI. This is shown in the project plan in
Appendix D. In fact, at the beginning of the development period, the plan had to be
changed because the hardware was in use for other purposes. Consequently, a topdown approach was taken and the HMI was addressed first, followed by the inverter
interface and the turbine controller interface.
In general, the development plan was successful, and a main prototype was
completed at the end of each of the three weeks.
Regular backups were taken throughout the development period.
Because of the agile approach, the system specification was continually updated
throughout the development period to reflect the evolving design. The final version
can be found in Appendix K.
3.8 System design
Conceptually, the software system consists of four main components as shown in
Figure 21. Two interfaces are provided, one to the VFD via the Weg inverter, and
another to the controller of the turbine under test. The operation of these pieces of
equipment are summarised in §4.1. The test management module concerns the
construction and operation of scripted tests, while the HMI provides the means for
3
See for example http://en.wikipedia.org/wiki/Agile_software_development
49
the user to control the VFD, to monitor the response of the turbine generator, and to
perform the summary calculations based on the information from both units.
Test
management
module
HMI
VFD
communications
module
VFD
Controller
communications
module
Gaia
turbine
Database
External files:
scripts and logs
Figure 21: High-level system design
The HMI allows the user to specify the speed of the VFD, which is theoretically the
same as the angular velocity of the generator rotor. Input can be specified directly, or
as part of a scripted series of speeds with associated durations.
Among other quantities, the VFD interface provides the following information about
the input to the WTE:
Angular velocity of the drive rotor
Electrical power
Drive torque
The controller reports the electrical power output from the turbine generator, and
given the appropriate version of the controller firmware, also report the angular
velocity of the generator rotor.
Based on the data from the two interfaces, the HMI provides calculated figures for
the generator slip and overall efficiency. Slip is calculated from the speed of the
generator and the network synchronous speed of 1000 rpm, while the efficiency
figure is based on the input power and output power reported by the inverter and
turbine controller respectively.
50
The company brief (Appendix B) specifies the ability to log operational data from a
test run to an external file. The inclusion of this feature makes the generation of test
data a simple process. The software automatically logs the following data to an Excel
file at a location specified by the user which can then be used in the evaluation as
explained in the next section:
Timestamp
Drive rpm
Drive power
Generator rpm
Generator power
Efficiency (%)
Slip (%)
The full software system specification can be found in Appendix K.
3.9 Evaluation of results
The correct operation of the software compared to the specification can be verified
through observation. As with any piece of software, it is to be expected that
unforeseen errors will be identified at various stages through the development and
after delivery. However, these are of less importance to the current project than the
physical operation of the WTE itself, and the accuracy of the information provided by
the HMI. The goals of the evaluation are therefore to answer the following questions:
Is the behaviour of the HUT comparable to that of a real installation?
Can the efficiency of the HUT be disaggregated from that of the other WTE
components?
What variation is evident in the performance of the WTE?
3.9.1 Comparison with real installation
In 2009 and 2010, NREL carried out a series of tests on the Gaia Wind turbine
according to the International Electrotechnical Commission (IEC) standards. The
reports are now published and constitute a reliable description of the operation of a
real turbine. The most relevant report is the result of the power performance test
(Huskey et al., 2009) which includes binned wind speed data with corresponding
51
instantaneous power and power coefficient. Unfortunately, there are significant
differences between the NREL installation and the WTE. The primary reason is that
the American distribution grid runs at 60 Hz while in Europe the grid frequency is 50
Hz. This means that the synchronous speed of a 6-pole SCIM is different, and
therefore a different model of generator is used in the American version. A further
consequence of the different rotational speeds is that a different gear ratio is
required.
Because the current version of the Gaia WTE does not include a turbine model, a
direct comparison with the NREL data is not possible; however, had the grid
frequency not been different, the torque-speed characteristics of the generators in
each case could have been compared to identify any divergences in behaviour.
Unfortunately, this exercise would have little validity given the differences in the two
cases. Using the NREL data for comparison was therefore abandoned; however, in
exploring ways of using that data, some interesting observations were made and
these are provided in Appendix H. No other dataset for the European version of the
turbine was available at the time of writing, and therefore a comparison with a real
installation was not feasible.
3.9.2 WTE efficiency
The HMI provides a calculated efficiency value η based on the relationship between
the power output by the generator and the power delivered by the VFD according to
Eq. 12.
(12)
Some power loss is associated with each energy conversion step in the WTE, which
means that the overall efficiency is the product of the individual efficiencies of the
components. This is expressed in Eq. 13.
(13)
52
where
ηd
ηdgb
ηggb
ηg
ηu
= drive efficiency
= drive gearbox efficiency
= generator gearbox efficiency
= generator efficiency
= factor for unknown losses
The datasheet for the SCIM (Appendix E) provides values for efficiency at different
percentage loads. Manually controlling the load to match the values provided
reduces the theoretical uncertainty in the value of the SCIM efficiencies, and any
remaining inefficiency can be attributed to the other components. Knowledge of the
losses attributable to the WTE setup itself can be useful in interpreting the
performance of the HUT.
The procedure for this test is to set the percentage load on the generator manually to
50%, 75% and 100% of rated using the power value from the turbine controller. The
WTE is run for 10s at each speed and the calculated efficiency values are logged
every second. The efficiency of the balance of system components (gearboxes, drive
and unknowns) is found by dividing by the quoted efficiency for the generator at
these standard loads.
3.9.3 Duration test
The variation in performance of the WTE can be assessed by collecting data over a
range of speeds and creating a box plot of each of the logged quantities. This will
provide a performance envelope that defines the accuracy of the values currently
displayed by the HMI.
For this test, the generator speed is raised just above synchronous speed and held
long enough for the turbine controller to close the grid connection. Thereafter, the
inverter reference speed is incremented by 1 rpm from 1005 to 1020 rpm. Each
speed setting is maintained for 30s and the speed reading from the turbine controller
is logged every second.
53
4 Results
This section summarises the output from the activities described in §3.4.
4.1 Hardware configuration
The sections below summarise the important characteristics of the individual
components of the WTE, and the overall construction.
4.1.1 Overview
The Gaia Wind turbine is a two-bladed, fixed pitch, fixed speed unit which is
designed according to the Danish model. Its principal design parameters are
summarised in Table 6. Where two values are given, the first corresponds to the
European version of the turbine which is designed to be connected to a 50Hz
distribution network, and the second refer to the American version designed for a
60Hz network.
Characteristic
Value
Rotor diameter
13 m
Rotor weight
200 kg
Hub height
18.3 m
Rated electrical power
11 kW
Rated wind speed
9.5 m/s
Start-up speed
2.5 m/s
Cut-in wind speed
3.5 m/s
Cut-out wind speed
25 m/s
Gear ratio
18:1 / 21.6:1
Table 6: Main characteristics of the Gaia Wind 11kW turbine (Gaia Wind, 2009)
The overall turbine design shown in Figure 22 is relatively simple and provides no
opportunity to alter the aerodynamic properties of the rotor via pitch control.
54
Nacelle: Houses
the turbine drive
train and speed
sensors
Wind
Rotor: Downwind
design provides
passive yaw control
Anemometer
Control box:
Houses controller
electronics and
voltage and current
sensors
Figure 22: Gaia Wind turbine structure (Gaia Wind, 2009b)
The WTE hardware is constructed from two turbine nacelles with the rotors removed
which are connected at the low speed shaft (LSS) as shown in Figure 23. The SCIM
of the nacelle on the left is treated as the HUT, and is connected to a standard Gaia
Wind controller. The SCIM of the second nacelle is used in motoring mode to drive
the HUT. It is fed by a variable frequency inverter and the two units together
constitute a variable frequency drive (VFD) as described in §2.2.6.
55
High speed
Gearbox
shaft
SCIM
Disc
generator
brake
Low speed
shaft
Driving nacelle
with cover closed
Inverter
Figure 23: Gaia Wind WTE hardware layout
The general structure is a pragmatic one that takes advantage of the availability of
standard equipment. However, the arrangement is not ideal since it includes energy
conversion steps which are not needed and which therefore constitute unnecessary
sources of power loss. In particular, the two gearboxes and low speed shaft shown in
Figure 24 could be eliminated.
Gearbox
High
speed
shaft
Grid
Generator
Gearbox
1
2
Low
speed
shaft
High
speed
shaft
Inverter
Grid
Drive
Figure 24: Schematic representation of Gaia Wind WTE
On the other hand, the structure has the advantage of being symmetrical. The
gearboxes are identical and so are the drive and generator. In theory therefore, the
losses should also be symmetrical, and if an overall value for system losses can be
56
determined, it can be divided equally between the two halves of the system. In
practice, the efficiency of a SCIM operating in generating mode may not be the same
as when it is operating in motoring mode, but the approximation may be reasonable
in this case.
A further advantage of the Gaia hardware arrangement is that it employs the actual
turbine hardware in the WTE. Previous work on WTEs (eg. Dolan et al., 2005) has
typically used scaled-down hardware which introduces further potential sources of
uncertainty into the results.
4.1.2 Instrumentation and control
As a fixed pitch machine, the Gaia Wind turbine relies on the aerodynamic
characteristics of the rotor to induce stall at higher wind speeds to prevent overgeneration. As an additional precaution however, the rotor are fitted with
aerodynamic brakes which deploy if other safety systems fail. If deployed, the tip
brakes need to be reset by an engineer. The downwind design provides passive yaw
control which eliminates the need for a yaw drive; however, that means that tower
shadow is significant.
Generator
speed
sensor
Brake sensor
(brake is shown
disconnected)
Rotor
speed
sensor
Figure 25: Gaia Wind nacelle detail
57
Vibration sensor
(hidden from view)
The turbine is equipped with speed sensors for both the rotor and the generator as
shown in Figure 25. A brake sensor and a vibration sensor provide information about
the state of the machine primarily for safety control. Not shown in Figure 25 but
visible in Figure 22 is an anemometer which is positioned upwind of the nacelle to
measure the instantaneous wind speed. Measurement equipment in the control box
whose interior is shown in Figure 26 provides instantaneous voltage and current
readings.
Controller
Operator
keypad
RS-232 port
Communications
unit for remote
monitoring
Current and
voltage
measurement
Soft
starter
Capacitor
bank
Figure 26: Gaia Wind control box detail
Under normal conditions, control of the turbine is provided by an IC1000 processor
unit supplied by Danish company Mita Teknik. The controller takes input from the
various sensors and generates control signals to the brake, grid connection relays
and soft starter. In particular, the controller is responsible for initiating the connection
to the grid when the wind speed rises above the cut-in speed of 3.5 m/s. At this time,
the controller briefly activates the soft starter which puts the SCIM into motoring
mode to ensure that the rotor is rotating faster than the network synchronous speed.
In the WTE, the HUT is connected to a standard controller, so all usual sensor
measurements are available with the exception of wind speed.
58
The controller unit offers an RS-232 output port for connection to a PC. The
instantaneous sensor readings can be polled using the proprietary M-NET protocol
whose structure is summarised in Appendix I. Two versions of the M-NET protocol
are in use. The older ―normal‖ version only provides wind speed and output power.
The newer ―extended‖ version however provides the following details:
Wind speed (m/s)
Rotor speed (rpm)
Generator speed (rpm)
Electrical output power (kW)
Cumulative energy production (kWh)
Status codes
4.1.3 SCIM
The squirrel cage induction machine (SCIM) that performs the function of generator
in the turbine and motor in the variable frequency drive (VFD) of the WTE is a Weg
Indústrias IE2 high efficiency unit whose datasheet can be found in Appendix E. The
slip values quoted on the datasheet are positive showing that the unit was designed
to operate in motoring mode. The question of whether its performance will be the
same when operating as a generator can only be settled by experimentation which is
outside the scope of this project.
For several of the machine characteristics, the datasheet provides three different
values corresponding to standard voltages in different contexts. The relevant voltage
in this situation is 400V, which means that where three values are shown, it is the
second which is relevant.
As a six-pole machine connected to the UK distribution network at 50Hz, the
synchronous speed of the generator will be 1000 rpm as explained in §2.2.6. The
slightly lower speeds shown on the datasheet take the slip into account under the
related load conditions.
The SCIM datasheet also provides values for power factor and efficiency at different
loads. However the rated power of the SCIM is chosen to match the rated power of
the wind turbine which is only achieved at the rated wind speed of 9.5 m/s. The
NREL duration test report shows that rated wind speed was achieved about 26% of
59
the time over a 9.5 month period at the NREL test facility in Boulder, Colorado
(Huskey et al., 2010). This is a fairly typical pattern which suggests that to replicate
such a wind regime the SCIM of a WTE would be working with a small load. Even in
this first stage project, the power input will be fairly low and drive efficiency is likely to
be around 88%.
As well as important information on electrical performance, the datasheet also
quotes a figure for the moment of inertia of the SCIM rotor which could be used in
Eq. 11 for controlling the delivered torque in the second stage project.
4.1.4 Inverter
Together with the SCIM, the second component of the VFD is the CFW-11 IGBT
inverter also manufactured by Weg Indústrias. The inverter is a wall-mounted device
with the general structure shown in Figure 27. As part of this project, an additional
RS-232 communications module had to be installed in the position labelled F in the
figure.
Figure 27: Weg inverter components (Weg, 2008)
60
The inverter, whose block diagram can be found in Appendix J, is built around a 32bit central processing unit (CPU) which provides considerable onboard processing
capability. The unit has 16 digital and two analogue sensor inputs, and offers the
facility to upload control programs to the internal memory which can be written in one
of the standard languages defined in the IEC 61131-3 standard including ladder logic
(Weg, 2007).
The discussion in §2.3.3 highlights the need for closed loop control, and this could
be provided using one of the digital input channels and the standard speed sensor
on the drive SCIM; however, this was not in place in the Gaia WTE. The control of
the VFD is discussed in §4.1.5 below in light of this limitation.
Constructing control programs using the Weg ladder logic authoring tool and
uploading them directly to the internal CPU would appear to be an obvious and
efficient approach; however, it would also have introduced difficulties in terms of the
integration of data from the HUT as well as making the development of the HMI more
complex. In addition, the company brief specifies Microsoft C# as the development
language. C# programs running on a PC have several theoretical drawbacks, such
as runtime interpretation of bytecode and communications and operating system
overheads. However, the additional overhead was not deemed significant for this
first stage project given a sufficiently powerful host PC and a dedicated
communications link.
The operation of the inverter is controlled by setting the values of around 900
operating parameters. The programming manual (Weg, 2010) describes their use
and range of values, but in summary, there are essentially three categories:
static parameters which need to be configured in order for the inverter to
perform in the particular hardware configuration, and whose values remain
constant
dynamic parameters which must be constantly monitored and adjusted by the
control program to achieve the required behaviour
read-only parameters that provide information about the state of the machine
Only some of the available parameters were relevant to this project, and much of the
early familiarisation was concerned with identifying them. The complete list can be
found in the software system specification in Appendix K, and Table 7 provides some
61
selected examples. It should be noted that the value of P0010 is the calculated
output from the VFD.
Parameter Description
Purpose
P0402
Motor rated speed
One of a set of static parameters used to
characterise the motor
P0312
Serial protocol
One of a set of static parameters used to configure
the serial communications channel
P0683
Serial speed ref
Dynamic parameter used to set the required drive
speed
P0100
Acceleration time
Dynamic parameter used to ramp the speed over a
period of time
P0010
Output power
Read-only parameter
Table 7: Example inverter parameters
4.1.5 VFD control
The CFW-11 unit offers four strategies for the control of a VFD the simplest of which
is known as V/f control. In this mode, the inverter maintains a constant ratio of
voltage to frequency. The developed torque is directly proportional to this ratio, and
therefore a steady torque is delivered over a wide range of motor speeds (Parekh,
2004). The resulting torque-speed characteristic, shown in Figure 28, is somewhat
different from that of the directly supplied induction machine in Figure 10. It is clear
from the figure that V/f control is not ideal for a WTE whose purpose is specifically to
control the developed torque to replicate a wind regime; however, V/f control is
appropriate when the requirement is to deliver a steady motor speed as in this first
stage project. Because of this requirement, the simplicity of V/f control and because
V/f control is the default strategy provided by the inverter, it was adopted for this
project. The Weg manual claims an accuracy of 1% of motor rated speed when the
inverter is used in V/f mode.
62
Figure 28: Torque-speed characteristic of VFD using V/f control (Parekh, 2004)
In addition to the V/f strategy, the CFW-11 provides vector control in which the motor
current is divided into two components using the Park transformation as described in
§2.2.7. In this mode the CFW-11 offers direct control over the developed torque.
Vector control can be used as an open loop configuration which relies solely on an
accurate description of the motor via the relevant parameter values. Weg quotes an
accuracy of 0.5% of rated speed in sensorless mode, whereas in a closed loop
configuration using feedback from a shaft encoder, accuracy increases to 0.01%.
The fourth control strategy, Voltage Vector Weg (VVW), offers a level of performance
which lies between V/f and sensorless vector control.
The second stage of the Gaia WTE development would require the use of vector
control to recreate the reference torque specified by the turbine model. At that stage,
the hardware configuration could also be improved by the addition of a shaft encoder
to provide feedback for closed loop vector control.
4.1.6 Summary
There are some features of the Gaia hardware configuration that are likely to
introduce inefficiencies into the WTE operation which will have to be compensated
63
for. This is a good motivation for attempting to quantify the overall efficiency of the
system in the evaluation. The theoretical or quoted efficiencies of the gearbox and
SCIM could provide a way of estimating the expected overall efficiency of the WTE.
4.2 Software application
The main product from this project is the software application which provides an HMI
for the WTE hardware. Its design is discussed in §3.8, and this section describes the
final version and discusses its limitations.
4.2.1 Overview
The design which was produced in advance of the on-site development period
proved to be appropriate with no changes being requested by the company. The
original plan for development needed to be changed because the WTE hardware
was not accessible during the first week. The approach adopted was therefore a topdown process which began with the HMI itself with the two communications modules
being developed later. While access to the hardware was restricted, communications
output was viewed in a console window. This allowed communication processes to
be developed step by step according to the design. As greater detail was included in
the communications, the structure of the messages shown in the console window
could be compared for example with the protocol definitions to ensure that they were
correctly formatted. This approach proved effective with very few alterations being
required once the system was connected to the hardware.
4.2.2 HMI and general system features
All of the main functions identified in the design were implemented within the threeweek development period. Those minor issues that were not completed are
described in §4.2.5 along with additional work that has been requested by the
company in order to make the current implementation effective.
At the highest level of description, the HMI provides two modes of operation. In the
automatic mode shown in the screen shot in Figure 29 the operator can define a
series of steps for the system to follow (labelled 1 in the figure). Apart from the
obligatory start and stop steps, each has a target speed and duration. The scripted
test can be run from the toolbar or the menu.
64
The HMI layout for manual mode is shown in Figure 30. This illustrates how the
operator may directly control the VFD by altering the speed setting directly (1). The
HMI has clearly-visible start and stop controls (2) to minimise error, and the
animated indicator and summary calculations are the same as in the automatic
mode.
1
2
5
3
4
6
7
Figure 29: HMI showing Auto tab and numerical feedback
The numbered features in Figure 29 are described in Table 8.
65
8
Label Description
1
The Auto tab allows the operator to specify a series of commands to the inverter
2
The toolbar allows the operator easy access to commands to run and stop a test,
for example, and to navigate from one stored test to the next. The screenshot in
Figure 29 shows that there are two tests currently stored in the internal database.
3
Output from the system is shown in one of three tabbed panels on the right. Figure
29 shows the panel which reports numerical values from the inverter and the
turbine. When the WTE is active, these values are updated automatically at a
polling period defined by the sampling period specified by the operator.
4
The operator can choose to log operational data to an external file in Microsoft
Excel format. Again, the rate is determined by the sampling period set by the
operator. The access to Excel files in achieved using the C# project ExcelPackage
(Tunnicliffe, 2007) which is protected under the GNU Public Licence4.
5
The HMI has a large animated indicator to show the state of the WTE hardware to
minimise the possibility of operator error. This section of the display also shows
summary calculations performed by the system.
6
The values of inverter parameters are displayed on the left of the feedback panel
7
Turbine controller values are displayed on the right of the feedback panel
8
A turbine reset button which was not in the original design was included on request
so that the operator can recover from error conditions such as rotor overspeed.
This duplicates the function described in the user guide (Gaia Wind, 2008).
Table 8: Notes on HMI layout
Figure 30 also shows one of the alternative feedback panels which gives a graphical
indication of the speed of both drive and generator (3). The third tab (not shown)
offers a similar display comparing drive and generator power. Drive power is
obtained from the inverter parameter P0010 which is the calculated power output of
the VFD – i.e. the power input to the WTE, and generator power is the measured
electrical power from the generator – i.e. overall output power. These values are the
basis for the calculation of system efficiency.
The graphical displays are achieved using an open source C# project (Zimmermann,
2009).
4
http://www.opensource.org/licenses/gpl-license.php
66
1
2
3
Figure 30: HMI showing Manual tab and graphical display
4.2.3 Resolved issues
The system requires a number of activities to be carried out simultaneously without
interfering with each other. A multi-threaded design is therefore implemented which
allows background tasks to be completed without preventing the user interacting with
the interface. During the development, the need for several concurrent threads
raised a number of timing issues, some of which were very time-consuming to
resolve. In most cases, the solution was to use .NET events5.
Access to the methods of one class from within another proved difficult to implement.
The eventual solution was to use the .NET delegate mechanism6.
In the initial design, the relationship between the different hardware elements was
not clear. During the development, a device class was introduced. The generic
features of a device could therefore be assembled in this class including the
association with a serial port. Both the inverter and the turbine were represented by
5
http://msdn.microsoft.com/en-us/library/awbftdfh.aspx
6
http://msdn.microsoft.com/en-us/library/ms173171.aspx
67
a subclass of device. The final class diagram is available in the system specification
in Appendix K.
4.2.4 Communications
Communications with the inverter use a subset of the industry standard Modbus
protocol7. The required message formats are described in the Weg serial
communications manual (Weg, 2010b). Messages are assembled by the application
as a series of bytes which are written to the serial port. Every message generates a
response which in the case of the status polling message is used to update the
feedback panel in the HMI.
The turbine controller uses the proprietary M-NET protocol from Mita Teknik (see
Appendix I). Messages are prepared in a similar way to those for the inverter. A main
difference between the two protocols is that M-NET has specific start and end
markers that encapsulate the entire message including the two bytes of cyclic
redundancy check (CRC).
The communications modules were based on existing applications developed by
Gaia Wind. These were largely re-worked but provided useful models. In particular,
they provided ready-made solutions to the CRC calculations for both protocols.
During the development of the communications modules, two tools in particular
proved useful. ModbusMat8 is a free application for managing and monitoring
Modbus communications, and Free Serial Port Monitor9 displays the detail of
outgoing and incoming messages over any serial port.
A major issue was discovered when trying to run the application with both inverter
and turbine connected. The issue was that the RS-232 communications to both the
inverter and the turbine controller were disrupted with the inverter running at low
speeds. The turbine communications were also disrupted with the inverter running at
higher speeds to the extent that status polling was ineffective. The problem was
assumed to be the result either of electromagnetic interference (EMI) produced by
7
http://www.modbus.org/specs.php
8
http://www.ataytugal.com/ModbusMat.htm
9
http://www.serial-port-monitor.com/index.html
68
the inverter or the existence of ground loops when both devices were connected to
the same PC. Both of these conditions are notoriously difficult to diagnose.
RS-232 is more susceptible to EMI than some other protocols because it relies on a
so-called single-ended signal. Binary 1s are represented by voltage peaks on a
single wire while zeros are represented by voltage troughs. Because the signal relies
on a single electrical channel, voltage spikes caused by EMI are easily mistaken for
signals. RS-485 on the other hand uses two wires for carrying a binary signal in
which 1s are represented by a high signal on one wire and a simultaneous low signal
on the second. Zeros are represented by the opposite signals on both wires. The
advantage of a differential signal is that an unintended voltage spike will occur
simultaneously on both wires, and will therefore be ignored.
A number of trial-and-error solutions were attempted by the Gaia Wind engineer to
rule out ground loops and improve the signal quality; however, none completely
resolved the issue. Table 9 summarises several alternative solutions that involved
the purchase of additional equipment which were therefore also considered.
In the end, opto-isolation and RS-232 over USB were both attempted. The USB
approach did not appear to make any difference despite its differential signalling.
Using an opto-isolator on the inverter serial cable however did appear to solve the
problem, but only when using a PC with a native serial port. When using an RS-232
to USB adapter, communications were improved but still not completely reliable. This
suggests that the problem was due to a ground loop or similar effect, but also that
the USB adapters might be part of the problem.
69
Solution
Notes
Opto-isolated
Using an opto-isolator would break the electrical circuit between the PC
RS-232
and the other equipment. This would guard against ground loops but
probably not EMI which may be inducing spikes in the cable directly
NMEA
Specifically designed for noisy environments, the National Marine
Electronics Association communication standard uses special
equipment which appears very robust, but is also very expensive.
RS232 over fibre
Rules out induced or conducted interference completely; however,
equipment is expensive.
RS232 current
Uses current pulses rather than voltage modulation to carry the signal
loop
and therefore less susceptible to spikes. Not as expensive as the
previous two options, but would require some work to make up the
required cables.
RS485
Very feasible in the long term for the inverter but would require a new
interface module which would increase the expense. Communications
with the turbine controller would require RS-232 to RS-485 adapters
RS-232 over STP
Shielded twisted pair (STP) cables are cheap and come with RJ-45
connectors, so this solution would also require the use of adapters on
both channels.
RS-232 over
Universal Serial Bus (USB) communications are the modern PC
USB
communications standard, and like RS-485 use a differential signal. The
original arrangement already made use of RS-232 to USB adapters to
connect the equipment to the PC. The solution in this case would simply
be to eliminate the standard serial cable by placing the adapter at the
equipment end of the connection rather than the PC end.
Table 9: Possible communications solutions
70
4.2.5 Residual issues
Very few items were originally planned but not implemented. One of these was the
facility for the operator to specify a standard directory in which to store logfiles.
However, the operating system stores the location last used in the Save File dialog,
and this is sufficient in most cases.
A further logfile item that was not implemented was the ability to open a logfile from
within the application. However, since the files are in Excel format, it is a simple
matter to open them using the standard operating system tools.
The help documentation for the system has not yet been implemented. This will be
completed for the company after the end of the academic project.
There is one known bug in the system which related to the graphical speed and
power displays. The open source project that has been used assumes that the
polling period is greater than 1s. If a smaller polling period is used, the x-axis labels
are incorrectly displayed. This is because the points to be labelled are identified
using the modulus function, and any fractional values are effectively rounded up.
Apart from the visual effect, the display and logging works correctly.
Issue logging and version control will be implemented following the end of the
academic project in order to identify and resolve any further bugs.
4.2.6 Evaluation
The software was developed over a very short period of time, and as usual with short
project only a minimum amount of time was available for testing. All of the major
functions have been shown to operate correctly; however, a comprehensive
examination of all possible error conditions has not been carried out. It is to be
expected therefore that there will be unhandled exceptions from time to time when
the software is in use. The company will log any such errors for fixing later.
The current class hierarchy was developed in an incremental way, and it does not
therefore capture as accurate a representation of the hardware as possible. The
inverter and turbine were identified as subclasses of a generic serial device;
however, the same was not achieved for the two protocols used in the application.
Ideally, a generic protocol class should be constructed with Modbus and M-NET as
subclasses. This would also be an opportunity to accommodate the protocol
71
message and response variables as properties of the protocol class. Currently, these
are simply program variables declared within the inverter or turbine classes.
The selection of Microsoft C# was made for practical reasons of maintainability.
Although this is acceptable for this first stage project, the additional overheads
incurred by running a C# application on a PC might be significant when trying to
replicate a wind regime accurately. It would be useful at some future date to
compare the performance of this application with an equivalent written in ladder logic
and uploaded directly to the onboard programmable logic controller (PLC) of the
inverter. Such a solution might still require the creation of an external HMI, however.
An intermediate solution might recreate the current application in a compiled
language rather than one which relies on runtime interpretation of bytecode.
A further alternative design would be to make use of the customisation features of
Microsoft Excel. Because Excel already has a very robust user interface and
provides for easy input, output and manipulation of data, the features of the current
development could be added as part of an Excel-based application written in C#.
This would retain the maintainability of the software, but would simplify the interface
and eliminate the requirement for writing external Excel log files.
4.3 Test results
Although the evaluation tests had been fully specified, a number of problems have
prevented their completion:
Serial communications issues absorbed a great deal of the available time
The need for a PC with a native serial port rather than the author‘s laptop
meant taking that PC away from its normal use
There were competing priorities regarding the use of the WTE hardware
during the latter stages of the project
Access to a turbine controller with the extended version of the M-NET protocol
was difficult to arrange
An error in the logging feature of the software system meant that the first tests
did not provide adequate data
The Gaia engineer was unable to help with running tests in the last few days
before the deadline
72
At the time of writing, a number of errors in the logging function of the software have
been resolved and an updated version of the software has been sent to Gaia Wind
on 22nd August. However, it has not been possible to run any tests since that time,
and Appendix L contains email communications between the author and the Gaia
engineer regarding the logging function. To illustrate the issues with the earlier
version, Table 10 shows an extract of actual data logged by the system during a test
attempt run by the Gaia engineer on 18th August. The four main problems are briefly
discussed below.
Timestamp
Drive
RPM
Drive
Generator
power (kW) RPM
Generator
Efficiency
power (kW) (%)
Slip (%)
18/08/2011 11:17:08
1005
100.5
1003
65.436
65
100
18/08/2011 11:17:09
1005
100.5
1003
65.436
65
100
18/08/2011 11:17:10
1005
100.5
1005
0
0
100
18/08/2011 11:17:11
1005
100.5
1005
65.436
65
100
18/08/2011 11:17:12
1005
100.5
1005
0
0
100
18/08/2011 11:17:13
1005
100.5
1003
0
0
100
18/08/2011 11:17:13
1005
100.5
1003
0
0
100
18/08/2011 11:17:15
1005
100.5
1003
0.1
0
100
18/08/2011 11:17:15
1005
100.5
1003
0.2
0
100
18/08/2011 11:17:16
1005
100.5
1003
0.3
0
100
18/08/2011 11:17:18
1005
100.5
1003
0.3
0
100
Table 10: Logged data with errors
Incorrect drive power logged
For each row in Table 10, the value in the Drive power column is the value for Drive
RPM divided by ten. The cause of this is a simple error in which the wrong inverter
parameter was used. The reason for the division by ten is that all inverter values are
supplied as integers even if the actual value has decimal places. The stored value
therefore needs to be divided by the appropriate factor to give the actual value.
Negative generator power values incorrectly logged
Several values in the Generator power column in Table 10 are large positive
numbers where small negative values are expected. Negative numbers are typically
73
represented at a low level in two‘s complement format10. A conversion using 4-byte
two‘s complement has been implemented, but further test results would be required
to ensure that the problem is resolved.
Error in efficiency calculation
In resolving the more obvious problems, an error in the efficiency calculation was
discovered. The software inserts an Excel formula into the Efficiency column in the
log rather than a simple numerical value. It was found that the Excel ROUND( )
function was applied at the wrong point leading to all decimal places being lost.
Error in the slip calculation
The slip calculation used at the point that this data was logged was that supplied in
the original company brief. In fact, that calculation incorrectly used the drive angular
velocity rather than the synchronous speed to calculate generator slip. This issue
was raised with the Gaia engineer who agreed the correction.
10
http://en.wikipedia.org/wiki/Two's_complement
74
5 Forward plan
This project was intended as the first stage of a longer development. Those aspects
of the fully featured WTE which were not included here naturally provide the basis for
further work. In addition, the practical work of this project has revealed the potential
of the hardware components and the limitations of the present approach. This
section presents a series of potential projects that could follow on from the work
done here.
5.1 Limitations of current implementation
As agreed with the company during the scoping of the current project, the main
limitation is the absence of a turbine model. This means that the range of tests and
simulations is limited to those involving a steady generator speed reference. This is
adequate for benchmark testing but not for anything more realistic. In particular, it is
not possible to match behaviour of the WTE with wind speeds.
The current software implementation uses the V/f control mode of the inverter. This
does not allow direct control over the generated torque which would be a necessary
step on the way to a fully featured WTE.
The current hardware does not support closed loop control of the VFD. Although the
inverter manual suggests that sensorless vector control provides speed control
precision of 0.5% or rated speed, it does not make any claims about the precision of
torque control. Adding a shaft encoder to the drive would theoretically increase
speed control precision to 0.01% of rated speed, and is recommended for dynamic
performance and torque control (Weg, 2010).
The behaviour of the SCIM used as both motor and generator in the American
version of the turbine does not seem to correspond to that expected on the basis of
its datasheet (Appendix F) judging by the examination of the NREL data (Appendix
G). Independent testing of the unit in the WTE would help to determine its operating
characteristics with greater reliability. Direct measurement of the resistance and
reactance of the stator windings using standard tests would verify the value provided
on the datasheet, and also allow the direct calculation of generated torque.
The absence of appropriate comparator data makes the verification of the
measurements from the WTE impossible at this stage. Logged data from a European
75
version of the turbine would be sufficient, but data from controlled tests would
provide a more reliable benchmark.
5.2 Alternative implementations
One category of possible future project explores the possibilities offered by using
different platforms and development tools. C# was used as a development tool on
request; however, §4.2.6 outlines other ways in which the same functionality might
have been delivered. Alternative implementations would allow direct comparisons
between different toolsets with respect to efficiency of operation and ease of use and
maintenance. Some possibilities are discussed below.
5.2.1 Excel
Rebuilding the current project as an extension to Microsoft Excel using either C# or
Visual Basic would require less new work to develop the user interface and would
also perhaps be easier to use due to the users‘ familiarity with Excel. With less code
devoted to the user interface, maintenance may also be easier.
5.2.2 Weg Ladder Programming
Although a lower level programming environment, WLP may offer greater efficiencies
due to its independence from an operating system. In a second stage project aimed
at providing closed loop torque control, it is likely that ready-made components
would be available for implementing proportional, integral and derivative control.
5.2.3 Real-time operating systems
Some previous studies such as Munteanu et al. (2010) have mentioned the use of
real-time operating systems for the efficient processing of signals to and from the
WTE hardware. Although no further details are provided, this is probably a reference
to a Unix variant that is optimised for real-time processing. An equivalent
development could be produced using Ubuntu11 for example, with the interface code
built in Java. The likelihood of this approach delivering a more efficient overall
system is not as strong given that Munteanu was using a DC drive which requires
simpler control. The use of a SCIM and VFD may well deliver equivalent
11
https://wiki.ubuntu.com/RealTime
76
performance and control; however, the Java/Ubuntu alternative would provide the
opportunity to verify this.
5.2.4 MATLAB
The majority of previous WTE studies make use of the MATLAB12 development
environment. Specifically designed for scientific computing application, MATLAB
provides many features for developing algorithms, for performing numerical
computations efficiently and for visualising data. MATLAB would provide similar
benefits to using Excel in that less effort would be required to develop the HMI. In
addition, MATLAB is specially designed to accommodate sensor input.
5.2.5 Increased instrumentation
The use of a shaft encoder on the VFD has already been mentioned in the context of
closed-loop control. Other sensors could be added to the WTE hardware to provide
verification of the inverter and turbine controller feedback. A torque transducer on the
turbine-side high speed shaft for example would provide a direct measurement of the
developed torque. Crabtree (2011) and Hus Wen-Ko (2010) describe the use of
different type of sensor for the detection of various kinds of fault condition. The
scope of the WTE could easily be expanded in this way to support different kinds of
test.
5.3 Inclusion of turbine model
The turbine model has been researched as part of this project, and its
implementation is the obvious next stage of the WTE development. However, there
are several identifiable steps towards this goal.
5.3.1 Vector control
Taking advantage of the facilities provided by the Weg inverter, the type of control
could be changed from V/f to sensorless vector without altering the overall
functionality of the current software. This would require a similar range of activities to
the current project, and would provide the basis for moving forward.
12
http://www.mathworks.com/products/matlab/
77
5.3.2 Steady torque control
Replicating the torque produced by a turbine rotor entails direct control over the
torque developed by the VFD. Allowing the user to provide target torque values via
the HMI is not particularly intuitive, however. Instead, this step would require a
minimal turbine model which would provide a reference torque value based on a
wind speed value. In the first instance, the WTE would allow steady state operation
with respect to a particular wind speed input, and transition between states in the
same way that the current application does for speed inputs.
5.3.3 Variable torque control
This advanced version of the system would implement a full turbine model including
torque oscillation. It would also allow the user to provide input in the form of a
variable wind speed reference, either from a wind signal generator like those
described by Diop et al. (2007), or from logged data. The implementation would
require the use of standard control techniques such as proportion-integral (PI)
control as used by Fleming et al. (2009) or proportional-integral-derivative (PID)
control as used by Monfared et al. (2007).
5.3.4 Advanced control investigation
Once the WTE is capable of replicating a variable wind profile, the development
focus could change to examine the control algorithms themselves. A question for a
project at this level would be whether the standard control algorithms are sufficiently
dynamic to replicate the profile accurately. One of the characteristics of a realistic
wind profile is that there is a significant stochastic element. Control algorithms
designed to track a steady reference are not necessarily best suited to such a signal,
and work would focus on more experimental control approaches.
5.4 Laboratory-based simulation
A further category of further projects involves the construction of tools to aid the
development process itself. At present, access to the hardware configuration at the
Gaia Wind premises is essential for any further development. This bottleneck could
be eased by the development of simulations of the major hardware components.
78
5.4.1 Weg inverter simulation
The current application defines a limited interface with the CFW-11 inverter through
the manipulation of a subset of its available parameters. The behaviour of the unit
could however be simulated using some of the same methods as in the current
project. This would make it possible to develop the WTE software further in the
laboratory with field testing on the Gaia hardware at a later stage. An inverter
simulation could take the form of a C# application on a separate PC replicating the
appropriate subset of inverter behaviour over a serial communications link.
5.4.2 Other simulations
Gaia Wind is currently investigating the use of a GenDrive13 back-to-back inverter to
decouple the turbine generator from the distribution network in a departure from the
Danish model. A future simulated version of the inverter would allow parallel
development of the turbine control system. This raises the possibility of developing a
library of equipment simulations along the lines described in §5.4.1 each of which
could be the subject of a short project.
13
http://www.gendrive.co.uk/
79
6 Conclusions
6.1 Comparison with aims and objectives
The overall aim of this project was achieved in full, with the inclusion of all the major
functions in the software system that was developed. It was also possible to
introduce a few unplanned features such as the possibility of resetting the turbine
controller via the HMI.
It quickly became clear during initial discussions with the company that there would
not be sufficient time or resources available to complete the development of a fullyfeatured WTE in one stage. The scope of the project was therefore set at a lower
level, and this decision has been shown to be appropriate. The current system
addresses the immediate needs of the company for a simple interface for performing
benchmark testing on new turbines before shipping. However, it does not include the
more involved modelling of turbine behaviour seen in the previous studies reviewed
in §2.3. Neither does it fully exploit the control capabilities of the CFW-11 inverter,
and in hindsight it would probably have been possible to use sensorless vector
control rather than the much simpler V/f approach from the outset. This only became
clear during the project, however, and to change the approach mid-way would have
introduced a much greater degree of complexity. This would have put the overall
completion of the project within the agreed timescale at risk.
6.1.1 Review of current relevant literature
A substantial range of previous WTE studies was identified during the literature
review, and a consistent picture of WTE requirements duly emerged. An early focus
on WTE studies also identified the relevant aspects of turbine design which set the
content requirements of the rest of Chapter 2. From several points of view, therefore,
the literature review has been successfully delivered.
There are two main ways in which the literature review could be improved from its
current version. Firstly, a more consistent treatment of the central theme of the
replacement of turbine rotor torque by a simulated prime mover would improve the
focus. Currently, these issues are discussed, but not tied together as well as they
could be.
80
The second improvement that could be made would be to draw the relevant
equations together into a single consistent formula for WTE control. Eq. 3 and Eq. 11
form the basis of such a model, but the final combination was not presented. This
could be done relatively easily, but would require more time that is available to the
academic project. On the other hand, since the current development does not
include a turbine model, such a synthesis can legitimately be left to the follow-up
development.
6.1.2 Hardware investigation
The capabilities of the hardware components of the Gaia Wind WTE were
successfully characterised, as demonstrated by the operation of the software. This
investigation was necessarily pragmatic in that it focussed on the requirements of
this particular project, rather than aiming to extract an optimum configuration. Such
an approach might for example have led to the use of sensoreless vector control
rather than V/f control, but would have taken longer. In terms of the current project
aim, this objective is successfully delivered, and has also revealed useful directions
in which the WTE can be developed in the future.
6.1.3 Software development
The delivered software performs according to the initial requirements, and can
therefore be considered successful. A major problem late on in the development was
the disruption of the RS-232 communication signals that prevented a full evaluation
of the results. This was partly the result of a lack of access to the WTE hardware in
the first week of development which led to a review of the schedule. Had the original
schedule been adhered to, the inverter communications module would have been
tackled in the first week. This would probably have led to the discovery of the
communications issues earlier, and this might have made a solution possible in time
to carry out the evaluations fully. This is speculation, however, since efforts to
resolve the communications problems might have reduced the time spent on other
features.
6.1.4 Evaluation of the project outcomes
As alluded to in the previous section, the evaluation of the project outcomes is the
weakest part of the project since time and other resources were very short towards
81
the end of the project period. Apart from the incorrect recording of values in the log
file, the software has been shown to work correctly according to the specification and
a procedure for reporting and resolving future problems has been established with
the company.
A good deal of subjective evaluation of the work of the project has been presented at
various stages of the report. The objective of evaluation of results can therefore be
considered partially successful.
6.1.5 Definition of programme of future work
§0 sets out three types of project that could follow from this one, with several
examples under each heading. Clearly the most important of these is to continue the
development to the planned second stage with the inclusion of a turbine model. Even
this, however, can be broken down into smaller steps providing the basis for a
number of development projects.
The other two categories of project involve the development of comparable systems
using other platforms and tools, and the development of facilities to support the
future developments themselves.
6.2 Personal reflection
To attempt an MSc dissertation project of this type over a single semester was an
ambitious undertaking, even given the reduced scope of this initial project. There
were many unknowns at the outset which included not only the details of the turbine
subsystems, but also the .NET development environment. The knowledge gaps were
largely filled simply by putting in long hours, but this approach has been reasonably
successful.
Setting the scope of the project to its current definition was a deciding factor in the
success of the project, and the author was guided strongly in this by the Gaia Wind
engineer. The immediate requirements of the company were relatively
straightforward and at the basic level constituted a fairly standard software
development project. Some of the material covered in the literature review is not
directly relevant to this, and from that point of view less effort could have been
expended in that area. However, a deep investigation into previous WTE work has
82
eventually delivered a much richer background to the current project. This is valuable
not only to the author personally, but also to potential follow-up projects.
There was an element of risk involved with the chosen project selection process
which was dependent on receiving replies for the companies that were approached.
A back-up plan was prepared, however, which meant that the risk was adequately
managed. Ideally, the project should have started earlier than it actually did, but the
negotiation with possible partner organisations took longer than expected. This was
another factor that contributed to the intensity required during the development
period. With this one drawback, the approach was very successful, and has led to
the establishment of contacts with a series of companies that may lead to other
student projects in the future.
The weakest part of the project is the evaluation which had to be curtailed for a
number of reasons. The author struggled for some time to formulate a reasonable
evaluation method for the project. Part of the reason for this was the simple nature of
the software: because the turbine model had been excluded, there appeared to be
insufficient grounds for comparing performance of the WTE with any other
installation.
The design of the software makes use of object-oriented principles, but this was not
previously the author‘s primary area of expertise. A number of technical lessons
were learned along the way, and the final result is less than perfect. Some
generalisations such as the relationship between the two communications protocols
were not identified until late on in the development and were therefore not captured.
There was also a reliance on simple software applications previously developed at
Gaia Wind which were not based on object-orientation. This has led to some
inconsistencies in the construction of the software that might cause some initial
confusion for future developers working with the current code. The current version
performs adequately, however, and the experience has provided insights into many
aspects of object-oriented development and the use of the .NET framework.
83
Appendix A: Email to potential partners
Dear XXXXXX
I hope you don't mind me contacting you out of the blue, but you are listed as the
main contact for XXXXXXX on the Scottish Renewables Web site.
I am a member of the teaching staff in the School of Computing at Edinburgh Napier
University, but also over the last two years I have been doing a Masters degree in
Energy and Environmental Engineering. My intention is to complete the MSc
dissertation over the summer, and I am looking for an external partner organisation
with a practical requirement that could form the basis of a project. My main interest is
in the control and instrumentation of renewable energy devices, but I would also be
interested to discuss other possibilities. I have attached my CV for reference, and I
would be grateful if you could forward this message to the appropriate person in the
company.
Thanks very much
Brian Davison
Programme Leader,
BSc Information Technology
Edinburgh Napier University
0131 455 2373
84
Appendix B: Initial company brief
(extracted from an email from the Gaia Wind engineer)
Project has been reduced to just providing a Piece of Software to Control the Test
bed.
You would plan to be here from 27th June for three continuous weeks. With regards
to the project, I‘d like you to use C# Express to develop the application for a these
reasons, it‘ll make it easier for me to work with the project later, I already have some
Modbus and some Gaia Comms code written which hopefully will give you a head
start. It will also mean I should be able to help more plus I have books etc which
might be useful.
I‘d like to break the project down into a few separate outcomes, which we should aim
to complete consecutively, so that if the time line slips we at least have the early stuff
complete.
Stage1: Inverter Control Module
Modbus Code Module to Start Motor, Stop Motor, Set Acceleration, Set
Deceleration, set Speed. It should be able to read Motor Power and RPM. Plus a
basic Test Application.
Stage2: Gaia Query Module
Module to Get the Power Data from the controller. Our current version of control
firmware has Wind, Power, Energy and errors available. The firmware in
development also has Generator and Rotor RPMs. I already a small application in
C#, though it might need a little tidying up.
Stage 3: Overall Application
User Interface to Display Live... Drive Motor Speed and Power, Generator Speed (If
available) and power. There should be two ‗modes‘ Manual mode and Auto Mode
In Manual Mode you can set Speed, Acceleration, Deceleration and Start/Stop the
Inverter.
85
In Auto Mode, there should be a start button that runs a script. Script should be text
based so it can be edited easily (XML perhaps?) but each entry should be
something like this.
[bool Run][Acc Value][Decc Value][Speed][Time]
Example1
Start, Accelerate over 10 seconds, Decelerate don‘t care, Speed = 1000, 60
seconds. The time wouldn‘t start counting down until actual speed = set speed.
[1][10][10][1000][60]
Example2
Bring the Motor to a stop over 10 seconds, Time = 0
[0][10][10][0][0]
Example3 – Test Run
[1][10][10][1000][60] // Enable Drive Accelerate up to 1000 rpm over 10s then spend
60 seconds at speed
[1][2][10][1010][60] // Enable Drive Accelerate up to 1010 rpm over 2s then spend 60
seconds at speed
[1][5][10][1050][60] // Enable Drive Accelerate up to 1050 rpm over 5s then spend 60
seconds at speed
[0][10][10][0][0] // Stop the drive and disable decelerate to zero over 10 seconds
You should also be able to set a sample period from 1-300s. This can be part of the
script or part of the UI. Every time this period elapses a data entry should be made in
an XL or Tab delimited file:
Time
8/5/2011
Drive
Drive
Gen
Gen
RPM
kW
Rpm
kW
1020
6.5
1010
5.5
8:45
86
Efficiency %
Slip %
(5.5/6.5)*100 (1010/1020)*100
Appendix C: Project proposals
Gaia Wind proposal version 1
Student
Name
Title
Summary
of work to
be
undertaken
during
project
Deliverables
Brian Davison
Matriculation
Number
02014147
Simulation of wind regime and wind turbine response in a physical test rig
The Gaia Wind 11kW is a two-blade, fixed pitch, fixed speed turbine for small
applications. Gaia Wind Ltd. is currently developing a test rig which consists of
two turbines without rotors connected so that one can be used as a motor to
drive the other. The turbine acting as a motor is fed by a Weg CFW-11 inverter
which has the facility for programmatic control. The ultimate goal is to be able to
provide a file of logged wind data, and for the inverter to accurately recreate the
wind forces via the motor so that the behaviour of the passive turbine can be
observed. The main challenges are therefore
a) To produce an accurate model of real turbine behaviour which reflects
the response lag due to inertia in the rotor
b) To construct a control program for the Weg inverter which implements
the model and also compensates for losses in the test rig itself
c) To evaluate the results of the control algorithm against the original logged
wind and turbine data
The first part of the project will be to produce a review of current literature on
turbine testing and wind regime modelling.
The practical phase of the project will include the following activities
a) Collection of wind and turbine data from at least one site
b) Familiarisation with the Weg inverter and the selection of appropriate
control methods.
c) Analysis of the wind and turbine data to identify the nature of the turbine
response to changes in wind speed and direction
d) Implementation of the derived model in software for control of the
inverter
e) Iterative refinement of the program to compensate for physical losses and
inertia in the test rig
The evaluation phase will involve the correlation of the original logged turbine
data with that observed in the test rig to determine the effectiveness of the
model and the software implementation.
Consider the academic challenges that you will face and what solutions you
proposed to deliver as part of the project and consider what will make the project
a success. There should be no more than 5.
[N.B. Approved deliverables will be compared with your final report.]
1.
2.
3.
4.
Literature review
Mathematical model of turbine behaviour
Inverter control software
Evaluation of results
87
Resources
required
a) Physical test rig at Gaia Wind Ltd. facility in Glasgow
b) Wind and turbine data – to be collected from a live site. Some data may
also already be available
c) Appropriate software for Weg inverter programming – available from
Weg
Proposed
Supervisor
Tom Grassie
Gaia Wind project version 2
Student
Name
Title
Summary
of work to
be
undertaken
during
project
Brian Davison
Matriculation 02014147
Number
Development of basic control system for a wind turbine emulator
The Gaia Wind 11kW is a two-blade, fixed pitch, fixed speed turbine for small
applications. Gaia Wind Ltd. is currently developing a test rig which consists of
two turbines nacelles connected hub to hub so that one can be used as a motor to
drive the other. The motor element is fed by a Weg CFW-11 inverter which has
the facility for programmatic control. The ultimate goal is to be able to read a file
of logged wind data, and for the inverter to accurately recreate the equivalent
forces via the motor so that the behaviour of the passive turbine can be observed.
This project will be concerned with the initial stage of the development, which is
to develop a basic control system for the inverter. This will allow the user to
specify a sequence of steady state inputs to be fed to the motor and the duration
of each state so that response of the turbine under test can be observed. Data
from the onboard turbine controller will be used to provide process feedback.
Based on this initial development, a plan for further improvements to the control
algorithms can be constructed.
The main challenges are therefore
a) To identify the capabilities of the available hardware components
b) To design and develop appropriate communications interfaces between
the hardware components and a master PC application
c) To identify and measure appropriate variables for analysis and control
d) To ensure that the basic system takes into account the longer-term goals
of the development
The first part of the project will be to produce a review of current literature on
turbine testing and test rig instrumentation and control.
The practical phase of the project will include the following activities
a) Familiarisation with the hardware components and the selection of
appropriate technologies for communications and control.
b) Development of appropriate communications and human-machine
interfaces
c) Evaluation of the basic control system and the identification of promising
options for further development.
88
Deliverables
1.
2.
3.
4.
5.
Resources
required
a) Physical test rig at Gaia Wind Ltd. facility in Glasgow
b) Documentation for hardware components – available from manufacturers
c) Interface hardware to be supplied by Gaia Wind
Proposed
Supervisor
Literature review
Specification of initial control system
Communication and control software and documentation
Evaluation of results
Forward plan for development
Tom Grassie
Contingency proposal
Student
Name
Title
Summary
of work to
be
undertaken
during
project
Deliverables
Brian Davison
Matriculation
Number
Reactive control of a micro wind turbine
02014147
Micro wind turbines are typically located in urban environments where local
turbulence interferes considerably with their efficient operation. Turbulence
effects occur over a small time scale, and to compensate for them a control
approach would need to react to rapidly changing conditions. This contrasts with
more stable environments in which control strategies are geared to achieving and
maintaining a steady state in relation to a given set point.
This project would investigate the range of available data that could be used to
drive a reactive control strategy, and would use a programmable logic controller
(PLC) to provide yaw control via a brake on the turbine mount. Evaluation would
be carried out by comparing the output from the turbine with and without active
control under similar wind conditions.
Consider the academic challenges that you will face and what solutions you
proposed to deliver as part of the project and consider what will make the project
a success. There should be no more than 5.
[N.B. Approved deliverables will be compared with your final report.]
1. Literature review
2. Model of the relationship between selected parameters and brake
activation
3. Hardware solution including sensor, PLC and brake
4. PLC control program
5. Final evaluation of results
Resources
required
Proposed
Supervisor
a) Access to micro wind turbine at Edinburgh Napier
b) Hardware components (sensor, wiring, PLC, brake, etc)
c) PLC programming software
Tom Grassie
89
Appendix D: Project plan
90
Appendix E: Weg 50Hz SCIM datasheet
91
Appendix F: Weg 60Hz SCIM datasheet
92
Appendix G: NREL data
Wind
speed
Power/kW Cp
Ω/rpm
Ω/rad/s ΩHSS/rad/s ΩHSS/rpm λ
CQ
0.49
-0.08
-8.43
1.03
-0.08
-0.93
1.52
-0.08
-0.29
2.01
-0.08
-0.12
2.5
-0.08
-0.07
3
-0.10
-0.04
3.49
-0.11
-0.03
55.55
5.82
125.65 1199.88
10.83
3.99
0.31
0.06
55.57
5.82
125.70 1200.38
9.48
4.49
1.15
0.16
55.60
5.82
125.76 1200.89
8.43
4.99
2.28
0.23
55.62
5.82
125.81 1201.39
7.59
5.49
3.67
0.27
55.64
5.83
125.86 1201.90
6.90
5.99
5.00
0.29
55.67
5.83
125.92 1202.40
6.33
6.49
6.27
0.28
55.69
5.83
125.97 1202.90
5.84
7
7.57
0.27
55.71
5.83
126.02 1203.41
5.42
7.49
8.70
0.25
55.74
5.84
126.07 1203.91
5.07
7.99
9.80
0.24
55.76
5.84
126.13 1204.42
4.75
8.49
10.77
0.22
55.78
5.84
126.18 1204.92
4.47
9
11.67
0.20
55.81
5.84
126.23 1205.42
4.22
9.5
12.36
0.18
55.83
5.85
126.28 1205.93
4.00
10
13.12
0.16
55.89
5.85
126.41 1207.13
3.80
10.49
13.69
0.15
55.94
5.86
126.54 1208.33
3.63
11
14.15
0.13
56.00
5.86
126.66 1209.54
3.47
11.49
14.59
0.12
56.05
5.87
126.79 1210.74
3.32
12
14.80
0.11
56.11
5.88
126.91 1211.95
3.18
12.49
14.90
0.09
56.16
5.88
127.04 1213.15
3.06
13
15.00
0.08
56.22
5.89
127.17 1214.35
2.94
13.49
14.93
0.07
56.28
5.89
127.29 1215.56
2.84
13.99
14.80
0.07
56.33
5.90
127.42 1216.76
2.74
14.48
14.60
0.06
56.39
5.90
127.54 1217.96
2.65
15
14.40
0.05
56.44
5.91
127.67 1219.17
2.56
15.48
14.49
0.05
56.50
5.92
127.80 1220.37
2.48
16.03
14.42
0.04
56.55
5.92
127.92 1221.57
2.40
16.5
14.15
0.04
56.61
5.93
128.05 1222.78
2.34
16.99
14.24
0.04
56.67
5.93
128.17 1223.98
2.27
17.5
14.13
0.03
56.72
5.94
128.30 1225.18
2.21
17.99
14.08
0.03
56.78
5.95
128.43 1226.39
2.15
18.48
13.91
0.03
56.83
5.95
128.55 1227.59
2.09
18.99
14.00
0.03
56.89
5.96
128.68 1228.79
2.04
19.45
14.11
0.02
56.94
5.96
128.80 1230.00
1.99
19.92
13.74
0.02
57.00
5.97
128.93 1231.20
1.95
93
Q
0.00
0.01
0.02
0.03
0.04
0.05
0.05
0.05
0.05
0.05
0.05
0.05
0.04
0.04
0.04
0.04
0.04
0.03
0.03
0.03
0.02
0.03
0.02
0.02
0.02
0.02
0.02
0.02
0.01
0.01
0.01
0.01
0.01
0.01
0.88
-2.47
-9.14
-18.12
-29.16
-39.71
-49.77
-60.07
-69.01
-77.70
-85.35
-92.45
-97.87
-103.79
-108.19
-111.71
-115.07
-116.61
-117.29
-117.96
-117.29
-116.15
-114.47
-112.79
-113.38
-112.72
-110.50
-111.10
-110.13
-109.63
-108.20
-108.80
-109.55
-106.57
Appendix H: NREL analysis
In 2009 and 2010, NREL carried out a series of tests on the Gaia Wind turbine
according to the International Electrotechnical Commission (IEC) standards. The
reports are now published and constitute a reliable description of the operation of a
real turbine. The most relevant report is the result of the power performance test
(Huskey et al., 2009) which includes binned wind speed data with corresponding
instantaneous power and power coefficient as shown in Appendix G. Combining this
information with the published turbine details (Gaia Wind, 2009 a number of other
measures can be derived including angular velocity of the high speed shaft and load
torque. However, there are two main limitations with this approach:
Because the current project does not include a turbine model, the overall
performance of the two cases cannot be directly compared
The American grid operates at 60 Hz, and therefore a different gear ratio and
model of generator are used
Ideally, the torque-speed characteristics of the two generators could be compared to
identify any major differences in behaviour. Because the grid frequencies are
different however, the synchronous speed will be different in each case, and two
completely different models of generator have to be used. The significant divergence
between the two cases means that a direct comparison will have little validity. A
closer examination of the NREL data does however reveal some interesting aspects.
The NREL dataset provides power output and a power coefficient value for a range
of wind speeds from 0.49 m/s to 19.92 m/s at intervals of roughly 0.5 m/s. The
starting point for a meaningful comparison would be to generate a dataset from the
WTE for this same wind speed range. Because the WTE does not yet include a
turbine model, this cannot be done directly, and the corresponding high-speed shaft
angular velocity must first be derived for each data point in the NREL data. Thus the
comparison would be limited to the performance of the generators.
A speed for the high speed shaft can be derived from the rotor speed. Three NREL
reports provide a range for the rotational speed for the turbine rotor; unfortunately
they are not consistent. The power performance report (Huskey et al., 2009) quotes
56-62 rpm, the generator duration test report (Huskey et al., 2010) quotes 0-62 rpm,
and the generator function and safety test report (Huskey et al., 2010b) quotes 60-62
94
rpm. The reasons for this discrepancy are not explained, which is puzzling given the
continuity of the testing team for the three reports. However, it is possible to argue
away some of the differences. The duration test aims to assess among other things
material degradation over time and the dynamic behaviour of the turbine (Huskey et
al., 2010, p. 1). It may therefore be important to consider the starting and stopping of
the turbine as a potential source of fatigue, and hence the inclusion of low rotor
speeds in the range 0-56 rpm. The power performance test, on the other hand, is
concerned with the turbine‘s power output, and therefore only rotor speeds above
and immediately below the generating threshold are of interest. At rotor speeds of
less than 56 rpm it is assumed that the controller has isolated the turbine from the
distribution network. The safety and function test is more concerned with extreme
conditions and explicitly refers to the dynamic behaviour of the turbine at rated and
higher wind speeds. Hence the higher range of speeds quoted (60-62 rpm). The
reports are consistent on other specification parameters. The Gaia Wind turbine
datasheet (Gaia Wind, 2009) quotes 56 rpm as the nominal rotor speed which
corresponds to the speed required to produce 11kW at rated wind speed. This can
be verified by applying Eq. 2 using the design tip speed ratio of 4, the rated wind
speed of 9.5 m/s and the rotor radius of 6.5 m:
Converting to rpm:
95
The synchronous generator speed of 1200 rpm (on a 60 Hz grid) corresponds to a
rotor angular velocity of 55.55 given the gear ratio of 1:21.6. The rotor must reach
this speed in order to generate power rather than draw it from the grid. From the
NREL data, this occurs at a wind speed between cut-in at 3.5 m/s and 4 m/s. Thus
the rotor angular velocity is assumed to increase steadily from 55.55 rpm to 55.83
rpm between cut-in speed and rated speed. Thereafter up to cut-out speed, the
angular velocity is assumed to increase steadily to 57 rpm at a wind speed of 20 m/s.
This is lower than the maximum rotor speeds suggested by the NREL reports;
however, it was noted that the highest wind speed in the NREL dataset was 20 m/s
whereas the cut-out speed is quoted as 25 m/s. This estimated high bound for rotor
speed was checked with the Gaia Wind engineer. The interpolation was performed
using Microsoft Excel. The result, which is tabulated in Appendix G, yields the graph
in the figure below when the power coefficient is plotted against high speed shaft
(HSS) angular velocity.
An interesting feature of this graph is that power output remains considerably higher
than the rated value at HSS speeds greater than approximately 1205 rpm.
Comparing this graph to the power curve in the NREL power performance test report
(shown in the next figure) it can be observed that the form is similar, and that similar
high outputs were measured at wind speeds between 9.5 and 20 m/s. The level of
power output can be explained with reference to the test procedure in which the
96
measured data is normalised to sea level. The test results represent the adjusted
figures and because air is slightly denser at sea level (1.225kg/m 3) than at the test
location (95kg/m3), the power output appears raised. The effect of a higher value for
air density can be seen in Eq. 1. The high broad curve is characteristic of a twobladed turbine, and can be compared with the curves in Figure 2.
(Huskey et al,. 2009)
Torque is calculated by applying Eq.8 to the values for output power and the
synchronous speed of 1200 rpm. The result, shown below, has the correct form, but
raises some questions about the performance of the generator compared to the
reference values provided on the manufacturer‘s datasheet.
97
Theoretically, the main inflection in the torque-speed characteristic should occur at
the so-called breakdown torque. According to the datasheet for the 60 Hz generator,
which is provided in Appendix F, breakdown torque is 280% of rated torque. Since
rated torque is given as 102 Nm, breakdown torque should be 285.6 Nm; however,
in the calculated torque-speed graph above, the main inflection occurs at around 120 Nm, barely 117.6% of the rated value. The sign is negative because the SCIM is
in generating mode and so only the absolute value is needed for comparison. The
reason for this substantial discrepancy is not clear, and suggests the need to test the
behaviour of the SCIM in isolation.
98
Appendix I: M-NET protocol
(Extract from the Mita Teknik IC1000 manual)
1. The format of the request packet 60133
The request packet must have the following format:
The CRC is the CRC-CCITT applied to ‗Destination‘,‘Source‘,‘Packet type‘, ‗Data
count‘ and ‗Data ‗ Below is shown an example requests to node 2, where data:
1- Stop
01 02 01 EA E5 01 01 A5 81 04
2 –Reset
01 02 01 EA E5 01 02 95 E2 04
4 –Start
01 02 01 EA E5 01 04 95 24 04
5. The format of the reply packet 60132
The reply packet will have the following format:
99
The size of the packet will depend on the number of active status codes. In the
above table, ‗Source‘ is the node number of the answering controller. ‗Data count‘
will depend on active status codes, and will be 12 + ‗No. of SC‘. The ‗CRC‘
calculation is the same and applied to the same fields as in the request packet –
except that the ‗Data‘ field should also be included here. Below is an example of a
communication from a PC sending as node number 1 to an IC1000 controller with
node number 2:
[TX] - 01 02 01 EA E5 00 01 0F D0 04
[RX] - 01
00
02
EAE4
14
0024
0294
0019
0001
003A
|Start|To| From| type|count|Rotor RPM|Gen RPM| event |mode |wind speed|
36RPM
00002012
00000016
00
00
660RPM
12A5
F/W G1
04
act. Power| Acc. Power|no. of SC| SC’s| CRC | stop|
8210W
Rotor RPM
22kWh
0024h = 36 RPM
Generator RPM 0294h = 660RPM
Event
19h = event 25 : Freewheeling ..G1
Mode
1 = Remote mode
Wind speed:
003Ah = 58d = 5.8m/s
Power prod:
00002012h = 8210W
Total prod:
00000016h = 22kWh
Numb. of SC*2: 0000h = 0 active status codes
100
Rem.
8(5.8m/s)
Appendix J: Weg CFW-11 block diagram
101
Appendix K: System specification
1 Introduction
The information in this document constitutes a starting point for the design of a
control system for the Gaia Wind turbine emulator. The development approach will
be based on agile development principles, and therefore further design details will
emerge as the project progresses.
1.1 Overview
The system design is based on the central concept of a Test object which is made
up of a sequence of Instructions. The main components of the system are shown in
the block diagram below.
User
interface
Test
management
module
Inverter
communications
module
Controller
communications
module
Database
External files:
scripts and logs
The system will be implemented in C# which means that the main system
components will be represented by a set of C# classes. The user interface will be
built from standard interface controls provided by Visual Studio, and the remaining
classes will be designed independently based on the UML analyses below.
Communications with the hardware components have not been fully specified at this
time because there are several options which remain to be investigated. It is likely
that these will rely on code already developed by Gaia Wind.
102
1.2 Manual and automatic operation
The design provides a tabbed layout with one tab for manual operation and another
for automatic. The manual tab allows the user to control the inverter directly by
setting an acceleration and deceleration ramp time and a speed. Two buttons enable
and disable the converter. If a non-zero speed is set before the inverter is enabled,
the acceleration ramp time is used. Likewise, if the speed is non-zero when the
disable button is clicked, the deceleration ramp time is used. If the drive is already
running and the speed value is changed, the instruction is sent directly to the
inverter. Although the ramp settings are still active, their effect in this case will be
negligible.
On the automatic tab, the user is able to enter a sequence of instructions directly into
the interface and run. Instruction lists can be as long or as short as the user requires
which allows the user to build up a sequence of instructions to suit immediate
purposes. The current set of instructions can then optionally be saved to the internal
database for later re-use, or exported to an external file in XML format.
The use of an internal database is intended to simplify the user interface
development, and to provide better management for the tests themselves and for
any logfiles that are generated. Specifically, there may be many logfiles generated
for a single test which is run on different occasions, and the database maintains the
link between logfiles and test. The user interface can therefore list all logfiles for a
particular test on request, and the user can view or delete them.
103
2 Class diagram
Classes marked with an asterisk have corresponding database tables.
Instruction*
Speedtest*
stepNo
testId
description
0..1 ui
action
0..*
1..1
run()
stop()
RPM
execute()
0..1
1..1
Device
1..1
Inverter
modbus
uiUpPeriod
uiDownPeriod
uiRpm
start()
{parameters}
acc()
dec()
con()
setRpm()
ramp()
stop()
0..1
Turbine
state
stopTimeout
queue
comPort
portName
baudRate
dataBits
parity
stopBits
readTimeout
init()
enable()
getStatus()
sendMessage()
MNet
rotorRpm
generatorRpm
eventNo
mode
windSpeed
actualPower
accumulatedPo
wer
start()
statusCodes
stop()
reset()
0..1
0..1
1..1
1..1
1..1
Modbus
duration
Serial
MNet
com
buildMessage()
buildMessage()
run()
stop()
104
3 Interface design
The general layout corresponds to that of a standard Windows application with dropdown menus and a toolbar in automatic mode. In the sketches below, only four icons
are shown on the toolbar, but in fact there would be one for each menu option.
Menu items are described in the following table, and the subsequent section
provides some additional detail on the layout.
3.1 Menu items
Menu
Item
Description
Notes
File
New
Clears screen for new input.
Not available while test is running
Open
Dialog allows user to select an
existing test from the
database.
Not available while test is running
Save
Saves current test to the
database
Not available while test is running.
Instructions are validated before
saving, and if errors are found, the
save operation fails.
Import
Allows the user to read test
details from an external XML
file
Not available while test is running
Export
Allows the user to save the
current test as an external
XML file
Not available while test is running
Delete
Deletes current test from the
database and clears screen
If test has not previously been stored,
Delete has the same effect as Open
Exit
Closes the application
Not available while test is running.
User is prompted to save current test
if changes have been made
Validate
Check current sequence of
instructions against validation
rules
Only available if changes have been
made
Run
Runs the current test
Not available while test is running.
If changes have been made, the
instructions are validated before
running. If errors are found, the run
operation fails.
Stop
Interrupts the current run
Only available while test is running.
Brings the drive to a graceful stop
and disables.
Test
Log
Directory Allows the user to select a
directory for storing logfiles
105
Not available while test is running
Help
Log
Toggles logging on and off
Open
Allows the user to select a
logfile for opening with an
appropriate Windows
application (eg Excel)
Manual
Opens the user manual
About
Displays basic details in a
dialog
The name of the logfile is generated
automatically and includes the id
number of the test and a timestamp
4 Automatic mode
File
Test
Log
Auto
Help
Manual
Test id
Description
A
Step Action
B
E
Duration RPM
Sampling period:
C
Speed display
D
Power display
4.1 Notes
A. The test id is an internally-generated number which cannot be changed. Id
number may be discontinuous. The description is editable and required for
saving a test to the database.
106
B. The sequence of instructions that make up a test are shown in a vertically
scrolling table. The details can be entered or altered manually, or they can be
loaded from an external XML file using the option on the File menu.
C. Only a restricted set of actions are possible, and they can be chosen by the
user from a drop-down list. The available actions and their meanings are
shown in the table below. Note that Acc and Dec could have been replaced by
a single action meaning Change to the following speed; however, using Acc
and Dec indicate the intention of the user, and can therefore be used for
validation.
Action Description
Start
Acc
Dec
Con
Stop
Duration (s)
RPM
Start the inverter
Greyed out
Greyed out
Accelerate
Duration of acceleration
Target value
Decelerate
Duration of deceleration Target value
Remain at constant
speed
Duration of steady state
Speed to be
maintained
Stop the inverter
Greyed out
Greyed out
D. The speed and power displays are intended to show instantaneous values
and a continuous trace against time. Two sets of values are shown in each
panel, one for the drive and the other for the generator.
E. This box is used to set the sampling period for the speed and power traces. It
also determines the period of the logfile entries.
4.2 Validation
There are a number of obvious validation rules that can be applied to a sequence
of instructions. Clicking the Validate button causes the system to apply the rules
to the sequence of steps currently displayed, and to report any errors. The table
below lists the validation rules that correspond to specific actions. In addition to
these, all tests must finish with a Stop instruction.
107
Action Validation rule
Meaning
Inverter state = off
Inverter state is off by default.
n=1
Can only occur as first instruction
Inverter state = on
Test must start with a Start instruction
0 <= Duration <=
Durationmax
Duration cannot be negative
Acc
RPMn+1 > RPMn
Target speed must be greater than current
speed
Acc
RPMn+1 < RPMmax
Target speed must not exceed limit
Inverter state = on
Test must start with a Start instruction
0 <= Duration <=
Durationmax
Duration cannot be negative
Dec
RPMn+1 < RPMn
Target speed must be less than current speed
Dec
RPMn+1 >= 0
Target speed may not be negative
Inverter state = on
Test must start with a Start instruction
RPMn+1 = RPMn
Target speed must be equal to current speed
0 <= Duration <=
Durationmax
Duration cannot be negative
Inverter state = on
Test must start with a Start instruction
Stop
RPMn = 0
Previous instruction must bring the drive to
standstill
Stop
n = nmax
Can only occur as last instruction
Start
Start
Acc
Acc
Dec
Dec
Con
Con
Con
Stop
4.3 Changing speed
In cases where the acceleration and deceleration ramps are used, the next
instruction would not be processed until the required speed is achieved. This may
add to the overall duration of the test.
108
Where an instruction requires a change of speed over a period longer than the
natural response lag, the software would artificially extend the change to produce a
smooth ramping of the speed over the specified period.
4.4 XML file format
The format proposed follows the sequential nature of the instructions in a test. Each
test is represented by a <GaiaSpeedTest>…</GaiaSpeedTest> element, and
each instruction in the test is a child node. Each
<instruction>…</instruction> element must have an
<action>…</action> element, and may have <duration>…</duration> and
<rpm>…<rpm> elements.
The XML example below corresponds to the following set of instructions:
Start drive
Accelerate up to 1000 rpm over 10s then spend 60 seconds at speed
Accelerate up to 1010 rpm over 2s then spend 60 seconds at speed
Accelerate up to 1050 rpm over 5s then spend 60 seconds at speed
Decelerate to zero over 10 seconds
Stop the drive and disable
<GaiaSpeedTest>
<id>15</id>
<description>A sample test</description>
<instruction>
<action>Start</action>
</instruction>
<instruction>
<action>Acc</action>
<duration>10</duration>
<rpm>1000</rpm>
</instruction>
<instruction>
109
<action>Con</action>
<duration>60</duration>
<rpm>1000</rpm>
</instruction>
<instruction>
<action>Acc</action>
<duration>2</duration>
<rpm>1010</rpm>
</instruction>
<instruction>
<action>Con</action>
<duration>60</duration>
<rpm>1010</rpm>
</instruction>
<instruction>
<action>Acc</action>
<duration>5</duration>
<rpm>1050</rpm>
</instruction>
<instruction>
<action>Con</action>
<duration>60</duration>
<rpm>1050</rpm>
</instruction>
<instruction>
<action>Dec</action>
<duration>10</duration>
<rpm>0</rpm>
</instruction>
<instruction>
<action>Stop</action>
</instruction>
</GaiaSpeedTest>
110
5 Manual mode
File
Test
Auto
Log
Help
Manual
Settings
A
Actual parameters
Up ramp time
Down ramp time
Speed
Enable
Status
Disable
B
Speed
C
Name
Description
Name
Description
Name
Description
Name
Description
Name
Description
Name
Description
Name
Description
Name
Description
Torque
Power
5.1 Notes
A. The user can set three parameters directly: up and down ramp times and
speed. The ramp times are used to calculate the appropriate ramp parameter
setting (see Acceleration section below).
B. The status section highlights the main status values for the drive. These
duplicate those in the parameter list.
C. The values in this list are read directly from the inverter.
6 Test management module
When the user starts a test, many of the functions in the user interface are disabled,
and control is passed to the test management module which loops through the set of
instructions. The pseudocode below describes the main operation of the module.
111
for each instruction {
compose appropriate inverter control message(s)
send inverter message(s)
while instruction not complete {
poll inverter status
}
}
The Weg inverter provides a large range of operating parameters which can be set
and read over a serial channel. Some of these allow a ramp facility for acceleration
and deceleration actions which means that the C# program only needs to wait for the
instruction to complete rather than actively managing the duration of the action. See
the Acceleration section below for details.
7 Inverter communications
Communications with the Weg inverter will use the Modbus protocol over an RS-232
serial connection. The inverter will be modelled as a C# class whose properties
correspond to the inverter parameters that need to be read or updated during a
speed test.
7.1 Setup
Those parameters that configure the inverter with the basic communications
selections will need to be set manually using the front panel on the physical unit.
These are shown in the table below.
112
Param.
P0202
P0220
Description
Value
Meaning
Default
Type of control
1
V/f 50 Hz
(Y)
LOCAL/REMOTE
2
L/R key
Y
Speed ref LOCAL
0
Keypad
Y
Speed ref REMOTE
9
Serial/USB
FORWARD/REVERSE
1
Always REV
LOCAL run/stop
0
I/O keys
Y
JOG selection LOCAL
1
JOG key
Y
FORWARD/REVERSE
1
Always REV
REMOTE run/stop
2
Serial/USB
JOG selection REMOTE
2
DIx
Y
Serial address
1
Device id
Y
Baud rate
0
9600
Y
Serial byte config
0
8 bits, no parity, 1
selection
P0221
P0222
P0223
LOCAL
P0224
P0225
P0226
REMOTE
P0227
P0228
P0308
P0310
P0311
stop
P0312
Serial protocol
2
Modbus RTU
Y
The setup configuration above assumes that the keypad on the front of the unit is the
LOCAL condition and the serial connection is the REMOTE condition. Switching
between the two is always done from the keypad. This provides a failsafe method for
stopping the drive when under software control. To begin a software-controlled
session, the inverter must be set to REMOTE using the keypad. Only then will the
software commands to enable, disable, start and stop the inverter and to set the
speed reference have any effect. The LOCAL/REMOTE setting determines where
the inverter looks for its speed reference. In the LOCAL condition it will used the
keypad setting (P0121), and in the REMOTE condition it will use the serial setting
(P0683).
113
7.2 Initialisation
Further communications parameters are set
Param
Description
Value
Meaning
Defaul
t
.
P0133
P0134
P0402
Minimum speed ref
minRPM
Read from config table
Maximum speed ref
maxRPM
Read from config table
Motor rated speed
1000
Rated rpm
7.3 Start action
The inverter is enabled but with minimum RPM. This action also set any other
required parameters for the specific test.
Param.
P0682
P0683
Description
Serial control word
Serial speed ref
Value
Meaning
0x0000000000000011 Start and enable
minRPM
Minimum rotation
7.4 Acceleration
For acceleration actions, the user specifies a duration value. The inverter stores a
ramp parameter which can be used to control the rate of acceleration. The
parameter value stored by the inverter is the length of time to accelerate from 0 to
maximum rpm. The duration of an acceleration event is therefore a function of
current rpm, target rpm, maximum rpm and ramp. The task is to set the value of
ramp (R) that will produce the required time interval (Δt) for a particular speed
interval (Δrpm) and a given maximum speed (rpmmax). This is calculated by
A further calculation is required to give the value of P0683, the serial speed
reference. This is a 13-bit value which is calculated as a ratio of the required speed
to the synchronous speed of the motor times a constant of 2000h (8192 decimal).
114
The synchronous speed of the motor is stored in P0402. The value of P0683 is given
by
where rpm is the required speed, and S is the synchronous speed of the motor.
Param.
P0100
P0683
Description
Value
Meaning
Acceleration time
calc
Based on duration
Speed reference
rpm
Speed read from UI
7.5 Deceleration
The duration of a deceleration action is controlled in the same way as that of an
acceleration action.
Param.
P0101
P0683
Description
Value
Meaning
Deceleration time
calc
Based on duration
Speed reference
rpm
Speed read from UI
7.6 Stop action
The same inverter instruction is required for a normal stop action which follows a
deceleration to 0 rpm, and for an interruption to the test run. If a test run is
interrupted prematurely, the drive may still be rotating at high speed. To avoid
tripping the inverter, it is therefore important to bring the drive to a stop over an
extended period of time. The deceleration ramp is therefore set to a value which will
stop the drive over 20s.
Param.
P0101
P0682
Description
Value
Deceleration time
Serial control word
calc
Meaning
Based on duration
0x0000000000000000 Stop and disable
115
7.7 Status polling
The status of the inverter is polled at the rate specified in the sampling period field in
the user interface. Some parameter values need to be divided by 10 to get the actual
value (eg. P0003). Any or all of the values in the table below can be retrieved.
Param.
P0001
P0002
P0003
P0005
P0006
P0007
P0009
P0010
P0050-89
P0090-95
P0316
P0680
P0681
Description
Speed reference
Motor speed
Motor current
Motor frequency
Inverter status
Motor voltage
Motor torque
Output power
Fault stack
Last fault details
Serial interface status
Logic status
Motor speed
7.8 Communications protocol
Weg uses the industry standard Modbus protocol for communicating with devices.
Modbus is a general protocol which provides a wide range of communications
features, only some of which are implemented by Weg. An even smaller range of
messages are needed for this project.
8 Turbine controller communications
The Gaia Wind turbine provides a standard RS-232 communications channel over
which a number of parameters can be monitored. The communications are provided
116
by an IC1000 controller system supplied by Mita Teknik who also defines a
proprietary communications protocol called M-NET. This protocol has two versions,
normal and extended, and older Gaia turbines make used of the normal version. The
system therefore needs to be able to handle both. The major difference is that the
extended version allows the polling of more specific information and the transmission
of three commands, start, stop and reset whereas the normal version is entirely
passive.
9 Additional features
9.1 Graphical output
The design includes a scrolling graphical trace of the speed and power from the two
devices. This is implemented using the C# library by Stephan Zimmermann which is
available from http://www.codeproject.com/KB/miscctrl/GraphPlotting.aspx
9.2 Excel export
The user needs to log test statistics to a file, ideally in Excel format. This functionality
is provided by the Office Open XML library available from
http://excelpackage.codeplex.com/wikipage?title=Creating%20an%20Excel%20spre
adsheet%20from%20scratch&referringTitle=Home
Overall software design
The system requires a number of activities to be carried out simultaneously without
interfering with each other. A multi-threaded design is therefore required which
allows background tasks to be completed without preventing the user interacting with
the interface. Both the inverter and the turbine controller are treated as subclasses of
a generic serial device which is associated with its own thread. This allows each
device to poll continuously for status information independently of any other
activities. When a scripted test is being run, it also needs an independent thread so
that the user can interrupt it if necessary, and the monitor function which updates the
user interface with status information likewise runs independently. Along with the
user interface itself, a total of five threads can be running simultaneously which can
lead to timing and inter-thread communication issues.
117
Appendix L: Communications regarding data collection
Sent: 18 August 2011 11:21
To:
Davison, Brian
Attachments:
2011_08_18_TestRun1.xlsx (77 KB) Open as Web Page ;
2011 08 18 TestRun2.xlsx (76 KB)[Open as Web Page];
Hi Brian,
Had to tweak the Run sequence a little to work with the new inverter set up, but
other than that, the test run went well.
1
Start
2
Acc
10
1005
3
Con
60
1005
4
Acc
2
1015
5
Con
10
1015
6
Acc
2
1025
7
Con
10
1025
8
Acc
2
1035
9
Con
10
1035
10
Dec
5
1000
11
Con
15
1000
12
Dec
5
986
13
Con
5
986
14
Dec
10
200
15
Stop
First let me explain a few changed to the turbine behaviour with the new set up.
118
When the inverter detects a spinning turbine, it enables at the correct frequency to
match rotation but at a lower voltage then ramps up the voltage. This feature makes
it easier to test. Section 3, is there to give the turbine plenty of time to Ramp Up.
When this system is running at 50Hz and Power is <500W, the generator frequency
is dropped to 49.5Hz by running at a lower speed we hope to try and squeeze a little
bit more power out the turbine at the low end. So when slowing down, stage 11
@1000rpm is to allow the turbine to enter it‘s lower freq mode, you‘ll see a jump in
power when that happens as this has increased the slip. Then when in low
frequency mode if the turbine is producing < 500W the turbine will start to brake
using the inverter. Section 13 is to make the turbine begin to try and slow, then
finally stage 14 brings the turbine to a stop.
I‘m keeping a track of bugs and thoughts on improvements. The one ‗bug‘ I‘ve found
is that the Turbine power is displayed and logged as unsigned. It needs to be signed
as the power can go negative. You‘ll see this in the attached log. Also drive power
is being displayed correctly but not logged correctly.
Derek
Sent: 22 August 2011 15:38
To:
Derek Robertson [[email protected]]
Attachments:
Report v3.docx (6 MB)[Open as Web Page]
Hi Derek
Here is a copy of the report. It‘s quite long, but you will probably be most interested
in chapter 3 onwards. If you have any comments, please let me know.
119
You will see I‘ve not complete the evaluation part yet. I was wondering if you could
run the attached test script and let me have the output? To import it, use the import
option on the File menu.
Thanks
Brian
Sent: 22 August 2011 15:39
To:
Derek Robertson [[email protected]]
Attachments:
Rats.
Clicked the Send button instead of the attach button.
Here‘s the script.
B
Sent: 23 August 2011 07:41
To:
Davison, Brian
Brian,
I‘m currently testing out on site. Not sure I‘ll get a change to run this test before
Thursday.
I‘d assume that this isn‘t going to happen on time for now, If I get the opertunity to
test I will do so and send the log ASAP.
I‘ll try have a read at your report today.
Thanks.
Derek
120
References
Akpolat, Z.H., Asher, G.M., Clare, J.C. (1999) Dynamic Emulation of Mechanical
Loads Using a Vector-Controlled Induction Motor–Generator Set. IEEE transactions
on industrial electronics, 46(2).
Anaya-Lara, O., Jenkins, N., Ekanayake, J., Cartwright, P., Hughes, M. (2009) Wind
energy generation: Modelling and control. John Wiley & Sons, Ltd
Ayasun, S., Fischl, R., Vallieu, S., Braun, J., Çadirli, D. (2007) Modelling and
stability analysis of a simulation–stimulation interface for hardware-in-the-loop
applications. Simulation Modelling Practice and Theory 15 pp.734–746.
Bakshi, U.A and Bakshi, V.U. (2009) Electrical technology. Technical Publications.
Pune, India.
Bindner, H., Rosas, P.A.C., Teodorescu, R., Blaabjerg, F. (2004) Stand-alone
version of the 11kW Gaia wind turbine. Risø-R-1480(EN), Risø National Laboratory,
Roskilde, Denmark
Bouscayrol, A., Guillaud, X., Delarue, Ph. (2005) Hardware-in-the-loop simulation of
a wind energy conversion system using energetic macroscopic representation.
Industrial Electronics Society, 2005. IECON 2005. 31st Annual Conference of IEEE ,
vol., no., pp. 6 pp., 6-10 Nov. 2005. doi: 10.1109/IECON.2005.1569302
URL: http://ieeexplore.ieee.org/stamp/stamp.jsp?tp=&arnumber=1569302&isnumber
=33243
Bouscayrol, A., Delarue, P., Lemaire-Semail, B. (2008) Graphical description for
Hardware-in-the-loop simulation. Industrial Electronics, 2008. ISIE 2008. IEEE
International Symposium on , vol., no., pp.2140-2145, June 30 2008-July 2 2008
doi: 10.1109/ISIE.2008.4677307
URL: http://ieeexplore.ieee.org/stamp/stamp.jsp?tp=&arnumber=4677307&isnumber
=4676877
Burley, R .R., Savino, J.M et al. (1979) Some Techniques for Reducing the Tower
Shadows of the DOE/NASA MOD-O Wind Turbine Tower. Report
DOE/NASA/20370-79/17, NASA TM-79202.
121
Burton, T., Sharpe, D., Jenkins, N., and Bossanyi, E. (2001) Wind Energy Handbook.
John Wiley & Sons, Chichester/New York.
Chan, S.M., Cresap, R.L. and Curtice, D.H. (1984) Wind turbine cluster model. IEEE
Transactions on Power Apparatus and Systems, vol. 103, pp. 1692-1698
Chinchilla M., Arnaltes S., Rodriguez-Amenedo J.L.: Laboratory set-up for Wind
Turbine Emulation, 2004 IEEE International Conference on Industrial Technology
(ICIT)
Crabtree, C.J. (2011) Condition Monitoring Techniques for Wind Turbines. Doctoral
thesis, Durham University. Available at Durham E-Theses Online:
http://etheses.dur.ac.uk/652/
de Oliveira, R.G., Parma, G.G., Silva, S.R (2007) Development of a wind turbine
simulator for wind energy conversion systems - experimental results. In Proc of 9th
Brazilian Power Electronics Conference COBEP 07, Blumenau, Santa Catarina,
Brazil. ISBN 978-85-99195-02-4, October 2007.
DECC (2010) National Renewable Energy Action Plan for the United Kingdom.
Available online at
http://www.decc.gov.uk/assets/decc/what%20we%20do/uk%20energy%20supply/en
ergy%20mix/renewable%20energy/ored/25-nat-ren-energy-action-plan.pdf.
Accessed 23 July 2011.
DECC (2011) Feed-in tariffs (FITS). Available online at
http://www.decc.gov.uk/en/content/cms/meeting_energy/renewable_ener/feedin_tarif
f/feedin_tariff.aspx. Accessed 23 July 2011.
Diop, A.D., Ceanga, E., Retiveau, J-L., Methot, J-F., Ilinca, A. (2007) Real-time
three-dimensional wind simulation for windmill rig tests, Renewable Energy, Volume
32, Issue 13, October 2007, Pages 2268-2290, ISSN 0960-1481, DOI:
10.1016/j.renene.2006.04.011.
DNV/Risø (2002) Guidelines for the Design of Wind Turbines, Second Edition. Risø
National Laboratory. ISBN 87-550-2870-5
Dolan D. S. L., Lehn P. W. (2005) Real-Time Wind Turbine Emulator Suitable for
Power Quality and Dynamic Control Studies. International Conference on Power
122
Systems Transients (IPST‘05). Montreal, Canada, June 19-23, 2005, Paper No.
IPST05-074
Dolan D. S. L., Lehn P. W. (2006) Simulation model of wind turbine 3p torque
oscillations due to wind shear and tower shadow. IEEE transactions on energy
conversion, 21(3)
Fleming, F., Edrington, C.S., Steurer, M.; Vodyakho, O. (2009) Development and
implementation of a 25 kW virtual induction machine test bed utilizing the powerhardware-in-the-loop concept. Electric Machines and Drives Conference, 2009.
IEMDC '09. IEEE International , vol., no., pp.1161-1166, 3-6 May 2009
doi: 10.1109/IEMDC.2009.5075350
URL: http://ieeexplore.ieee.org/stamp/stamp.jsp?tp=&arnumber=5075350&isnumber
=5075166
Gabriel, R., Leonhard, W., Nordby, C.J. (1980) Field-oriented control of a standard
AC motor using microprocessors. IEEE transactions on industry applications, 1A-16
(2).
Gaia Wind (2008) User manual. Gaia-Wind 11kW turbine. Available online at
http://www.dcpower-systems.com/documents/Gaia-WindUserManual.pdf. Accessed
14 August 2011
Gaia Wind (2009) Gaia-Wind 133-11kW Data Sheet. Available online at
http://www.gaia-wind.com/index.php/download_file/91/78/. Accessed 12 August
2011
Gaia Wind (2009b) Small wind turbine general information. Available online at
http://swea.co.uk/en/images/Gaia%20133/Covered%20Enquiry%20Supplementary%20Infor
mation.pdf. Accessed 12 August 2011
Gamesa (2010) Press release available online at
http://www.gamesa.es/en/communication/news/eleven-spanish-companies-joinforces-on-the-azimut-project-to-develop-a-15-mw-offshore-wind-turbine-using-100spanishtechnology.html?idCategoria=0&fechaDesde=&especifica=0&texto=&fechaHasta=.
Accessed 23 July 2011
123
Gregg, J.R. (2011) Design and experimental testing of small-scale wind turbines.
Baylor University MSc thesis. Available online at http://hdl.handle.net/2104/8142
Gross, C.A. (2007) Electric machines. CRC Press, Boca Raton, USA.
Hansen A.D., Jauch C,Sørensen P., Iov F., Blaabjerg F. (2003) Dynamic wind
turbine models in power system simulation tool DIgSILENT. Ris-R-1400. Pitney
Bowses Management Services Denmark A/S: Denmark. ISBN 87-550-3198-6.
Helsen J, Vanhollebeke F, De Coninck F, Vandepitte D, Desmet W. (2011) Insights
in wind turbine drive train dynamics gathered by validating advanced models on a
newly developed 13.2 MW dynamically controlled test-rig, Mechatronics, Volume 21,
Issue 4, pp. 737-752, DOI: 10.1016/j.mechatronics.2010.11.005
Hsu Wen-Ko (2010) Measurements on a wind turbine condition monitoring test rig.
University of Durham MSc dissertation
Huskey, A., Bowen, A., Jager, D. (2009) Wind turbine generator system power
performance test report for the Gaia-Wind 11-kW wind turbine. Technical Report
NREL/TP-500-46151. National Renewable Energy Laboratory. Available online at
http://www.google.co.uk/url?sa=t&source=web&cd=1&ved=0CDsQFjAA&url=http%3
A%2F%2Fwww.nrel.gov%2Fwind%2Fsmallwind%2Fpdfs%2Fgaia_power_performa
nce_test_report.pdf&ei=Qaw5ToaAOIewhAeb2N2OAg&usg=AFQjCNFV4hxMyCWj6qyBbDlD6pWLjUoyA&sig2=wY-U6MKVbShIgXD1cT-QIg Accessed 3 August
2011.
Johnson, K.E., Fleming, P.A. (2011) Development, implementation, and testing of
fault detection strategies on the National Wind Technology Center's controls
advanced research turbines, Mechatronics, Volume 21, Issue 4, June 2011, Pages
728-736, ISSN 0957-4158, DOI: 10.1016/j.mechatronics.2010.11.010.
Kojabadi H. M., Chang L., Boutot T. (2004) Development of a Novel Wind Turbine
Simulator for Wind Energy Conversion Systems Using an Inverter-Controlled
Induction Motor, IEEE IEEE Transactions on Energy Conversion, Vol. 19, No. 3,
September 2004
Kojabadi, H.M. and Chang, L. (2011) Wind turbine simulators. In Al-Bahadly, I. (Ed.)
Wind turbines. InTech, ISBN 978-953-307-221-0
124
Lee, J., Pillay, P., Harley, R.G. (1984) D,Q Reference Frames for the Simulation of
Induction Motors. Department of Electrical Engineering, University of Natal, Electric
Power Systems Research, Regular Papers, 8 (1984/85)
Lopes, L.A.C., Lhuilier, J., Mukherjee, A., Khokhar, M.F. (2005) A Wind Turbine
Emulator that Represents the Dynamics of the Wind Turbine Rotor and Drive Train.
Power Electronics Specialists Conference, 2005. PESC '05. IEEE 36th , vol., no.,
pp.2092-2097, 16-16 June 2005. doi: 10.1109/PESC.2005.1581921
URL: http://ieeexplore.ieee.org/stamp/stamp.jsp?tp=&arnumber=1581921&isnumber
=33408
Martínez, F., de Pablo, S., Herrero, L.C. (2009) Fixed Pitch Wind Turbine Emulator
using a DC Motor and a Series Resistor. 13th European Conference on Power
Electronics and Applications (EPE 2009), Barcelona.
Mauri, M., Dezza, F.C., Marchegiani, G. (2008) Hardware in the Loop (HIL) test
bench for small-scale Distributed Generation systems. Industrial Electronics, 2008.
ISIE 2008. IEEE International Symposium on , vol., no., pp.2177-2182, June 30
2008-July 2 2008. doi: 10.1109/ISIE.2008.4677136
URL: http://ieeexplore.ieee.org/stamp/stamp.jsp?tp=&arnumber=4677136&isnumber
=4676877
Ming Qiao, Fei Lin, Ruixiang Hao, Xiaojie You, Zheng, T.Q. (2007) The Research
and Development Platform for Wind Energy System Used Induction Motor Replacing
Wind Turbine. Industrial Electronics and Applications, 2007. ICIEA 2007. 2nd IEEE
Conference on , vol., no., pp.2579-2582, 23-25 May 2007
doi: 10.1109/ICIEA.2007.4318879
URL: http://ieeexplore.ieee.org/stamp/stamp.jsp?tp=&arnumber=4318879&isnumber
=4318335
Monfared M., Kojabadi H. M., Rastegar H.: Static and dynamic wind turbine
simulator using a converter controlled dc motor, Renewable Energy 33 (2008) 906–
913
Moore, I., Ekanayake, J. (2010) Design and development of a hardware based wind
turbine simulator. Universities Power Engineering Conference (UPEC), 2010 45th
International , vol., no., pp.1-5, Aug. 31 2010-Sept. 3 2010
125
URL: http://ieeexplore.ieee.org/stamp/stamp.jsp?tp=&arnumber=5649186&isnumber
=5648789
Müller, S., Deicke, M. and De Doncker, R. W. (2002) Doubly fed induction generator
systems for wind turbines. IEEE Industry Applications Magazine, pp. 26–33,
May/June 2002
Munteanu, I., Bratcu, A.I., Andreica, M., Bacha, S., Roye, D., Guiraud, J. (2010) A
new method of real-time physical simulation of prime movers used in energy
conversion chains. Simulation Modelling Practice and Theory, Volume 18, Issue 9,
October 2010, Pages 1342-1354, ISSN 1569-190X, DOI:
10.1016/j.simpat.2010.05.007.
Munteanu, I., Bratcu, A.I., Bacha, S., Roye, D., Guiraud, J. (2010b) Hardware-in-theLoop-based Simulator for a Class of Variable-speed Wind Energy Conversion
Systems: Design and Performance Assessment. Energy Conversion, IEEE
Transactions on , vol.25, no.2, pp.564-576, June 2010. doi:
10.1109/TEC.2010.2042218
URL: http://ieeexplore.ieee.org/stamp/stamp.jsp?tp=&arnumber=5437239&isnumber
=5467345
Munteanu, I., Bratcu, A.I., Cutululis, N.-A., Ceanga, E. (2008) Optimal Control of
Wind Energy Systems. Towards a Global Approach. Springer
NREL (2010) Gaia-Wind. Avaliable online at
http://www.nrel.gov/wind/smallwind/gaia_wind.html Accessed 4 August 2010
Neammanee, B., Sirisumrannukul, S., Chatratana, S. (2007) Development of a Wind
Turbine Simulator for Wind Generator Testing. International Energy Journal, Volume
8, Issue 1
Ofgem (2011) Feed-in Tariff Adjusted tariff rates 1 April 2011. Available online at
http://www.ofgem.gov.uk/Pages/MoreInformation.aspx?docid=16&refer=Sustainabilit
y/Environment/fits. Accessed 23 July 2011.
Ovando, R.I., Aguayo, J., Cotorogea, M. (2007) Emulation of a Low Power Wind
Turbine with a DC motor in Matlab/Simulink. Power Electronics Specialists
Conference, 2007. PESC 2007. IEEE , vol., no., pp.859-864, 17-21 June 2007 doi:
10.1109/PESC.2007.4342101
126
URL: http://ieeexplore.ieee.org/stamp/stamp.jsp?tp=&arnumber=4342101&isnumber
=4341940
Parekh, R. (2003) AC induction motor fundamentals. Application note AN887,
Microchip Technology Inc. Available online at
http://ww1.microchip.com/downloads/en/AppNotes/00887a.pdf accessed 30 July
2011
Parekh, R. (2004) VF Control of 3-Phase Induction Motors Using PIC16F7X7
Microcontroller. Application note AN889, Microchip Technology Inc. Available online
at http://ww1.microchip.com/downloads/en/AppNotes/00889b.pdf
Pena, R., Cardenas, R., Blasco, R., Asher, G. Clare, J. (2001) A cage induction
generator using back to back PWM converters for variable speed grid connected
wind energy system. In Industrial Electronics Society (2001) IECON '01. The 27th
Annual Conference of the IEEE, Vol. 2 (2001), pp. 1376-1381.
Pillay, P. And Krishnan, R. (1988) Modeling of Permanent Magnet Motor Drives.
IEEE Transactions on industrial electronics, 35(4).
Powles, S.R.J. (1983) The effects of tower shadow on the dynamics of a HAWT.
Wind engineering, 7(1)
Rabelo, B., Hofmann, W., Glück, M. (2004) Emulation of the static and dynamic
behavior of a wind turbine with a DC machine drive. PESC‘04, Aachen, Germany,
2004, pp.2107-21
RenewableUK (2011) International comparisons: turbine densities and capacity
factors. Available online at
http://www.bwea.com/pdf/publications/RenewableUK_Turbine_Density_Study.pdf.
Accessed 23 July 2011
RenewableUK (2011b) Small wind systems: UK market report. Available online at
http://www.bwea.com/pdf/publications/8942_Report_WEB.pdf. Accessed 23 July
2011.
Schleicher, M. and Blasinger, F. (2003) Control engineering. A guide for beginners.
(3rd Edition) JUMO GmbHCo. KG. Fulda Germany. ISBN: 3-9357 42-01-0
127
Sørensen P, Hansen A.D., Andre, P., Rosas, C. (2002) Wind models for simulation
of power fluctuations from wind farms. Journal of wind engineering and industrial
aerodynamics, 90, pp. 1381–1402
Sørensen P, Hansen AD, Iov F, Blaabjerg F, Donovan MH (2005) Wind farm models
and control strategies. Technical Report RISØ-R-1464(EN), RISØ National
Laboratory. Roskilde, Denmark
Teodorescu R, Iov F, Blaabjerg F. (2003) Flexible development and test system for a
11 kW wind turbine. In: Proceedings of 34th IEEE power electronics specialists
conference (PESC03). vol. 1. June 2003. p. 67–72.
Tongguang Wang and Coton, F.N (2001) A high resolution tower shadow model for
downwind wind turbines. Journal of wind engineering and industrial aerodynamics,
89, pp. 873–892
Tunnicliffe, J. (2007) ExcelPackage: Office Open XML Format file creation. Available
online at http://excelpackage.codeplex.com/. Accessed 14 August 2011.
Weg (2007) WLP software manual. Weg Indústrias . Available online at
http://www.weg.net/files/products/WEG-wlp-software-manual-10000051171-8.7xmanual-english.pdf Accessed 12 August 2011
Weg (2008) CFW-11 User‘s guide frequency inverter. Weg Indústrias. Available
online at http://catalogo.weg.com.br/files/wegnet/WEG-cfw-11-a-users-guide10000063093-manual-english.pdf. Accessed 14 August 2011.
Weg (2010) CFW-11 Programming Manual. Weg Indústrias. Available online at
http://www.weg.net/files/products/WEG-cfw-11-programming-manual-0899.56202.0x-manual-english.pdf. Accessed 20 August 2011
Weg (2010b) Serial CFW-11 Communication Manual. Weg Indústrias. Available
online at http://www.weg.net/files/products/WEG-cfw-11-rs232-rs485-serialcommunication-manual-0899.5741-manual-english.pdf. Accessed 14 August 2011.
Weihao Hu, Yue Wang, Xianwen Song, Zhaoan Wang (2008) Development of wind
turbine simulator for wind energy conversion systems based on permanent magnet
synchronous motor. Electrical Machines and Systems, 2008. ICEMS 2008.
International Conference on , vol., no., pp.2322-2326, 17-20 Oct. 2008
128
URL: http://ieeexplore.ieee.org/stamp/stamp.jsp?tp=&arnumber=4771136&isnumber
=4770630
Weiwei Li, Dianguo Xu, Wei Zhang, Hongfei Ma (2007) Research on Wind Turbine
Emulation based on DC Motor. Industrial Electronics and Applications, 2007. ICIEA
2007. 2nd IEEE Conference on , vol., no., pp.2589-2593, 23-25 May 2007 doi:
10.1109/ICIEA.2007.4318881
URL: http://ieeexplore.ieee.org/stamp/stamp.jsp?tp=&arnumber=4318881&isnumber
=4318335
Yang, W., Tavner, P.J., Wilkinson, M.R. (2009) Condition monitoring and fault
diagnosis of a wind turbine synchronous generator drive train. Renewable Power
Generation, IET , vol.3, no.1, pp.1-11. doi: 10.1049/iet-rpg:20080006
URL: http://ieeexplore.ieee.org/stamp/stamp.jsp?tp=&arnumber=4694978&isnumber
=4694977
Yang, W., Tavner, P. J., Crabtree, C. J. and Wilkinson, M. (2010) Cost-effective
condition monitoring for wind turbines. IEEE transactions on industrial electronics, 57
(1). pp. 263-271.
Yaoqin Jia, Zhaoan Wang, Zhongqing Yang (2007) Experimental Study of Control
Strategy for Wind Generation System. Power Electronics Specialists Conference,
2007. PESC 2007. IEEE , vol., no., pp.1202-1207, 17-21 June 2007
doi: 10.1109/PESC.2007.4342164
URL: http://ieeexplore.ieee.org/stamp/stamp.jsp?tp=&arnumber=4342164&isnumber
=4341940
Zimmermann, S. (2009) A simple C# library for graph plotting. Available online at
http://www.codeproject.com/KB/miscctrl/GraphPlotting.aspx. Accessed 14 August
2011
129