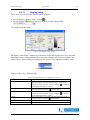
1
RASS-R - Multi Radar Display 3 User Manual Edition Edition Date Status : : : 14 10-JUN-13 Released Issue DOCUMENT IDENTIFICATION SHEET DOCUMENT DESCRIPTION Document Title Multi Radar Display 3 14 EDITION: Document Reference Number EDITION DATE: 10-JUN-13 Abstract The MRD3 is a Multi Radar Display; a technical radar display that can overlay multiple radar outputs on a single display. The MRD3 is to be used as a dedicated local display to enable maintenance and commissioning engineers to assess the operational performance and serviceability of ATC Radar systems. The mode operation of the MRD3 is explained in this document. MRD3 CONTACT PERSON: Display Keywords RASS-R BERT SAUVILLER TEL: +32 14 231811 DOCUMENT STATUS AND TYPE STATUS Working Draft Draft Proposed Issue Released Issue CATEGORY Executive Task Specialist Task Lower Layer Task ELECTRONIC BACKUP IE-UM-00027-014 MRD3.doc INTERNAL REFERENCE NAME: HOST SYSTEM MEDIA SOFTWARE (S) Windows 7 Type: Hard disk Word 14.1.0 Media Identification: Multi Radar Display 3 User Manual -3- DOCUMENT APPROVAL The following table identifies all authorities that have successively approved the present issue of this document. AUTHORITY NAME AND SIGNATURE DATE Author Johan Vansant – Bert Sauviller 27/04/07 Editor Glenn Bosmans Bert Sauviller Jeroen Janssens 10/06/13 31/05/13 10/09/12 Director ATC Director Software Department Ing. M. Vanuytven Ir. E. Moons Multi Radar Display 3 User Manual -4- DOCUMENT CHANGE RECORD The following table records the complete history of the successive editions of the present document. REASON FOR CHANGE SECTIONS PAGES AFFECTED EDITION DATE 1.0 03/04/07 New document All 2.0 21/03/07 Full update from TMD3 manual to MRD3 manual All 2.1 02/05/07 Document updated to MRD3 version 3.2.0. All 2.2 29/05/07 Chapter 3 RASS-R toolbox added Chapter 3 2.3 11/06/07 Chapter 5 Map editor completed Chapter 5 2.4 28/06/07 Spelling errors corrected All 2.5 30/04/08 Updated to MRD3 version 3.6.1 All 2.6 01/09/08 All 9 19/11/09 10 04/11/10 11 28-JUN-11 Updated to MRD3 version 3.7.0; several print screens updated; Multiple RBL (section 4.3.1 and 5.1.3); Map layers window (section 4.3.8); User interface added to change zoom-buttons (section 4.3.9); DHM Discover function added (Data Sources Options 5.1.2); G- and S-filter tab (section 5.2.3.1.1/2); ICAO runway ID used (section 5.3.14); MRD3 is available in 2 versions depending on license key: “MRD3 with 6 layers” and “MRD3 Lite with 1 layer”; Recording & Playback described (section 5.4) Updated to MRD3 version 3.7.1 City Map Plugin (section 5.3.7) Date and Time feature (section 4.3.4) Target List (section 5.2.1.5) 3D Height Label (section 5.2.1.1) Long/Lat is format independent Updated to MRD3 version 3.7.2; Paragraph 4.3.1, RBL locking only works on targets with a track number; rotation of labels of RBL and selected target can be changed by the scroll wheel of the mouse; target with SPI bit and RA field; Paragraph 4.3.10 MRD3 About window - licenses added; Paragraph 5.2.1.1.1 updated with more information about labels; Logo updated All All All Multi Radar Display 3 12 16-MAY-12 13 10-SEP-12 14 24-MAY-13 User Manual Updated to MRD3 version 3.8.0; Typing errors corrected on several pages; Figure 3-1 updated; XMLRPC connection information added; Figure 5-24 updated with extra explanation on page 45; rephrasing of data integrity on page 46/56/59/62; Figure 5-59 updated and consistent explanation; ISA removed from the explanation on the DTED Screening (5.3.9); solution of problem with ADS-B targets updated in section 6 Edited by BSA - JDV Updated to MRD3 version 3.11.0; Included custom plug-ins under extra menu; M5 data labels; Updated to MRD3 version 3.13.0; QNH correction explanation changed and disable function added in paragraph 4.3.7; Paragraph 4.3.9 grid button explanation updated and maximum characters of zoom button name; Information about logo added in paragraph 5.1.3; Center point of digital layer locked to CAT034(120)3D Position of Source Data in paragraph 5.2.1.1.3; Clipping of sector line and video explained in paragraph 5.2.2.1.1 and 5.2.3; Extra information about map center in paragraph 5.3.2; Q&A added in chapter 6 how to avoid wrong/double coastlines in the MRD3 map editor and what to do in case of a LabVIEW error when switching configuration in the MRD3. -5- 14, 35, 45, 46, 56, 59, 62, 65, 72, 87 19, 44-45 27, 28, 38, 42, 47, 56, 58, 65, 88 Multi Radar Display 3 User Manual -6- TABLE OF CONTENTS 1. INTRODUCTION ..................................................................................................................................... 12 1.1 2. BENEFITS AND POSSIBILITIES OF THE SYSTEM ......................................................................................... 13 GENERAL OVERVIEW ......................................................................................................................... 14 2.1 2.2 2.3 MRD3 AS PART OF RASS-R ................................................................................................................... 14 MRD3 GENERAL OVERVIEW .................................................................................................................. 14 NETWORK OPERATION ............................................................................................................................ 14 3. RASS-R TOOLBOX ................................................................................................................................. 15 4. MRD3 DISPLAY....................................................................................................................................... 17 4.1 MENU BAR .............................................................................................................................................. 18 4.2 TOOLBAR ................................................................................................................................................ 19 4.2.1 Main toolbar ................................................................................................................................. 19 4.2.2 Zoom/Select toolbar ...................................................................................................................... 20 4.2.3 Setup toolbar ................................................................................................................................. 20 4.3 DISPLAY AREA ........................................................................................................................................ 21 4.3.1 Main display ................................................................................................................................. 21 4.3.2 Compass view ............................................................................................................................... 24 4.3.3 Target info window ....................................................................................................................... 25 4.3.4 Date & Time ................................................................................................................................. 26 4.3.5 Filter ............................................................................................................................................. 26 4.3.6 Micro Table .................................................................................................................................. 26 4.3.7 QNH correction ............................................................................................................................ 27 4.3.8 Map layers window ....................................................................................................................... 28 4.3.9 Shortcut bar .................................................................................................................................. 28 4.3.10 MRD3 About window - licenses ............................................................................................... 30 5. MRD3 CONFIGURATION ..................................................................................................................... 31 5.1 OPTIONS .................................................................................................................................................. 31 5.1.1 General options ............................................................................................................................ 32 5.1.2 Data Sources options .................................................................................................................... 34 5.1.3 Appearances options ..................................................................................................................... 38 5.2 SETUP AND ANALYSIS ............................................................................................................................. 41 5.2.1 Setup and analysis: digital ............................................................................................................ 42 5.2.1.1 5.2.1.1.1 5.2.1.1.2 5.2.1.1.3 5.2.1.1.4 5.2.1.1.5 5.2.1.2 5.2.1.3 5.2.1.4 5.2.1.5 5.2.2 Display setup ............................................................................................................................................ 43 General tab .......................................................................................................................................... 44 Symbol tab .......................................................................................................................................... 46 Special tab ........................................................................................................................................... 47 G-Filter tab.......................................................................................................................................... 48 S-filter tab ........................................................................................................................................... 49 Selection Info ........................................................................................................................................... 51 History Info .............................................................................................................................................. 52 Histogram info ......................................................................................................................................... 53 Display List .............................................................................................................................................. 54 Setup and analysis: Vector ........................................................................................................... 55 5.2.2.1 Display setup ............................................................................................................................................ 56 5.2.2.1.1 General tab .......................................................................................................................................... 56 5.2.2.1.2 Special tab ........................................................................................................................................... 57 5.2.3 Setup and analysis Video .............................................................................................................. 58 5.2.3.1 Display setup ............................................................................................................................................ 59 5.2.3.1.1 General tab .......................................................................................................................................... 59 5.2.3.1.2 Special tab ........................................................................................................................................... 60 5.2.4 Setup and analysis: Status ............................................................................................................ 61 5.2.4.1 Display setup ............................................................................................................................................ 63 5.3 MAP EDITOR ........................................................................................................................................... 64 5.3.1 Zoom toolbar ................................................................................................................................ 65 5.3.2 Map Centre ................................................................................................................................... 65 Multi Radar Display 3 5.3.3 5.3.4 5.3.5 5.3.6 5.3.7 5.3.8 5.3.9 5.3.10 5.3.11 5.3.12 5.3.13 5.3.14 5.3.15 User Manual -7- Items.............................................................................................................................................. 66 Item Configuration........................................................................................................................ 67 Airports Item ................................................................................................................................. 68 Airroutes Item ............................................................................................................................... 69 Cities ............................................................................................................................................. 70 Coastline Item ............................................................................................................................... 72 DTED Screening ........................................................................................................................... 73 Graticule Item .......................................................................................................................... 75 Navaids Item ............................................................................................................................ 76 Obstacles .................................................................................................................................. 77 Open Air Item ........................................................................................................................... 79 Runways Item ........................................................................................................................... 80 SCF .......................................................................................................................................... 82 5.3.15.1 5.3.15.2 5.3.15.3 SCF Map Type ....................................................................................................................................83 SCF Map altitude and type.................................................................................................................. 83 SCF Setup ........................................................................................................................................... 83 5.3.16 Waypoints Item ......................................................................................................................... 84 5.4 RECORD AND PLAYBACK ......................................................................................................................... 85 6. TROUBLESHOOTING/Q&A ................................................................................................................. 87 Multi Radar Display 3 User Manual -8- TABLE OF FIGURES Figure 1-1: Multi Radar Display .......................................................................................................................... 12 Figure 2-1: MRD3 as part of the RASS-R structure ............................................................................................. 14 Figure 3-1: RASS-R toolbox ................................................................................................................................. 15 Figure 3-2: Campaign directory structure ........................................................................................................... 16 Figure 4-1: MRD3 main window .......................................................................................................................... 17 Figure 4-2: Main toolbar (Open vs. Dock view) .................................................................................................. 19 Figure 4-3: Zoom/Select toolbar (Open vs. Dock view) ....................................................................................... 20 Figure 4-4: Setup toolbar (Open vs. Dock view) .................................................................................................. 20 Figure 4-5: Main display ...................................................................................................................................... 21 Figure 4-6: Display right click ............................................................................................................................. 21 Figure 4-7: Multiple target selection.................................................................................................................... 22 Figure 4-8: Range Bearing Line........................................................................................................................... 23 Figure 4-9: Select compass view .......................................................................................................................... 24 Figure 4-10: Compass view .................................................................................................................................. 24 Figure 4-11: Select Target Info ............................................................................................................................ 25 Figure 4-12: Target info window ......................................................................................................................... 25 Figure 4-13: Select Date & Time ......................................................................................................................... 26 Figure 4-14: Date & Time window ...................................................................................................................... 26 Figure 4-15: Select Filter ..................................................................................................................................... 26 Figure 4-16: Filter window .................................................................................................................................. 26 Figure 4-17: Select Micro Table .......................................................................................................................... 26 Figure 4-18: Micro Table ..................................................................................................................................... 27 Figure 4-19: Select QNH ...................................................................................................................................... 27 Figure 4-20: QNH window ................................................................................................................................... 27 Figure 4-21: Select Map layers window ............................................................................................................... 28 Figure 4-22: Maplayers window .......................................................................................................................... 28 Figure 4-23: Select Shortcut Bar .......................................................................................................................... 28 Figure 4-24: Shortcut bar..................................................................................................................................... 28 Figure 4-25: Change zoom settings ...................................................................................................................... 29 Figure 4-26: Rename the zoom button ................................................................................................................. 29 Figure 4-27: Zoom button "South" ....................................................................................................................... 29 Figure 4-28: MRD3 v3.7.2 registered to name "radar" and customer “Intersoft Electronics” ........................... 30 Figure 4-29: Software not registered message ..................................................................................................... 30 Figure 5-1: Select the options menu ..................................................................................................................... 31 Figure 5-2: Save configuration as ........................................................................................................................ 31 Figure 5-3: Load configuration ............................................................................................................................ 31 Figure 5-4: Options dialog “General” section .................................................................................................... 32 Figure 5-5: Configure display layers ................................................................................................................... 33 Figure 5-6: Options dialog “Data Sources” section ............................................................................................ 34 Figure 5-7: Selecting to Add a (digital) data source ............................................................................................ 34 Figure 5-8: MRD data source dialog ................................................................................................................... 35 Figure 5-9: DHM server selection ....................................................................................................................... 35 Figure 5-10: Available digital data source selection ........................................................................................... 36 Figure 5-11: Underscores instead of spaces! ....................................................................................................... 36 Figure 5-12: Video source selection ..................................................................................................................... 37 Figure 5-13: Options dialog with 3 digital sources configured ........................................................................... 37 Figure 5-14: Options dialog “Appearances” section........................................................................................... 38 Figure 5-15: Opacity of 150 ................................................................................................................................. 39 Figure 5-16: Selecting the “Setup and Analysis…” menu ................................................................................... 41 Figure 5-17: Setup and analysis window ............................................................................................................. 41 Figure 5-18: Setup and Analysis - digital ............................................................................................................. 42 Figure 5-19: Assigning a digital data source ....................................................................................................... 42 Figure 5-20: Display setup window ..................................................................................................................... 43 Figure 5-21: Factory Defaults.............................................................................................................................. 43 Figure 5-22: General tab...................................................................................................................................... 44 Figure 5-23: Label information ............................................................................................................................ 44 Figure 5-24: Digital data source symbols ............................................................................................................ 46 Figure 5-25: Digital data source special items .................................................................................................... 47 Multi Radar Display 3 User Manual -9- Figure 5-26: Data source timeout ........................................................................................................................ 47 Figure 5-27: G-Filter tab ..................................................................................................................................... 48 Figure 5-28: G-Filter editor ................................................................................................................................. 48 Figure 5-29: S-Filter tab ...................................................................................................................................... 49 Figure 5-30: S-Filter editor .................................................................................................................................. 49 Figure 5-31: S-filter, condition and result 1 ......................................................................................................... 50 Figure 5-32: S-filter, condition and result 2 ......................................................................................................... 50 Figure 5-33: Select a target to Display Info ......................................................................................................... 51 Figure 5-34: Example of ADS-B data (ASTERIX Cat021) ................................................................................... 51 Figure 5-35: Selected targets ............................................................................................................................... 51 Figure 5-36: Display History default screen ........................................................................................................ 52 Figure 5-37: Display History "Target Reports/Scan" .......................................................................................... 52 Figure 5-38: Display Histogram default screen ................................................................................................... 53 Figure 5-39: Display Histogram "Velocity" ......................................................................................................... 53 Figure 5-40: Cumulative – Relative ..................................................................................................................... 54 Figure 5-41: Display List window ........................................................................................................................ 54 Figure 5-42: Setup and Analysis - vector ............................................................................................................. 55 Figure 5-43: Assigning a vector data source ....................................................................................................... 55 Figure 5-44: General tab vector ........................................................................................................................... 56 Figure 5-45: Special tab vector ............................................................................................................................ 57 Figure 5-46: Vector data timeout ......................................................................................................................... 57 Figure 5-47: Setup and Analysis - video .............................................................................................................. 58 Figure 5-48: Assigning a video data source ......................................................................................................... 58 Figure 5-49: Configuring a Video Data Source ................................................................................................... 59 Figure 5-50: Video special tab ............................................................................................................................. 60 Figure 5-51: Video data timeout .......................................................................................................................... 60 Figure 5-52: Setup and Analysis - status .............................................................................................................. 61 Figure 5-53: Assigning a status data source ........................................................................................................ 61 Figure 5-54: Status data ....................................................................................................................................... 62 Figure 5-55: Status display setup ......................................................................................................................... 63 Figure 5-56: Status data timeout .......................................................................................................................... 63 Figure 5-57: Map Editor - general overview ....................................................................................................... 64 Figure 5-58: Zoom toolbar ................................................................................................................................... 65 Figure 5-59: Airport.ini file and result ................................................................................................................. 66 Figure 5-60: Map Editor - airports ...................................................................................................................... 68 Figure 5-61: Map Editor – airroutes .................................................................................................................... 69 Figure 5-62: Map Editor - Cities.......................................................................................................................... 70 Figure 5-63: Cities.txt .......................................................................................................................................... 71 Figure 5-64: Map Editor - Coastline .................................................................................................................... 72 Figure 5-65: Map Editor – DTED Screening ....................................................................................................... 73 Figure 5-66: Folder selection DTED ................................................................................................................... 74 Figure 5-67: Map Editor - Graticule.................................................................................................................... 75 Figure 5-68: Map Editor - Navaids ...................................................................................................................... 76 Figure 5-69: Map Editor - Obstacles ................................................................................................................... 77 Figure 5-70: Map Editor - Open Air Item ............................................................................................................ 79 Figure 5-71: Map Editor - Runways..................................................................................................................... 80 Figure 5-72: Map Editor - SCF ............................................................................................................................ 82 Figure 5-73: Map Editor – SCF – SCF Setup Colour .......................................................................................... 83 Figure 5-74: Map Editor – waypoints .................................................................................................................. 84 Figure 5-75: Recorder .......................................................................................................................................... 85 Figure 5-76: LIVE mode....................................................................................................................................... 85 Figure 5-77: REPLAY mode ................................................................................................................................. 85 Figure 5-78: Select a proper .db3 file .................................................................................................................. 86 Figure 5-79: Configuration of the replay ............................................................................................................. 86 Figure 5-80: Replayed layers ............................................................................................................................... 86 Figure 6-1: Repairing the MRD3 ......................................................................................................................... 87 Multi Radar Display 3 User Manual - 10 - TABLE OF TABLES Table 1-1: supported data types ........................................................................................................................... 13 Table 2-1: MRD3 network ports ........................................................................................................................... 14 Table 3-1: RASS-R menu bar................................................................................................................................ 15 Table 4-1: Menu bar overview ............................................................................................................................. 18 Table 4-2: Main toolbar overview ........................................................................................................................ 19 Table 4-3: Zoom/Select toolbar overview ............................................................................................................. 20 Table 5-1: Digital display options ........................................................................................................................ 42 Table 5-2: Digital data source configuration overview........................................................................................ 43 Table 5-3: History-Histogram explanation .......................................................................................................... 52 Table 5-4: Vector display options......................................................................................................................... 55 Table 5-5: Video display options .......................................................................................................................... 58 Table 5-6: Status display options ......................................................................................................................... 61 Table 5-7: Zoom toolbar overview ....................................................................................................................... 65 Table 5-8: Map Editor Items ................................................................................................................................ 66 Table 5-9: Obstacles definition file structure ....................................................................................................... 78 Multi Radar Display 3 User Manual - 11 - CONVENTIONS USED IN THIS MANUAL The following conventions are used in this manual: Note: This icon to the left of bold italicized text denotes a note, which alerts you to important information. Caution: This icon to the left of bold italicized text denotes a caution, which alerts you to the possibility of data loss or a system crash. Warning: This icon to the left of bold italicized text denotes a warning, which alerts you to the possibility of damage to you or your equipment. Multi Radar Display 3 User Manual - 12 - 1. Introduction The MRD3 is to be used as a dedicated display to enable maintenance and commissioning engineers to assesss the operational performance and serviceability of ATC Radar systems. The MRD3 is designed to take the maximum advantage of the latest technologies; it uses the PC graphics card extensively and can be displayed on any screen resolution supported by the graphics card. The MRD3 is used in combination with the RASS-R Data Handling Module (DHM), where the DHM is used to pre-process the radar data and make it available to the MRD3 for displaying. This setup allows for virtually any configuration of radar data sources with different capturing hardware and protocols to be serviced. Figure 1-1: Multi Radar Display The MRD3 can represent multiple and different types of data. The figure above shows a few of the different data types supported. All layers can be shown Multi Radar Display 3 User Manual - 13 - simultaneously in overlay. Table 1-1: supported data types Data type Digital (Plot/Track) Video Vector (Weather) Status (Radar service Messages) 1.1 Available Layers 6 6 6 6 Benefits and possibilities of the system Verify and validate; quickly compare a radar data source against other data sources. Examine detailed target reports for the same target from different radars. Interface via DHM allows for expansion to user specific data-types. MRD3 and DHM can be run on separate computers allowing the display system to run remote from the actual radar data source. Represent the same data simultaneously with different display and/or filter settings. Scalable main window allows best representation on any available monitor. Client specific demands are easily integrated. Even digitized video data can be sent over LAN. Multi Radar Display 3 User Manual - 14 - 2. General overview 2.1 MRD3 as part of RASS-R The MRD3 software has to be run in combination with the DHM for live capturing or replaying of DHM recorded data. Figure 2-1 is a schematic representation of a generic MRD3 setup. The MRD3 software is either run on the same computer as the DHM or the MRD3 is connected to the DHM (one or more) via LAN. Data Handling Server(s) conversion correction/modification LAN DHM server DHM server MRD3 Figure 2-1: MRD3 as part of the RASS-R structure The data that is converted/corrected/modified by the Data Handler Module is redirected to the MRD3 application where it is displayed as target data, weather data or status messages. 2.2 MRD3 General Overview The MRD3 must be run on a standard Windows XP PC with a “decent” graphics card (see system requirements for detail). The MRD3 can display different types of data; i.e. Digital data (plot or track), Video, Vector data (mostly used for weather) and Status information. The MRD3 can display multiple data types of the same or different kind, for example 4 radar data streams with digital data and 2 weather outputs. Each of these data types is fully configurable to the user’s demand. 2.3 Network operation The MRD3 uses several TCP and UDP ports for different purposes, it is important that these ports are free for use on the target system. Table 2-1 shows an overview of the ports used by the MRD3. Table 2-1: MRD3 network ports Port Number 5770 Used by RASS-R applications 5773 Telnet server Usage Inter-application communication with other RASS-R applications Administrator commands, API for 3rd party programs. Multi Radar Display 3 User Manual - 15 - 3. RASS-R toolbox The RASS-R toolbox is installed on your pc and has a shortcut on the desktop. It can also be accessed using the Windows Start-menu. The toolbox is displayed in the figure below. The current version of the RASS-R toolbox is displayed in the right upper corner. The MRD3 is part of this RASS-R toolbox and can be opened using the appropriate icon . Figure 3-1: RASS-R toolbox The menu bar contains the following items: Table 3-1: RASS-R menu bar Button Help window Usage When this button is clicked, the Help window will appear and show help information whenever you point over a button. Campaign change Click this to make an appropriate campaign structure (see further) Exit Quit the application Multi Radar Display 3 User Manual - 16 - When you click the button, it will ask you where you want to create your RASS-R campaign folder. Select the correct path. Upon completion, you should have the following directory structure created as in the figure below. Figure 3-2: Campaign directory structure When you make a campaign folder with the RASS-R toolbox, it is preferred to make it on a separate drive then the drive where your operation system is on. For example, as in the figure above, a structure named “CAMPAIGN-RASS-R” is created on the D-drive. Multi Radar Display 3 User Manual - 17 - 4. MRD3 display After starting the MRD3 software the main MRD3 window appears (Figure 4-1). With a new installation the factory default configuration is loaded. Later you may select another configuration to be loaded at start-up. Menu bar Tool bar Map layers Setup & Analysis QNH window Target Info Call Sign table Filter Date&Timee Display area and time Shortcut bar Figure 4-1: MRD3 main window The main MRD3 window consists of 3 main parts: Menu bar: used to operate and configure the software. Toolbar: for quick access to the MRD3s main features Display Area: graphical representation of the radar data in PPI style, with different windows in overlay: Target Info, Micro Table, QNH window, Filter, Shortcut Bar, Map layers, Setup & Analysis, all configurable in transparency. Multi Radar Display 3 4.1 User Manual - 18 - Menu bar The menu bar allows the user to access configuration dialogs, to save and load configurations. An overview of all the available menu items is given in table 4-1. Table 4-1: Menu bar overview Menu (shortcuts bold) File Exit Ctrl+Q Configuration Options… Setup and Analysis… Coastline Map Editor… Save Configuration As Current As Custom …Ctrl+S Load Configuration Rec Recorder Playback Window TargetInfo Ctrl+Shift+I ShortCutBar Ctrl+Shift+B MapLayers Ctrl+Shift+L Date&Time Ctrl+Shift+D MRD3 vx.x.x Main Toolbar Setup Zoom/Select View Full Screen Ctrl+Shift+F PPI Vertical Visible Toolbar Ctrl+Shift+T Menu Ctrl+Shift+M Status Ctrl+Shift+S Map Compass Toolbars Main Toolbar Open Dock Zoom/Select Open Dock Setup Open Dock Usage Main menu to access application related functions To quit the application Main configuration to access all configuration related menus Opens the Options window Opens the Setup and Analysis window Opens the Map editor Submenu to access other save options Will save the configuration under the currently loaded configuration name Opens a dialog which allows you to choose a configuration name for saving Opens a dialog which allows you to choose a configuration for loading Main menu to access recorder related functions Opens the recorder dialog Opens the playback dialog To access all open window Prompts the target info table Prompts the shortcut bar on the display Prompts the Map layers shortcut bar on the display Prompts the Date & Time bar on the display If this window is hidden, click this to let it popup. If this window is hidden, click this to let it popup. If this window is hidden, click this to let it popup. If this window is hidden, click this to let it popup. Note: every time a window is opened (e.g. Target Info or Micro table) this list will be filled up with these windows. Main view menu to access viewing options Will resize the main window to occupy the full screen Show the data in PPI mode (currently disabled) Show the data in vertical mode (not yet implemented) Submenu to access visibility options Toggle the visibility of the toolbar Toggle the visibility of the menu bar Toggle the visibility of the status bar Toggle the visibility of the background map Displays the compass Submenu to access toolbar options Submenu to access main toolbar options Open the main toolbar in a separate window Dock the main toolbar in the toolbar Submenu to access Zoom/Select toolbar options Open the Zoom/Select toolbar in a separate window Dock the Zoom/Select toolbar in the toolbar Submenu to access Setup toolbar options Open the Setup toolbar in a separate window Dock the Setup toolbar in the toolbar Multi Radar Display 3 User Manual Extra Filter Ctrl+F9 MicroTable Ctrl+F7 QNH Ctrl+F8 Custom Prompts the filter settings window Prompts the micro table Prompts the QNH window Optional tools might be listed here. Separate manuals are provided for these custom plug-ins. Main help menu to access all help items Application Summary dialog Help About MRD3… 4.2 Toolbar The toolbar allows the user to quickly access functionalities that are often used. 4.2.1 Main toolbar The main toolbar contains functions to configure the MRD3. The Main toolbar can be displayed in “Open” view or “Dock” view, upon selection in the Menu bar. Figure 4-2: Main toolbar (Open vs. Dock view) Table 4-2 shows an overview of the Main toolbar’s functionality Table 4-2: Main toolbar overview Button Options Setup and Analysis Coastline Map editor Target Info Shortcut bar Map layers Date & Time Recorder Record & Replay Exit - 19 - Usage Open the options window (see paragraph 5.1) Open the Setup and Analysis window (see paragraph 5.2) Open the Coastline Map editor (see paragraph 5.3) Open Target Info window (see paragraph 4.3.3 ) Open Shortcut bar (see paragraph 4.3.9) Open the Map layers window (see paragraph 4.3.8) Open the Date & Time window (see paragraph 4.3.4) Open the Recorder (see paragraph 5.4) Open the Record and Replay control window (see paragraph 5.4) Quit the application Multi Radar Display 3 4.2.2 User Manual - 20 - Zoom/Select toolbar The Zoom/Select toolbar contains functions to manipulate the display area. The Zoom/Select toolbar can be displayed in “Open” view or “Dock” view, upon selection in the Menu bar. Figure 4-3: Zoom/Select toolbar (Open vs. Dock view) Table 4-3 shows an overview of the Zoom/Select toolbar’s functionality. Detailed explanation can be found in paragraph 4.3.1) Table 4-3: Zoom/Select toolbar overview Button Usage Switch the display to pan mode, use the cursor to move the display area around Switch the display to select mode, use the cursor to select targets Pan Select RBL Enables the Range Bearing Line on the display and select one out of 5 Range Bearing Lines (if enabled). Zoom Switch the display to Zoom mode, use the cursor to zoom into areas of interest Zoom out progressively until maximum viewing area is visible Zoom out Zoom in progressively until maximum zoom (highest level of detail) is reached Switch back to default zoom (-500) and centre (or press the home button) Clear all display data Zoom in Home Erase all 4.2.3 Setup toolbar The Setup toolbar allows the user to reach the setup window of a display’s current data source quickly. The Setup toolbar can be displayed in “Open” view or “Dock” view, upon selection in the Menu bar. Figure 4-4: Setup toolbar (Open vs. Dock view) Select a Display via the pop down menu and then press the “Setup” button to open the Display’s data source configuration window. The configuration window is specific per Data Type and is discussed in section 5.2.1. Multi Radar Display 3 4.3 User Manual - 21 - Display area 4.3.1 Main display The display area is the main area of interest; this is where the radar data is graphically represented. Figure 4-5: Main display Use the “Zoom/Select” toolbar to switch the display in a specific mode and then manipulate the display by using the mouse. Instead of using the “Zoom / Select” toolbar, you can also right click on the display, then the following menu appears: Figure 4-6: Display right click Multi Radar Display 3 User Manual - 22 - This menu gives extra possibilities as well: Make the Toolbar/Menu bar/Status bar/Map/Compass visible or not Toggle to Full Screen mode The following actions can be performed on the display: Pan: When in pan mode the mouse cursor shows a “Hand” icon. Click and drag the screen content to re-centre the display. Panning the window may also be done by using the cursor keys “up, down, left, right” regardless of which mode the display is in. Select: When in select mode the mouse cursor shows a “Crosshair” + icon. Click individual targets or click and drag the mouse to select a rectangle of targets. Selected targets will colour white. Once selected, using the scroll wheel of the mouse can change the rotation of the target labels. Targets that have the Special Purpose Indicator (SPR) bit (I001/020 or I048/020) or the Resolution Advisory (RA) field (I048/260) on, colour red and start blinking. Figure 4-7: Multiple target selection RBL (Range Bearing Line): When you are in RBL mode, you can draw a RBL line. In the Appearances option (paragraph 5.1.3), you can enable 1 till 5 different RBL-lines with each an appropriate colour. Before you start drawing the RBL line, first pick out the number of line you want to draw by clicking the bottom arrow in the RBL icon: . The next dropdown list appears: . Using the left mouse button, you can change the start position of the RBL. Using the left mouse button while pressing the Shift key, you can determine the end position of the RBL. The end position can be chosen anywhere in the display area. But as soon as you point over a target with the mouse while pressing the Shift key, a modified + sign will appear. This means that the RBL can be locked on a target now (on the condition that the target has a track number). When locked, the RBL will follow the target and update its information automatically as long as the target exists. A RBL can also be locked between 2 targets (again, on the condition that both targets have a track number). Using the scroll wheel of the mouse can change the rotation of the RBL labels. To turn off the RBL, you simply click the mouse to use another mode, for example Pan, Multi Radar Display 3 User Manual - 23 - Select or Zoom. Zooming or panning by means of the keyboard will not turn off the RBL! The example below will explain the displayed information of the RBL. Stop position 10.3NM=range of the line 328deg=bearing of the end point 148deg=bearing of the start point Start position Stop position 4.6NM=range of the line 089deg=bearing of the end point 269deg=bearing of the start point Figure 4-8: Range Bearing Line When you also enabled to view the Lon/Lat position when being in RBL-mode, wherever you drag on the PPI, you will see the current Longitude and Latitude of that position. Zoom: When in zoom mode the mouse cursor shows a “magnifying glass” icon. Click and drag to zoom in on the selected rectangle. Using the keys “Page up, Page down, Home” regardless of which mode the display is in may also zoom the display. Multi Radar Display 3 4.3.2 User Manual - 24 - Compass view The compass view can be opened in the following way: Figure 4-9: Select compass view The compass view puts a compass layer on the screen. It can be helpful for when determining the correct heading of a target. The middle line of the grid also displays two bearings where the grid is pointing. When you press F6, the compass grids are enabled. By pressing the left or right key, you can turn the grid in order to project the targets on the compass degrees. Compass Grid Figure 4-10: Compass view Multi Radar Display 3 4.3.3 User Manual - 25 - Target info window To display the Target Info, click Window in the Menu, then select “Target Info” or just press Ctrl+Shift+I or press the appropriate icon in the toolbar. Figure 4-11: Select Target Info The “Target Info” window will appear. Now, you can select a target in 2 different ways: click the select button or do a right click and choose “select” as in Figure 4-6. Upon selection, the “Target Info” window is updated with information belonging to the selected target. As you can see in the figure below, the selected target is highlighted (white) and the “Target Info” window contains the following information fields: Mode-S address: 48415E Aircraft ID: KLM44M Mode 3/A code: 3443 TRN: track number 0070 ALT: altitude 20350ft R: Range 120.23NM Az: Azimuth 331.30deg Country and flag: Netherlands REG: Registration number: PH-BXE TYP: Airplane type: 737-800 Selected target Figure 4-12: Target info window The last 3 lines are look-up based on the mode-S address. Airplanes registered after the release of the MRD3 will not have a reference in the internal Database. The first time that you start up, it can be that the colour/opacity-settings of the Target Info window have default values that make it invisible for you. In the Appearances setup you can change this. (See paragraph 5.1.3) The info will only be updated according to the target when the target contains a track number! Multi Radar Display 3 4.3.4 User Manual - 26 - Date & Time To display the Date & Time, click Window in the Menu, then select “Date & Time” or just press Ctrl+Shift+D or press the appropriate icon in the toolbar. Figure 4-13: Select Date & Time Current UTC time, based on the system time of the display computer, and Date is displayed in the Date and Time window Figure 4-14: Date & Time window 4.3.5 Filter To display the Filter, click “Extra” in the Menu, then select “Filter” or just press Ctrl+F9. Figure 4-15: Select Filter The filter can be used to filter targets between a lower and upper flight level (Unit is FL, maximum 1000). The filter can be turned on or off by clicking the Active button (“Act”). If you select the Visible button (“Vis”), then all targets between the lower and upper flight level will be coloured according the colour set in the Col-field. Figure 4-16: Filter window 4.3.6 Micro Table To display the Micro Table, click “Extra” in the Menu, then select “Micro Table” or just press Ctrl+F7. Figure 4-17: Select Micro Table One can use the Micro Table to manually assign a Call Sign to a specific target. You simply type in the SSR code, the Call Sign and the appropriate Track number (TRN) of the target. Of course, the “Target Info” window can help you to obtain those values. Once this is filled in, it automatically gets an appropriate status in the St-column (Status). This status is updated automatically at each scan. Multi Radar Display 3 User Manual - 27 - Different status values are possible: A - Active: when the target is still in the range of the Radar L - Lost: when the target is out of range or when the target is missing. M - Multiple: when there are multiple targets having the same SSR-code. Empty field: when you made an entry in the table with an unknown SSR-code, then the status will be empty. When the target appears at a next scan, it will get the status Active. Suppose it disappears again, it will get the status Lost (and not empty anymore) As you can see in the picture below, the table has 16 rows. By setting the correct opacity (see further), you can simply drag it and put it on top of your radar display. Call sign assigned to SSR code 6662 Figure 4-18: Micro Table 4.3.7 QNH correction To display the QNH window, click “Extra” in the Menu, then select “QNH” or just press Ctrl+F8. Figure 4-19: Select QNH Atmospheric Pressure (Q) at Nautical Height correction can be set in the QNH window. The corrected height of a target will be displayed with a ` on the condition that the digital label is Mode-C in [ft] or [100ft] as in Figure 5-23. The QNH is expressed in millibar where every +/- 1mbar increases/decreases the Mode-C with 30ft for all targets with an altitude below the transition level (TL). The minimum TL is 1000ft. Setting the QNH to 0 mbar disables the QNH correction again. Figure 4-20: QNH window Multi Radar Display 3 4.3.8 User Manual - 28 - Map layers window To display the Map layers window, click “Window” in the Menu, then select “Map layers” or just press Ctrl+Shift+L or press the appropriate icon in the toolbar. Figure 4-21: Select Map layers window The Map layers window shows all layers that are enabled in the coastline map editor (see 5.3). You can simply turn each layer on or off separately by clicking the tick box. Figure 4-22: Maplayers window 4.3.9 Shortcut bar To display the Shortcut bar, click “Window” in the Menu, then select “Shortcut Bar” or just press Ctrl+Shift+B or press the appropriate icon in the toolbar. Figure 4-23: Select Shortcut Bar Figure 4-24: Shortcut bar The shortcut bar contains the different shortcuts as displayed above. The left block (red) are zoom options and configurable in the MRD.ini file. The other buttons are not configurable. In this shortcut bar, “Grid” enables or disables the grid of the compass view as explained in paragraph 4.3.2. Multi Radar Display 3 User Manual - 29 - In Figure 4-24: Shortcut bar, 6 zoom positions are default configured: Centre S.E. (South-East) N.E. (North East) Zoom 4 Zoom 5 Zoom 6 These zoom positions can be configured in the following way: Right click on a zoom-button and you will have the following possibility to “Rename” and to “Link to current zoom”. Figure 4-25: Change zoom settings When rename is chosen, you simply can type a new name for that button. (limited to 7 characters) Figure 4-26: Rename the zoom button When you then click to “link to current zoom”, the current position and zoom settings of the display will be saved to that zoom-button, resulting in the following shortcut bar: Figure 4-27: Zoom button "South" Multi Radar Display 3 4.3.10 User Manual - 30 - MRD3 About window - licenses To display the MRD3 About window, click “Help” in the Menu, then select “MRD About”. A dialog as in Figure 4-28 will open. The MRD3 can be licensed in 2 ways: MRD3 Lite: only 1 digital, 1 video, 1 vector and 1 status layer can be displayed. As soon as a second layer is created (See 5.1.1), a message as in Figure 4-29 will be displayed. MRD3: the full 6 layers can be used for each data type (digital/video/vector/status) Figure 4-28: MRD3 v3.7.2 registered to name "radar" and customer “Intersoft Electronics” Figure 4-29: Software not registered message Multi Radar Display 3 User Manual - 31 - 5. MRD3 Configuration 5.1 Options To configure the MRD3 software select “Options…” from the Configuration menu or press the “Options” button from the application toolbar. Figure 5-1: Select the options menu The options dialog appears. It has 3 sections: “General”, “Data Sources” and “Appearances”. All settings made can be saved in a configuration file. There are 2 possibilities to save: Save Configuration as current: to save as the current active configuration file Save Configuration as custom: (Ctrl+S) to save as another configuration file When you save the configuration with another name, the following window will prompt: Figure 5-2: Save configuration as To load a configuration, click the “Load configuration” option. The following window will prompt: Figure 5-3: Load configuration Multi Radar Display 3 5.1.1 User Manual - 32 - General options To enter the general section of the Options dialog press the “General” top left side of the dialog window. button on the Figure 5-4: Options dialog “General” section In the “General” section the following items are available for configuration: Default Configuration: This is the configuration that is loaded at start-up, a list is shown with all available configurations. You may select a configuration simply by clicking the desired configuration’s name in the selection list. The configuration files are located in C:\Program Files\Intersoft Electronics\RASS\RASS-R\MRD\UserPrefs. Multi Radar Display 3 User Manual - 33 - Configured Displays: The MRD3 is a multi radar display. This means it can display different data sources from different data types. There are 4 different data types: o Digital stands for Target data, Track data or Plot data. o Video is digitized video data from radar o Vector is used for all kinds of vector drawing; this is mainly used for displaying weather data. o Status is used for radar service messages. These messages are displayed in a separate window. To each data type (Digital/Video/Vector/Status) you can assign a number of layers. Though, the MRD3 can only display 6 data sources per data type simultaneously. In the example below, 6 digital layers are created for the data source “Digital”, 5 layers for a Video type and 2 layers for Vector type. Figure 5-5: Configure display layers It is recommended not to create more layers than necessary because of memory and performance considerations. Recordings Path: This is a directory path where the MRD3’s recordings are saved. You may choose a different location for your convenience. Select an appropriate file length in “period” and the time that the files must be archived. Multi Radar Display 3 5.1.2 User Manual - 34 - Data Sources options To enter the data sources section of the Options dialog press the “Data Sources” button on the left side of the dialog window. Figure 5-6: Options dialog “Data Sources” section Once we have created a number of layers per data type in the “Data Sources” dialog (see previous paragraph), we now have to configure the data sources themselves! Connecting to a DHM server that is outputting data in D6 format will do this. Usage of the Discover button : The “Discover” function is exactly the same as the “DHM Discover” function in the DHM. (Available from DHM v.2.8.0, see user manual “IE-DHM-UM-v15.doc” or higher, paragraph “4.2.8.3. DHM Discover”) The MRD3 requires discover settings to determine on which Ethernet ports it must scan for available DHM Background Servers with output modules for a MRD3. First we click the “Add” button . We have to select the type of data source we want to configure. Suppose we select Digital. Figure 5-7: Selecting to Add a (digital) data source Now we get a dialog to connect to a DHM server. Multi Radar Display 3 User Manual - 35 - Figure 5-8: MRD data source dialog When you are connecting to a remote DHM server, type the IP address instead of localhost. When you are making a connection by using XMLRPC-protocol, type “xmlrpc://xxx.xxx.xxx.xxx:5005” where xxx.xxx.xxx.xxx is the IP address of the remote DHM server. Clicking the dropdown list on the “DHM IP” field, will show the following list or similar: Figure 5-9: DHM server selection There are 2 sections: Above the horizontal line: The list represents all active DHM servers on the network. (As a result of the DHM Discover function) Below the horizontal line: This list represents all DHM servers that were active in the past. (So not a result of the DHM Discover function) Multi Radar Display 3 User Manual - 36 - Then, select the appropriate DHM server where to take data from. Once the selection of the DHM server is made, the dialog will show all available digital data sources of the selected type (digital). Figure 5-10: Available digital data source selection In the figure above, on the local DHM server an “ADS-B OUTPUT” is available. By double clicking “ADS-B OUTPUT”, the source will be selected and its name will be put in the “Display Set-Up Name”-field. However, you will have the possibility to type your own name. Be aware that all spaces must be replaced by an underscore; otherwise an error dialog will prompt! (ADS-B_OUTPUT it is) Figure 5-11: Underscores instead of spaces! Finally, press to confirm your selection. Now, repeat these steps for every data source you want to select. Multi Radar Display 3 User Manual - 37 - Another example: select a video source on a DHM server that is running on another pc with IP address 192.168.0.106 on port 5570: Figure 5-12: Video source selection Finally, the Data Sources dialog can be as follows: Figure 5-13: Options dialog with 3 digital sources configured You may sort the data sources list by clicking in the column headers. The list used to assign data sources in the MRD3 “setup and analysis” window is ordered in the same way as selected here. Multi Radar Display 3 5.1.3 User Manual - 38 - Appearances options To enter the Appearances dialog press the “Appearances” button on the left side of the dialog window. Here we can configure the appearances of the Compass, Information windows and the Screen. Those adjustments are described below. Figure 5-14: Options dialog “Appearances” section Compass Ring has the following settings: Ring Colour: to define the colour of the compass Grid Colour: to define the colour of the grid (Grid can be enabled by pressing F6 as explained above) Size: this defines how much percent, beginning from the centre of the display area the compass will cover. (Min. value is 50%) Grid Lines: here one can set the number of grid lines that will be shown when F6 is pressed. Offset [Degrees]: determines the zero degree position of the compass. An offset of 10 means that the compass 0deg point is at 10 deg. Information window: those settings apply on the different information windows that can be put on top of the PPI. You can choose the following settings: Background colour Text colour Grid colour Opacity: this determines the general level of opacity. By setting this to for example 100, you can easily lay the Target Info Table or Micro Table over the current radar display. The maximum value is 254. For every information window on the PPI screen, you can also change the opacity by pressing the +/- keys. Multi Radar Display 3 User Manual - 39 - Figure 5-15: Opacity of 150 On-screen messages: to be applied on the text messages that appear on the screen. (for example: Radar Data Source time out [Digital - 5]) Text Colour X-position (%) Y-position (%) Screen: When Toggle Full Screen is pressed, you can choose whether to expand the display to the full resolution of the screen, or just to expand it to a predefined full screen resolution. (This is to fit easily all different kind of monitors). Override Full Screen: check the button to enable this feature Left: is the left position of the MRD3 Right: is the right position of the MRD3 Width: the MRD3’s width Height: the MRD3’s preferred height : When you first use the mouse to resize and replace the MRD3 window, you can read out that actual position by clicking Probe. Then the Left/Right/Width/Height values will correspond to the actual window setting. Background colour: change the background colour of the PPI Show logo: show or hide the logo in the PPI (see also explanation below) The screen settings will only take effect when the MRD3 is restarted! RBL (Range Bearing Line): Enable or disable one out of 5 possible Range Bearing Lines. Assign an appropriate colour to it. Enable or disable the “Show Long-Lat” position when the cursor is in RBL mode. How to show a logo in the MRD3? Configuring a logo is an expert setting! The logo must be a *.jpg file in the C:\Program Files\Intersoft Electronics\RASS\RASSR\MRD\Logos directory and the MDR.ini file needs following code: [Logo] List.<size(s)>=1 List 0.Name="*.JPG" List 0.XPos=0 List 0.YPos=99 List 0.Anchor=leftbottom Multi Radar Display 3 List 0.Oppacity=20 User Manual - 40 - Multi Radar Display 3 5.2 User Manual - 41 - Setup and analysis The “Setup and Analysis” window allows the user to assign the configured data sources to the available displays and to configure the specific data sources parameters. The “Setup and Analysis” window also provides analysis windows to inspect the data from the specific data sources. To open the “Setup and Analysis” window select “Setup and Analysis…” from the Configuration menu or press the “Setup and Analysis” button from the application toolbar. Figure 5-16: Selecting the “Setup and Analysis…” menu The “Setup and Analysis” window has 4 tabs, each representing a display type i.e. Digital, Vector, Video and Status. When no layers are configured, the following window will appear: Figure 5-17: Setup and analysis window Multi Radar Display 3 5.2.1 User Manual - 42 - Setup and analysis: digital The digital section of the window allows the user to assign digital data sources to the available digital displays. The number of available digital displays is configured in the options window. (Maximum 6) Figure 5-18: Setup and Analysis - digital Table 5-1 shows an overview of the digital display options. Table 5-1: Digital display options Item On Focus Display setup Selection Info History Histogram Display list Usage The digital display is On (visible/checked) or Off (invisible/unchecked) Select between the Focus settings and normal settings. Select the data source to display or select <none>. Open the configuration window for the current data source. Open a selection information window to display the actual data message belonging to a target. Opens a history window for analysis Opens a histogram window for analysis Opens a list of all current targets displayed for this data source To assign a data source to a display simply click on the Configuration dropdown menu and select the data source you want to display. Figure 5-19: Assigning a digital data source Multi Radar Display 3 5.2.1.1 User Manual Display setup There are 2 ways to open the “Display setup”-window: By clicking the “Display setup”-button or By clicking the button for the layer of interest in the setup toolbar The result is both the same: Figure 5-20: Display setup window The digital “Data Setup”-window has a menu bar which allows the user to save and load digital data source configurations and to revert the settings back to factory defaults (see figure below). These settings are similar for the vector, video and status window setup. Figure 5-21: Factory Defaults Further on there are 5 different tabs: Table 5-2: Digital data source configuration overview Tab General (Focus) General Symbol (Focus) Symbol Special Filter Usage Specify digital data source items their visibility and dimension; specify the data labels per target report. These settings are active when the “Focus” checkbox is checked on the Setup and Analysis window. Same functionality as “General” but these settings are used when the “Focus” checkbox is unchecked. Determine the symbol and colour per target type. These settings are active when the “Focus” checkbox is checked on the Setup and Analysis window. Same functionality as “Symbol” but these settings are used when the “Focus” checkbox is unchecked. Specify timing source, coordinates, label font and size. Specify filter options - 43 - Multi Radar Display 3 5.2.1.1.1 User Manual - 44 - General tab Figure 5-22: General tab The general tab has several configurable items for the digital data source. Rings & Spokes: Determine the size and look of the range rings, within a certain Range Limit. Visible: turn on or off the Digital Data, Rings & Spokes, Sector Line, Data Block or Filter tab. The sector line is automatically clipped after some zooming factor. Label data block: Each target report has 3 labels that may be assigned to it, determine here which data items you wish to see, out of the following list: Figure 5-23: Label information o Mode C Flight Level [FL]: from data field ASTERIX I001/090, I048/090, I011/093 o Mode C Altitude [ft] or [100ft]: from data field ASTERIX I001/090, I048/090, I011/093 o 3D Height: 3D PSR height from ASTERIX I048/110 or Geometric altitude from ASTERIX I021/140 Multi Radar Display 3 User Manual - 45 - o UTC [h:m:s]: is the Time Of Detection (TOD) from the data o Delay [s]: is the difference between TOD and Time Of Recording (TOR). In case a file (edr/D6/S4) is replayed, the original TOR from the recording will be used to calculate TOD-TOR=Delay. In case the data is output and input again, for example on UDP or with a UDR600, the TOR is time stamped according to the current pc-time, which will correspond to the actual delay of the replay. It is important to have the RASS-R pc, where the recordings are made, time synchronized with the radar. (For example by NTP) In this case, the delay will show the accurate value. In case of a discrepancy between the pc-time and UTC time, high or even negative delays can be displayed. o Mode5 PIN NO; Mode5 PIN; Mode5 NO; from ASTERIX CAT48 SP data field. Military M5 custom content is manufacturer dependent and set by the SP type field in DHM CAT34/48 Convert module. See DHM UM for further details. Trailing: set the size of the trailing history dots. Colour Mode: not yet implemented. Whether the settings from General (Focus) or General are applied, only depends on the Focus checkbox! Multi Radar Display 3 5.2.1.1.2 User Manual - 46 - Symbol tab The target types are determined by the DHM during the radar data conversion. The list is thus dependent on the type of the originating data and is dynamically fetched from the DHM. Use the Symbol box to select a symbol for the accompanying target type. The S colour determines the symbol colour and the D colour determines the colour of the labels. Figure 5-24: Digital data source symbols A complete list of targets can be found below: PSR Only SSR Only Mode S Only All Call Mode S Only Roll Call Combined PSR + SSR Combined PSR + Mode S All Call Combined PSR + Mode S Roll Call PSR Only Test Target SSR Only Test Target Mode S Only All Call Test Target Mode S Only Roll Call Test Target Combined PSR + SSR Test Target Combined PSR + Mode S All Call Test Target Combined PSR + Mode S Roll Call Test Target SSR Only SPI Mode S Only All Call SPI Mode S Only Roll Call SPI Combined PSR + SSR SPI Combined PSR + Mode S All Call SPI Combined PSR + Mode S Roll Call SPI SSR Only Emergency Mode S Only All Call Emergency Mode S Only Roll Call Emergency Combined PSR + SSR Emergency Combined PSR + Mode S All Call Emergency Combined PSR + Mode S Roll Call Emergency Coasts PSR Only Reflection SSR Only Reflection Multi Radar Display 3 User Manual - 47 - Whether the settings from Symbol (Focus) or Symbol are applied, only depends on the Focus checkbox! 5.2.1.1.3 Special tab Figure 5-25: Digital data source special items The special tab contains the following items: Sector timing: determines the display’s update rate. Either the display is updated via sector messages received in the radar data stream or internally generated, then the radar rotation is simulated and dummy sector messages are generated which cause the display to refresh its screen and draw the targets. There are 2 more options (slave to…) which are currently under development and not yet functional. Location: specifies the geographic coordinates of the radar centre (WGS-84 and 1mdeg resolution). When coordinates are typed as decimal degrees they will automatically be converted into degrees, minutes and seconds. Lock: when Lock is checked, and on the condition that the ASTERIX CAT034(120)3D Position of Source Data is available, the digital layer center point can be locked to the coordinates provided in CAT034(120). Label: allows the user to change the look and rotation of the target labels. (for example Arial, Helvetica). The rotation of a label can be individually changed by selecting a target and rotate it using the scroll wheel of your mouse. North Alignment: changes the north alignment of the targets. This is only possible for X/Y data and not for longitude/latitude data (for example MODE-S or ADS-B) Resolution is 1mdeg. Data Integrity [s]: specifies a timeout in seconds. Upon expiration, a service message is displayed if no data was received for a particular digital source. Figure 5-26: Data source timeout Multi Radar Display 3 5.2.1.1.4 User Manual - 48 - G-Filter tab Figure 5-27: G-Filter tab The G-filter or General-filter can be used to filter on the D6 data fields. It is only possible of course to filter on an item that is available in the D6 data. When you click the pencil button , the filter editor opens: Figure 5-28: G-Filter editor The filter editor is self-explanatory: select a type to filter on, a proper condition and a logical relation between types. Finally, after pressing OK, you will see the result appearing in the filter pane. Multi Radar Display 3 User Manual - 49 - Different filter actions can be chosen: Off: Filtered is turned off Flag: data that meets the filter condition(s) is greyed out Skip: data that meets the filter condition(s) is not displayed 5.2.1.1.5 S-filter tab Figure 5-29: S-Filter tab The S-filter or Specialized-filter can be used to filter on every data item according to the ASTERIX UAP. At this moment, the S-filter is only available (selectable) for ASTERIX CAT001 and CAT048. The difference with the G-filter is that you can filter on more fields than there are available in the D6 data, for example: “Show only targets that have Enhanced Surveillance Function enabled”, or “only targets that contain BDS40 information”. The S-filter is the same as the filter in the AsterixCat001Convert and AsterixCat048Convert in the DHM. Therefore, it is important that on the pc where you run the MRD3 on, you also need to install the DHM, because the MRD3 takes the filter engine from the DHM! First of all, select on which ASTERIX data stream you want to create a filter on, by using the dropdown list: (Cat034 not implemented.) When you then click in the filter field or on the pencil button Figure 5-30: S-Filter editor , the filter editor opens: Multi Radar Display 3 User Manual - 50 - The filter editor is self-explanatory: select a type to filter on, a proper condition and a logical relation between types. Finally, after pressing OK, you will see the result appearing in the filter pane. Some useful examples in the MRD3: Display only targets with an Azimuth >=180: Figure 5-31: S-filter, condition and result 1 Search for Aircraft ID that contains [EXS]: Figure 5-32: S-filter, condition and result 2 Multi Radar Display 3 5.2.1.2 User Manual - 51 - Selection Info Suppose we use the selection tool to select the following (ADS-B) target: Figure 5-33: Select a target to Display Info The data of this target can also be viewed in the “Display Info” window that can be opened by clicking on the “Selection Info” button. In this window you will see the data in text or HEX format. The origin of data will depend on the data type. Figure 5-34: Example of ADS-B data (ASTERIX Cat021) When multiple targets (maximum 50 for every layer) where selected, use the drop down list. Figure 5-35: Selected targets Multi Radar Display 3 5.2.1.3 User Manual - 52 - History Info Open the “Display History” window by clicking the button. The window in the figure below will be shown. The following parameters can be set: History length: the number of scan to represent the history for (default 20) Type of history: select what history you want to see based per scan The graph type: history window (per scan), histogram window or both Figure 5-36: Display History default screen Suppose we want to see the Display History for “Target Reports/scan” in a combined window, then the next graph will be displayed as soon as the MRD3 displays targets: History window 1 2 345 Y=#reports X=scan number 4 1 Y=scan number Histogram window 5 2 3 X=#reports Figure 5-37: Display History "Target Reports/Scan" The following number of bars in the “History Window” corresponds to the bars in the “Histogram Window”: Table 5-3: History-Histogram explanation Bar number 1 2 3 4 5 History Window 15th scan +/- 20 targets 16th scan +/- 50 targets 17th scan +/- 55 targets 18th scan +/- 20 targets 19th scan +/- 41 targets Histogram Window Around 20 targets were measured a first time Around 50 targets were measured a first time Around 55 targets were measured a first time Around 20 targets were measured a second time Around 41 targets were measured a first time Multi Radar Display 3 5.2.1.4 User Manual Histogram info Open the “Display History” window by clicking the be set: - 53 - button. The following parameters can Data Source: different data sources are possible Bin size: number of bars on the X-axis in which the information is divided (between 5100) History Length: number of scans Scale: o Absolute: measured against the Y-axis scale in number of scans o Relative: measured against the Y-axis scale in percentage of scans (see further for example) o Cumulative: new measurements are added to the previous value (see further for example) Cumulative is only meaningful when relative is selected. X-axis scale: depends on the Data Source selected Figure 5-38: Display Histogram default screen Suppose we want to see a histogram of the velocity. As soon as the MRD3 displays targets, the graph will be filled up. Note that the X-axis scale changed to 700knots maximum since we selected Velocity as the data source. Figure 5-39: Display Histogram "Velocity" Multi Radar Display 3 User Manual - 54 - What is the relation between the relative view and the relative-cumulative view? Consider the figure below. Let us compare both views but only the first 3 bars (figures are approximations): In the left window, you see 6% at 2500ft, 8% just below 5000ft and 7% just above 5000ft. In the middle window, you see that the first bar at 2500ft corresponds to 6%, the second bar just below 5000ft corresponds 14% (cumulative: 6+8), the third bar corresponds just above 5000ft corresponds to 21% (cumulative: 14+7) and so on. In the right window, we can interpret the graph: 50% of the planes fly below 25000ft. Figure 5-40: Cumulative – Relative 5.2.1.5 Display List When you open the Display list by clicking the button, a window listing all targets currently displayed, filtering conditions excluded (see 5.2.1.1.4), will pop-up. Figure 5-41: Display List window This list can be sorted on each column, by clicking on its header cell Multi Radar Display 3 5.2.2 User Manual - 55 - Setup and analysis: Vector The vector section of the window allows the user to assign vector data sources to the available vector displays. The number of available vector displays is configured in the options window. (Maximum 6) Figure 5-42: Setup and Analysis - vector Table 5-4 shows an overview of the vector display options. Table 5-4: Vector display options Item On Focus Display setup Usage The vector display is On (visible/checked) or Off (invisible/unchecked) Select between the Focus settings and normal settings Select the data source to display or select <none>. Open the configuration window for the current data source. To assign a vector source to a display simply click on the Configuration dropdown menu and select the data source you want to display. Figure 5-43: Assigning a vector data source Multi Radar Display 3 5.2.2.1 User Manual - 56 - Display setup The display setup window for vector data is similar to digital data. 5.2.2.1.1 General tab The general tab has several configurable items for the vector data source. Colour palette: assign different colours to the different intensity levels that are available in the data. For example: if an ASTERIX CAT008 data stream contains 8 intensity levels, they can be configured according the settings below. Maximum 256 levels can be configured. Visible: make weather data visible or not Fill: fill the contours in case contour weather data is displayed. Figure 5-44: General tab vector Whether the settings from General (Focus) or General are applied, only depends on the Focus checkbox! Multi Radar Display 3 5.2.2.1.2 User Manual - 57 - Special tab The special tab has several configurable items for the vector data source. Figure 5-45: Special tab vector Location: specifies the geographic coordinates of the radar centre (WGS-84 and 1mdeg resolution). When coordinates are typed as decimal degrees they will automatically be converted into degrees, minutes and seconds. Data Integrity [s]: specifies a timeout in seconds. Upon expiration, a service message is displayed if no data was received for a particular vector source. Figure 5-46: Vector data timeout Multi Radar Display 3 5.2.3 User Manual - 58 - Setup and analysis Video The video section of the window allows the user to assign video data sources to the available vector displays. The number of available video displays is configured in the options window. (Maximum 6) Figure 5-47: Setup and Analysis - video Table 5-5 shows an overview of the vector display options. Table 5-5: Video display options Item On Focus Display setup Usage The video display is On (visible/checked) or Off (invisible/unchecked) Select between the Focus settings and normal settings Select the data source to display or select <none>. Open the configuration window for the current data source. To assign a video source to a display simply click on the Configuration dropdown menu and select the data source you want to display. Figure 5-48: Assigning a video data source Video is automatically clipped (i.e. not displayed anymore) after a certain zooming factor. Multi Radar Display 3 5.2.3.1 User Manual - 59 - Display setup The display setup window for video data is similar to digital data. 5.2.3.1.1 General tab Most of the settings are similar to the tabs discussed for the Digital Data Source. Only the differences are described in this section. Fading: means how many percent of the previous drawn line must fade out when a new line will be drawn. A low percentage will have a kind of eraser effect on the screen. A high value will have a kind of after-glowing effect. Range (NM): define the range of video data to be displayed. Colour: o o o o Brightness: defines the brightness of the video data Interpolate: must be turned on Colour setting upper: actual video data Colour setting lower: reference colour Figure 5-49: Configuring a Video Data Source Whether the settings from General (Focus) or General are applied, only depends on the Focus checkbox! Multi Radar Display 3 5.2.3.1.2 User Manual - 60 - Special tab The special tab has several configurable items for the video data source. Figure 5-50: Video special tab Location: specifies the geographic coordinates of the radar centre (WGS-84 and 1mdeg resolution). When coordinates are typed as decimal degrees they will automatically be converted into degrees, minutes and seconds. Data Integrity [s]: specifies a timeout in seconds. Upon expiration, a service message is displayed if no data was received for a particular video source. Figure 5-51: Video data timeout Multi Radar Display 3 5.2.4 User Manual - 61 - Setup and analysis: Status The Status section of the window allows the user to assign Status data sources to the available status displays. The number of available status displays is configured in the options window. (Maximum 6) Figure 5-52: Setup and Analysis - status Table 5-6 shows an overview of the status display options. Table 5-6: Status display options Item On Focus Display setup Usage The status display is On (visible/checked) or Off (invisible/unchecked) Select between the Focus settings and normal settings Select the data source to display or select <none>. Open the configuration window for the current data source. To assign a status source to a display simply click on the Configuration dropdown menu and select the data source you want to display. Figure 5-53: Assigning a status data source Multi Radar Display 3 User Manual - 62 - Status data will be visible in the MRD3 in the following window: Figure 5-54: Status data Different status messages (for example from an ASTERIX CAT002 or 034 data stream) will be displayed in a text window. Multi Radar Display 3 5.2.4.1 User Manual - 63 - Display setup The display setup window for status data is similar to digital data. Figure 5-55: Status display setup Data Integrity [s]: specifies a timeout in seconds. Upon expiration, a service message is displayed if no data was received for a particular status source. Figure 5-56: Status data timeout Multi Radar Display 3 5.3 User Manual - 64 - Map Editor The map editor allows the user to define a custom map to his preference. A map is constructed out of different layers and each layer can be customized. The defined layers can then easily be switched on and off by the user in the MRD3 main window. Open the Map Editor by clicking map editor” from the menu bar. in the toolbar or by selecting “configuration->coastline Figure 5-57: Map Editor - general overview 3 Main fields are visible to use for editing the map (Marked red on the figure above). Multi Radar Display 3 5.3.1 User Manual - 65 - Zoom toolbar The Zoom toolbar contains functions to manipulate the display area. Figure 5-58: Zoom toolbar The table below shows an overview of the Zoom/Select toolbar’s functionality Table 5-7: Zoom toolbar overview Button Pan Zoom Zoom out Zoom in Home 5.3.2 Usage Switch the display to pan mode, use the cursor to move the display area around Switch the display to Zoom mode, use the cursor to zoom into areas of interest Zoom out progressively until maximum viewing area is visible Zoom in progressively until maximum zoom (highest level of detail) is reached Switch back to default zoom (-500) and centre Map Centre First set the map centre, this will affect all other configuration items which all refer to the map centre. There are two fields to configure the map centre position i.e. Longitude and Latitude. The MRD3 accepts 2 WGS-84 coordinate formats with resolution of 1mdeg: decimal degrees and degrees, minutes and seconds values. In order to minimize the distortion of radar map circles due to the projection method used, take the map center as much as possible in the center of the complete map. This becomes important when you are displaying for example large areas > 1000NM. Multi Radar Display 3 5.3.3 User Manual - 66 - Items This tree view shows a number of configurable map layers, use this field to enable or disable map layers. Only map layers that have been enabled here can later be switched on/off in the main window. If an item shows a [+] sign click on it to extend the list, this means you can configure more than one layer with this specific item. A map can be constructed out of the following items: Table 5-8: Map Editor Items Name Airports #Layers (default) 3 Air routes Coastlines Cities DTED screening Graticule Navaids Open Air Runways SCF Waypoints 6 2 3 6 1 1 3 1 6 6 Description Detailed airport maps (runways, taxiways, buildings) Upper and lower air routes Country border lines City centres Digital Terrain Elevation Data Long-Lat grid Navigation Aids (VOR-DME, NDB, …) Airspace description files Runway and runway centrelines Surveillance coordination function Upper and lower airway-waypoints To enable a map layer item in the Item window, double click it so that the -icon appears in front of it. The number of layers that are available for a single item is configurable in the ini-file of the specific map item. These can be found in the following directory: C:\Program Files\Intersoft Electronics\RASS\RASS-R\MRD\Map PlugIns To change for example the number of Airport layers from 3 to 6, open the Airport.ini file in Notepad and change the number of layers to 6 in [Object Config]. Then save the file and reload the Airport tree in map editor. Do a similar action for the other map editor items. Figure 5-59: Airport.ini file and result Multi Radar Display 3 5.3.4 User Manual - 67 - Item Configuration When you select an item, the item’s configuration window will be shown. Here, you can configure that specific Item. To enable a map layer for the specific item, double click it so that the -icon appears in front of it. The enabled map layers can then later be switched on/off in the main MRD3 window. You may choose to give the map layer a custom name by editing the “Map Layer Label” field in the bottom of the item configuration area. After making changes to the different items the buttons “Apply” and “OK” become high lighted. Pressing the “Apply” button will transfer the map settings to the main MRD3 window and leave the map editor open. Pressing the “OK” button will transfer the map settings to the main MRD3 window and close the map editor. Pressing the “Cancel” button will close the map editor without transferring the changes. After map changes are transferred to the main MRD3 window you will have to save the current configuration in order to make them permanent. In the next paragraphs, the different map layer items are explained. Multi Radar Display 3 5.3.5 User Manual - 68 - Airports Item The airports item allows the user to show detailed drawings of airfields and their surroundings. Custom airport drawings can be distilled from airport CAD drawings (please contact Intersoft Electronics for details about this procedure). By default there are 3 airport layers defined in the map editor. This value may be edited in the airport.ini file located in the <c:\program files\Intersoft Electronics\rass\rass-r\MRD3\map plugins> directory. Change the value for “repeat” under the section [Object Config] to the desired number of layers. The figure below shows the map editor with a detailed map of Zaventem (Brussels Airport, Belgium). in this example 3 airport layers are used each with a different colour for each submap of the airport. Figure 5-60: Map Editor - airports To select an airport detail map, simply double click on the map name in the “Airport Selection” list, the -icon indicates a selected (sub) map. Multi Radar Display 3 5.3.6 User Manual - 69 - Airroutes Item The Air routes item allows the user to show upper- and lower air routes. The air route files are divided per country. If your country is not listed in the file selection list please contact Intersoft Electronics. By default there are 6 air route layers defined in the map editor this value may be edited in the airroutes.ini file located in the <c:\program files\Intersoft Electronics\rass\rass-r\MRD3\map plugins> directory. Change the value for “repeat” under the section [Object Config] to the desired number of layers. The figure below shows the map editor with a map of Belgium and all upper air routes for Belgium and their label. Figure 5-61: Map Editor – airroutes To select a specific air route file click on the “browse” button in the “AirRoute File” section, a standard file dialog box will appear. Navigate to the <c:\program files\intersoft electronics\rass\maps\airroutes> directory and select the file you would like to use. The files are organized per country in upper and lower air routes. After you have selected an air route file you can select the air routes that you would like to display. First enter a range (calculated from the map centre) in the “Air routes Attributes” section and then select/deselect the air routes of interest in the “Air routes Selection” section. Multi Radar Display 3 5.3.7 User Manual - 70 - Cities The Cities item allows the user to show city centres on the display. By default there are 3 city layers defined in the map editor. This value may be edited in the “Cities.ini” file located in the < C:\Program Files\Intersoft Electronics\RASS\RASS-R\MRD\Map PlugIns > directory. Change the value for “repeat” under the section [Object Config] to the desired number of layers. Figure Figure 5-62 shows the map editor with all cities in a range of 250NM around the map centre displayed in red. Figure 5-62: Map Editor - Cities First enter the desired range and type of cities to select from. The Cities Selection list is loaded based on these settings. By default all cities within range will be selected. Deselect the cities that you don’t want to display, by double clicking them. Finally choose a color and whether you want to show the city name. MRD3 comes installed with a predefined list. You can update this list by editing ”Cities.txt” in the < C:\Program Files\Intersoft Electronics\RASS\Maps\arpts-rwys > folder. Multi Radar Display 3 User Manual - 71 - Figure 5-63: Cities.txt Each line in the file represents one city structured by “[label],[type],[Latitude],[Longitude]”. [Label] for the City Name [Type] with 1 = Capitals, 2 = Major Cities, 3 = Cities, 4 = Towns, 5 = Villages [Latitude],[Longitude] in decimal degrees Multi Radar Display 3 5.3.8 User Manual - 72 - Coastline Item The coastline item allows the user to select country borders. By default there are 2 coastline layers defined in the map editor, this value may be edited in the coastline.ini file located in the < C:\Program Files\Intersoft Electronics\RASS\RASS-R\MRD\Map PlugIns > directory. Change the value for “repeat” under the section [Object Config] to the desired number of layers. Figure 5-64 shows the map editor with the country borders of Belgium and surrounding countries. The borders from Belgium and Luxembourg are highlighted. This is established by defining Map layer coastline_2 to show only Belgium and Luxembourg in a brighter colour than the settings in Map layer coastline_1 where the surrounding countries are selected. Figure 5-64: Map Editor - Coastline First enter an appropriate range in the “Range” field in the “Filter Selection List” section, to show the names of the countries in a range from the map centre. Then select the countries from the “Map Selection” section and define the colour for the borders. Multi Radar Display 3 5.3.9 User Manual - 73 - DTED Screening The Digital Terrain Elevation Data (DTED) item allows the user to select screening files containing the line of sight for different altitudes for specific radar. The DTED screening files can be obtained from Intersoft Electronics or generated with the RASS-R Coverage Map Calculator. The screening files take into account the antenna elevation, radio wave bending and earth radius (4/3 model). They however don’t take into account the power budget of the radar and the actual atmospheric conditions. Figure 5-65 shows the map editor with a screening up to FL250 for the Saint Hubert radar, Belgium. Figure 5-65: Map Editor – DTED Screening Select the screening file directory with the screening files of interest by pressing the “browse” button in the “DTED Screening Attributes” section. After the directory has been selected click on the buttons next to the Flight Levels in the same section to draw the line of sight for this specific Flight Level. Select a custom colour if necessary. Multi Radar Display 3 User Manual - 74 - Remark the following: When you want to select a screening file, it is necessary to select the directory that contains both .hrscr and .par files instead of selecting an individual file. The reason is that the MRD3 Coastline Map Editor needs to read the .par file to know the correct position of the screening file. Second remark is that this directory should have the same name as the files in it! Figure 5-66: Folder selection DTED Multi Radar Display 3 5.3.10 User Manual - 75 - Graticule Item The graticule item allows the user to draw a longitude and latitude grid on the current map. The figure below shows the map editor with a map of central Europe and a graticule grid with a range of 250NM from the map centre. Figure 5-67: Map Editor - Graticule Select the desired range (in nautical miles) by entering the range in the “Range” field in the “Graticule attributes” section. Select the colour for the graticule with the “colour” select box. Multi Radar Display 3 5.3.11 User Manual - 76 - Navaids Item The Navaids item allows the user to select navigation aids, such as NDB, VOR, DME etc. to be drawn in the map with their specific symbol. By default there is only one Navaids map layer defined, this value may be edited in the navaids.ini file located in the <c:program files\intersoft electronics\rass\rass-r\MRD3\map plugins> directory. Add a [Object Config] section and add a field “repeat=N” where N is the desired number of layers. This feature can be useful if you wish to depict different navaids in different colours. Or if you want to have two layers one with labels and one without so that you can easily switch labels on and of in the MRD3 main window. The figure below shows the map editor most navigation aids of Belgium selected. Figure 5-68: Map Editor - Navaids First enter an appropriate range in the “Range” field in the “Filter Selection List” section, to show only those navigation aids within a certain range from the map centre. You may also wish to filter the list on a certain navigation aid type, do this by selecting the desired type in the “Type” field in the “Filter Selection List” section. Now select the navigation aids of interest, select drawing colour and a label position. The label shown is the international abbreviation of the selected navigation aid. Multi Radar Display 3 5.3.12 User Manual - 77 - Obstacles The Obstacles item allows the user to select obstacles to be displayed, such as Pylon, Chimney and Windmill. By default there is only one Obstacles map layer defined, this value may be edited in the obstacles.ini file located in the <c:program files\intersoft electronics\rass\rass-r\MRD3\map plugins> directory. Add a [Object Config] section and add a field “repeat=N” where N is the desired number of layers. This feature can be useful if you wish to depict different obstacles in different colours. Or if you want to have two layers one with height labels and one without, this way you can easily switch height labels on and of in the MRD3 main window. The figure below shows the map editor with a map of Belgium and some fictional obstacles. Figure 5-69: Map Editor - Obstacles Multi Radar Display 3 User Manual - 78 - The obstacles definition file (OBSTACLES.TXT) is located in the <c:\program files\intersoft electronics\rass\maps\arpts-rwys> directory. This is a tab-delimited file with the following structure: Table 5-9: Obstacles definition file structure Altitude (msl) 1096 948 648 293 TYPE 1 2 2 3 WGS_DLAT 50.45 50.3 50.31 50.6 WGS_DLONG 4.33 4.5 4.5 4.43 NAME test 1 test 2a test2b test 3 For each obstacle enter an altitude in feet above mean sea level, the type : 1) pylon, 2) windmill and 3) chimney followed by the latitude and longitude in decimal degrees and finally a name for the obstacle. The obstacles be selected in the “Obstacles Selection” section; First enter an appropriate range in the “Range” field in the “Filter Selection List” section, to show only those obstacles within a certain range from the map centre. You may also wish to filter the list on a certain obstacle type, do this by selecting the desired type in the “Type” filed in the “Filter Selection List” section. Now select the obstacle of interest, select a drawing colour and a label position. The label shown is the height information above mean sea level from the obstacle. Multi Radar Display 3 5.3.13 User Manual - 79 - Open Air Item The Open Air item allows the user to select different airspaces to be displayed. You may also depict custom polygons and labels in a variety of colours. By default there are 3 open Air layers defined in the map editor, this value may be edited in the OpenAir.ini file located in the <c:\program files\intersoft electronics\rass\rass-r\MRD3\map plugins> directory. Change the value of “repeat” under the section [Object Config] to the desired number of layers. The figure below shows the map editor with detail airspace of the Belgian coast. Figure 5-70: Map Editor - Open Air Item Open Air is a terrain and airspace description language; the user can add or modify the data themselves, therefore having full control over what is being displayed. A description can be found on the Internet (http://www.winpilot.com/UsersGuide/UserAirspace.asp). First you have to choose the appropriate file path and select the correct “Open Air” map; browse to the directory <c:\program files\intersoft electronics\rass\maps \openair> and select the desired file, for example IE_Belgium.txt. Select the airspaces to be displayed and their colour. Take care that the colours selected here are not overridden by the “SB” (set brush) definition in the airspace definition file. Multi Radar Display 3 5.3.14 User Manual - 80 - Runways Item The Runways item allows the user to show runway drawings and runway centrelines on the map. By default there are 2 runway layers defined in the map editor this value may be edited in the runway.ini file located in the <c:\program files\Intersoft Electronics\rass\rass-r\MRD3\map plugins> directory. Change the value for “repeat” under the section [Object Config] to the desired number of layers. The figure below shows the map editor zoomed in on the military field of Beauvechain (Belgium) 2 runways are depicted and the main runway has a runway centreline. This is established by defining runway layer runways_2 to show only the main runway with runway centreline and defining runway layer runways_1 to show both runways without a centreline. This allows the user to easily switch the extended runway centreline on/off in the MRD3 main window. Figure 5-71: Map Editor - Runways First enter an appropriate range in the “Range” field in the “Filter Selection List” section, to show the runways in a range from the map centre. Then select the runways from the “Runway Selection” section and define the colour for the runway borders and fill. You may select to draw runway centrelines by selecting a colour other than “T” (transparent) from the colour selection box and by defining a centreline length. Multi Radar Display 3 User Manual How to find your runway description? A runway description consists of 2 strings: The ICAO airport identification name, for example: EBBE and the runway identification, for example: 24/6 The ICAO airport identification can be found in the following file: C:\Program Files\Intersoft Electronics\RASS\Maps\arpts-rwys\ARPT.txt (use Microsoft Excel to open the file). You can also find it back in the runway file: C:\Program Files\Intersoft Electronics\RASS\Maps\arpts-rwys\RUNWAY.txt (use Microsoft Excel to open the file). If there are wrong settings for a runway, or a new runway is implemented, you can easily change it in these .txt files. - 81 - Multi Radar Display 3 5.3.15 User Manual - 82 - SCF The SCF map displays surveillance maps. By default there are 6 SCF Map layers defined in the map editor. This value may be edited in the scf.ini file located in the <c:\program files\intersoft electronics\rass\rass-r\MRD3\map plugins> directory. Change the value for “repeat” under the section [Object Config] to the desired number of layers. The figure below shows the map editor with surveillance maps for Dusseldorf, Gatwick and Orly. Figure 5-72: Map Editor - SCF First select a SCF map directory by clicking on the “Browse” button in the “SCF Map Attributes” section. The SCF maps must be on in a directory accessible by the computer running the MRD3. They are NOT automatically retrieved from the radar. The SCF Map file type is described in detail in the POEMS ICD for SCF maps, the SCF map directory must contain the original cluster.dat and sysmatpxxx.dat files. The version and subversion of the sysmapxxx.dat file are displayed after selection. Multi Radar Display 3 5.3.15.1 User Manual - 83 - SCF Map Type The SCF map can be one of the four predefined SCF map types; Surveillance Maps, Data Link Maps, Lockout Maps or Intermittent Lockout Maps. Select the map type by clicking the “Type” drop down box. 5.3.15.2 SCF Map altitude and type SCF maps can be different for every “altitude band” of 200ft. The user can set the altitude for the displayed maps in the “Altitude” field. SCF maps also differ per SCF state, the state is the binary number representing a particular station’s participation in the cluster. Either selects the sysmap number or the state number by selecting “Sysmap” or “State” from the dropdown menu “Map/State” and then enter a number next to the field indicating either the sysmap number or the state. 5.3.15.3 SCF Setup To configure the SCF maps to be displayed and to set the display colours open the SCF setup window by pressing the “setup ” button next to the “Type” selector. The figure below shows the SCF setup colour dialog window. Figure 5-73: Map Editor – SCF – SCF Setup Colour The “Grid Only” checkbox switches between solid coloured SCF map and a SCF grid map. Select the nodes to be displayed by shift-clicking their names in the “Node selection” list. This controls the topology of the map that is drawn. Only the nodes that are selected are included in the map. Typically the SCF map provides information about which station has coverage for a specific cell (one element of the SCF grid). A cell can have multiple station coverage (up to 6). The cell colour depends on the level of coverage. If the station has no coverage, the cell is black (not visible). If a cell has single coverage the colour of the “Sole Surv.” colour box is used for 2 radar coverage the “2 Surv.” colour box is used etc. Multi Radar Display 3 5.3.16 User Manual - 84 - Waypoints Item The waypoints item allows the user to show upper- and lower waypoints. The waypoint files are divided per country. If your country is not listed in the file selection list please contact Intersoft Electronics. By default there are 6 waypoint layers defined in the map editor this value may be edited in the waypoint.ini file located in the <c:\program files\Intersoft Electronics\rass\rass-r\MRD3\map plugins> directory. Change the value for “repeat” under the section [Object Config] to the desired number of layers. The figure below shows the map editor with a map of Belgium and all lower waypoint for Belgium and their label. Figure 5-74: Map Editor – waypoints To select a specific waypoint file click on the “browse” button in the “Waypoints File” section, a standard file dialog box will appear. Navigate to the <c:\program files\intersoft electronics\rass\maps\airroutes> directory and select the file you would like to use. The files are organized per country in upper and lower waypoints. After you have selected an waypoint file you can select the waypoints which you would like to display. First enter a range (calculated from the map centre) in the “Waypoints Attributes” section and then select/deselect the waypoints of interest in the “Waypoints Selection” section. Multi Radar Display 3 5.4 User Manual - 85 - Record and playback The MRD3 has a recording and playback function to make recordings of all data sources that can be displayed in the MRD3. A recording is made in a .db3 file and not in a separate .D6 file. So a .db3 file recorded with the MRD3, can only be replayed in the MRD3! Before we can start making a recording, you have to make sure that you selected a correct path for recording; and period and archive option for the files. (See paragraph 5.1.1) When opening the recorder window by clicking options to open), the following dialog appears: (see paragraph 4.1 and 4.2 for different Figure 5-75: Recorder This window gives the possibility to start duration of the recording. or stop a recording. The time will show the When opening the Playback window by clicking (see paragraph 4.1 and 4.2 for different options to open), the following dialogs appears, depending whether you are in “Live” mode or in “Replay” mode: Figure 5-76: LIVE mode Figure 5-77: REPLAY mode When you switch from LIVE mode to REPLAY mode, by clicking the upper leftmost button , you first have to select a path to the correct .db3 file for replay. When clicking a standard Windows dialog, you can browse to the correct path: , using Multi Radar Display 3 User Manual - 86 - Figure 5-78: Select a proper .db3 file When the file is a valid recording file, the PLAYBACK window will now load all layers that were active during the recording You have the possibilities to start , stop and pause the Replay, after which you can replay stepwise forward or backward by clicking on the next buttons: . (Stepwise according to sector information) The Playback window gives a scrollable list of all digital/video/vector/status layers that were enabled during the recording. You can assign again a data source to every layer for replay. These assignments will then also be put in the “setup and analysis window”. Look at the example below: During the recording, there were 6 digital layers enabled, but only 1 video en 1 vector layer. Assign RADAR3 to Digital layer -5 and RADAR4 to Digital layer - 6. Figure 5-79: Configuration of the replay Layer 5 and 6 will respectively display RADAR3 and RADAR 4, while layer 4 is left empty as in the dialog above! Figure 5-80: Replayed layers To go back to LIVE mode, simply click the upper leftmost button again . Multi Radar Display 3 User Manual - 87 - 6. Troubleshooting/Q&A Problem: I cannot see my digital targets on the display. Solution: Is the map centre setup correctly? (See 5.3 Map Editor) Does the data source setup have the correct coordinates? (See 5.2.1.1.3 Special tab) Make sure the data is sent to the MRD3 using a proper DHM configuration! You can always use a sniffer to verify. (e.g. Wireshark, download free on http://www.wireshark.org/) Problem: The MRD.ini file is messed up after changing something. Solution: You can repair the MRD.ini file using the repair option of the MRD3 installer: Figure 6-1: Repairing the MRD3 Problem: The default.ini file is messed up after changing something. Solution: First delete the default.ini configuration file from disk in the following path: C:\Program Files\Intersoft Electronics\RASS\RASSR\MRD\UserPrefs\default.ini When choosing “repair the MRD3” by means of the installer, it will restore the default.ini file. Multi Radar Display 3 User Manual - 88 - Problem: I cannot see my ADS-B targets? Solution: Since the ADS-B targets do not contain sector messages, the MRD3 has to generate its sector timing as explained in paragraph “5.2.1.1.3 Special tab”. For example, fill in a 4 or 10 seconds as revolution time. It is also not necessary to fill in the centre position of the ADS-B targets, since the MRD3 uses the long/lat position of the targets to display. In other words, the MRD3 cannot change the position of the ADS-B targets. Problem: I do an ADS-B extraction with a RIM782, but I cannot see the ADS-B messages as text in the “Selection Info Window”. Solution: This is because you send the ADS-B messages to the MRD3 without converting them to AsterixCAT021 first. Put an AsterixCat021Convert in between! Question: Do my own created preference files (i.e. MRD3 configuration) remain on disk after an uninstall of the MRD3? Answer: Yes, an uninstall of the MRD3 deletes the MRD.ini file and the default.ini file (in the folder C:\Program Files\Intersoft Electronics\RASS\RASS-R\MRD\UserPrefs) Your own UserPrefs files remain in this folder. Question: I created a map using the Map Editor but I still see contours of Central Europe and Belgium on the MRD3. Answer: As work-around, load the default coordinates in the MRD3 Map Editor again. (For example 4 degrees longitude and 52 degrees latitude) Now, disable all maps selected under item Coastline_1 amd Coastline_2. Press Apply. Then, reload the center point of the map again to the desired coordinates. Configure the proper coastlines again and press Aplly. After leaving the Map Editor, the map should be compiled with the proper contours now. Problem: Loading another configuration in the MRD3 results in a LabVIEW error. Answer: This is a known issue. Use the following work-around: Go to Options>General. In the General-tab, select the configuration you want to load as Default Configuration and press Apply. Close the dialog and shut down the MRD3. Restart the MRD3. It will now restart with the desired configuration. Multi Radar Display 3 User Manual - 89 - APPENDIX: SHORTCUTS Function Exit: Save configuration as custom Targetinfo Shortcut bar Maplayers bar Fullscreen Visible Toolbar Menu Status Pan Filter MicroTable QNH CompassGrid Turn left Turn Right Zoom out Zoom In Window centre Decrease the opacity of windows Increase the opacity of windows Shortcut Ctrl+Q Ctrl+S Ctrl+Shift+I Ctrl+Shift+B Ctrl_Shift+L Ctrl+Shift+F Ctrl+Shift+T Ctrl+Shift+M Ctrl+Shift+S Left/Right/Up/Down key Ctrl+F9 Ctrl+F7 Ctrl+F8 F6 Left key Right key Page Up Page Down Home button - button + button Note: The left and right keys are different when the compass grid is enabled using F6. Multi Radar Display 3 User Manual - 90 - GLOSSARY A ACP ARP B Buffer D D6 E EDR EDR V2 Ethernet Event F FIFO Flow control H Hex I I/O IP M MB Memory buffer P Path R Record RS323, RS422 T TCP Azimuth Count Pulse. Azimuth Reference or Reset Pulse. Temporary storage for acquired or generated data. Intersoft Electronics internal data Radar data format, plot or track based. Intersoft Electronics internal data format for record based data. Also stands for Extended Data Recorder, a device for generating and capturing serial data. Second version of the EDR format. A network specification developed by DEC, Intel, and Xerox which provides anywhere from 10 megabits to 1000 megabits per second transmission speeds. Event, signals occurrences between event source and receiving software module, Events include North, Time, ACP/ARP A first-in-first-out memory buffer. In a FIFO, the first data stored is the first data sent to the acceptor. A method of controlling when information is sent Hexadecimal. 16 based numbering system ranging from 0 to F Input/Output. The transfer of data to or from a computer system involving communications channels, operator interface devices, and/or data acquisition and control interfaces. An abbreviation for Internet Protocol, the basic network transmission protocol of the Internet. Megabytes of memory. See buffer. . A path can be described as a file’s address on your file system, describing where the file lives: An absolute path gives the complete path, starting at the root directory, or the very top of the file system; A relative path looks for a file from the directory you are currently in down. A collection of data forming a complete message. The Electronics Industry Association (EIA) has produced standards for RS232 and RS422 that deal with data communications. Transmission Control Protocol. A set of rules to exchange messages with other Internet points at the information packet level. Multi Radar Display 3 Timeout TTL TMD U UDP UTC User Manual - 91 - A timeout occurs when a device has waited too long for another device to send or receive a transmission. Time To Live. An internet header field, which indicates the upper bound on how long this internet datagram, may exist. Technical Maintenance Display User Datagram Protocol. A connectionless, unreliable Internet protocol. Coordinated Universal Time.