1
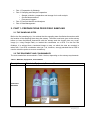
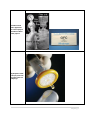
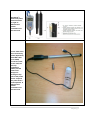
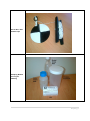
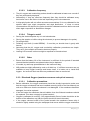
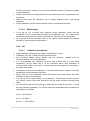
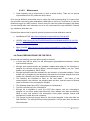
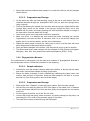
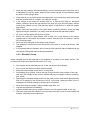
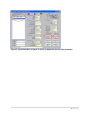
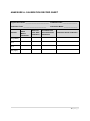
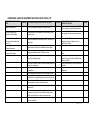
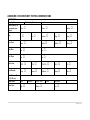
NATIONAL ESTUARIES MONITORING PROGRAMME Field Procedure Guide for Tier 1 Monitoring 2015 Prepared by: Jafta, N., Van Niekerk, H., Cilliers, G. and Majola, S. For Resource Quality Information Services Department of Water and Sanitation for use during field work TABLE OF CONTENTS 1. 2. OVERVIEW AND INTRODUCTION ........................................................................... 1 PART 1: PREPARATIONS PRIOR FIELD SAMPLING ............................................. 2 2.1. THE SAMPLING SITES .......................................................................................... 2 2.2. THE EQUIPMENT AND CONSUMABLES .............................................................. 2 2.3. CHECKING AND MAINTENANCE OF EQUIPMENT FOR FIELDWORK ............... 6 2.3.1. Operation of Equipment ................................................................................... 6 2.3.2. General calibration precautions and maintenance ........................................... 7 2.3.3. Dissolved Oxygen (membrane sensors and optical sensors) ........................... 8 2.3.4. pH .................................................................................................................... 9 2.3.5. Electrical Conductivity .................................................................................... 10 2.4. FINAL PREPARATIONS FOR THE FIELD ........................................................... 11 3.1. PART 2: FIELD SAMPLING .................................................................................... 12 FIELD READINGS AND MEASUREMENTS ......................................................... 12 3. 3.1.1. Visual Observations ....................................................................................... 12 3.1.2. Transparency or Secchi Depth Measurement ................................................ 12 3.1.3. Other Physico-chemical Variables ................................................................. 13 3.2. 4. SAMPLE COLLECTION, PREPARATION AND STORAGE PROCEDURE .......... 13 3.2.1. Nutrients ........................................................................................................ 13 3.2.2. Phytoplankton Biomass ................................................................................. 14 3.2.3. Microbial Counts ............................................................................................ 15 PART 3: POST FIELD ACTIONS AND SAMPLE ANALYSES ................................ 16 4.1. TRANSPORTATION OF SAMPLES ..................................................................... 16 4.2. DATA MANAGEMENT .......................................................................................... 16 ANNEXURE A: CALIBRATION RECORD SHEET ............................................................. 18 ANNEXURE B: SAMPLING EQUIPMENT AND PROCEDURE CHECK LIST ................... 19 ANNEXURE C: RECORD SHEET FOR FIELD OBSERVATIONS ..................................... 20 ANNEXURE D: LIST OF LABORATORIES TO BE CONTACTED FOR THE ANALYSIS OF SAMPLES .......................................................................................................................... 21 ii | P a g e 1. OVERVIEW AND INTRODUCTION This is a procedure guide for field sampling associated with the National Estuaries Monitoring Programme (NESMP). The NESMP monitoring is based on a 3 tiered approach, starting from the most basic national sampling to estuary specific protocols. Tier 1 will address the most basic water quality measurements, with the lowest production level of the biota (phytoplankton and microbes). The monitoring will be based on a build up of baseline data and for the understanding of long-term trends of the different types of estuaries. Monthly field sampling is a requirement for this Tier, unless at a later stage it is deemed to not yield significant differences in results (data) and has been proved to not be feasible. Tier 2 is the Resource Directed Measures’ (RDM) Ecological Water Requirements (EWR) determination protocol. It looks at the estuarine ecosystem’s abiotic and biotic relationship in more detail, to holistically understand the ecological health of each system. This type of monitoring is to be done every 3 to 5 years depending on estuary specific conditions and preferably to establish a long term trend analysis of ecosystem health in a specific estuary, to report on regional and national estuarine health; to feed into preliminary and comprehensive Reserve determinations; and to audit the success of Reserve implementation. This monitoring should make use of the RDM Monitoring protocol (WRC, 2003). In tier 3, situation specific information is collected with the following objectives in mind: proactive conservation planning; surveys for comprehensive Reserve determination purposes; reactive investigation of specific anthropogenic impacts e.g. artificial mouth breaching, pollution incidents, fish kills etc.; reactive audit of the success of remediation actions; and reactive investigations of natural phenomena e.g. floods, droughts etc. A monitoring or sampling protocol for this Tier has not been developed as it will be dependent on the objectives of the initiation of this Tier of estuary monitoring. This guide covers the sampling/monitoring of the Tier 1 parameters of the programme. There is already a guide that has been compiled for the RDM monitoring protocol (CSIR, 2003), which would be Tier 2 of the NESMP. As Tier 3 monitoring is a combination of variables from Tiers 1 and 2, this and the RDM guide should be used There are various steps to be followed when executing field sampling procedures. It is important to ensure that everything is in order before going to the field; i.e. all the required equipment is available and packed, you are familiar with the operation of all the equipment and you have checked that they are in good working condition. There are certain steps to be followed before going to the field, at the sampling sites (in the field), and after the sampling has been conducted. These steps and sampling procedures are explained in the subsequent sections under the following headings, of which Part 1 is a preparation for fieldwork, Part 2 is for during fieldwork and Parts 3 and 4 after the fieldwork: 1|Page Part 1: Preparation for fieldwork Part 2: Sampling and Sample Preparation o Sample collection, preparation and storage for/or until analysis o On-site Measurements o Permanent Loggers Part 3: Post field Actions and Analyses Part 4: Data Management 2. PART 1: PREPARATIONS PRIOR FIELD SAMPLING 2.1. THE SAMPLING SITES Before the first sampling trip, it is advised that the sampling team familiarise themselves with the location of the sampling sites along the estuary. The team must have gone to the estuary before or have familiarised themselves with the estuary and the chosen sites on a map, image (i.e. using Google Earth) or loaded the coordinates on a GPS. For the first few fieldtrips, it is advised that a laminated image or map, on which the sites are marked, is taken with, if no GPS coordinates exist yet. It is, however, strongly advised that a GPS is used to reach the points to ensure consistency. 2.2. THE EQUIPMENT AND CONSUMABLES The tools needed are summarised in Table 1 below, depending on the estuary requirements. Table 1: Materials, Equipment, Consumables Description Materials, Equipment, Consumables Calibration Standards 2|Page Portable hand filter apparatus for Chlorophyll-a and Box of GF/C Filter papers Hydrophilic PVDF 0.45 μm pore-size syringe filters on a Syringe 3|Page AquaRead’s meter and probe, with electrodes on right. A different but similar instrument can also be used. In-situ water level and conductivity probe (AquaTroll) with USB cable (Troll COM) connected, with, on the side, the Cal Cup (calibration bottle) and the Twist-Lock Hanger for sealing the top part of the probe and to suspend the probe with a cord/rope/wire. A different but similar instrument can also be used. 4|Page Secchi Disc with marked rope Sampling Bottles and Tag for labelling 5|Page 2.3. CHECKING AND MAINTENANCE OF EQUIPMENT FOR FIELDWORK Most of the equipment needed for the sampling will be supplied by the Department of Water and Sanitation (DWS), the Resource Quality Information Services (RQIS) unit. The continuously needed materials will be couriered or delivered to the relevant persons or organisations on a monthly basis or as a large stock to last a few months. 2.3.1. Operation of Equipment In most cases, the equipment that will be supplied for the field measurements is Aquameter’s meter and probe (the handheld instrument) and In-situ Inc.’s Aquatroll, Rugged Troll, Barotroll (the in-situ instruments), or CTD. Most of the guidelines for the operation, maintenance and calibration of the handheld and in-situ instruments form part of the packaging of the instruments as hard copies or are easily available from the manufacturers’ software or program discs as user guides. It is therefore crucial for the samplers to familiarise themselves with these guidelines, especially in the case of a different instrument being used. 2.3.1.1. Initial Set Up and Preparation of the Handheld AquaRead’s meter and probe, or a similar instrument, i.e. YSI, is used to take measurements of physico-chemical variables in the estuary water column. The Aquaprobe AP-700 and meter will be used mostly in the National Estuaries Monitoring Programme. The different electrodes in the probe that will be used to measure the variables are shown in Table 1 above. On the first occasion of using any instrument, it must be initially set up for use in the field and the first step is usually to install the software before plugging the meter to your computer. Once the installation is done, connect the probe to the meter and switch on the meter and give it time to stabilise. In the case of the AquaRead’s meter being used, the built-in GPS will first look for satellites while the variables will be stabilising. Once stabilised, use the side arrows to browse the recordings and settings of the instrument, press the OK button to select and ESC to go to a previous screen. MENU is for calibration, settings and data logging. The M+ is for taking or logging a measurement once the probe is in a solution or in the water. To recall previously logged data, press MR. It is also important to have a look at the settings, especially the date and time, units of measurement, and the language and to set these properly before taking any measurements. For the units settings, make sure that the units for DO (dissolved oxygen) are in mg/L, for EC (electrical conductivity) on Ref 25oC, for Temp (temperature) in oC, for SAL (salinity) in PSU, as well as ensuring that the pH is selected instead of ORP (Oxidative Redox Potential). 6|Page 2.3.1.2. Initial Set Up and Preparation of the in-situ/permanent loggers In-situ measurement instruments have a probe that gets permanently housed at certain sites along an estuary to take real time measurements of the water level, temperature and conductivity, set at preferred intervals. Since there are several different types of in-situ measurement instruments, even with the NESMP, there are more than two types used. It is thus recommended that the manufacturer’s guide be consulted for the instructions on setting up, calibration, maintenance and data retrieval. It is however, very important to ensure that the instrument gets calibrated and maintained regularly. It is properly installed at a suitable site to avoid theft and exposure. The site must be suitable for continuous data logging, i.e. does not dry up, whilst also not vulnerable to being swept away in periods of high rainfalls. 2.3.2. General calibration precautions and maintenance These are just general calibration precautions and maintenance that applies to all water quality loggers or probes installed or used in estuarine systems, outlined by Harold van Niekerk (RQIS). Please note that you should always refer to the instrument’s manual for product specific requirements. 2.3.2.1. You need to always use fresh buffers (DO NOT pour the buffer back into the bottle after use). Therefore, after calibrating in a buffer it must be thrown out! Note the date on which the buffer was opened and check the bottle expiration date. During use, close the buffer bottle immediately after pouring out the amount that you need (to prevent carbon dioxide exchange). Generally pH 4 and 7 buffers expire within 3 months of being opened and pH 10 buffer within 1 month of opening. The reason for this is that they get bacterial contamination and they absorb carbon dioxide once opened. 2.3.2.2. Buffers and solutions Probes When not in use, the probes should be stored in a moist condition but NOT in distilled water, make use of tap water or the water from the river that you are sampling. It is important that the glass membrane is stored moist in order to maintain hydration; however, the probes should not be submerged in water. If the pH probe is stored for more than 3 months, it should be removed from the YSI instrument and stored in the solution supplied with the probe (KCl solution). Always have spare pH probes, oxygen membranes, etc. available. Loggers can be out of order for months if spares are not available. 7|Page 2.3.2.3. The pH, oxygen and conductivity probes should be calibrated at least once a month if they are permanently deployed. Alternatively, if they are used less frequently then they should be calibrated every time before use in the field or in the lab, depending on the circumstances. A chlorophyll probe will not reflect accurate concentrations if it is not calibrated for the specific water type, algal composition and algal distribution. If close to actual concentrations are required, the probe should be calibrated each time before use and when algal composition or distribution changes. 2.3.2.4. Things to avoid! Storing the electrode/probe dry or in de-ionized water. Stirring the sample or buffers using the electrode (to prevent damage to the probe). Re-using buffers. Polishing a pH bulb (it could BREAK) - if need be you should clean it gently with tissues. Assuming that the pH, oxygen and conductivity calibration procedures are simple. They are in fact complex and need to be done properly. Leaving LCD screens in direct sunlight or exposed to excessive heat. 2.3.2.5. Calibration frequency Other Ensure that the battery life of the instrument is sufficient for the period of intended use and that the batteries are replaced when they’re depleted. If needed, try and keep spare batteries in the instrument bag. WQ probes are highly affected by mud or silt build up. If sufficient recourses are not available to keep logger housings and boxes clean, it is better not to install WQ loggers. An incorrect result can be more problematic than no result at all. 2.3.3. Dissolved Oxygen (membrane sensors and optical sensors) 2.3.3.1. Calibration precautions Before calibration, the oxygen membrane should be visually inspected to make sure that the oxygen membrane has been installed correctly (refer to the User Manual), as well as to make sure that the membrane is not damaged. If the membrane has been damaged, it must be replaced. If the fluid under the membrane has air bubbles, then the fluid and membrane should be replaced. This does not apply to optical sensors! Oxygen is calibrated in moist air. Only approximately 5mm of water should be at the bottom of the calibration cup (NB: the probe should not touch the water). If the copper coloured metal of the probe beneath the membrane seems dirty it should be lightly sanded using the sandpaper that comes with the oxygen membrane 8|Page kit BUT you must be careful not to touch the membrane surface. This does not apply to optical sensors! Always ensure that the rotating cleaners on the optical sensors are not parked on the membrane. Always ensure that the calibration cup is loosely attached when used during calibration. During calibration, the DO sensors should not be in contact with the water. 2.3.3.2. Maintenance If you get an ‘out of range’ auto response during calibration, check that the membrane is not in contact with the water in the calibration cup. For models using membranes, also check for bubbles, sufficient KCL solution or a torn membrane. As a general rule the membrane disk on the optical sensors should be replaced annually to ensure optimum performance. 2.3.4. pH 2.3.4.1. Calibration precautions Always calibrate with at least two buffers, preferably pH 4 and 7. Calibration in the pH 7 buffer should be performed first. pH 10 buffers absorb carbon dioxide and are, therefore, unstable and not recommended for use in field calibration. It is recommended that calibration be done with a buffer that is at the same temperature as the water that is to be measured hence field calibration is recommended. Buffer can be put in a plastic bag and submerged for ten minutes in the water to be tested. If calibration is carried out in laboratory or enclosed environment, please ensure that temperature is kept constant at all times. Ensure that you rinse calibration bottle and probes with water before and after calibration to avoid contamination. If you get an ‘out of range reading’, do not accept it. First check for obvious reasons e.g. that the correct value was entered for the pH buffer solution currently being used. You can use the pH millivolt readings to determine the health of the probe. Consult the user manual for guidance. For YSI pH probes the acceptable millivolt readings for each buffer is as follows: pH 4 = +180 (±50mv) pH 7 = 0 (±-50mv) pH 10 = + - 180 (±50mv) 9|Page The difference between the two millivolt readings should be between 165 and 180. The probe should be discarded once below 160. 2.3.4.2. Maintenance The probes should be stored in a moist condition. Therefore, after use you should pour some water in the calibration cup (no more then 5-10mm) - NOT distilled water though. Used calibration fluids should be discarded. If the probe is to be stored on the instrument for longer than 3 months without being used, it should be removed from the instrument and stored in the KCl storage solution provided with the probe. The calibration cup and the probes should be rinsed and cleaned after using them. Probes generally have a lifespan of two years if used in environmental conditions. After installation of a new probe the “out of range” reading can be accepted during the first calibration. 2.3.5. Electrical Conductivity 2.3.5.1. Calibration precautions Do not get confused with the EC units. During calibration the specific instrument might require that a different EC unit be used than what is indicated on the calibration solution bottle. o Example: YSI requires that the EC value for calibration is in mS/cm although the calibration standards we use are mostly in µS/cm. This means that if the bottle indicates 12 880 µS/cm or 1413 µS/cm you will have to divide it by 1000 and use 12.88 mS/cm or 1.413 mS/cm respectively for calibration. On the other hand, DWA WQ guidelines use mS/m which requires an additional conversion. When filling the calibration vessel before calibration, make sure that there is enough buffer solution in the calibration cup to cover the entire conductivity cell. After placing the probe in the calibration solution, agitate the probe to remove any bubbles in the conductivity cell – NB: remember the warning about not stirring with the probe. During calibration, the sensors must be allowed time to stabilize - approximately 60 seconds is usually adequate. Low concentration conductivity standards are susceptible to contamination and their use is not recommended unless extra care is taken to rinse the calibration vessel and probe compartment with the standard solution to be used prior to calibrating. YSI mostly recommends using a mid-range calibration standard of approximately 10 000 µS/cm. The two standards that are used in RQS are: 1413µS/cm and 12880µS/cm. 10 | P a g e 2.3.5.2. Maintenance Clean regularly with a small brush or cloth to avoid fouling. There are no special requirements since EC probes are fairly robust. Even though different instruments may be used, the most important thing is to ensure that the electrical conductivity gets calibrated at 12880 µS/cm, the pH at 7 first then 4.01, and the dissolved oxygen at 100% moisture. Ensure that you rinse the probes thoroughly with water (not de-ionised) after each calibration so as to not contaminate the next calibration. Discard any calibration fluid after use. Please follow below links for specific product requirements and calibration manual: AquaRead AP-700: http://www.aquaread.com/portofolio/ap-700-ap-800/ YSI 556: https://www.ysi.com/File%20Library/Documents/Manuals/655279-YSI-556Operations-Manual-RevD.pdf Aqua Troll 200: https://in-situ.com/wp-content/uploads/2014/11/Aqua-TROLL-100200_Manual.pdf 2.4. FINAL PREPARATIONS FOR THE FIELD Ensure that the following are ready before going to the field: A cooler box with ice bricks, for the chlorophyll-a (phytoplankton biomass), nutrient and microbial samples Enough clean sample bottles are available, labelled and ready for the collection of samples for nutrients (minimum 200mL), and chlorophyll-a (500mL), per site. These bottles can be supplied by DWS: RQIS Enough sterilised bottles are available for the collection of microbial samples. These bottles will be supplied by the laboratory that does the microbial analysis and thus need to be collected every time samples are submitted to the lab. The following are important to have on the final labels – the name of the estuary/system, site numbers, the sampling date and time, and the volume of filtered water in the case of the chlorophyll-a samples The Whatman glass fibre (GF/C) filter papers for chlorophyll-a The filter unit and pump for chlorophyll-a Enough foil is available to cover the GF/C filter papers, with the chlorophyll-a samples. Or, the 25mL glass tubes filled with 10mL ethanol have been provided by DWS to store and preserve the chlorophyll-a filter paper samples (stored and transported in a dark and cool container). The syringe and enough syringe filters for the nutrient samples, to be used after the field collection. The syringe filters must be hydrophilic, 0.45 μm pore-size, and have a 25mm diameter. 11 | P a g e The Aquameter’s probes have been calibrated (see section 2.3 above for set-up and calibration) and its cord has been marked at 0.25m distance intervals. The intervals may be 0.5m as well, depending on the depth of the estuaries in your area The Aquameter’s batteries have been checked and replaced if required A record sheet has been filled in, with the date of the calibration of the probes and the readings that were recorded before calibration. An example of a record sheet can be found in Annexure A. The Secchi Disk is available and the 10cm and 1m distance intervals have been properly marked and are visible on the rope Writing material (pencil and paper or waterproof writing board) is available An equipment and procedure checklist has been compiled for before, during and after a field sampling trip, see Annexure B. 3. PART 2: FIELD SAMPLING 3.1. FIELD READINGS AND MEASUREMENTS 3.1.1. Visual Observations Record your observation of the surrounding environment on a record sheet, which should also be sent to DWS with the other data. An example of the features to consider and to look out can be found in Annexure C, which can be printed out and used in the field. 3.1.2. Transparency or Secchi Depth Measurement A secchi disc measurement determines the clarity/transparency of the water, which then inversely relates to the turbidity (DWAF: NEMP, 2002). Do the following to measure it: Use a secchi disc with an attached rope that has marked distances of 10 cm and 1m intervals Slowly lower the disc into the water column, with the painted, black and white, side of the disc facing up. Lower the disc while holding and slowly releasing the rope with the sun behind you as reflections off the surface can influence the visibility of the disc. Watch the disc slowly disappear into the water. Record the distance on the rope at which the black and white paint of the disc is just visible in the water column. Can also be used to determine the end depth at each site. 12 | P a g e 3.1.3. Other Physico-chemical Variables The AquaMeter/probe is used in most estuaries in the NESMP, but other instruments are also acceptable, i.e. the YSI multiprobe. The most critical measurements are Temperate, Electrical Conductivity, Dissolved Oxygen (mg/l), and pH and the instrument must be calibrated before use in the field. The procedure for using the probe is as follows: If using AquaRead’s aquameter, switch on the by pressing the red button, Wait for the GPS to search for the satellites and for the variables to stabilise, Remove the pH/ORP storage cap from the pH/ORP electrode Once stabilised, lower the probe end of the instrument into the water column, Start taking measurements, starting with the surface (0 m) measurement, Once in the water, give the probe time to stabilise its taking of readings of the environment, When the readings have stabilised record the readings on a record sheet or field measurement sheet, and then press the M+ button to take a reading at this depth with the instrument, Lower the probe to the next depth of measurement and record another reading (both manually on paper and with the instrument), The depths of measurement depend on the systems overall depth. Very shallow systems could be measured at 0.25m depth intervals, medium depth systems could be at 0.5m intervals and deep to very deep systems could be at 1m to 2m intervals. the decision is estuary specific, as long as it is consistent per site, Then, follow the above procedure to take readings at every set interval to the bottom of the water column, Follow the above steps for each site. In between sites, the Aquameter and probe must be kept in its box, for protection purposes and ALWAYS ENSURE THAT WHENEVER THE PROBE IS NOT IN USE, THE DAMP PH/ORP STORAGE IS FITTED ON THE PH/ORP ELECTRODE. After use, the probe and cord must be rinsed thoroughly with freshwater, kept in its box and stored away properly. 3.2. SAMPLE COLLECTION, PREPARATION AND STORAGE PROCEDURE 3.2.1. Nutrients For nutrient samples, the following must be conducted at each site: 3.2.1.1. Sample collection Rinse the collection bottle, two times, with estuary water. Collect a sub-surface sample by lowering a labelled collection bottle into the water, covering your arm as far as the elbow. Fill up the bottle with sample. 13 | P a g e Keep bottle with the unfiltered water sample in a cooler box with ice until the samples can be filtered. 3.2.1.2. Preparation and Storage On the same day after the field sampling, when at the lab or work station, filter the collected samples through the hydrophilic PVDF 0.45 μm pore-size syringe filters, using a syringe. Filter by first drawing the sample from the bottle with the syringe, attach the filter disc (syringe filter), press out the sample in the syringe, through the filter, into a new labelled 350 mL bottle, and keep repeating this until the filtered sample is enough in the new bottle. Close the bottle with its cap. Leave some space in the new bottle to allow for expansion. Make sure there is a labelled tag tied around the bottle, indicating the monitor (organisation), the date and time of collection, that it is a sub-surface sample (0m depth), that it is a nutrient sample, and the site number/name. Repeat the above steps for each site, taking care to use a new filter disc with each site’s sample and to label each sample properly. Store the filtered samples in the freezer, until they can be sent to a lab for analysis. The filtered and frozen water samples will be analysed for DIN (Dissolved Inorganic Nitrogen) (- NO3, NO2, NH4) and soluble reactive phosphorus (SRP) (- PO4). 3.2.2. Phytoplankton Biomass The measurement of chlorophyll-a will be used as a measure of phytoplankton biomass in the estuary/water column. Follow this procedure for the sampling: 3.2.2.1. Sample collection At each site, rinse the sample collection bottle twice (500mL or above) with site water and collect a sub-surface sample by filling up the bottle. Ensure the bottle is labelled, or has a labelled tag, indicating the system name, site number, date and time of collection. Keep the water sample in the dark in a cooler box with ice (if the filtering will be done at a later stage). 3.2.2.2. Preparation and Storage Either at the field, if feasible, or back at the work station, filter the water sample. Get the filter unit ready by placing a GF/C filter paper in the middle unit, in between the top and bottom halves of the unit and then gently screw together the two halves of the unit. Fill the top part of the filter unit to the 250 mL mark. Connect the pump and gently create a vacuum, by slowly pressing on the pump, not exceeding the 15 cm mark of the pressure gauge of the pump. The water will be slowly sucked through the filter paper. 14 | P a g e Once the entire sample has filtered though, remove the bottom part of the filter unit. It is advisable to keep this water aside for the nutrient sample, the pre-filtration eases the strain on the syringe filters. If the water is not too turbid, place back the bottom unit connecting it with the top part and filter another 250 mL of water, for a 500 mL sample. If the sample is too turbid for another 250 mL or after the full 500 mL has been filtered, carefully remove the top section of the filter unit, then the filter paper, without touching the sample on top. Fold the filter paper in half and roll it, with the sample side inward. Either, place the filter paper in the glass bottle containing ethanol, screw the lead tight (ensuring the undeliner is in place), and seal around the lead with Parafilm. Or, cover the filter paper with a piece of tinfoil. Ensure the volume of water filtered (250 or 500 mL) is now written on the labels, together with the site name and number, monitor, date and time of collection, and 0m for sub-surface grab. Store the tinfoil, samples in the freezer until analysis. The samples in ethanol must also be stored in the dark, in a cool environment, until analysis. It is important that the samples do not interact with light and warm conditions as the chlorophyll will degrade and not be representative. 3.2.3. Microbial Counts Water samples need to be collected for the analysis of microbes in the water column. The microbes are Enterococci and Escherichia coli (E. coli). One sample will be collected per site, at the sub-surface level (depth). Do not rinse the sterile microbial collection bottle. Keep the sample bottle closed until it is to be filled. Immediately prior to filling, remove the cap. Ensure that the inner surface of the cap and neck of the bottle do not come in contact with any non-sterile surfaces, including your hands. Submerge the labelled sample bottle into the water column and collect approximately 500 mL of sample for the Enterococci and E. coli counts, leaving at least 2.5cm of headspace to facilitate mixing by shaking prior to analysis. When collecting the sample, drag the bottle away from you. Cap the sample bottle immediately. Indicate the date and time of sample collection, the site name/number on the tag. Place the bottle with the sample in an iced cooler box until it can be couriered for lab analysis, preferably on the same day. 15 | P a g e 4. PART 3: POST FIELD ACTIONS AND SAMPLE ANALYSES 4.1. TRANSPORTATION OF SAMPLES The collected water samples for chlorophyll-a, microbial and nutrient analysis will have to be sent to an approved laboratory. The microbial samples need to be sent to the laboratory within the same day of collection. There are a number of laboratories across the country in the different regions which have been contracted to do the analysis for the microbial samples. A list of these laboratories is in Annexure C. When transporting the samples, they have to be kept in a cooler box with ice. As for the nutrient samples, they can be frozen until they are forwarded to a laboratory for analysis. This freezing time should be as minimal as possible. If there is a contracted laboratory in your region rather send the samples to the laboratory as soon as possible. Keep the samples in a cooler box with ice during the transportation to the laboratory. The chlorophyll-a samples can be sent to the Resource Quality Information Services (RQIS) laboratory in Pretoria. A courier service has been contracted by the Department of Water and Sanitation for the transportation of these samples. Place the foiled-wrapped sample filter papers in a cooler box with ice and get the courier company to deliver the samples to RQIS. The samples should preferably not be sent from Thursday onwards. If the sampling was done on a Thursday or Friday, rather keep the samples in the freezer, away from any light, until the following Monday to courier. To find out more about the courier services to use in your region, contact RQIS for further details. 4.2. DATA MANAGEMENT To download data from the handheld instrument, e.g. Aquaread’s Aquameter, connect the USB cable to the meter, connect the instrument to a computer with the instrument’s software, switch on the instrument and ensure USB Connected is displayed on the instrument. Open up the software and, in the case of use of the AquaRead, follow as displayed in Figure 3 below of the AquaLink programme/software. Click Upload data from Aquameter, choose the data you would like to upload and then export data as excel file. Choose a folder to save the exported data in your computer. When saved, the data can then be view on excel. On excel, the data will need to be cleaned up a bit. Insert columns for the estuary name, site name/number (e.g. ZI-1), depth of measurement, and Secchi depth. The sampler will know the sites sampled based on the displayed dates and times of measurements. This is crucial to do before sending the data to RQIS as the sampler knows best the sites and depths they measured. 16 | P a g e Figure 3: Representation of steps to follow in AquaLink for the data download 17 | P a g e ANNEXURE A: CALIBRATION RECORD SHEET Organisation Name: ____________________________ Calibration Date: _________________ Calibration Time: ___________________________ Variable Measured Value Before Calibration Measured Value After Calibration Instrument Model: ________________ First Measured Field Value After Calibration Comments about Calibration EC (µS/cm) pH 7 pH 4 DO (mg/L) 18 | P a g e ANNEXURE B: SAMPLING EQUIPMENT AND PROCEDURE CHECK LIST TO DO BEFORE GOING TO THE FIELD Checked TO TAKE WITH (PACK) AND TO USE AT THE FIELD Setting up of AquaMeter GPS, or marked Map, landmarks, for location of sites Calibration Standards and calibration of for AquaMeter Calibrated and set up AquaMeter with clear distance interval marks on cord Record sheet of the AquaMeter calibration results and date (see Annexure A) Label (on tag) bottles for nutrient and microbial samples Cut and label foil pieces for the chlorophyll-a filter papers Calibration standards and calibration of Aqua Troll (the in-situ instrument) Checked TO DO AFTER FIELD SAMPLING AND SAMPLE COLLECTION One or two syringes and one hydrophilic PVDF 0.45 μm pore-size syringe filters (yellow discs) Clean labelled 350mL bottles for filtered nutrient water samples. One per site and separate from the Unfiltered labelled 350mL sample bottles collected for nutrients for filtration into new labelled 350mL bottles. Record sheet of the AquaTroll calibration results and date Laptop or notebook for Aqua Troll data download Secchi disc with marked rope One 500mL, or above, bottle for collection of water samples for filtration for chlorophyll-a One Filter Unit and one Pump for water filtration for chlorophyll-a Fridge for the storage of the microbial sample bottles. Freezer for the storage of the foil-wrapped filter papers for chlorophyll-a and the filtered sample bottles for nutrients Rinsing of the AquaMeter’s rope and probe with freshwater Computer for the AquaMeter data download and management GF/C filter papers for chlorophyll-a. One filter paper per site Labelled foil for covering filter paper with sample. One per site Cleaned Labelled 350mL bottles for collection of unfiltered water samples for nutrients. One bottle per site Labelled collection bottles for microbial samples (E. Coli and Enterococci). Covered cooler box with ice, big enough to store the chlorophyll-a samples in foil, the unfiltered nutrient sample bottles, and bottles of the collected microbial samples Paper and a pencil for recording of observations and readings from the AquaMeter 19 | P a g e Checked ANNEXURE C: RECORD SHEET FOR FIELD OBSERVATIONS SYSTEM NAME: Sampling Date: Mouth Status (if not permanently open system) Start Sampling Time: Open Sampler: □ □ □ □ □ □ □ Closed □ Tide In River Flow None Trickle Rain 24hrs Yes No Rain 7Days Yes No Cloud cover 100% ≥70% Wind Strength None Breeze Wind Direction (N, NE, E, SW, etc.) Water Colour Clear Water Level High Out Greenish □ Overtop □ □ Moderate □ Overtop □ □ Neap Medium Spring Strong □ □ □ □ □ ≤70-40%≥ Slightly Turbid Medium □ □ □ □ □ Turbid ≤40% Strong □ □ 0% Gale □ □ Very turbid Low □ 20 | P a g e ANNEXURE D: LABORATORIES TO BE CONTACTED FOR THE ANALYSIS OF SAMPLES AREA LABORATORY FOR ANALYSIS OF Pretoria Resource Quality Information Services Chlorophyll-a from all estuaries Stellenbosch Water Analytical Laboratory cc (LAB NOT ESTABLISHED/CONTRACTED) George Pathcare George Port Elizabeth Pathcare PE Enterococci and E. Coli from west coast Enterococci and E. Coli from southern cape Enterococci and E. coli from eastern cape Enterococci and E. coli from eastern cape Enterococci and E. coli from northern KZN Kei Water CONTACT PERSON CONTACT NUMBER FAX NUMBER E-MAIL ADDRESS Nolusindiso Jafta 012 808 9511 or 082 875 9015 Marianne Franck 021 883 8905 or 083 607 8159 Karen Cronje or Carike Woest 044 803 8222 [email protected] [email protected] Karen Cronje or Carike Woest 041 391 5700/22 [email protected] [email protected] Malgas Booi 047 531 3973 [email protected] Swaswa Ntlhoro 035 902 1049 035 902 1107 [email protected] TO BE ESTABLISHE D/CONTRACT ED TO BE ESTABLISHED/CONTRACTED [email protected] 021 883 8905 [email protected] Richards Bay Mhlathuze water Durban EThekwini Municipality or Umngeni Water Enterococci and E. coli from southern KZN TO BE ESTABLISHED/CONTRACTED TO BE ESTABLISHED/C ONTRACTED Western Cape Centre For Scientific and Industrial Research (DURBAN) Nutrients from south to west coast estuaries Loyiso Magqi 031 242 2398 [email protected] Eastern Cape and KwaZulu Natal Centre For Scientific and Industrial Research (DURBAN) Nutrients from south to east coast estuaries Loyiso Magqi 031 242 2398 [email protected] 21 | P a g e Contact details For more information with regards to sampling manual and technical aspects of water quality probes, please contact any of the following people: Department of Water and Sanitation Resource Quality Information Services Moloto Road Roodeplaat Dam Pretoria 0001 [email protected] Cell: 082 808 9843 Harold van Niekerk Gerhard Cilliers [email protected] Cell: 082 880 3964 Nolusindiso Jafta Sibusiso N. Majola [email protected] Cell: 082 875 9015 [email protected] 22 | P a g e