1
Open Source Management Options
September 30th, 2008
Jane Curry
Skills 1st Ltd
www.skills-1st.co.uk
Jane Curry
Skills 1st Ltd
2 Cedar Chase
Taplow
Maidenhead
SL6 0EU
01628 782565
jane.curry@skills1st.co.uk
1
Synopsis
Nuts and bolts network and systems management is currently unfashionable. The emphasis is far more on processes that implement service management, driven by methodologies and best practices such as the Information Technology Infrastructure Library (ITIL). Nonetheless, all service management disciplines ultimately rely on a way to determine some of the following characteristics of systems and networks:
●
Configuration management
●
Availability management
●
Problem management
●
Performance management
●
Change management
●
Security management
The commercial marketplace for systems and network management offerings tend to be dominated by the big four – IBM, HP, CA and BMC. Each have large, modular offerings which tend to be very expensive. Each has grown their portfolio by buying up other companies and then performing some level of integration between their respective branded products. One can argue that the resulting offerings tend to be “marketechtures” rather than architectures.
This paper looks at Open Source software that addresses the same requirements. Offerings from Netdisco, Cacti and The Dude are examined briefly, followed by an in
depth analysis of Nagios, OpenNMS and Zenoss.
This paper is aimed at two audiences. For a discussion on systems management selection processes and an overview of three main open source contenders, read the first few chapters. The last few chapters then provide a product comparison. For those who want lots more detail on Nagios, OpenNMS and Zenoss, the middle sections provide indepth discussions with plenty of screenshots.
2
Table of Contents
1 Defining “Systems Management”....................................................................................5
1.1 Jargon and processes................................................................................................5
1.2 “Systems Management” for this paper....................................................................6
2 Systems management tools.............................................................................................6
2.1 Choosing systems management tools......................................................................7
2.2 The advantages of Open Source...............................................................................8
3 Open Source management offerings...............................................................................8
4 Criteria for Open Source management tool selection.................................................10
4.1 General requirements.............................................................................................10
4.1.1 Mandatory Requirements...............................................................................10
4.1.2 Desirable Requirements..................................................................................10
4.2 Defining network and systems “management”.....................................................11
4.2.1 Network management.....................................................................................11
4.2.2 Systems management......................................................................................12
4.3 What is outofscope?..............................................................................................13
5 A quick look at Cacti, The Dude and netdisco..............................................................14
5.1 Cacti.........................................................................................................................14
5.2 netdisco....................................................................................................................17
5.3 The Dude..................................................................................................................20
6 Nagios..............................................................................................................................21
6.1 Configuration – Discovery and topology................................................................22
6.2 Availability monitoring...........................................................................................27
6.3 Problem management.............................................................................................32
6.3.1 Event console....................................................................................................33
6.3.2 Internally generated events............................................................................37
6.3.3 SNMP TRAP reception and configuration.....................................................39
6.3.4 Nagios notifications ........................................................................................39
6.3.5 Automatic responses to events – event handlers..........................................41
6.4 Performance management......................................................................................42
6.5 Nagios summary.....................................................................................................45
7 OpenNMS........................................................................................................................46
7.1 Configuration – Discovery and topology................................................................47
7.1.1 Interface discovery...........................................................................................47
7.1.2 Service discovery..............................................................................................48
7.1.3 Topology mapping and displays......................................................................51
7.2 Availability monitoring...........................................................................................53
7.3 Problem management.............................................................................................59
7.3.1 Event console....................................................................................................59
7.3.2 Internally generated events............................................................................62
7.3.3 SNMP TRAP reception and configuration.....................................................65
7.3.4 Alarms, notifications and automations..........................................................69
3
7.4 Performance management......................................................................................76
7.4.1 Defining data collections.................................................................................76
7.4.2 Displaying performance data..........................................................................85
7.4.3 Thresholding....................................................................................................91
7.5 Managing OpenNMS..............................................................................................97
7.6 OpenNMS summary...............................................................................................98
8 Zenoss..............................................................................................................................98
8.1 Configuration – Discovery and topology..............................................................100
8.1.1 Zenoss discovery.............................................................................................100
8.1.2 Zenoss topology maps....................................................................................107
8.2 Availability monitoring........................................................................................108
8.2.1 Basic reachability availability......................................................................108
8.2.2 Availability monitoring of services TCP / UDP ports and windows services
...................................................................................................................................110
8.2.3 Process availability monitoring....................................................................113
8.2.4 Running commands on devices.....................................................................120
8.3 Problem management...........................................................................................121
8.3.1 Event console.................................................................................................122
8.3.2 Internally generated events..........................................................................123
8.3.3 SNMP TRAP reception and configuration...................................................125
8.3.4 email / pager alerting....................................................................................126
8.3.5 Event automations.........................................................................................131
8.4 Performance management....................................................................................132
8.4.1 Defining data collection, thresholding and graphs.....................................132
8.4.2 Displaying performance data graphs...........................................................138
8.5 Zenoss summary....................................................................................................141
9 Comparison of Nagios, OpenNMS and Zenoss...........................................................142
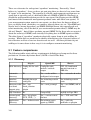
9.1 Feature comparisons.............................................................................................143
9.1.1 Discovery........................................................................................................143
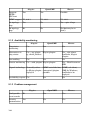
9.1.2 Availability monitoring.................................................................................144
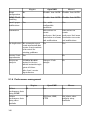
9.1.3 Problem management....................................................................................144
9.1.4 Performance management............................................................................145
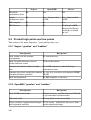
9.2 Product high points and low points....................................................................146
9.2.1 Nagios “goodies” and “baddies”.....................................................................146
9.2.2 OpenNMS “goodies” and “baddies”...............................................................146
9.2.3 Zenoss “goodies” and “baddies”.....................................................................147
9.3 Conclusions............................................................................................................148
10 References...................................................................................................................149
11 Appendix A Cacti installation details.....................................................................149
4
1 Defining “Systems Management”
1.1 Jargon and processes
Every organisation and individual has their own perspective on systems management requirements; the first essential step when looking for systems management solutions is to define what those requirements are. This gives a means to measure success of a project.
There are many different methodologies and disciplines for systems management from the International Standards Organization (ISO) “FCAPS” acronym – Fault, Configuration, Accounting, Performance and Security, through to the Information Technology Infrastructure Library (ITIL) which divides the ITIL V2 framework into two categories:
●
●
Service Support which includes the:
○
Service Desk function
○
Incident management process
○
Problem management process
○
Configuration management process
○
Change management process
○
Release management process
Service Delivery which includes the:
○
Service Level management process
○
Capacity management process
○
IT Service Continuity management process
○
Availability management process
○
Financial management for IT services
Key to the core of configuration management and the entire ITIL framework is the concept of the Configuration Management Database (CMDB) which stores and maintains Configuration Items (CIs) and their interrelationships.
The art of systems management is defining what is important – what is inscope, and perhaps more importantly, what is currently outofscope. The science of systems management is then to effectively, accurately and reliably provide data to deliver your systems management requirements. The devil really is in the detail here. A “comprehensive” systems management tool that delivers a thousand metrics outof
thebox but which is unreliable and / or not easily configurable, is simply a recipe for a project that is delivered late and overbudget.
5
For smaller projects or Small / Medium Business (SMB) organisations, a pragmatic approach is often helpful. Many people will want a say in the definition of management. Others, whose requirements may be equally valuable, may not know “the art of the possible”. Hence, combining topdown requirements definition workshops with a bottomup approach of demonstrating “top 10” metrics that can easily be delivered by a tool, can result in an iterative process that fairly quickly delivers at least a prototype solution. 1.2 “Systems Management” for this paper
For the purposes of this paper, I shall define systems management as spanning:
●
Configuration management
●
Availability management
●
Problem management
●
Performance management
I shall further define “systems” to include local and widearea networks, as well as “PCs” and “Unixlike” systems. In my environment, I do not have mainframe or proprietary midrange systems. “PC”s run a variety of versions of Windows. “Unix
like” tends to mean a flavour of Linux rather than a vendorspecific Unix, though there is some legacy IBM AIX and Sun Solaris.
2 Systems management tools
There are no systems management “solutions” for sale. The successful implementation of systems management requirements is a combination of:
●
Appropriate requirements definition
●
Appropriate tools
●
Skills to translate the requirements into customisation of tools
●
Project management
●
User training
●
Documentation
In theory, the choice of tool should be driven by the requirements. In practise, this is often not the case and a solution for one aspect of systems management in one area of a business may become the de facto standard for a whole organisation. There are good reasons why this might come about. It is not practical to run a centralised Service Desk with a plethora of different tools. A Frameworkbased tool with a centralised database, and a common lookandfeel across both Graphical User Interface(GUI) and Command Line Interface (CLI), offering modules that deliver the different systems management disciplines, is a much more costeffective solution then 6
different piecemeal tools for different projects, especially when the cost of building and maintaining skills and educating users is taken into account.
Tool integration is a large factor in the successful rollout of systems management. The concept of a single Configuration Management Database (CMDB) that all tools feed and use, is key to this.
A good tool delivers “useful stuff” easily outofthebox and provides a standard way to then provide local customisation.
At its most basic, the “tool” is a compiler or interpreter (C, bash, ...) and the “customisation” is writing programs from scratch. At the complex end of the spectrum, the “tool” may be a large suite of modules from one of the big four commercial suppliers, IBM, HP, CA and BMC. At the really complex end, is where you have several of the big commercial products involved in addition to homegrown programs.
2.1 Choosing systems management tools
Every organisation has different priorities for the criteria that drive tool selection. For the moment, let's leave aside the technical metrics and look at some of the other decision factors:
●
Ease of use – not just what demos well but what implements well in your environment
●
Skills necessary to implement the requirements versus skills available
●
Requirements for and availability of user training
●
Cost – all of it – not just licences and tin – evaluation time, maintenance, training, ...
●
Support – from supplier and/or communities
●
Scalability
●
Deployability – management server(s) ease of installation and agent deployment
●
Reliability
●
Accountability – the ability to sue / charge the vendor if things go wrong
If accountability is high in your priorities and the software cost is a relatively low priority then you are likely to choose one of the commercial offerings; however if you have a wellskilled workforce, or one prepared and able to learn quickly, and overall cost is a limiting factor, then Open Source offerings are well worth considering. Interestingly, you can find offerings that suit all the other bullets above, from both the commercial and the Open Source stables.
7
2.2 The advantages of Open Source
One attraction of Open Source to me is that you don't actually have to fund “salesfolk”. Some costs do need to be invested in your own people to investigate the offerings available, research their features and requirements, and participate in the online fora that share experience around the globe. These costs may not be small but at least the investment stays within the company and hopefully those people who have done the research will then be a key part of the team implementing the solution. This is often not the case if you purchase from a commercial supplier.
Open Source does not necessarily mean “you're on your own, pal!”. Most of the Linux distributions have a free version and a supported version, where a support contract is available to suit your organisation and budget. Several of the Open Source management offerings have a similar model but do ensure that the free version has sufficient features for your requirements and is not just a wellfeatured “demo”.
All software has bugs in it. Ultimately, if you go Open Source, you have the source code so you have some chance of fixing problems with local staff or buying in global expertise – and that doesn't necessarily mean transporting a guru from Australia to Paris. Open Source code is available to everyone so remote support and consultancy is a distinct possibility. With the best will in the world, commercial organisations will prioritise problem reports according to their criteria – not yours.
There are some excellent fora and discussion lists for commercial products I have participated in several of them for many years; some even have input from the support and development teams; however, the source code is not open for discussion or community development. With a very active Open Source offering, there tends to be a much larger pool of developers and testers (ie. “us”) and the chance of getting problems fixed may be higher, even if you cannot fix it yourself. I would emphasise very active Open Source offerings – unless you really do have some very highly skilled local staff that you are sure you are going to keep, it may be a risky choice to participate in a small Open Source project.
3 Open Source management offerings
There are lots of different Open Source management offerings available. Many of them rely on the Simple Network Management Protocol (SNMP) which defines both a protocol for an SNMP manager to access a remote SNMP agent, and also defines the data that can be transferred. SNMP data values that an SNMP manager can request, are defined in Management Information Bases (MIBs) which can either be standard (MIB2) or can be “enterprisespecific” in other words, each different manufacture can provide different data about different types of device. Information events emanating from an agent (typically problems) are SNMP traps. There are three versions of the SNMP standard:
●
8
V1 (1988) – still most prevalent. Significant potential security and performance issues.
●
●
V2 (1993) – solved some performance issues. Never reached full standard status.
V3 (2002) – significantly improved performance and security issues. Much more complex.
Of the Open Source management solutions available, some are excellent point solutions for specific niche requirements. MRTG (Multi Router Traffic Grapher) written by Tobi Oetiker, is an excellent example of a compact application that uses SNMP to collect and log performance information and display it graphically. If that satisfies your requirement, don't look any further – but it will not help you with defining and collecting problems from different devices and then managing those problems through to resolution.
An enhancement of MRTG is RRDTool (Round Robin Database Tool), again from Tobi Oetiker. It is still fundamentally a performance tool, gathering periodic, numeric data and displaying it but RRDTool has a database at its heart. The size of the database is predetermined on creation and newer data overwrites old data after a predetermined interval. RRD can be found embedded in a number of other Open Source management offerings (Cacti, Zenoss, OpenNMS).
A further enhancement from RRDTool is Cacti which provides a complete frontend to RRDTool. A backend MySQL relational database can be used behind the Round Robin databases; data sources can be prettywell any script in addition to SNMP; and there is user management included. This is still a performance data collection and display package, not a multidiscipline, framework, systems management solution.
Moving up the scale of features and complexity, some offerings are slanted more towards network management (netdisco, The Dude); others towards systems management (Nagios).
Some aim to encompass a number of systems management disciplines with an architecture based around a central database (Nagios, Zenoss, OpenNMS).
Some are extremely active projects with hundreds of appends to maillists per month (Nagios, Zenoss, OpenNMS, cacti); others have a regular but smaller community with hundreds of maillist appends per year (netdisco).
Some are purely Open Source projects, typically licensed under the Gnu GPL (MRTG, RRDTool, cacti) or BSD license (netdisco); some have free versions (again typically under GPL) with extensions that have commercial licences (Zenoss). In addition to free licences, several products offer support contracts (Zenoss, Nagios, OpenNMS).
Most are available on several versions of Linux; MRTG, RRDTool and cacti are also available for Windows. The Dude is basically a Windows application but can run under WINE on Linux.
Most have a webbased GUI supported on Open Source browsers. OpenNMS can only display maps by using Internet Explorer.
9
4 Criteria for Open Source management tool selection
It is essential to define what is inscope and what is outofscope for a systems management project. A prioritised list of mandatory and desirable requirements is helpful.
4.1 General requirements
For the purposes of this paper, here are my selection criteria.
4.1.1 Mandatory Requirements
●
Open Source free software
●
Very active fora / maillists
●
Established history of community support and regular fixes and releases
●
Integrated network and systems management including:
○
Configuration management
○
Availability management
○
Problem management
○
Performance management
●
Centralised, open database ●
Both Graphical User Interface (GUI) and Command Line Interface (CLI)
●
Easy deployment of agents
●
Scalability to several hundred devices
●
Adequate documentation
4.1.2 Desirable Requirements
10
●
Support for SNMP V3
●
User management to limit aspects of the tool to certain individuals
●
Graphical representation of network
●
Controllable remote access to discovered devices
●
Easy server installation
●
No requirement for proprietary web browsers
●
Scalability to several thousand devices
●
Good documentation
●
Availability of (chargeable) support
4.2 Defining network and systems “management”
The “Integrated network and systems management” requirement needs some further expansion:
4.2.1 Network management
●
●
Configuration
○
Automatic, controllable discovery of network Layer 3 (IP) devices
○
Topology display of discovered devices
○
Support for SNMP V1, V2 and preferably, V3
○
Ability to discover devices that do not support ping
○
Ability to discover devices that do not support SNMP
○
Central, open database to store information for these devices
○
Ability to add to this information
○
Ideally, ability to discover and display network Layer 2 (switch) topology
Availability monitoring
○
○
○
●
Simple display of availability status of devices, preferably both tabular and graphical
Events raised when a device fails its availability test
○
Ability to monitor infrastructure of network devices (eg. CPU, memory, fan )
○
Differentiation between device / interface down and network unreachable
Problem
○
Events to be configurable for any discovered device
○
Central events console with ability to prioritise events
○
Ability to categorise events for display to specific users
○
○
11
SNMP availability test for devices that do not respond to ping (eg. comparison of SNMP Interface administrative status with Interface operational status)
○
○
●
Customisable “ping test” for all discovered devices and interfaces
Ability to receive and format SNMP traps for SNMP V1, V2 and preferably, V3
Customisation of actions in response to events, both manual actions and automatic responses
Ability to correlate events to find rootcause problems (eg. failure of a router device is root cause of all interface failure events for that device)
Performance
○
Regular, customisable monitoring of SNMP MIB variables, both standard and enterprise specific, with data storage and ability to threshold values to generate events
○
Ability to import any MIB
○
Ability to browse any MIB on any device
○
Customisable graphing of performance data
4.2.2 Systems management
Many of the criteria for systems management are similar to the network management bullets above but they are repeated here for convenience.
●
●
Configuration
○
Automatic, controllable discovery of Windows and Unix devices
○
Topology display of discovered devices
○
Support for SNMP V1, V2 and preferably, V3
○
Ability to discover devices that do not support ping
○
Ability to discover devices that do not support SNMP
○
Central, open database to store information for these devices
○
Ability to add to this information
Availability monitoring
○
○
○
○
○
○
○
●
Availability test for devices that do not respond to ping (eg. comparison of SNMP Interface administrative status with Interface operational status, support for ssh tests)
Ability to monitor customisable ports on a device (eg. tcp/80 for http servers)
Ideally the ability to monitor “applications” (eg. ssh /snmp access to monitor for processes, wget to retrieve web pages )
Simple display of availability status of devices, preferably both tabular and graphical
Events raised when a device fails any availability test
Ability to monitor basic system metrics – CPU, memory, disk space, processes, services (eg. the SNMP Host Resources MIB)
Problem
○
12
Customisable “ping test” for all discovered devices
Events to be configurable for any discovered device
○
○
○
○
○
○
○
●
Central events console for network and systems management events with ability to prioritise events
Ability to categorise events for display to specific users
Ability to receive and format SNMP traps for SNMP V1, V2 and preferably, V3
Ability to monitor Unix syslogs and Windows Event Logs and generate customisable events
Ideally the ability to monitor any test logfile and generate customisable events
Customisation of actions in response to events, both manual actions and automatic responses
Ability to correlate events to find rootcause problems (eg. singlepointof
failure router is root cause of availability failure for all devices in a network)
Performance
○
Regular, customisable monitoring of SNMP MIB variables, both standard and enterprise specific, with data storage and ability to threshold values to generate events
○
Ability to import any MIB
○
Ability to browse any MIB on any device
○
Ability to gather performance data by methods other than SNMP (eg. ssh )
○
Customisable graphing of performance data
4.3 What is out-of-scope?
In my environment, some things are specifically outofscope:
●
Software distribution
●
Remote configuration
●
Remote control of devices
●
High availability of management servers
●
Application response time
In the next few sections of this document I will explore some of the niche products briefly and then take a slightly more indepth look at OpenNMS, Nagios and Zenoss. These sections are not intended to be a full analysis of the products, more an “initial impressions” and a comparison of strengths and weaknesses. Subsequent documents will investigate Nagios, OpenNMS and Zenoss in more detail.
13
5 A quick look at Cacti, The Dude and netdisco
Cacti, The Dude and netdisco do not meet my mandatory requirements; however they are interesting niche solutions that were investigated during the tools evaluation process. Cacti and netdisco were installed; The Dude was only Internetresearched.
5.1 Cacti
Cacti is a niche tool for collecting, storing and displaying performance data. It is a comprehensive frontend to RRDTool, including the concept of user management. Although the default method of data collection is SNMP, other data collectors, typically scripts, are possible. Data collection is very configurable and is driven by the Cacti Poller process which is called periodically by the Operating System scheduler (cron for Unix). The default polling interval is 5 minutes.
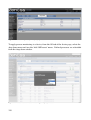
Devices need to be manually added using the Cacti webbased GUI. Basic information such as hostname, SNMP parameters and device type should be supplied. Depending on the device type selected (eg. ucd/net SNMP Host, Cisco Router), one or more default graph templates can be associated with a device along with one or more default SNMP data queries. In addition to the webbased GUI, configuration of Cacti can be done by Command Line, using PHP which is a generalpurpose scripting language especially suited for web development.
Cacti now has support for SNMP V3.
For highperformance polling, Spine (used to be cactid) can replace the base cmd.php polling engine. The user manual suggests that Spine could support polling intervals of less than 60 seconds for at least 20,000 data sources.
Cacti is supported on both Unix and Windows platforms.
Get the Cacti User Manual from http://www.cacti.net/downloads/docs/pdf/manual.pdf .
Cacti has a very active user forum with hundreds of appends per month. There is also a documented release roadmap going forward to 2nd quarter 2009.
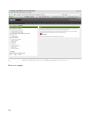
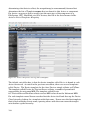
Here are a few screenshots of Cacti to give a feel for the product.
14
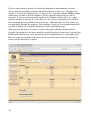
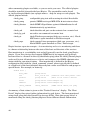
Figure 1: Cacti main Devices panel
15
Figure 2: Cacti graph of interface traffic
16
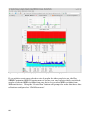
Figure 3: Cacti graph of memory for device bino
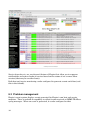
5.2 netdisco
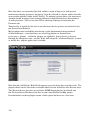
netdisco was created at the University of California, Santa Cruz (UCSC), Networking and Technology Services (NTS) department. It is interesting as a network management configuration offering. It uses SNMP and Cisco Discovery Protocol (CDP) to try and automatically discover devices. Unlike most other management offerings, netdisco is Layer 2 (switch) aware and can both display switch ports and optionally provide access to control switch ports. It provides an inventory of devices that you can sort either by OS or by device model, displaying all ports for a device. It also has the ability to provide a network map. User management is included so you can restrict who is allowed to actively manage devices. There is good provision of both command line interface and webbased GUI.
netdisco is supported on various platforms – it was originally developed on FreeBSD; I built it on a Centos 4 platform.
17
If your requirement is strictly for network configuration management and your devices respond suitably to netdisco then this might be worth a try. I found it very quirky as to what it would discover. It appears very dependent on the SNMP system sysServices variable to decide whether a device supports network layer 2 and 3 protocols; if a device did not provide sysServices or didn't indicate layer 2 / 3, then netdisco would not discover it. I also had very few devices supporting Cisco CDP so the automatic discovery didn't work well for me. Although there is a file where you can manually describe the topology, this would be a huge job in a sizeable network if you had to handcraft a significant amount of the network topology.
This project is not nearly so active as some of the other offerings discussed here (around 500 appends to the users maillist in 2007) but there seems to be a steady flow. Building the system was a fair marathon but the documentation is reasonably good.
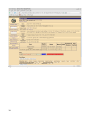
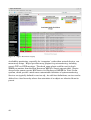
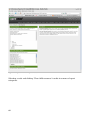
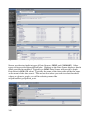
Here are some screenshots of the main device inventory panel, plus the details of a router and the details of a switch.
Figure 4: Netdisco main device inventory display
18
Figure 5: Netdisco details of router device
19
Figure 6: Netdisco details of a switch device, including ports
5.3 The Dude
I put some research into The Dude as it apparently provides auto discovery of a network with graphical map layout – something that is hard to find done well. From the Open Source perspective though, it really doesn't qualify. It is basically a Windows application though it can apparently run under WINE on Linux. It comes from a company called MikroTik and their website says it is “free” but it is unclear what the licensing arrangement is for The Dude. It has a very active forum.
It offers more than simply discovery and configuration as it can apparently monitor links and devices for availability and graph link performance. It can also generate notifications 20
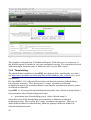
6 Nagios
Nagios evolved in 2002 out of an earlier systems management project called NetSaint, which had been around since the late 1990s. It is far more a systems management product, rather than a network management product. It is available to build on most flavours of Linux / Unix and the installation has become much easier over the years. The Nagios Quickstart document is reasonably comprehensive (although it misses a few prerequisites that I found necessary like gd, png, jpeg, zlib, netsnmp and their related development packages). I downloaded and built Nagios 3.0.1 on a SuSE 10.3 platform (hostname nagios3), and had it working inside half a day.
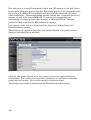
To start the Web Interface, point your browser at http://nagios3/nagios/ . The Quickstart document has you create some user ids and passwords – the default logon for the Web console is nagiosadmin with the password you specified during installation.
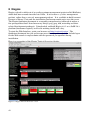
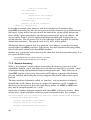
Here is a screenshot of the Nagios Tactical Overview display.
Figure 7: Nagios Tactical Overview screen
21
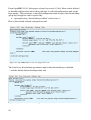
6.1 Configuration – Discovery and topology
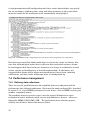
Nagios uses a number of files to configure discovery – outofthebox it will find nothing. Samples are available, by default, in /usr/local/nagios/etc . The main configuration file is nagios.cfg which defines a large number of parameters, most of which you can leave alone at the outset. Typically the main things to discover are “hosts” and “services”. These are defined in an objectoriented way such that you can define host and service toplevel classes with particular characteristics and then define subclasses and hosts that inherit from their parent classes. Rather than having a single, huge nagios,cfg, it can reference other files (typically in the objects subdirectory), where definitions for hosts, services and other object types, can be kept. So, for example, /usr/local/nagios/etc/nagios.cfg may contain lines such as:
cfg_file=/usr/local/nagios/etc/objects/hosts.cfg
cfg_file=/usr/local/nagios/etc/objects/services.cfg
cfg_file=/usr/local/nagios/etc/objects/commands.cfg
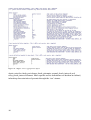
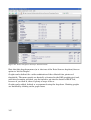
Definitions of hosts are built up in a hierarchical manner so the toplevel definitions may look like the following screenshot. Note the “use” stanza to denote inheritance of characteristics from a previous definition.
22
Figure 8: Nagios hosts.cfg toplevel definitions
Host availability parameters are shown in the screenshot above:
23
●
check_period (24x7)
●
check_interval (5 mins)
●
retry interval
(1 min)
●
max_check_attempts
( 10)
●
check_command
(check_host_alive which is based on check_ping)
Figure 9: Nagios hosts.cfg showing host template definitions
Subsequent definitions of subgroups and real hosts will follow. Note the use of the “parents” stanza to denote the network node that provides access to the device. This means that Nagios can tell the difference between a node that is down and a node that is unreachable because its access router is down.
24
Figure 10: Nagios hosts.cfg file showing real host definitions
Hosts can be defined to be a member of one or more host groups. This then makes subsequent configuration more scalable (for example, a service can be applied to a host group rather than to individual hosts). Host groups are typically defined in hosts.cfg.
Figure 11: Nagios hosts.cfg host group definitions
25
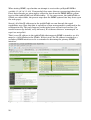
Host groups are also used in the GUI to display data based on host groups.
Figure 12: Nagios Host group summary
Whenever changes have taken place to any configuration file, the command:
/etc/init.d/nagios reload
should be used. This does not stop and start the Nagios processes (use stop | start | restart | status to control the background processes) – the reload parameter simply re
reads the configuration file(s). There is also a handy command to verify that your configuration files are legal and consistent, before actually performing the reload:
/usr/local/nagios/bin/nagios v /usr/local/nagios/etc/nagios.cfg
All objects to be managed need defining in the Nagios configuration files – there is no form of automatic discovery; however the ability to create object templates and thus an object hierarchy, makes definitions flexible and easy, once you have defined your hierarchies.
26
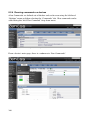
A great benefit of this configuration file is the ability to denote the network devices that provide access to specific nodes (parent / child relationship). This means that a map hierarchy can be displayed and also means that node reachability is encoded. If, for example, all nodes on the 172.31.100.32 network inherit from a template that includes a “parents group100r3” stanza, when group100r3 goes down then Nagios knows that all nodes in that network are unreachable (rather than down). Defining multiple parents for a meshed network seemed problematical though.
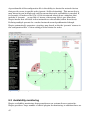
Nagios automatically generates a topology map, based on the the “parents” stanzas in the configuration files. Colourcoding provides status for nodes.
Figure 13: Nagios Status map
6.2 Availability monitoring
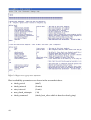
Nagios availability monitoring focuses much more on systems than on networks . Nagios provides a large number of official plugins for monitoring; in addition there are 27
other community plugins available, or you can write your own. The official plugins should be installed alongside the base Nagios. The executables can be found in /usr/local/nagios/libexec (use <plugin name> help for usage on each plugin). The official plugins include:
check_ping
configurable ping test with warning & critical thresholds
check_snmp
generic SNMP test to get MIB OIDs & test return values
check_ifstatus
check SNMP ifOperStatus against ifAdminStatus for all Administratively up interfaces
check_ssh
check that the ssh port can be contacted on a remote host
check_by_ssh
use ssh to run command on remote host
check_nt
check Windows parameters (disk, cpu, services, etc..). Needs NSClient++ agent installed on Windows targets
check_nrpe
check remote Linux parameters (disk, cpu, processes, etc..). Needs NRPE agent installed on Unix / Linux target
Nagios has two separate concepts – host monitoring and service monitoring and there is a known relationship between the state of the host and the state of its services. Host monitoring is a reachability test and will generally use the check_ping Nagios plugin. If you have devices that support SNMP but do not support ping (perhaps because there is a firewall in the way that blocks ping), then the check_ifstatus plugin works well to test all interfaces on a device and compares the SNMP administrative status with the operational status. Host monitoring is defined in the Nagios configuration files with the “check_command” stanza, where typically this is defined at a high level of the host definition hierarchy but can be overridden for subgroups or specific hosts. For example, in hosts.cfg:
define host {
host_name
group-100-a1
use
host_172.31.100
;Inherits from this parent class
parents
group-100-r2
;This is n/w route to device
alias
group-100-a1.class.example.org
address
group-100-a1.class.example.org
check_command
check_ifstatus
;SNMP status check, not ping
}
A summary of host status is given on the “Tactical Overview” display. The “Host Detail” display then gives further information for each device. The hosts monitored using check_ping show the Round Trip Average (RTA). Note that group100a1 is monitored using the check_ifstatus plugin so shows different Status Information.
28
Figure 14: Nagios Host Detail display
Availability monitoring, especially for “computers” rather than network devices, can mean many things. Nagios provides many plugins for port monitoring, including generic TCP and UDP monitors. The check_snmp plugin could be used to check SNMP parameters from the Host Resources MIB (if a target supports this). Nagios also provides remote agents, NSClient++ for Windows and NRPE for Unix / Linux systems, which provide a much more customisable definition of system monitoring.
Services are typically defined in services.cfg. As with host definitions, services can be defined in a class hierarchy where characteristics of an object are inherited from its parent.
29
Figure 15: Nagios service.cfg toplevel objects
Again, note the check_period,max_check_attempts, normal_check_interval and retry_check_interval stanzas. More specific service definitions can be then be defined, inheriting characteristics of parents through the “use” stanza:
30
Figure 16: Nagios services.cfg showing specific services
Note that services can be applied either to groups of hosts (hostgroup_name) or to specific hosts (host_name).
As with hosts, it is possible to create groups of services to improve the flexibility of configuration and the display of services.
Also note that some services run commands that are inherently local to the Nagios system eg. check_local_disk. The check_dns command runs nslookup on the Nagios system but the host_name parameter can be used to specify the DNS server to query from. The commands are actually specified in the configuration file commands.cfg, which, in turn, calls executable plugins in /usr/local/nagios/libexec .
31
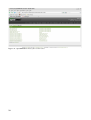
Figure 17: Nagios Service detail
Service dependencies are an advanced feature of Nagios that allow you to suppress notifications and active checks of services based on the status of one or more other services (that may be on other hosts).
Both host and service monitoring can be configured to generate events on failure (and this is the default).
6.3 Problem management
Nagios's event system displays events generated by Nagios's own host and service monitors. There is no builtin capability to collate events received as SNMP TRAPs or syslog messages. When an event is generated, it can be configured so that 32
notification(s) are generated to one or more users or groups of users. It is also possible to create automated responses to events (typically scripts).
Note that Nagios tends to use the terms event and alert interchangeably.
6.3.1 Event console
The Nagios Event Log is displayed from the lefthand menu:
Figure 18: Nagios Event Log
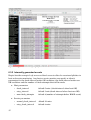
By default, the event log is displayed in onehourly sections. The log shows the event status and also shows whether a Notification has been generated (the megaphone symbol). This display is effectively simply showing /usr/local/nagios/var/nagios.log.
33
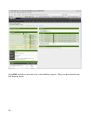
Under the Reporting heading on the lefthand menu, there are further options to display information on events (alerts). The Alert History is effectively the same as the Event Log. The Alert Histogram produces graphs for either a host or service with customisable parameters.
Figure 19: Nagios Configuration for Alert Histogram
Note in the figure above that a host / service selection has already been prompted for and, having selected “host”, the specific host has been supplied. The following figure shows the resulting graph. Note the blue links towards the top left of the display providing access to a filtered view of the events log ( View History for this Host) and to notifications for this host.
34
Figure 20: Nagios Alert Histogram for host group100r1
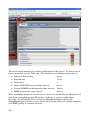
The Alert Summary menu option can provide various reports, specific to hosts or services.
35
Figure 21: Nagios Alert Summary configuration options
Limiting the report to a specific host, group100r1, produces the following report.
36
Figure 22: Nagios Alert Summary for group100r1
6.3.2 Internally generated events
Nagios has the concept of soft errors and hard errors to allow for occasional glitches in host and service monitoring. Any host or service monitor can specify or inherit parameters for the check interval under OK conditions, the check interval under non
OK conditions and the number of check attempts that will be made. ●
●
37
Host parameters
○
check_interval
default 5 mins (check interval when host OK)
○
retry_interval
default 1 min (check interval when host nonOK)
○
maxcheck_attempts default 4 (number of attempts before HARD event)
Service parameters
○
normal_check_interval default 10 mins
○
retry_check_interval default 2 mins
○
max_check_attempts default 3 (number of attempts before HARD event)
When a nonOK status is detected, a soft error is generated for each sampling interval until max_check_attempts are exhausted, after which a hard event will be generated. At this point, the polling interval reverts to the check_interval rather than the retry_interval.
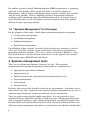
Figure 23: Nagios Event Log showing hard and soft events
Note from the earlier figure showing the topology layout, that group100r3 sits behind group100r1. Each of these host devices is being polled every 5 minutes when in an OK state (or max_check_attempts has been exceeded) and every 1 minute when a problem has arisen. The actual problem that has caused the event log shown above, is that group100r1 has failed; however, group100r3 is polled first and results in the first event for this device with a status of DOWN and a state type of SOFT. Subsequently, group100r1 is polled and found to be DOWN which results in the associated poll to group100r3 receiving a status of UNREACHABLE and a state type 38
of SOFT. The third poll of group100r3 again has a status of UNREACHABLE and a state type of SOFT.
The next event for group100r3 is a service ping monitor (which runs every 5 minutes for this device). Note that this event has a state type of HARD – this is because Nagios knows that the host status associated with this service monitor is already UNREACHABLE (or DOWN).
The fourth event results in a state type of HARD and the status of UNREACHABLE. The hard event also generates a notification.
6.3.3 SNMP TRAP reception and configuration
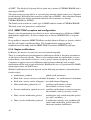
Nagios's own documentation says that it is not a replacement for a fullblown SNMP management application. It has no simple way to receive SNMP TRAPs or to parse them.
It is possible to integrate SNMP TRAPs by sending them to Nagios as “passive checks” but this will require significant effort. The documentation suggests using a combination of netsnmp and the SNMP TRAP Translator (SNMPTT) packages.
6.3.4 Nagios notifications
In Nagios, the terms event and alert are used interchangeably.
There is a comprehensive mechanism for notifications which is driven by parameters on the host and service checks. There is also configuration for notifications on a per
contact basis; each check can have a contact_groups stanza specifying who to contact. Contacts can appear in several different contact groups (although only a single notification will be sent to any individual). Notifications are only generated for HARD status type events, not SOFT ones.
Whether notifications are sent depends on the following parameters / characteristics (in this order);
●
notifications_enabled
●
Each host / service can have scheduled downtime – no notifications in downtime
●
Each host / service can be “flapping” no notifications if flapping
●
Host notification_options (d,u,r)
●
39
global on/off parameter
specifies notifications on down, unreachable, recovery events
Service notification_options (w,u,c,r) specifies notifications on service warning, unreachable, critical, recovery events
●
Host / service notification_period
notifications only sent during this period (eg. 24x7, workdays,...)
●
Host / service notification_interval
if notification already sent, problem still extant and notification_period exceeded then send another notification
Once each of these filters for notification has been tested and passed, contact filters are then applied for each contact in the group(s) indicated in the host or service contact_groups stanza. Here is the default definition:
Figure 24: Nagios Default contact definition
Notifications for hosts and services can be sent 24x7. They are sent for all types of events and use a Nagios command that drives the email system. As with all other Nagios configurations, more specific users and groups of users can be defined which change any of these parameters.
An event has to satisfy the global criteria, the specific host / service criteria and the contact criteria, before a notification is actually sent.
Remember from the Alerts Histogram report, it is possible to see notifications for a particular host.
Figure 25: Nagios Host Notifications
40
6.3.5 Automatic responses to events – event handlers
Nagios can run automatic actions (event handlers) when a service or host: •
•
•
Is in a SOFT problem state Initially goes into a HARD problem state Initially recovers from a SOFT or HARD problem state There is a global parameter, enable_event_handlers which must take the value 1 (true), before any automation can take place. There are two global parameters, global_host_event_handler and global_service_event_handler which can be used to run commands on all host / service events. These might be used, say, to log all events to an external file.
In addition, individual host and services (or groups of either) can have their own event_handler directive and their own event_handler_enabled directive. Note that if the global enable_event_handlers is off then no individual host / service will run event handlers. Individual event handlers will run immediately after and global event handler.
Typically, an event handler will be a script or program, defined in the Nagios commands.cfg file, to run any external program. The following parameters will be passed to the event handler:
For Services: $SERVICESTATE$ , $SERVICESTATETYPE$, $SERVICEATTEMP$
For Hosts: $HOSTSTATE$ , $HOSTSTATETYPE$ , $HOSTATTEMPT$ Event handler scripts will run with the same user privilege as that which runs the nagios program.
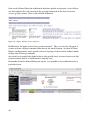
Sample event handler scripts can be found in the contrib/eventhandlers/ subdirectory of the Nagios distribution. Here is the sample submit_check_results command:
41
Figure 26: Nagios Sample submit_check_result command for event handler from contrib directory
6.4 Performance management
Nagios does not have performance data collection and reporting outofthebox; however, it does provide configuration parameters such that any host check or service check may also return performance data, provided the plugin supplies such data. This data can then either be processed by a Nagios command or the data can be written to a file to be processed asynchronously either by a Nagios command or by some other mechanism – mrtg, RRDTool and Cacti may all be contenders for the postprocessing.
There are a number of global parameters that control the collection of performance data, typically in /usr/local/nagios/etc/nagios.cfg:
●
process_performance_data
global on/off switch
●
host_perfdata_command
Nagios command to be executed on data
●
service_perfdata_command
Nagios command to be executed on data
●
host_perfdata_file
datafile for asynchronous processing
●
service_perfdata_file
datafile for asynchronous processing
○
42
Note – either use the command parameter for data processing when the data is retrieved, or use the data file for later processing
●
host_perfdata_file_processing_interval process data file every <n> seconds
●
service_perfdata_file_processing_interval process data file every <n> seconds
●
host_perfdata_file_processing_command ●
service_perfdata_file_processing_command Nagios command to process data
●
host_perfdata_file_template
format of data file
●
service_perfdata_file_template format of data file
Nagios command to process data
Figure 27: Nagios Performance parameters in nagios.cfg
The default is that process_performance_data=0 (ie. off) and all the other parameters are commented out. In addition to the global parameters, each host and service needs to either explicitly configure or inherit a definition for:
43
●
process_perf_data = 1
1 = data collection on, 0 = data collection off
By default, the generic_host and generic_service template definitions set these parameters to 1 (on).
If a Nagios plugin is able to provide performance data, it is returned after the usual status information, separated by a | (pipe) symbol. It can be retrieved as the $HOSTPERFDATA$ or $SERVICEPERFDATA$ macro. It is then upto your Nagios commands to interpret and manipulate that data.
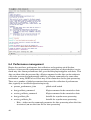
The next figure shows performance data that has been gathered into /tmp/service
perfdata using the default service_perfdata_file_template where the last field is the $SERVICEPERFDATA$ value (if the plugin delivers performance data).
Figure 28: Nagios Performance data collected into /tmp/serviceperfdata
The most recent performance data gathered for hosts and services can also be seen from the Host Detail or Service Detail menu options.
44
Figure 29: Nagios Performance data highlighted DNS Check service
6.5 Nagios summary
Nagios is a mature systems management tool whose documentation is much better than the other open source offerings. It's strength is in checking availability of hosts and services that run on those hosts. Support for network management is less strong as there is no automatic discovery; however it is possible to configure simple network topologies and it includes the concept of a set of devices being UNREACHABLE (rather than DOWN) if there is a network singlepointoffailure. Handling meshed networks with multiple routing paths to a network is problematical.
Since all monitoring is performed by plugins, some of which come with the product and some of which are available as community contributions, the tool is as flexible as anyone requires. There are a large number of plugins available and you can also write your own.
One of the standard plugins is check_snmp which can be used to query any host for any SNMP MIB variable; this obviously requires the target to support SNMP and the MIB in question. 45
It is also possible to run checks on remote hosts by installing the NRPE agent (available for both Unix / Linux and Windows hosts) and the required Nagios plugins, on the remote system. The check_nrpe plugin must also be installed on the Nagios system. This allows plugins designed to be run local to the Nagios system, to be run on remote hosts. With NRPE agents, checks are run on a scheduled basis, initiated from the Nagios system.
Another alternative is to install the NSCA addon to remote systems. This permits remote machines to run their own periodic checks and report the results back to Nagios, which can be defined as passive service checks.
The event subsystem of Nagios is less powerful and configurable than some of the other offerings – it has less focus on an “event console” but includes more information about host and service events from other menus. Nagios has no easy builtin way to collect and process SNMP TRAPs.
If you want lots of performance graphs then Nagios alone is not going to deliver easily.
In summary, Nagios seems good for monitoring a relatively small number of systems, provided you don't need historical performance reporting.
7 OpenNMS
OpenNMS presents itself as “the first Enterprisegrade network management platform developed under the Open Source model”. It is a Java application that runs under several flavours of Linux. A VMware Virtual Machine (VM) is also available with the latest release of OpenNMS, which makes initial evaluation very easy without having to go through a full build process. There is also an online demo system which appears to be monitoring real kit which gives a good “first taste” of the product. The following section is based on the VM download which is OpenNMS 1.5.93 based on Mandriva it worked very easily. The VM was setup for DHCP but I modified the Operating System files to use a local fixed address, with the VM network bridged to my local environment.
To access the OpenNMS Web Console, point your browser at http://opennms:
8980/opennms/ . The default logon id is admin with a password of admin .
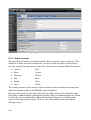
Here is a screenshot of the main default window of OpenNMS.
46
Figure 30: Main default window for OpenNMS
The following sections will describe how to configure different aspects of OpenNMS by editing xml configuration files. It is possible to configure many aspects of OpenNMS using GUIdriven menus. See section 7.5 “Managing OpenNMS” for a brief description.
7.1 Configuration – Discovery and topology
7.1.1 Interface discovery
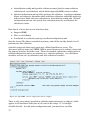
OpenNMS uses a straightforward file for interface discovery – by default this is /opt/opennms/etc/discoveryconfiguration.xml . It comes with some commentedout defaults, so by default it discovers nothing! This file needs modifying to specify include ranges and exclude ranges to ping; specific IP addresses for discovery can also be configured. The first stanza specifies the characteristics of the ping discovery mechanism. If there is a response within the timeout, a "new suspect" event is generated.
<discovery-configuration threads="1" packets-per-second="1"
initial-sleep-time="300000" restart-sleep-time="86400000"
retries="3" timeout="800">
<include-range retries="2" timeout="3000">
<begin>10.0.0.1</begin>
47
<end>10.0.0.254</end>
</include-range>
<include-range >
<begin>172.30.100.1</begin>
<end>172.30.100.10</end>
</include-range>
<specific 10.191.101.1/specific>
</discovery-configuration>
In the above example, ping discovery will start 300,000 ms (5 minutes) after OpenNMS has started up; the discovery process will be restarted every 86,400,000 ms (24 hours); 1 ping will be sent per second; the timeout for a ping will be 800 ms and there will be 3 ping retries before the discovery process gives up on an address. All devices on the Class C 10.0.0.0 network will be polled (with only 2 retries but a 3 second timeout). The 10 devices 172.30.100.1 through 10 will be polled for with the default characteristics. The specific node 10.191.101.1 will be polled.
All that the discover process does is to generate “new suspect” events that are then used by other OpenNMS processes. If the device does not respond to this ping polling then it will not be added to the OpenNMS database. Another way to generate such events (say for a box that does not respond to ping), is to use a provided Perl script:
/opt/opennms/bin/sendevent.pl –interface <ip addr> uei.opennms.org/internal/discovery/newsuspect
7.1.2 Service discovery
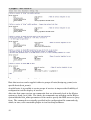
When a “new suspect” event has been generated by the discovery process it is the capabilities daemon, capsd, that takes over and discovers services on a system. capsd is configured using /opt/opennms/etc/capsdconfiguration.xml . Thus, discovery in OpenNMS consists of two parts: discovering an IP address to monitor (the discover process) and then discovering the services supported by that IP address (the capsd process). The basic monitored element is called an "interface", and an interface is uniquely identified by an IP address. Services are mapped to interfaces, and if a number of interfaces are discovered to be on the same device (either via SNMP or SMB) then they may be grouped together as a "node". capsd uses a number of plugins supplied with OpenNMS, to discover services. Each service has a <protocolplugin> stanza in capsdconfiguration.xml. For example:
<protocol-plugin protocol="SSH" class-name="org.opennms.netmgt.capsd.TcpPlugin"
scan="on" user-defined="false">
<property key="banner" value="SSH"/>
<property key="port" value="22"/>
<property key="timeout" value="3000"/>
48
<property key="retry" value="1"/>
</protocol-plugin>
This defines a service (protocol) called SSH that tests TCP port 22 using the TCP plugin. It will look for the string “SSH” to be returned. Timeout is 3 seconds with 1 retry.
The first protocol entry in capsdconfiguration.xml is for ICMP.
<protocol-plugin protocol="ICMP"
class-name="org.opennms.netmgt.capsd.IcmpPlugin" scan="on" user-defined="false">
<property key="timeout" value="2000"/>
<property key="retry" value="1"/>
</protocol-plugin>
It is possible to apply protocols to specific address ranges or exclude protocols from address ranges (the default is inclusion).
<protocol-plugin protocol="ICMP"
class-name="org.opennms.netmgt.capsd.IcmpPlugin" scan="on" user-defined="false">
<protocol-configuration scan="off" user-defined="false">
<range begin="172.31.100.1" end="172.31.100.15"/>
<property key="timeout" value="4000"/>
<property key="retry" value="3"/>
</protocol-configuration>
</protocol-plugin>
Note the “scan=off” for IP addresses 172.31.100.1 – 15 .
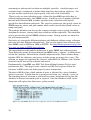
The SNMP protocol is special in that, if supported, it provides a way to collect performance data as well as poll for availability management information. SNMP parameters for different devices and ranges of devices are specified in /opt/opennms/etc/snmpconfig.xml. Here is a sample:
<snmp-config retry="3" timeout="800" version=”v1” port=”161”
read-community="public" write-community="private">
<definition version="v2c">
<specific>10.0.0.121</specific>
</definition>
<definition retry="2" timeout="1000">
<range begin="172.31.100.1" end="172.31.100.254"/>
</definition>
<definition read-community="fraclmye" write-community="rrwatr">
<range begin="10.0.0.1" end="10.0.0.254"/>
</definition>
</snmp-config>
The first stanza in snmpconfig.xml provides global default parameters for SNMP access. Variations in any of these global parameters can be made using a “definition” stanza and either a range or a specific statement. This file is used both for discovery and for collecting performance data.
49
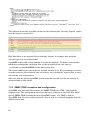
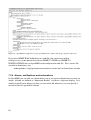
When testing SNMP, capsd makes an attempt to receive the sysObjectID MIB2 variable (.1.3.6.1.2.1.1.2.0). If successful, then extra discovery processing takes place. First, three threads are generated to collect the data from the SNMP MIB2 system tree and the ipAddrTable and ifTable tables. If, for some reason, the ipAddrTable or ifTable are unavailable, the process stops (but the SNMP system data may show up on the node page). Second, all of the IP addresses in the ipAddrTable are run through the capsd capabilities scan. Note that this is regardless of how management is configured in the configuration file. This only happens on the initial scan and on forced rescans. On normal rescans (by default, every 24 hours), IP addresses that are "unmanaged" in capsd are not polled. Third, every IP address in the ipAddrTable that supports SNMP is tested to see if it maps to a valid ifIndex in the ifTable. If this is true, the IP address is marked as a secondary SNMP interface and is a contender for becoming the primary SNMP interface. Figure 31: OpenNMS node detail for a switch showing switch ports
50
The first stanza in capsdconfiguration.xml defines service polling parameters:
<capsd-configuration rescan-frequency="86400000"
initial-sleep-time="300000"
management-policy="managed"
max-suspect-thread-pool-size = "6"
max-rescan-thread-pool-size = "3"
abort-protocol-scans-if-no-route = "false">
This defines that capsd will wait 5 minutes after OpenNMS starts before starting the capsd discovery process. It will rescan to discover services every 24 hours. The default management policy for all IP addresses found in “new suspect” events will be to scan for each of the services. This “managed” parameter can be overridden at the end of capsdconfiguration.xml by unmanagedrange stanzas:
<ip-management policy="unmanaged">
<specific>0.0.0.0</specific>
<range begin="127.0.0.0" end="127.255.255.255"/>
</ip-management>
When a “new suspect” event is generated, provided the IP address is in a “managed” managementpolicy range, the IP address is checked for each of the services in capsd
configuration.xml, starting from the top.
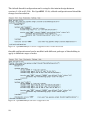
If the device does not respond to any configured service then, even if triggered with send_event.pl, it will not be added to the OpenNMS database. Look in /opt/opennms/logs/daemon/discovery.log for debugging information. 7.1.3 Topology mapping and displays
OpenNMS does not use a topology mapping function in the core code (indeed, some of its proponents are vociferous that you do not need a mapping ability). There is a mapping capability if you use an Internet Explorer web browser with a specific Adobe Scalable Vector Graphics (SVG) plugin – this is only supported in IE and did not work for me. There is also a mapsonfirefox code branch but performance is said to be poor and the maillists suggest that neither mapping capability is heavily used.
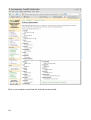
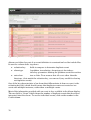
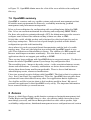
A Node List is available from the main menu where each node name is a link to a detailed node page.
51
Figure 32: OpenNMS Node List of discovered nodes
52
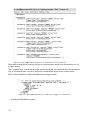
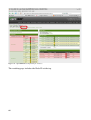
Figure 33: OpenNMS node detail for group100r1
Note the services that have been discovered for the node. The list of services per interface are those that have been actually detected; whether they are “Monitored” or not will be discussed in the next section.
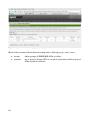
7.2 Availability monitoring
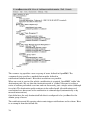
OpenNMS performs availability monitoring by polling devices with processes known as monitors which connect to a device and perform a simple test. Polling only happens to an interface that has already been discovered by capsd. The configuration file for polling is /opt/opennms/etc/pollerconfiguration.xml. There are many similarities between this and capsdconfiguration.xml; however the monitors are defined with “monitor service” stanzas (rather than “protocol” stanzas), which define the Java class to use for monitoring. 53
<monitor service="DominoIIOP"
<monitor service="ICMP"
<monitor service="Citrix"
<monitor service="LDAP"
<monitor service="HTTP"
<monitor service="HTTP-8080"
<monitor service="HTTP-8000"
<monitor service="HTTPS"
<monitor service="SMTP"
<monitor service="DHCP"
<monitor service="DNS"
<monitor service="FTP"
<monitor service="SNMP"
<monitor service="Oracle"
<monitor service="Postgres"
<monitor service="MySQL"
<monitor service="Sybase"
<monitor service="Informix"
<monitor service="SQLServer"
<monitor service="SSH"
<monitor service="IMAP"
<monitor service="POP3"
<monitor service="NSClient
<monitor service="NSClientpp
class-name="org.opennms.netmgt.poller.DominoIIOPMonitor"/>
class-name="org.opennms.netmgt.poller.IcmpMonitor"/>
class-name="org.opennms.netmgt.poller.CitrixMonitor"/>
class-name="org.opennms.netmgt.poller.LdapMonitor"/>
class-name="org.opennms.netmgt.poller.HttpMonitor"/>
class-name="org.opennms.netmgt.poller.HttpMonitor"/>
class-name="org.opennms.netmgt.poller.HttpMonitor"/>
class-name="org.opennms.netmgt.poller.HttpsMonitor"/>
class-name="org.opennms.netmgt.poller.SmtpMonitor"/>
class-name="org.opennms.netmgt.poller.DhcpMonitor"/>
class-name="org.opennms.netmgt.poller.DnsMonitor" />
class-name="org.opennms.netmgt.poller.FtpMonitor"/>
class-name="org.opennms.netmgt.poller.SnmpMonitor"/>
class-name="org.opennms.netmgt.poller.TcpMonitor"/>
class-name="org.opennms.netmgt.poller.TcpMonitor"/>
class-name="org.opennms.netmgt.poller.TcpMonitor"/>
class-name="org.opennms.netmgt.poller.TcpMonitor"/>
class-name="org.opennms.netmgt.poller.TcpMonitor"/>
class-name="org.opennms.netmgt.poller.TcpMonitor"/>
class-name="org.opennms.netmgt.poller.TcpMonitor"/>
class-name="org.opennms.netmgt.poller.ImapMonitor"/>
class-name="org.opennms.netmgt.poller.Pop3Monitor"/>
class-name="org.opennms.netmgt.poller.NsclientMonitor"/>
class-name="org.opennms.netmgt.poller.NsclientMonitor"/>
<monitor service="Windows-Task-Scheduler" class-name="org.opennms.netmgt.poller.Win32ServiceMonitor"/>
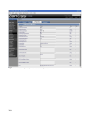
Preceding the “monitor service” stanzas in pollerconfiguration.xml are the definitions of “services”. These look very similar to the entries in capsdconfiguration.xml (which makes sense as this is the regular polling definitions for the same services that capsd has already found); however parameters in the poller file may well take different values (for example, the discovery service may be allowed longer timeouts and more retries than the polling service).
<service name="ICMP" interval="300000" user-defined="false" status="on">
<parameter key="retry" value="2"/>
<parameter key="timeout" value="3000"/>
</service>
<service name="SNMP" interval="300000" user-defined="false" status="off">
<parameter key="retry" value="2"/>
<parameter key="timeout" value="3000"/>
<parameter key="port" value="161"/>
<parameter key="oid" value=".1.3.6.1.2.1.1.2.0"/>
</service>
Note that the default pollerconfiguration.xml has the SNMP monitor service turned off.
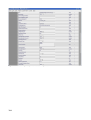
Services may be defined several times with different parameters – each service will obviously require a unique name. This is so that different devices can receive availability monitoring with different characteristics. For availability polling, devices are grouped together in packages, where a package defines:
54
●
target interfaces
●
services including the polling frequency
●
●
a downtime model (which controls how the poller will dynamically adjust its polling on services that are down)
an outage calendar that schedules times when the poller is not to poll (i.e. scheduled downtime). There are two packages defined in the default pollerconfiguration.xml file, example1 and a separate package, strafer, to monitor StrafePing. A package definition must include a single “filter” stanza; it may also have “specific”, “includerange” and “excluderange” stanzas. Here is the start of the default, as shipped:
<package name="example1">
<filter>IPADDR != '0.0.0.0'</filter>
<include-range begin= 1.1.1.1
end= 254.254.254.254 />
It is then followed by the list of services pertinent to that package – example1 includes many of the services, with each service set to status=”on” except SNMP. The opening stanza in pollerconfiguration.xml controls the overall behaviour of polling:
<poller-configuration
threads="30"
serviceUnresponsiveEnabled="false"
nextOutageId= SELECT nextval('outageNxtId')
xmlrpc= false >
<node-outage status="on"
pollAllIfNoCriticalServiceDefined="true">
<critical-service name="ICMP"/>
</node-outage>
30 threads are available for polling. The basic event that is generated when a poll fails is called "NodeLostService". If more than one service is lost, multiple NodeLostService events will be generated. If all the services on an interface are down, instead of a NodeLostService event, an "InterfaceDown" event will be generated. If all the interfaces on a node are down, the node itself can be considered down, and this section of the configuration file controls the poller behaviour should that occur. If a "NodeDown" event occurs and nodeoutage status=”on” then all of the InterfaceDown and NodeLostService events will be suppressed and only a NodeDown event will be generated. Instead of attempting to poll all the services on the down node, the poller will attempt to poll only the “criticalservice”. Once the critical service returns, the poller will then resume polling the other services.
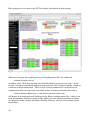
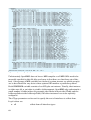
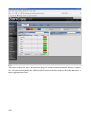
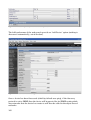
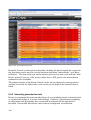
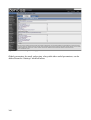
Note in the following screenshot that six services have been discovered on the 10.0.0.95 interface of the node called deodar.skills1st.co.uk, of which four are monitored. The two interfaces on the 172.16 network have been detected through SNMP queries but there is no monitoring of any services on these networks. There are no current issues with deodar and availability has been 100% over the last 24 hours.
55
Figure 34: OpenNMS node detail with monitored services
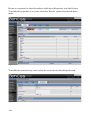
OpenNMS includes a standard set of Availability reports. They can be selected from the Reports menu:
56
Figure 35: OpenNMS Availability reports menu
Here is a sample:
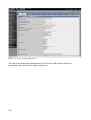
57
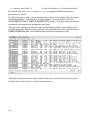
Figure 36: OpenNMS Overall service availability report
Note that there is an /opt/opennms/etc/examples directory with extra samples of all the OpenNMS configuration files. Also note that OpenNMS needs recycling if any configuration files have been modified. Use:
/etc/init.d/opennms stop
/etc/init.d/opennms start
58
7.3 Problem management
For problem management, OpenNMS has the concepts of:
●
Events
all sorts of both good and bad news
●
Alarms
“important” events
●
Notifications
typically email or pager but could be other methods
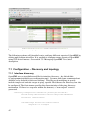
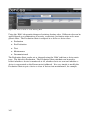
The events subsystem is driven by the eventd process which listens on port 5817. Out
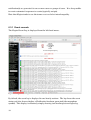
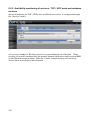
ofthebox, eventd receives internal events from OpenNMS (such as “new suspect” events) and SNMP TRAPs. It is possible to also configure for other event sources (such as from syslogs). 7.3.1 Event console
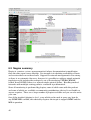
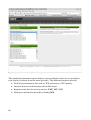
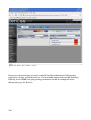
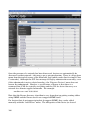
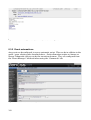
Events can be viewed from the web GUI by selecting the “Events” option.
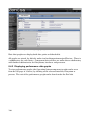
Figure 37: OpenNMS Events menu
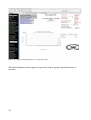
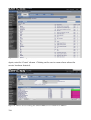
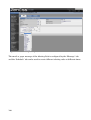
The “Advanced Search” option provides several ways to filter events. By default “Outstanding” events are displayed (ie. events that have not been Acknowledged).
59
Figure 38: OpenNMS Advanced Event Search options
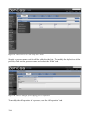
Note that if you wish to search on severity, you have to specify an exact severity; you cannot specify “severity greater than....”.
60
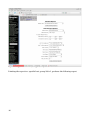
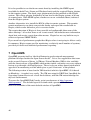
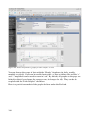
Figure 39: OpenNMS display of All events
The column headers can be clicked on to use as sort keys (ascending / descending). The “Ack” box can be ticked to Acknowledge one or more events – they will then disappear from this display which only shows “Outstanding” events. Click on the “” symbol beside “Event(s) outstanding” to see “Event(s) Acknowledged”, including the name of the user that acknowledged the event.
The various [+] and [] links can be used to filter in/out on the parameter (such as node, interface, or service). The [<] and [>] beside the Time can be used to filter for events before or after this time.
To see the event detail, click on the ID link.
61
Figure 40: OpenNMS Event detail for event 139192
7.3.2 Internally generated events
Events (and indeed alarms) are configured in /opt/opennms/etc/eventconf.xml, where the first match for an event defines its characteristics. For this reason, the ordering of stanzas in eventconf.xml is very important. Any individual event is identified by a Universal Event Identifier (uei).
Events are bracketed by <event> </event> tags. Within the event definition, the following tags can also be used:
●
uei
a label to uniquely identify the event
●
eventlabel
a text label for the event – used in the Web GUI
●
descr
description of the event
●
logmsg
summary of the event where the dest parameter is one of:
○
logndisplay
log to events database and display in web GUI
○
logonly
log to database but don't display in web GUI
○
suppress
don't log to database or web GUI
○
donotpersist
don't log or display but do pass to other daemons (eg. for notification)
○
discardtraps
trapd to discard TRAPs – no processing whatsoever
●
severity
●
alarmdata
○
62
create an alarm for this event with
reductionkey fields to compare to determine duplicate event
○
alarmtype
1=problem, 2=resolution. alarmtype=2 also takes a clearkey parameter defining the problem event this resolves
○
autoclean
true or false
●
operinstruct
optional instructions for operators using the web GUI
●
mouseovertext
text to display when mouse positioned over this event
●
autoaction
absolute pathname to executable program executed every event instance
Many of the tags can use data substituted from the event. These are documented on the OpenNMS wiki:
63
Figure 41: OpenNMS event parameters that can be substituted
Here is an example event from the default eventconf.xml:
64
Figure 42: OpenNMS event definition for nodeLostService
The different severities available can be seen by selecting the “Severity Legend” option from the top of an events list.
Figure 43: OpenNMS event severity legend
Note that there is no separate file to configure alarms; it is simply done with the <alarmtype> tag in eventconf.xml.
OpenNMS comes with a huge number of events predefined. To make eventconf.xml much more manageable, inclusion files can be specified at the end, such as:
<eventfile>events/NetSNMP.events.xml</eventfile>
The events subdirectory currently has around 100 files in it! For performance reasons, it makes sense to edit eventconf.xml and remove any <eventfile> stanzas that are not relevant for your organisation.
Also note that the whole OpenNMS system must be recycled in order for changes to eventconf.xml to take effect!
7.3.3 SNMP TRAP reception and configuration
OpenNMS will automatically monitor the SNMP TRAP part (UDP / 162) with the trapd process. The /opt/opennms/etc/events directory contains around 100 files which specify SNMP TRAP translations into OpenNMS events. If a TRAP is sent to OpenNMS that it has no configuration for, then it will use a default mapping found in default.events.xml.
65
Figure 44: OpenNMS Unknown trap appears in the Events list
Clicking on the event ID gives the detail of the event which shows all the information that arrived with the TRAP.
Figure 45: OpenNMS Event detail for an unformatted TRAP
TRAPs are configured in eventconf.xml (or an include file), using the <mask> tag. This tag specifies mask elements with name / value pairs that must match data delivered by the TRAP, in order for this particular event configuration to match.
66
Figure 46: OpenNMS Definition in default.events.xml for an unknown specific trap
This example event will match any TRAP whose “generic” field is equal to 6. Note, as with other configurations in eventconf.xml, that this definition will only match the incoming TRAP if no previous definition higher in the file (or include files) had already matched it.
The mask element name tag must be one (or more) of the following:
●
uei
●
source
●
host
●
snmphost
●
nodeid
●
interface
●
service
●
id (OID)
●
specific
●
generic
It is possible to use the "%" symbol to indicate a wildcard in the mask values.
SNMP TRAPs often have additional data with them, known as “varbinds”. This data can be accessed using the <parm> element, where:
Each parameter consists of a name and a value. •
•
•
67
%parm[all]%: Will return a spaceseparated list of all parameter values in the form parmName1="parmValue1" parmName2="parmValue2" etc. %parm[values-all]%: Will return a spaceseparated list of all parameter values associated with the event. %parm[names-all]%: Will return a spaceseparated list of all parameter names associated with the event. •
•
•
%parm[<name>]%: Will return the value of the parameter named <name> if it exists. %parm[##]%: Will return the total number of parameters. %parm[#<num>]%: Will return the value of parameter number <num>. Any of this data can be used in the message or description fields.
In addition, the varbind data can also be used to filter the event within the <mask> tags, following the <maskelement> tags. It is possible to match more than one varbind, and more than one value per varbind. For example:
<varbind>
<vbnumber>3</vbnumber>
<vbvalue>2</vbvalue>
<vbvalue>3</vbvalue>
</varbind>
<varbind>
<vbnumber>4</vbnumber>
<vbvalue>2</vbvalue>
<vbvalue>3</vbvalue>
</varbind>
The above code snippet will match if the third parameter has a value of "2" or "3" and the fourth parameter has a value of "2" or "3". It is also possible to use regular expressions when matching varbind values.
Again, note that the order in which events are listed is very important. Put the most specific events first. Here is an example definition that includes matching a varbind with a regular expression. Note the <vbvalue> matches any string that contains either Bad or bad .
Extra stanzas have also been added for <operinstruct> help (which provides a web link on one line and plain text on the second), a <mouseovertext> tag (which doesn't appear to work) and a tag to run an automatic action (a shellscript) whenever this event occurs.
68
Figure 47: OpenNMS Configuration of specific TRAP with varbind matching a regular expression
If you have SNMP TRAP definitions in a mib file, the open source utility mib2opennms can be obtained to convert SNMP V1 TRAPs and SNMP V2 NOTIFICATIONS into an OpenNMS event configuration xml file. For a source file vcs.mib in /home/jane, use:
mib2opennms f /opt/opennms/etc/events/vcs.events.xml m /home/jane vcs.mib
7.3.4 Alarms, notifications and automations
In OpenNMS you can add an <alarmdata> tag to an event configuration to create an alarm. Alarms are defined as “Important Events” and have a separate display. It is similar to the Events display in that you can select All Alarms or you can specify a search to filter for particular alarms.
69
Figure 48: OpenNMS Alarms display
Alarms are defined as part of an event definition in eventconf.xml and its include files. It uses the <alarmdata> tag where:
●
reductionkey
fields to compare to determine duplicate event
●
alarmtype
1=problem, 2=resolution. alarmtype=2 also takes a clearkey parameter defining the problem event this resolves
●
autoclean
true or false. True ensures that all events other than the latest one, that match the reductionkey, are removed (very useful for clearing out duplicate events)
One of the key characteristics of an alarm that differentiates it from an event, is the reductionkey field, which should ensure that duplicate events are treated as one event with multiple instances, rather than as multiple events.
Most of the information provided with an event is also available in the Alarm display. The new field is “Count” which shows the number of duplicate events that have been integrated into this alarm. To see the individual events, click on the number in the Count column. 70
At present (July 10th, 2008), acknowledging events has no effect on related alarms, and vice versa. Note that the concepts of “Acknowledging” and “Clearing” are completely different. An operator can acknowledge an event or an alarm, and then owns it. This does not clear the event (ie. remove it entirely from the events database).
Automatic actions can be configured for an event using the <autoaction> tag but this can only run an executable and it runs on every occurrence of the event (which may not be what you want!).
OpenNMS's concept of automation, however, is triggered from alarms rather than events. Automation is the concept of actions being performed on a scheduled basis, provided the correct triggers exist. An <automation> tag includes:
●
name
the name of the automation
●
interval
the frequency in milliseconds at which the automation runs
●
triggername
a string that references a trigger definition
●
actionname
a string that references an action definition
The triggers and actions are SQL statements that operate on the events database. Automation is defined in /opt/opennms/etc/vacuumd.xml where there are a number of useful rules, by default:
71
Figure 49: OpenNMS Default definitions for automations in vacuumd.xml
Note that automations always require an actionname but do not necessarily need a triggername.
The “cosmicClear” automation is the means by which an <alarmdata> alarmtype=2 tag in eventconf.xml, can clear bad news events when good news events arrive.
Here is the definition of the selectResolvers trigger name:
Figure 50: OpenNMS Definition of selectResolvers trigger in vacuumd.xml
... and the clearProblems action:
72
Figure 51: OpenNMS Definition of clearProblems action in vacuumd.xml
The trigger is keyed on the field alarmType=2 . Note that the first version of the action is commented out – the “clearuei” element is now deprecated in the <alarm
data> tag and only the “clearkey” element on the good news event is used to match against the “reductionkey” element of the bad news event, setting the severity to 2 (ie. Cleared). Also note from the <automation> tag that cosmicClear will run every 30 seconds.
If users need to be notified of an event then OpenNMS provides email and pager notifications outofthebox, run by the notifd daemon. It is also possible to create other notification methods such as SNMP TRAPs or an arbitrary external program. There are several related configuration files in /opt/opennms/etc :
●
destinationPaths.xml
who, when, how to notify / escalate
●
notifdconfiguration.xml
global parameters for notifd
●
notificationCommands.xml
notification methods – email, http, page
●
notifications.xml
what events generate notifications, where
●
javamailconfiguration.properties
configuration for java emailer (default)
The main files that will need attention are destinationPaths.xml, notifd
configuration.xml and notifications.xml. Here is part of the examples file provided in /etc/opennms/etc/examples/destinationPaths.xml:
73
Figure 52: OpenNMS Example entries in destinationPaths.xml
The <name> tag specifies a user or group of users defined in OpenNMS. The <command> tag specifies a method that must be defined in notificationCommands.xml. Note that escalations are possible.
When an event is received for which a notification is required, OpenNMS "walks" the destination path. We say that the destination path is "walked" because it is often a series of actions performed over time and not necessarily just a single action (although it can be). The destination path continues to be walked until all notifications and escalations have been sent or the notification is acknowledged (automatically or by manual intervention).
Outofthebox, the only destinationPath that is configured is for javaEmail to the Admin group of users.
The notifications.xml file species what events trigger notifications and to whom. Here is an example from the default file:
74
Figure 53: OpenNMS Extract of notifications from notifications.xml
The notification called “interfaceDown” is turned on; it applies to all interfaces other than 0.0.0.0; the notification is sent to the destination “EmailAdmin” (defined in destinationPaths.xml) and the text message of the email includes 3 parameters from the event – 4 parameters are included on the email subject. The default notifications.xml generates email to the Admin group for the following events:
●
interface Down
●
nodeDown
●
nodeLostService
●
nodeAdded
●
interfaceDeleted
●
High Threshold
●
Low Threshold
●
High Threshold Rearmed
●
Low Threshold Rearmed
Nothing, so far, has handled acknowledging notifications. This can either be done manually by a user or can be performed automatically. Either way, when a notification is acknowledged, it stops the destination path being walked for the original notification. It will also create a new notification to tell users that the original issue is resolved. Automatic acknowledgements are configured 75
in /opt/opennms/etc/notifdconfiguration.xml where <autoacknowledge> tags specify the uei resolution / problem events, along with the parameters on the event which must also match for the notification to be automatically acknowledged.
Figure 54: OpenNMS notifdconfiguration.xml with autoacknowledgements for notifications
Note that at present (July 2008) notifications are driven by events not alarms. Also note that acknowledging notices has no effect on their associated events or alarms.
It would appear that there has been a discussion of a change in architecture around events, alarms and notifications, at least throughout 2008. In the future, it is suggested that alarms will be where most automation is driven from, including notifications, and that events will become more of a background log.
7.4 Performance management
7.4.1 Defining data collections
There are several parallels between the capability discovery subsystem and the performance data collection subsystem. Each uses the snmpconfig.xml file, described in section 7.1.2, to get SNMP parameters for each device such as SNMP version, port number, community names. The capability discovery process, capsd, uses the protocol definitions in capsd
configuration.xml to determine what services (capabilities) to discover – these are things like SNMP, DNS, ICMP, SSH. The performance data collection process, collectd, uses 2 files to define what data to collect: 76
●
●
datacollectionconfig.xml specifies collection names (just the snmpcollection called default outofthebox), which defines (typically MIB) values to collect
collectdconfiguration.xml specifies packages for collection. A package combines filters and ranges to determine which interfaces collections should be applied to, with services which reference collections in datacollectionconfig.xml. collectd
configuration.xml can also specify data collection intervals and whether the collection is active.
Note that if a device has several interfaces that:
●
Support SNMP
●
Have a valid ifIndex ●
Is included in a collection package in collectdconfiguration.xml
then the lowest IP address is marked as primary and will be used by default for all performance data collection. collectd is triggered when capsd generates a NodeGainedService event. The discovered protocol name (eg. SNMP, SSH) is passed from capsd to collectd, along with the primary interface from the event. These are checked against the configuration in collectdconfiguration.xml to see whether any collection packages are valid (there should be at least one, by definition!) and data collection is started.
Figure 55: OpenNMS collectdconfiguration.xml as shipped
There is only one package specified in collectdconfiguration.xml, as shipped, which applies to all interfaces other than 0.0.0.0 and in the range 1.1.1.1 through 254.254.254.254 . As with pollerconfiguration.xml, you must have one filter 77
statement per package and can then use multiple <specific> , <includerange> and <exclude range> statements to define which interfaces this package applies to. You can also use the <include url> tag to specify a file with a list of interfaces.
There is only one data collection service defined for OpenNMS outofthebox, in collectdconfiguration.xml – the SNMP service. It will run every 5 minutes (300,000 ms) and will collect the MIB variables specified in the collection called default, specified in datacollectionconfig.xml. The <service> stanza can also specify values for SNMP timeouts, retries and port number which would override the default values in snmpconfig.xml.
The package definition can also use the <outagecalendar> tag to specify scheduled downtime for devices, during which data collection will be suspended. This should be used to prevent lots of failed SNMP collection events. Outage periods are defined in the polloutages.xml file.
Obviously you can specify different packages with different address ranges, collection intervals and with different collection keys. You can also specify data collectors other than SNMP, such as NSClient, JMX and HTTP. See http://blogs.opennms.org/?p=242 for a note on using an HTTP data collector.
The datacollectionconfig.xml file defines one or more SNMP data collections that Tarus Balog (the prime developer behind OpenNMS) calls a "scheme", to differentiate it from the “package” defined in the collectd configuration file. These schemes bring together OIDs for collection, into groups and the groups are mapped to systems. The systems are mapped to interfaces by a device's systemOID. In addition, each "scheme" controls how the data will be collected and stored. Fundamentally, OpenNMS uses RRD Tool (Round Robin Database Tool) to store performance data. This paper is not a tutorial on RRD Tool so please follow the reference to RRD at the end of this paper for more information. The basis of RRD is that a fixed amount of space is allocated for a given database when it is created. It holds data for a given period of time, say 1 month, 1 year, etc. The sampling interval is known so you know how many datapoints will go into the database and hence how much space is required. Once the database is full, newer datapoints will replace the oldest ones, cycling around.
Figure 56: OpenNMS datacollectionconfig.xml collection and RRD parameters
78
The <rrd> stanza specifies how data will be stored in a Round Robin Archive (RRA). The snapshot shown in the figure above specifies:
●
<rrd step="300">
○
●
RRA:AVERAGE:0.5:1:2016
○
●
create an RRA with values AVERAGE'd over 288 steps (ie. this data is consolidated over 288 * 5 min steps = 1 day). The RRA will have 366 rows representing 1 year of data (1 day consolidations * 366 days = 366). Consolidate the samples provided 0.5 (half) of them are not UNKNOWN (otherwise the consolidated value will be UNKNOWN)
RRA:MAX:0.5:288:366
○
●
create an RRA with values AVERAGE'd over 12 steps (ie. this data is consolidated over 1 hour). The RRA will have 1488 rows representing 2 months of data (1 hour consolidations * 24 hours * 62 days = 1488). Consolidate the samples provided 0.5 (half) of them are not UNKNOWN (otherwise the consolidated value will be UNKNOWN)
RRA:AVERAGE:0.5:288:366
○
●
create an RRA with values AVERAGE'd over 1 step (ie. this data is “raw”, not consolidated). The RRA will have 2016 rows representing 7 days of data (5 minute steps = 12 / hour * 24 hours * 7 days = 2016). Consolidate the samples provided 0.5 (half) of them are not UNKNOWN (otherwise the consolidated value will be UNKNOWN)
RRA:AVERAGE:0.5:12:1488
○
●
data to be saved every 5 minutes, per step
create an RRA with MAX values averaged daily and keep 1 year of data
RRA:MIN:0.5:288:366
○
create an RRA with MIN values averaged daily and keep 1 year of data
The top of datacollectionconfig.xml defines where the RRD repositories are kept and how many variables can be retrieved by an SNMP V2 GETBULK command (10 is the default). Within the repository directory, for each node, there will exist a directory that consists of the node number. Thus, if the system was collecting data on node 21, there would be a directory called /opt/opennms/share/rrd/snmp/21 containing a datafile for each MIB OID being collected. File names will match the alias parameter for a MIB OID, in datacollectionconfig.xml .
The node number can be found by going to the detailed node information for a device and choosing the Asset Info link:
79
Figure 57: OpenNMS Asset Info link for a device
The resulting page includes the Node ID at the top.
80
Figure 58: OpenNMS Asset information page, including Node ID
The snmpStorageFlag parameter in the snmpcollection stanza of datacollection
config.xml defines for which interfaces of a device, data will be stored. Possible values are:
81
●
all
(the old default)
●
primary
the primary SNMP interface
●
select
collect from all IP interfaces and can use Admin GUI to select additional nonIP interfaces to collect data from (new default since OpenNMS 1.1.0)
Figure 59: OpenNMS GUI Admin page for specifying interfaces to collect data from
Most of the contents of datacollectionconfig.xml is defining groups and systems:
82
●
groups
define groups of SNMP MIB OIDs to collect
●
systems
use a device's System OID as a mask to determine which groups of OIDs should be collected
Figure 60: OpenNMS group definitions in datacollectionconfig.xml
Unfortunately OpenNMS does not have a MIB compiler so all MIB OIDs need to be manually specified in this file (the good news is that there are lots there outofthe
box). Once groups of MIB variables are declared, system stanzas say which group(s) are to be collected for any device whose system OID matches a particular pattern.
Each SNMP MIB variable consists of an OID plus an instance. Usually, that instance is either zero (0) or an index to a table. At the moment, OpenNMS only understands a small number of table indices (for example, the ifIndex index to the ifTable and the hrStorageIndex to the hrStorageTable). All other instances have to be explicitly configured.
The ifType parameter can be used to specify the sort of interfaces to collect from. Legal values are:
●
83
all
collect from all interface types
●
●
ignore
used when the value would be the same for all interfaces eg. CPU utilisation for a Cisco router
<i/f type number> used to denote one or more specific interface types. For example ifType=6 for ethernetCsmacd. See http://www.iana.org/assignments/ianaiftypemib for a comprehensive list. OpenNMS understands four types of variables to collect on gauge, timeticks, integer, octetstring. Note that RRD only understands numeric data.
Figure 61: OpenNMS systems definitions in datacollectionconfig.xml
In the figure above, any device which has satisfied the filtering in collectd
configuration.xml and has a system OID starting with .1.3.6.1.4.1 (the start of the Enterprise MIB tree), will collect performance data for MIB2 interfaces, tcp and icmp, as specified in the earlier <group> stanzas.
Note that the defaults in collectdconfiguration.xml and datacollectionconfig.xml mean that a large number of SNMP data collections will be activated outofthebox. This is good in providing lots of samples in small environments but it could be a serious performance and disk usage factor if these defaults are left unchanged, where a large number of interfaces are monitored by OpenNMS.
84
7.4.2 Displaying performance data
OpenNMS provides a large number of reports outofthebox, based on the default data collection parameters. Use the Reports main menu to see the options.
Figure 62: OpenNMS Report categories available outofthebox
●
Resource Graphs
provide lots of standard reports
●
KSC Performance, Nodes,Domains
●
Availability
availability reports for interfaces & services
●
Statistics Reports
shows Top20 ifInOctets across all nodes
allows users to customise own reports
Following the Resource Graphs link provides access to many standard reports.
85
Figure 63: OpenNMS Standard performance reports
The standard performance reports display various collected values for one particular node which you choose from the menu provided. The different categories provide:
86
●
Nodelevel performance data such as TCP connections, CPU, memory
●
Interface data for each interface such as bits in/out
●
Response time data for services such as ICMP, DNS, SSH
●
Disk space information from the ucdsnmp MIB
Figure 64: OpenNMS Standard Resource graphs available for a selected node
Here is part of the nodelevel performance data set of graphs.
87
Figure 65: OpenNMS partial display of the nodelevel performance data graphs
If you wish to create more selective sets of graphs for other people to use, the Key SNMP Customized (KSC) Reports menu to create your own reports which can include graphs of selected MIB variables from one device or can select MIB variables from different devices. Using the “Create New” button will prompt for nodes that have data collections configured as “Child Resources”. 88
Figure 66: OpenNMS KSC Reports menu
Selecting a node and clicking “View child resources” results in a menu of report categories.
89
Figure 67: OpenNMS Report categories available for customised reports
If you select the Nodelevel Performance Data option and the “Choose child resource” button then each of the MIB variables collected can be displayed and selected.
90
Figure 68: OpenNMS Selecting prefabricated reports to include in a customised report
The dropdown alongside the “Prefabricated Report” field allows you to select any of the default reports to include in your own customised reports. You can include several different graphs, from the same or different nodes, in your KSC report.
7.4.3 Thresholding
The thresholding capability in OpenNMS has changed fairly significantly over time – see http://www.opennms.org/index.php/Thresholding#Merge_into_collectd. for a good explanation.
Pre OpenNMS 1.3.10, collectd collected data and threshd performed thresholding – two separate processes. This design used a “range” parameter in threshd
configuration.xml to get around problems caused by the asynchronous manner nature of collectd and threshd.
OpenNMS 1.3.10 merged the thresholding functionality into collectd and introduced a new parameter into collectdconfiguration.xml:
●
<parameter key=”thresholdinggroup” value=”defaultsnmp”/>
where the value of the thresholding group matched a definition in threshd
configuration.xml. The need for the “range” parameter disappeared. However, to define different filters for thresholding, different packages had to be defined in collectdconfiguration.xml .
91
From OpenNMS 1.5.91, (this paper is based on version 1.5.93), filters can be defined in threshdconfiguration.xml so that packages in collectdconfiguration.xml can be kept simple. The parameter in threshdconfiguration.xml changes; the thresholding
group key disappears and is replaced by:
●
<parameter key=”thresholdingenabled” value=”true”/>
Here is the default collectdconfiguration.xml:
Figure 69: OpenNMS Default collectdconfiguration.xml
The lack of any thresholding parameter implies that thresholding is disabled.
... and the default threshdconfiguration.xml:
Figure 70: OpenNMS Default threshdconfiguration.xml
92
The default threshdconfiguration.xml is setup for the interim design between versions 1.3.10 and 1.5.90. For OpenNMS 1.5.93, collectdconfiguration.xml should be changed as shown below:
Figure 71: OpenNMS Modified collectdconfiguration.xml to enable thresholds
threshdconfiguration.xml can be modified with different packages of thresholding to apply to different ranges of nodes.
Figure 72: OpenNMS Modified threshdconfiguration.xml 93
Different filters are applied to each package. The “thresholdinggroup” parameter is required here and the value points to a matching definition in thresholds.xml, where the MIBs to threshold and the threshold values, are specified.
Figure 73: OpenNMS Modified thresholds.xml for CCsnmp group and raddlesnmp group
The attributes of a threshold are:
•
•
•
•
•
•
•
94
type: A "high" threshold triggers when the value of the data source exceeds the "value", and is rearmed when it drops below the "rearm" value. Conversely, a "low" threshold triggers when the value of the data source drops below the "value", and is rearmed when it exceeds the "rearm" value. "relativeChange" is for thresholds that trigger when the change in data source value from one collection to the next is greater than "value" percent. expression: A mathematical expression involving datasource names which will be evaluated and compared to the threshold values. This is used in "expression" thresholding (supported from 1.3.3). dsname: The name of the variable to be monitored. This matches the name in the “alias” parameter of the MIB statement in datacollectionconfig.xml .
dstype: Data source type. “node” for nodelevel data items, and "if" for interfacelevel items. dslabel: Data source label. The name of the collected "string" type data item to use as a label when reporting this threshold. Note: this is a data item whose value is used as the label, not the label itself. value: The value that must be exceeded (either above or below, depending on whether this is a high or low threshold) in order to trigger. In the case of relativeChange thresholds, this is the percent that things need to change in order to trigger (e.g. 'value="1.5"' means a 50% increase). rearm: The value at which the threshold will reset itself. Not used for relativeChange thresholds. •
•
•
trigger: The number of times the threshold must be "exceeded" in a row before the threshold will be triggered. Not used for relativeChange thresholds. triggeredUEI: A custom UEI to send into the events system when this threshold is triggered. If left blank, it defaults to the standard thresholds UEIs. rearmedUEI: A custom UEI to send into the events system when this threshold is rearmed. If left blank, it defaults to the standard thresholds UEIs. By default, standard threshold and rearm events will be generated but it is also possible to create customised events with the threshold attributes. This would then make it easier to generate notifications for specific thresholding / rearm events.
Here is a screenshot with standard events generated by thresholds on the raddle network:
Figure 74: OpenNMS Threshold events from various devices in the raddle network
For those who prefer not to edit XML configuration files, the OpenNMS Admin menu provides a GUI way to create and modify thresholds.
95
Figure 75: OpenNMS Admin menu
Selecting the “Manage Thresholds” option displays all thresholds currently configured in thresholds.xml.
96
Figure 76: OpenNMS Configuring thresholds through the Admin menu
Using the “Edit” button permits modification of an existing threshold.
Figure 77: OpenNMS Modifying thresholds through the Admin GUI
7.5 Managing OpenNMS
So far, this description of OpenNMS has focused very much on configuration by editing xml files. It is well worth mentioning that there is now an Admin menu (touched on in the Thresholding section previously), which means many of the configuration tasks can be driven by a menubased, fillintheblanks GUI. Refer back 97
to Figure 75: OpenNMS Admin menu for a list of the areas which can be configured this way.
7.6 OpenNMS summary
OpenNMS is a mature and very capable systems and network management product. It satisfies most requirements for discovery, availability monitoring, problem management and performance management. It has a clean architecture for configuration with everything being defined in XML files. It has an excellent mechanism for collecting and configuring SNMP TRAPs. For those who prefer to customise through a GUI, the Admin menu provides access to configure some of these files without needing to know an editor or XML.
It feels like a solid, reliable product and is designed (say the developers) to scale to truly large enterprises. There are lots of good samples provided and the default configurations provide rich functionality.
Areas where it is weak are around formal documentation and the lack of a usable topology map. That said, the help that is provided with OpenNMS panels is very good. Data collection and thresholding is strong. The addition of a MIB compiler and browser would improve matters enormously. It is also short of a way to discover applications that do not support portsniffing or SNMP.
There are two large problems with OpenNMS that give me great concern. You have to bounce the whole OpenNMS system if you change any configuration files! The second big issue – known to be under review – is the association between events, alarms and notifications. Currently, notifications are driven from events whereas driving them from alarms would seem preferable. There is also no link between acknowledging events, alarms and notifications.
I have two personal negative feelings with OpenNMS. The first is that it is written in Java. Sorry, but I hate Java applications! To be fair, OpenNMS does not suffer from performance issues that affect so many other Java applications but its logfiles are Java logfiles and life is just too short to find anything useful in them! My second personal nonpreference is that OpenNMS is very wordy. The important information never seems to hit the eye on most screens.
8 Zenoss
Zenoss is a third Open Source, multifunction systems and network management tool. Unlike Nagios and OpenNMS, there is a free, core offering (which does seem to have most things you need), and Zenoss Enterprise that has extra addon goodies, high availability configurations, distributed management server configurations and various 98
support contract offerings which includes some education. For a comparison of the “free” and “fee” alternatives, try http://www.zenoss.com/product/#subscriptions .
Zenoss offers configuration discovery, including layer 3 topology maps, availability monitoring, problem management and performance management. It is based around the ITIL concept of a Configuration Management Database (CMDB), “the Zenoss Standard Model”. Zope Enterprise Objects (ZEO) is the backend object database that stores the configuration model, and Zope is the web application development environment used to display the console. The relational MySQL database is used to hold current and historical events.
Zenoss 2.2 has recently been released which provides “stack” builds – complete bundles including Zenoss and all its prerequisites. These stack installers are available for a wide variety of Linux platforms; standard RPM and source formats are also available. For easy evaluation, a VMware appliance can be downloaded, ready to go.
I tried both the VMware build and the 2.2 stack install for SuSE 10.3; both were relatively painless. The rest of this section is based on the 2.2 stack installation on a machine whose hostname is zenoss.
To access the Web console, point your browser at http://zenoss:8080 . The default user is admin with a password of zenoss . The default dashboard is completely configurable but this screenshot is close to the default.
99
Figure 78: Zenoss default dashboard
8.1 Configuration – Discovery and topology
There is a good Zenoss Quickstart document available from http://www.zenoss.com/community/docs . Similar to OpenNMS, the architecture is based on objectoriented techniques. 8.1.1 Zenoss discovery
zProperties can be defined for devices, services, processes, products and events. Objects can be grouped and subgrouped with zProperties being refined and changed throughout the hierarchy. So, for example, the Device object class has default subclasses for different device types, as shown below.
100
Figure 79: Zenoss device classes
The class of Devices has a zProperties page as do the classes Network, Server, Printer, etc. Devices will initially be added to the Discovered class and can then be moved to a more appropriate class.
101
Figure 81: Zenoss Linux Server devices
Figure 80: Zenoss Server Device classes
Discovery and monitoring is largely controlled by the combination of zProperties applied to a device, of which there are a large number (most with sensible defaults). Initially, basic SNMP and pingpolling parameters should be configured in the zProperties page for Devices.
102
Figure 82: Zenoss zProperties for the Device class (part 1)
103
Figure 83: Zenoss zProperties for the Device class (part 2)
104
Figure 84: Zenoss zProperties for the Device class (part 3)
The lefthand menus of the web console provide an “Add Device” option (nothing is discovered automatically, outofthebox).
Figure 85: Zenoss Add Devices dialogue
Once a device has been discovered (which by default uses ping), if the discovery protocol is set to SNMP then the device will be queried for its SNMP routing table. Any networks that the device has routes to will then be added to the object class of networks.
105
Figure 86: Zenoss Networks class with dropdown menu
Once the presence of a network has been discovered, devices can automatically be discovered on that network – this uses a spray ping mechanism. There is a dropdown menu from the topleft corner of the Networks page (which works fine for simple Class C networks). Although the GUI does manage to display subnetworks accurately, even if the subnetmask is not on a byte boundary, the “Discover Devices” menu does not honour the subnetmask. However, a good feature of Zenoss is that there is a command line (CLI) for virtually everything and the CLI for device discovery on a network does honour supplied netmasks. For example:
zendisc run net 10.0.0.0/24
Note that the Zenoss discovery algorithm is very dependent on getting routing tables using SNMP and the Zenoss server must support SNMP itself.
For devices that do not support ping but do support SNMP, they can be added manually with the “Add Device” menu. The zProperties of the device (or class of 106
devices if you create a subclass) should have zPingMonitorIgnore=True and zSsnmpMonitorIgnore=False . There are three Zenoss processes that implement discovery:
●
●
●
zenmodeler can use SNMP, ssh and telnet to discover detailed information about devices. zenmodeler will only be run against devices that have already been discovered by zendisc . By default, zenmodeler runs every 6 hours.
zenwin detects Windows (WMI) services
zendisc is a subclass of zenmodeler. It traverses routing tables using SNMP and then uses ping to detect devices on discovered networks.
8.1.2 Zenoss topology maps
Zenoss has an automatic topology mapping option which can display upto 4 hops from a selected device. It even seems to be able to understand networks served by several routers!
Figure 87: Zenoss Network Map showing 4 hops from group100r1
107
8.2 Availability monitoring
Availability monitoring in Zenoss can use 3 different methods:
●
●
●
ping tests ○
implemented via zenping
○
detects device availability
service tests ○
implemented via zenstatus
○
detects services as defined by TCP / UDP ports
process tests and Windows Services tests
○
○
○
implemented via zenprocess
detects processes using the SNMP Host Resources MIB using the snmp.IpServiceMap zCollectorPlugin driven by zenmodeler detects Windows services using WMI using the WinServiceMap driven by zenwin 8.2.1 Basic reachability availability
Basic availability monitoring is controlled by “Collectors”. These are also known as “Monitors” (and the documentation can be confusing!), The Collectors menu can be found on the lefthand side.
108
Figure 88: Zenoss Collectors (Monitors) overview
The devices being monitored are shown at the bottom of the screen. To change any of these parameters, use the “Edit” tab. The defaults for availability monitoring are:
●
Ping cycle time polling
60 sec
●
Ping timeout
1.5 sec
●
Ping retries
2
●
Status (TCP/UDP service) polling interval
60 sec
●
Process (SNMP Host Resources) polling interval
180 sec
●
SNMP performance cycle interval
300 sec
What availability checks are carried out on a device is controlled by the zProperties of that device, remembering that zProperties can be set at any level of the object hierarchy. By default the /Devices class has zPingMonitorIgnore=False and zSnmpMonitorIgnore=False so every device will get ping polling at 1 minute intervals and SNMP polling at 5 minute intervals.
109
8.2.2 Availability monitoring of services - TCP / UDP ports and windows
services
Service monitoring for TCP / UDP ports and Windows services, is configured through the “Services” menu.
Figure 89: Zenoss Services menu
A very large number of Windows services are preconfigured outofthebox. These services are actually monitored by the zenwin daemon which uses (and requires) WMI on the Windows target machine. Note the “Count” column showing on how many devices these services have been detected
110
Figure 90: Zenoss Windows services
Even more IP services come configured outofthebox. There are two subclasses of IP services – Privileged and Registered; either can monitor either TCP or UDP ports.
111
Figure 91: Zenoss Privileged IP services
Again, note the “Count” column. Clicking on the service name shows where the service has been detected:
Figure 92: Zenoss devices running the domain (DNS) service on TCP 53 or UDP 53
112
The fact that a service has been detected does not imply that it is being monitored for availability (the default, outofthebox, is that nothing is monitored). The “Monitor” column for devices shows whether active monitoring is taking place (and hence events potentially being generated). The “Monitor” field in the top part of the window shows the global default for this service. To turn on service monitoring globally for a particular service, use the Services menu to find the service in question. You can then use either the “zProperties” tab or the “Edit” tab to change the Monitor global default to True (the default, as shipped, is False). To turn on service monitoring for a specific device, access the main page for a device and open the “OS” tab. Under the “IP Services” section, click on the “Name” column header to see services detected. Click on the service name which brings up the service status window for the device where the “Monitor” field can be changed – don't forget to click the “Save” button. Note that the “Monitored” box in the IP Services heading bar can be used to toggle the display between detected services and monitored services.
Note that the dropdown menu to “Add IpService” is driven by typing in a partial match of the service name you want – the subsequent dropdown then shows configured services that match your selection.
8.2.3 Process availability monitoring
Unix / Linux process monitoring relies on the SNMP Host Resources MIB on the target device. Processes to be monitored can be flexibly defined using regular expressions. Start from the “Processes” menu to see processes defined (there are none outofthe box). Use the dropdown menu to “Add process”.
113
Figure 93: Zenoss Processes with dropdown menu
Supply a process name and it will be added to the list. To modify the definition of the process, click on the process name and select the “Edit” tab.
Figure 94: Zenoss dialogue for modifying process definition
To modify the zProperties of a process, use the “zProperties” tab.
114
Figure 95: Zenoss zProperties for the firefox process
To apply process monitoring to a device, from the OS tab of the device page, select the dropdown menu and use the “Add OSProcess” menu. Defined processes are selectable from the dropdown window.
Figure 96: Zenoss Add OSProcess monitoring to a specific device
115
Note that there are currently (July 4th, 2008) a couple of bugs to do with process monitoring whereby processes “disappear” from the OS tab of a device and/or show the wrong status (tickets #3408, #3399, #3270). To mitigate against these, the zenprocess daemon should be stopped and restarted whenever modifications have been made to do with processes. You can use the GUI by choosing Settings and selecting the Daemons tab.
Temporarily, it would also be wise to use the menu for the process and select to Lock the process from Deletion.
More sophisticated availability monitoring can be implemented using standard zCollectorPlugins – note that these are modelling plugins as distinct from performance plugins. zCollector plugins are applied to device classes or devices through the zProperties tab – use the “Edit” link alongside “zCollectorPlugins” to show or modify the plugins applied and available.
Figure 97: Zenoss zCollectorPlugins
Note that the Add Fields / Hide Fields appears greyed out but does actually work. The plugins shown on the left in the screenshot above are the default for the /Devices class. The /Devices/Server class has several more SNMPbased plugins, by default and the /Devices/Server/Windows class has an extra wmi.WinServiceMap plugin.
Documentation on these plugins seems a little sparse but here are a few clues:
116
Figure 98: Zenoss default plugins for class /Devices/Server/Windows
●
zenoss.snmp.InterfaceMap
uses SNMP to query for interface info
●
zenoss.snmp.IpServiceMap
zenstatus daemon queries TCP/UDP port info
●
zenoss.snmp.HRSWRunMap
uses SNMP to get process info from Host resources MIB
●
zenoss.wmi.WinServiceMap
zenwin daemon uses WMI to query for Windows services
One way to find what plugins are applied by default to device classes is to inspect the migration script supplied in /usr/local/zenoss/zenoss/Products/ZenModeler/migrate/zCollectorPlugins.py . To see what plugins are active on a specific device, use the devices main page menu and select the “More” menu to find the “Collector Plugins” menu.
117
Figure 99: Zenoss zCollectorPlugins for device group100r1.class.example.org
When modifying characteristics for specific devices, do note that the main page menu (from the arrow dropdown at the top left corner) has both a “More” submenu (which includes zProperties among other things) and a “Manage” submenu.
118
Figure 100: Zenoss Device More submenu
Figure 101: Zenoss Device Manage submenu
119
8.2.4 Running commands on devices
A few Commands are defined outofthebox and can be seen using the lefthand “Settings” menu and then selecting the “Commands” tab. New commands can be added using the “Add User Command” dropdown menu.
Figure 102: Zenoss Commands provided outofthebox
From a device's main page, there is a submenu to “Run Commands”.
Figure 103: Zenoss Run Commands for a particular device
120
Although much of the availability monitoring that has been demonstrated so far relies on SNMP, it is also possible to use ssh or telnet to contact remote devices and run monitoring scripts on them.
8.3 Problem management
The Zenoss event management system can collect events from syslogs, windows event logs, SNMP TRAPs and XMLRPC, in addition to managing events generated by Zenoss itself (such as availability and performance threshold events).
When an event arrives in the Status table of the events database, the default state of the event is set to “ New”. The event can then be Acknowledged, Suppressed or Dropped. From there, an event will be archived into the Event History database in one of four ways.
●
Manually moved to the historical database (historifying)
●
Automatic correlation (good event clears bad event)
●
An event class rule
●
A timeout
Events automatically have a duplication detection rule applied so that if an event of the same class, from the same device, with the same severity arrives, then the repeat count of an existing event will simply be incremented.
Global configuration parameters for the event system can be configured from the “Event Manager” lefthand menu.
By default, status events of severity below Error, are aged out to the Event History database after 4 hours. Historical events are never deleted.
121
Figure 104: Zenoss Event Manager configuration
8.3.1 Event console
The main Event Console is reached from the “Event Console” menu on the left. The default is to show all status events with a severity of Info or higher, sorted first by severity and then by time (most recent first). Events are assigned different severities:
●
Critical
Red
●
Error
Orange
●
Warning
Yellow
●
Info
Blue
●
Debug
Grey
●
Clear
Green
The events system has the concept of active status events and historical events (two different database tables in the MySQL events database).
Events in the console can be filtered by Severity (Info and above by default) and by State (New, Acknowledged and Suppressed where New and Acknowledged are shown by default). Any event which has been Acknowledged changes to a wishywashy version of the appropriate colour. There is also a Search box at the top right for filtering events.
122
Figure 105: Zenoss Event Console
From the Console, events can be selected by checking the box alongside the event and the dropdown can be used for various functions including “Acknowledge” and “Move to History”. The dropdown can also be used to generate any test event with the “Add Event” option (if you are a CLI person rather than a GUI person, the zensendevent command is also available).
The column headers of the Event Console can be used to change the sorting criteria and the icon at the far right of the event can be used to display the detailed data of fields.
8.3.2 Internally generated events
Events are automatically generated by Zenoss if an availability metric is missed (such as a ping check failing or a service check failing). Similarly, if performance sampling is setup along with thresholds, then events will be generated if the threshold is breached. Reasonable defaults for such events are configured outofthebox. 123
Events are organised in class hierarchies which have zProperties, just like Devices. To modify the properties of an event, select the “Events” option from the lefthand menu.
Figure 106: Zenoss Event classes and subclasses
To modify the context of any event, select the event and use the zProperties tab.
Figure 107: Zenoss zProperties for the event class /Event/Status/OSProcess
124
Events are mapped to Event Classes by Event Class instances. Event Class instances are looked up by a nonunique key called EventClassKey. When an event arrives it is:
●
Parsed ●
Assigned to the appropriate class and class key
●
Context is then applied:
○
○
●
Event context is defined in the zProperties of an event class
After the event context has been applied, then the device context is applied whereby the ProductionState, Location, DeviceClass, DeviceGroups, and Systems, are all attached to the event in the event database.
Once these properties have been associated with the event, Zenoss attempts to update the zEventProperties. This allows a particular device or class of devices to override the default values for any given event.
To change the event mapping, select the event class and use the Mappings tab.
Figure 108: Zenoss Event mapping
The “Edit” tab allows editing of any of these fields.
8.3.3 SNMP TRAP reception and configuration
Zenoss automatically listens for SNMP TRAPs on UDP/162 (the wellknown trap port) using the zentrap process. Some generic TRAPs (2 3 and 4 for Link Down, Link Up and Authentication Failure) are automatically mapped to defined classes. Other generic TRAPs (such as 0, 1 for Cold Start and Warm Start) appear as the /Unknown event class, as will any specific TRAPs. It is simple to map such events to an already 125
configured event class by selecting the occurrence of the event and using the pulldown menu to select “Map Events to Class” pick the correct class from the scrollable list.
It is also possible to create new event classes. Starting from Events on the left menu, navigate to the place in the event class hierarchy under which you want to create a new class and use the dropdown menu to “Add New Organizer” and give the class a unique name.
Figure 109: Zenoss menu to create a new event class
8.3.4 email / pager alerting
“Alerting Rules” are Zenoss's way of sending email and/or paging notifications. These are configured on a peruser basis, starting from the “Preferences” menu towards the top right of the web console. The “Alerting Rule” tab then shows existing rules and permits rule creation / deletion.
126
Figure 110: Zenoss menu to create Alerting Rule
Using the “Edit” tab permits changes of existing alerting rules. Different rules can be applied based on a combination of severity, event state, production state and a more generic filter. The Production State is assigned to a device or device class:
●
Production
●
PreProduction
●
Test
●
Maintenance
●
Decommissioned
The Production State can be set or changed using the “Edit” tab from a device main page. The default is Production. The Production State attribute can be used to control whether a device is monitored at all, whether alerts are sent and whether a device is represented on the Zenoss main dashboard. It is very simple to modify the Production State to put a device or class of devices into maintenance, for example.
127
Figure 111: Zenoss Editing alerting rule
The email or pager message of the Alerting Rule is configured by the “Message” tab and the “Schedule” tab can be used to create different alerting rules at different times.
128
Figure 112: Zenoss Alerting rule message format
Global parameters for email and paging, along with other useful parameters, can be defined from the “Settings” lefthand menu.
129
Figure 113: Zenoss Settings parameters
The outofthebox email notifications provide handy links back to Zenoss to manipulate the event that is being reported on.
130
Figure 114: Zenoss email generated by event notification, including links
8.3.5 Event automations
Any event can be configured to run an automatic script. This can be in addition to the email / pager alerting rules described above. Such automation scripts are known as Zenoss Commands and are run by the zenactions daemon. They are configured from the “Event Manager” lefthand menu using the “Commands” tab.
Figure 115: Zenoss Event Command definition
131
8.4 Performance management
Zenoss can collect performance data and threshold it using either SNMP (through the zenperfsnmp daemon) or by commands (typically ssh), using the zencommand daemon. The data is stored and displayed using RRD Tool.
8.4.1 Defining data collection, thresholding and graphs
Configuration of performance data collection, thresholding and display is done through templates. As with other Zenoss objects, templates can be applied to a specific device or to a higher level in the device class object hierarchy. To see all the defined templates, navigate to the Devices page and use the lefthand dropdown menu and the “More” submenu to choose “All Templates”.
Figure 116: Zenoss All Templates showing all defined performance templates
With the exception of the templates with “HRMIB” in the name, the above figure shows the default templates asshipped. Note that these are defined templates – there is no indication here as to which are active on what objects.
Note in the screenshot above that there are several templates called “Device”. Templates can be bound to a device or device class to make it active. When 132
determining what data to collect, the zenperfsnmp (or zencommand) daemon first determines the list of Template names that are bound to this device or component. For device components this is usually just the meta type of the component (e.g. FileSystem, CPU, HardDisk, etc.) For devices, this list is the list of names in the device's zDeviceTemplates zProperty. Figure 117: Zenoss zProperties showing zDeviceTemplate The default, outofthebox, is that the device template called Device is bound to each device discovered. As noted in the previous screenshot, there are several templates called Device. The Device template for the class /Devices simply collects sysUpTime. The template called Device for /Devices/Server collects a number of parameters supported by the netsnmp MIB. The template called Device for /Devices/Server/Windows collects various MIB values from the Informant MIB. For each template name Zenoss searches first the device itself and then up the Device Class hierarchy looking for a template with that name. Zenoss uses the first template that it finds with the correct name, ignoring others with the same name that might exist further up the hierarchy.
133
So, the zenperfsnmp daemon will collect netSNMP MIB information for Unix / Linux servers and will collect Informant MIB information for Windows servers (as /Devices/Server/Windows is more specific than /Devices/Server). Any actual device can have a local copy of a template and change parameters to suit that specific device.
Template bindings can either be modified by changing the zProperties zDeviceTemplates field or there is a “Bind Templates” menu dropdown from the templates display of any device. (Do remember that, for a device, both the Templates menu and the zProperties menu are off the “More” dropdown submenu).
Figure 118: Zenoss Bind Templates menu
Be aware that when selecting templates to bind, you need to select all the templates you want bound (use the Ctrl key to select multiples).
So, what do these templates actually provide?
Templates contain three types of sub objects: ● Data sources
what data to collect and method to use eg. MIB OID
● Thresholds expected bounds for data and events to raise if breached
● Graph definitions how to graph the data points
134
Figure 119: Zenoss Device template for /Devices/Server
Zenoss provides two built in types of Data Sources, SNMP and COMMAND. Other types can be provided through ZenPacks. Clicking on the Data Source displays details which can then be modified. Typically an SNMP Data Source will provide a single Data Point (a MIB OID value). Typically the name of the data point will be the same as the name of the data source. This means that when you come to select threshold values or values to graph, you will be selecting names like ssCpuRawWait_ssCpuRaw_wait .
Figure 120: Zenoss Data Source memAvailReal
135
Note that there is a useful Test button to check your OID against a node that Zenoss knows about. However, beware that this Test button appears to use snmpwalk under
thecovers so if a MIB OID has multiple instances then the snmpwalk will return values successfully. When zenperfsnmp actually collects data, it requires the correct instance as well as the correct MIB OID. If your test is successful but you subsequently see empty graphs with a message of “Missing RRD file” then the problem is likely to be that the MIB instance is incorrect.
Data sources can be added or deleted with the dropdown AddDataSource and DeleteDataSource menus.
Thresholds can be applied to any of the data points collected, along with events to generate if the threshold is breached.
Figure 121: Zenoss Threshold on CPU collected data
All of the data points defined in the data sources section are supplied in the top selection box. If an event is to be generated, dropdowns are provided to select the event class and severity. You can also specify an escalation count. Thresholds can be added or deleted from the Thresholds dropdown menu.
136
Figure 122: Zenoss Dropdown menu for data thresholds
Note that this dropdown menu (as is also true of the Data Sources dropdown) has an option to “Add to Graphs”. Graphs can be defined for a wide combination of the collected data points and thresholds. The menu panels are basically a frontend to the RRD graphing tool and, with lots of samples provided, you don't need to get into the details of RRD Tool; however if you wish to, there is plenty of scope to do so.
Graphs can be added, deleted or resequenced using the dropdown. Existing graphs are modified by clicking on the graph name.
137
Figure 123: Zenoss Performance template graph definition
Note that graphs can display both data points and thresholds.
All graphs are stored, by default, under /usr/local/zenoss/zenoss/perf/Devices . There is a subdirectory for each device. Component data rrd files are under the os subdirectory with further subdirectories for filesystems, interfaces and processes.
8.4.2 Displaying performance data graphs
To view performance graphs, the Operating System component graphs can be seen from the OS page of a device, by clicking on the relevant interface, filesystem or process. The rest of the performance graphs can be found under the Perf tab.
138
Figure 124: Zenoss Performance graphs for eth1 interface on bino
You can change the range of data with the “Hourly” dropdown (to daily, weekly, monthly or yearly). Data can be scrolled using the < > bars at either side and the “+” and “” magnifiers can be used to zoom in / out. By default, all graphs on the page are linked (so that if you change the range on one, it changes for all). They can be de
coupled with the “Link Graphs?” check box.
Here is a partial screenshot of the graphs for bino under the Perf tab.
139
Figure 125: Zenoss Performance graphs available under the Perf tab for bino
Note that the “Reports” lefthand menu also provides access to various reports, including performance reports.
140
Figure 126: Zenoss Reports menu
Following the “Performance Reports” link provides access to all performance reports for all devices.
Figure 127: Zenoss Performance Reports menu
8.5 Zenoss summary
Zenoss is an extremely comprehensive systems and network management product, satisfying most of my requirements. One feels that the objectoriented architecture is extremely flexible and powerful with most things you require already configured out
ofthebox. The automatic discovery and topology mapping options are the most powerful of the products discussed here. It can accommodate Nagios and Cacti plugins and has its own addon architecture in the form of ZenPacks.
141
Zenoss will use SNMP to gain status and performance information from a device but it also has ssh and telnet as alternatives, for those devices where SNMP is inappropriate.
The Quick Start Guide gets you running fast and the Admin Guide provides what it says – a reasonable comprehensive Administrator's Guide. There is also a book by Michael Badger, published June 2008, “Zenoss Core Network and System Monitoring”, which is well worth the investment (available both in paper and in electronic format). However, one feels that there is so much more in the detail of Zenoss that one needs to know and can find no information on!
My only real negative comment on Zenoss, other than the lack of detailed technical information, is that it is a rapidly evolving product and it feels rather buggy. The current (August 2008) poll on the zenossusers forum for input to Zenoss 2.3, has many requesters with code reliability and better documentation at the top of their lists!
9 Comparison of Nagios, OpenNMS and Zenoss
Necessarily, comparisons are based on a mixture of “fact” and “feeling” and you need a clear definition of what features are important to your environment before comparisons can be valid for you.
Nagios is an older, more mature product. It evolved from the NetSaint project, emerging as Nagios in 2002. OpenNMS also dates back to 2002 but feels like the lead developer, Tarus Balog, has learned some lessons from observing Nagios. Zenoss is a more recent offering, evolving from an earlier project by developer Erik Dahl and emerging to the community as Zenoss around 2006.
All the products expect to use SNMP OpenNMS and Zenoss use SNMP as the default monitoring protocol. They all provide other alternatives – Zenoss supports ssh and telnet along with customised ZenPacks; Nagios has NRPE and NSCA agents (both of which, of course, require installing on remote nodes); OpenNMS doesn't have much else to offer outofthebox but it can support JMX and HTTP as well as having support for Nagios plugins.
All the products have some user management to define users, passwords and roles with customisation of what a user sees.
OpenNMS and Zenoss use RRD Tool to hold and display performance data; Nagios doesn't really have a performance data capability – Cacti might be a good companion product.
Most surprisingly, given that they all rely on SNMP, none of the products has an SNMP MIB Browser builtin to assist with selecting MIBs for both status monitoring and performance data collection.
142
There are advocates for and against “agentless” monitoring. Personally, I don't believe in “agentless”. Once you have got past ping then you have to have some form of “agent” to do monitoring. The question is, should a management paradigm use an agent that is typically part of a box build (like ssh, SNMP or WMI for Windows), or should the management solution provide its own agent, like Nagios provides NRPE (and most of the commercial management products come with their own agents). If your management system wants its own agents, you then have the huge problem of how you deploy them, check they are running, upgrade them, etc, etc. OpenNMS and Zenoss have a strong dependency on SNMP although Zenoss also supports ssh and telnet monitoring, outofthebox (if your environment permits these). SNMP may be old and “Simple” , but all three products support SNMP V3 (for those who are worried about the security of SNMP) and virtually everything has an SNMP agent available.
The other form of “agentless” monitoring basically comes down to port sniffing for services. Whilst this can work fine for smaller installations, the nsquared nature of lots of devices and lots of services doesn't scale too well. All three products do port sniffing so it comes down to how easy it is to configure economic monitoring.
9.1 Feature comparisons
The following tables start with my requirements definition and compare the three products on a featurebyfeature basis. (OOTB = OutOfTheBox).
9.1.1 Discovery
Nagios
OpenNMS
Node discovery Config file for each Config file with node
include / exclude ranges
Zenoss
GUI, CLI and batch import from text or XML file
Automatic discovery
No
Yes – nodes within Yes – networks & nodes
configured n/w ranges
Interface discovery
Possible through config file
Yes including switch ports
Yes including switch ports
Discover nodes Yes use that don't check_ifstatus support ping
plugin
Yes – send_event.pl
Yes – use SNMP, ssh or telnet
SQL Database No
PostgreSQL
mySQL & Zope ZEO
Service (port) discovery
Yes – use plugin (TCP, UDP,....)
Yes – various outof
thebox
Yes – TCP and UDP
Application discovery
Yes – define service Not without extra agent eg. NRPE
143
Yes – with ssh, zenPacks or plugins
Nagios
Supports NRPE / NSClient
Yes
OpenNMS
Zenoss
Yes
Possible
SNMP support V1, 2 & 3
V1, 2 & 3
V1, 2 & 3
L3 topology map
Yes
No
Yes – upto 4 hops
L2 topology map
No
No
No (but may be in plan!)
9.1.2 Availability monitoring
Nagios
OpenNMS
Yes
Zenoss
Ping status monitoring
Yes
Yes
Alternatives to ping status
Yes – any plugin Nagios plugins
eg. check_ifstatus
Yes – ssh, telnet, ZenPacks, Nagios plugins
Port sniffing
Yes
Yes
Yes
Process monitoring Yes – with plugins Nagios plugins
Yes – Host Resources MIB
“Agent” technology Generally relies SNMP outofthebox; SNMP, ssh client, on Nagios plugins customised plugins WMI for Windows, deployed
possible
ZenPacks to be deployed
Availability reports Yes
Yes
Yes
9.1.3 Problem management
Nagios
OpenNMS
Zenoss
Configurable event console
No
Yes Yes
Severity customisation
Yes
Yes
Yes
144
Nagios
OpenNMS
Zenoss
Event configuration
No
Flexible. Lots OOTB
Flexible. Lots OOTB
SNMP TRAP handling
No
Flexible. Lots OOTB
Flexible. Lots OOTB
email / pager notifications
Yes
Yes – with configurable escalation
Yes
autoactions on events
autoactions on events
Automation good news / bad news good news / bad news correlation on alarms correlation on events and notifications
and notifications
Deduplication No automatic repeat Yes
count mechanism but events do not continue to be raised for existing problems
Yes
Service / host dependencies
Yes
No
Rootcause analysis
UNREACHABLE Outages / Path status for devices outages
behind network single point of failure.
No
Also, host / service dependencies.
9.1.4 Performance management
Nagios
OpenNMS
Zenoss
Collect No
performance data using SNMP
Yes
Yes
Collect No
performance data using other methods
NSClient, JMX, HTTP
ssh, telnet, other methods using ZenPacks
145
Nagios
OpenNMS
Zenoss
Threshold performance data
No
Yes
Yes
Graph performance data
No
Yes – lots provided OOTB
Yes – lots provided OOTB
MIB compiler
No
No
Yes
MIB Browser
No
No
No (though a MIB Browser ZenPack is said to be available for 2.2)
9.2 Product high points and low points
This section is far more subjective – your mileage may vary!
9.2.1 Nagios “goodies” and “baddies”
Good points
Bad points
Good, stable code for systems management
No autodiscovery
Good correlation between service events and host events
Weak event console
Command to check validity of config files
No OOTB collection or thresholding of performance data
Command to reload config files without No easy way to receive and interpret SNMP disrupting Nagios operation
TRAPs
Good documentation
No MIB compiler or browser
9.2.2 OpenNMS “goodies” and “baddies”
Good points
Bad points
Good OOTB functionality
Written in Java – log files hopeless! Difficult to get individual daemon status
Code feels solid
No map (that works reasonably)
Clean, standard configuration through GUI is wordy – difficult for the eye to focus wellorganised xml files
on the important things
146
Good points
Bad points
Single database (PostgreSQL)
Need to bounce entire OpenNMS when almost any config file is changed
LOTS of trap customisation OOTB
Event / alarm / notification architecture is currently a mess (under review)
Ability to do some configuration through web Admin menu
No way to change colours of events
Easy import of TRAP MIBs (mib2opennms)
No MIB compiler or browser
Chargeable support available from The OpenNMS Group
Supports Nagios plugins
No pdf documentation. Wiki hard to find detailed information.
Some good Howto documents for basic Lots of things undocumented when you get configuration on the wiki
down to details.
9.2.3 Zenoss “goodies” and “baddies”
Good points
Good OOTB functionality
Bad points
No correlation between service events and host events
Architecture good based around object Implementation feels buggy
oriented CMDB database
Topology map (upto 4 hops)
Lots of plugins & zenPacks available
No MIB browser
email notifications include URL links back to Zenoss
No way to change colours of events
Commercial version available
Commercial version available Good “Quick Start” manual , Administrators manual and book
Lots of things undocumented when you get down to details
Supports Nagios & Cacti plugins
147
9.3 Conclusions
What to choose? Back to your requirements!
For smallish, systems management environments, Nagios is well tested and reliable with a huge community behind it. For anything more than simple ping checks plus SNMP checks, bear in mind that you may need a way to install remote plugins on target hosts. Notifications are fairly easy to setup but if you need to produce analysis on your event log then Nagios may not be the best choice.
OpenNMS and Zenoss are both extremely competent products covering automatic discovery, availability monitoring, problem management and performance management and reporting. Zenoss has some topology mapping and has better documentation but the code feels less reliable. OpenNMS currently has a rather messy architecture around events, alarms and notifications, though this is said to be under review. I also struggle to believe that you have to recycle the whole of OpenNMS if you have changed a configuration file! The code feels very stable though.
My choice, hoping fervently that code reliability and documentation improves, is Zenoss.
148
10 References
1. “itSMF Pocket Guide: IT Service Management a Companion to ITIL”, IT Service Management Forum
2. Multi Router Traffic Grapher (MRTG) by Tobi Oetiker, http://oss.oetiker.ch/mrtg/ 3. RRDtool high performance data logging and graphing system for time series data http://oss.oetiker.ch/rrdtool/ 4. netdisco network management application http://www.netdisco.org/ 5. The Dude network monitor by MicroTik, http://www.mikrotik.com/thedude.php 6. nagios host, service and network monitoring program http://www.nagios.org/ 7. Zenoss network, systems and application monitoring http://www.zenoss.com/ 8. OpenNMS distributed network and systems management platform http://www.opennms.org/ 9. cacti network graphing solution http://www.cacti.net/ 10. SNMP Requests For Comment (RFCs) http://www.ietf.org/rfc.html 11.
V1 – RFCs 1155, 1157, 1212, 1213, 1215 12.
V2 – RFCs 2578, 2579, 2580, 3416, 3417, 3418
13.
V3 – RFCs 25782580, 341618, 3411, 3412, 3413, 3414, 3415
14. SNMP Host Resources MIB, RFC s 1514 and 2790 http://www.ietf.org/rfc.html 15. PHP scripting language http://www.php.net/
16. “Zenoss Core Network and System Monitoring” by Michael Badger, published by PACKT Publishing, June 2008, ISBN 9781847194282 .
11 Appendix A Cacti installation details
Cacti 0.8.6j64.4 was installed on an Open SuSE 10.3 Linux system.
Prerequisites are:
●
A web server (Apache 2.2.470)
●
PHP (5.2.58.1)
●
RRDTool (1.2.2347)
●
netsnmp (5.4.119)
149
●
MySQL (5.0.4522)
Cacti, as well as all of the prerequisites, were available on the Open SuSE 10.3 standard distribution DVD.
Use the “Installation under Unix” instructions available from http://www.cacti.net/downloads/docs/html/install_unix.html . A few modifications were required such as:
●
●
No PHP5 configuration was done as the files documented in the installation guide did not exist
Configuration of Apache2 required no modifications in /etc/apache2/conf.d/php5.conf
●
Cacti was installed using the standard SuSE Yast mechanism
●
Create the MySQL database by:
cd /usr/share/cacti
mysql –user=root p (and supply the root password when prompted)
create database cacti;
source cacti.sql;
GRANT ALL ON cacti.* TO cactiuser@localhost IDENTIFIED BY 'cacti';
(Note that cacti in the above command is the password for the user cactiuser)
●
●
●
●
●
●
●
150
You need to manually create the Operating System user cactiuser with password cacti
When pointing your web browser at http://<your server>/cacti/ ensure that you include the trailing slash. Use a web logon of admin, password admin .
Ensure that apache2 and mysql are either manually started (/etc/init.d/<name> start) or start them automatically at system start using chkconfig
Ensure that the cactiuser user id can execute the /usr/share/cacti/poller.php script that is run by /etc/crontab.
Also ensure that the directory that the RRD data is written to ( /var/lib/cacti ) is writeable by this user.
cacti.log is in /var/log/cacti
I found (through /var/log/messages) that poller.php was being run twice, once in /etc/crontab as cactiuser and once in /etc/cron.d/cacti as user wwwrun – comment out the line in /etc/cron.d/cacti and check again that cactiuser can write to the data files in /var/lib/cacti .
●
The initial console page is a good starting point to add devices to monitor and associated graphs.
About the author
Jane Curry has been a network and systems management technical consultant and trainer for 20 years. During her 11 years working for IBM she fulfilled both presales and consultancy roles spanning the full range of IBM's SystemView products prior to 1996 and then, when IBM bought Tivoli, she specialised in the systems management products of Distributed Monitoring & IBM Tivoli Monitoring (ITM), the network management product, Tivoli NetView and the problem management product Tivoli Enterprise Console (TEC). All these products are based around the Tivoli Framework product and architecture.
Since 1997 Jane has been an independent businesswoman working with many companies, both large and small, commercial and public sector, delivering Tivoli consultancy and training. Over the last 5 years her work has been more involved with Open Source offerings.
151