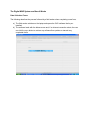
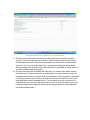
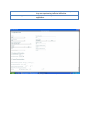
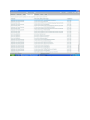
1
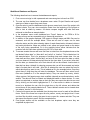
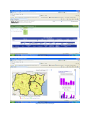
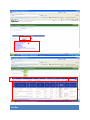
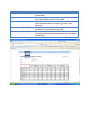
GLCI Final Report on M&E/ICT
Compiled by: Michael Matarasso
August 31, 2011
N.B. This document includes some information from a study prepared by Sam Davies for CRS Baltimore entitled CRS ICT4D Portfolio Great
Lakes Cassava Initiative (GLCI) – Data Collection and Remote Learning. This study was based on interviews with and documents provided
by the GLCI and GKIM teams.
Table of Contents
1.
2.
3.
4.
Introduction
M&E/ICT Activity Description
Technical Specifications and Architecture
Lessons Learned and Recommendations
Introduction
The four-year Great Lakes Cassava Initiative (GLCI) began in December 2007 as a
multinational, multi-partner project led by Catholic Relief Services (CRS) to address the
Cassava Mosaic Disease (CMD) and Cassava Brown Streak Disease (CBSD) pandemics in
Burundi, the Democratic Republic of Congo, Kenya, Rwanda, Tanzania and Uganda. The goal
of GLCI is to distribute healthy cassava planting material of farmer-accepted varieties to 1.15
million farmers.
GLCI works through 56 local partners that in turn provide support to over 3,000 farmer groups
and individual producers to multiply and distribute disease resistant cassava seed. Due to the
scale of GLCI and the heavy reliance on partners to collect data, CRS decided to use a digital
solution to capture and share data between CRS Regional office, Country Programs and
partners instead of using pen and paper. This provided a significant logistical and economical
savings and ability to act immediately to improve project impact and efficiency.
Pen and paper has been the traditional medium used to collect field data within CRS and also in
other organizations. It is an approach that is familiar to people throughout the world. Although
pen and paper has been the standard in the past, compared to a digital system there are a
number of reasons why it is less efficient and effective. GLCI is an ongoing monitoring program
that runs throughout the year, during both the dry and wet seasons. Data collection on this scale
becomes much harder, as road infrastructure deteriorates and transportation within the country
becomes problematic due to the heavy rains.
A digital system provides not only improved logistics, cost savings, improved data quality, and
immediate availability of analyzed data, but also has positive implications for environmental
sustainability.
Below are the typical steps of a pen and paper process compared to a digital process,
highlighting the benefits and savings that a digital system can offer:
Paper Based System
Digital Based System
a) Design of survey
Design of digital forms with
user interface
b) Training on data collection
c) Testing of forms and revision
Training on data collection
Testing of forms and revision
d) Printing of data collection
forms in country each time a
survey is done and
Updating the forms via
Internet
Benefits and Savings
by using Digital
The design of digital
forms can be more
expensive and time
consuming without a
program that can be used
quickly in-house like
iformbuilder.
None
Centrally managed and
controlled surveys, allow
for easy updates and
corrections
After the initial design of
the form does not require
any further printing
acquisition of additional data
collection materials –
pencils, clipboards, folders,
etc...
e) Transport and distribution of
materials to partner offices
and field workers
f) Travel to field sites
g) Filling of forms in the field
saving ink and paper,
time and money
Nothing required
Saving of fuel, time and
money
Same
Same
No savings
Using the digital forms
with built in validation
checks and drop down
menus improves the
quality and reliability of
data and minimizes
errors. It also allows for
geo-referencing to be
built into each form filled
which is essential for
auditing and
accountability.
Saving of fuel, reduction
of CO2 emissions, time
and money if forms can
be sent remotely and not
need memory stick
option. Furthermore
paper forms, can get
creased, wet, dirty, lost or
held up during the
transport process.
Avoids errors in
transferring data as some
handwriting is illegible
and some forms have
incomplete data. In digital
forms because of data
validation checks,
incomplete forms cannot
be submitted and in
some cases incorrect
data is impossible to
enter.
With digital forms can
have cleaning options
that facilitate cleaning
and are not available in
excel- these can also be
cleaned remotely but still
be available immediately
globally.
h) Transport forms back to CP
or regional office
Submit forms via Internet
connection or send data via
memory stick to then be
submitted where Internet is
good
i)
Input data from paper into
excel files or other format for
analysis.
Nothing required
j)
Review of data and correct
errors
Same step required
k) Analysis
Same step required
l)
Same step required
Compile reports
Calculations can be built
into the database so that
analysis happens
automatically as data is
received. This saves time
and cost as it is a
onetime activity to
develop and enter the
calculations and analyses
don’t have to be
conducted each and
every time. Using a
digital database allows
for unlimited storage and
avoids the tedious task of
going through piles and
piles of paper, no storage
space is required and
dealing with lost and
damaged records is
avoided.
Reports can be built into
the web-based system so
that reports are
generated automatically
as data is received. This
saves time and cost as it
is a onetime activity to
develop and enter the
calculations and reports
don’t have to be created
over each time.
M&E/ICT Activity Description
In September 2009, GLCI rolled out the use of ruggedized mini-laptops for data
collection across the six countries. This rollout included hands on training on computer
use and data capture and was done in two phases. It involved 194 partner supervisors
and Paid Field Agents (PFA’s) and allotment of 194 mini laptops. The first phase
involved the Anglophone countries (Kenya, Uganda and Tanzania) and was completed
in November, 2009. The second phase involved the Francophone countries (Burundi
Rwanda and DRC) and was completed in March, 2010. In order to make sure we had
high quality, sustainable and country relevant training of partner staff, six National
consultants were hired to assist the Country Program Managers (CPMs) and partner
staff in training and support on the use of the laptops and associated software.
In April 2009 a framework for an integrated M&E system was developed. The system
consists of a behavior change strategy that defines the behaviors that need to change in
order to achieve project results and the target groups to address in order to have
sustainable and long term project impact. This strategy lays the groundwork for a robust
and effective M&E system as it defines what needs to be measured and what indicators
to use. This helped define what data collection forms are required and what information
the forms needed to collect. The system also consists of a database where one can
review all raw data, analytical reports, maps and an impact dashboard. The system
originally consisted of an award and dis-incentive scheme used to encourage high
quality data collection however this was dropped later as it became apparent that it did
not work. However, instead of the award and disincentive scheme, we instituted a
system where all data submitted was tied to budget allocation. Country programs were
given budget based on what was accounted for in the database and what was in the
database was confirmed with a data audit. There was a considerable discrepancy
between what was originally reported and what was actually in the database. CP’s
were now paid for performance and not just from what they reported. This system not
only improved compliance and accountability but also efficiency, and it improved
timeliness, quality and quantity of data submission and reporting. In future projects this
should be reviewed to see what combination of incentives and dis-incentives with
performance based funding works best. A performance review / audit to ground truth
data collection and as a basis for award and dis-incentive identification was also
instituted and was a key element of the M&E strategy. Finally an sms communication
program was established using Frontline SMS to support the whole system by keeping
people informed of schedules, prompting non compliers, announcing awards and disincentives, and enabling people to report computer and connectivity issues that require
solutions. The CRS HelpDesk was also launched as an alternative to sms and
supported GLCI by allowing field staff to report technical issues. We also added
TeamViewer to the system, which allowed staff to enter any laptop remotely to trouble
shoot and solve any technical issues. This was a huge boon to the program as it
eliminated the need to travel or send laptops back to the regional office to check urgent
IT issues.
Of an estimated 18 data collection forms that were identified only eight of them were
designed digitally and finalized in English, French and Swahili by the CRS ICT technical
team in Baltimore and India. These forms were developed in two phases. Both phases
included an intensive testing and revision period and a full release and use. In the
second phase of form development and revision multiple data checks/validations were
added to forms to improve data quality, especially GIS data and to avoid submission of
forms that were missing important data. The digital system had also been upgraded so
that connection speed and upload and download of forms is much quicker. Another
modality that was developed was the possibility to import and export all data onto a
flash drive. All field agents were given flash drives for this purpose. This system enabled
people who have no Internet connectivity to save all of their collected data onto the flash
drive and send the flash drive to their head office or the CPM in their respective country.
The data was then able to be uploaded from computers where the connectivity was
better. Experience of reviewing and cleaning of data over the first few months also led
to several new innovations in data record design to facilitate cleaning and monitoring of
data. In an effort to decentralize the responsibility to manage data, all partners were
registered with passwords and trained on how to monitor and manage their own data in
March 2011. They were also given permission to delete duplicate records so that data
collection will be more efficient and easier for field agents. Finally, instead of people
filling in both digital versions and paper versions for back-up an option to print all forms
was added to the program to avoid this double work.
Technical Specifications and Architecture
Hardware- Intel Classmates or Clamshells. These are ruggedized, child friendly machines that
come with the following specifications;
•
•
•
•
•
Intel® Atom™ Processor N450 at 1.66GHz
I GB RAM
160 GB Hard drive
10.1” Screen
In Built Camera
Custom Developed Application – Utilizing the Adobe Air platform, a team of CRS developers
have created a fat client tool to allow for online and offline data collection. The application
currently runs on a windows platform and allows pre-defined forms to be completed and stored,
either locally or in a centralized database.
Cross Platform Software; The Abode Air platform is very versatile and can run on a range of
operating systems and hardware platforms. Its minimal CPU requirements ensure that the
application can run on very old hardware such as Pentium 3 machines.
Client / Server solution; The client / server applications are custom written applications,
utilizing the Adobe Air runtime environment. An adobe air and flash plug-in are required on the
client machine to run the application. All data forms completed can reside locally on the laptop
or be transmitted to the remote server. A connection was automatically established with the
server, when internet connectivity is available and data was synchronized. This function was
removed as it caused severe delays and computers to freeze for certain periods of time which
caused frustration and eroded motivation.
The following describes the basic modules within the client/server applications;
GLCI Client Application
GLCI Server Application
• Form Module; provides the application
container and locally stored forms.
• Local Reporting; Allows offline generation of
reports, based on the data collected locally on
the device.
• Business Logic – Provides the form validation
and verification checks, to ensure form entry is
completed correctly.
• Adobe AIR – packaged runtime environment
from Adobe
• SQL Lite – Local DB used by the application to
store information before it is synchronized with
the server DB.
• Aggregated Reporting; provides the
presentation of the reports to the end user.
• Central Business Logic / Data
Processing; the functional algorithms that
handle information exchange between the
database and user interface
• ColdFusion; rapid application development
platform, used to connect webpage’s to
databases.
• Database; The underlying database, where
all form data is stored. SQL Server.
Centralized Database; A server hosted within the Baltimore data centre provides the
centralized database for data synchronization. This is a dedicated server for GLCI data
collection.
Low bandwidth requirement; the application runs from a local thick client on the users laptop,
allowing it to run completely offline. If an internet connection is available it can be synced to
download any new forms, updates or to transmit completed data. Due to the thick client design,
only the raw form data is ever transfered, estimated typically to be 2-3 kilobytes per form.
Form Updates and Additions; similar to form data being transmitted to the central database,
new or updated forms can be sent to the laptops. This ensures that devices are updated with
the latest version of forms and reduces the management overhead. Similar to offline form
transmission, updates can also be transmitted via the USB export/import method. The modular
design of the application allows each form to be maintained separately from the main
application. This allows forms to be created at will and ensures only individual updates need to
be transmitted.
Reports; Users can access both raw and analyzed data via a SharePoint web-based portaliglci.org. The portal is accessed using standard CRS credentials and provides real-time access
to the live database.
The raw data portal allows access to all raw data from all data collection forms via a range of
simple filters (country, partner, district, dates, etc..). Output can be viewed on screen or
exported to excel.
The reporting data portal also provides users with a data dashboard that presents high-level
graphical results. These include graphs of;
1) Registered Farmer Groups by country
2) Multiplication by country
3) Seed dissemination by country.
4) Data collection status by country
Real-time GIS map data is also included on the website, displaying regional statistics for form
submission, disease condition and varieties available in each country.
The reporting portal also offers a number of tailored reports for each form type, viewable by the
different levels (site, partner, country, project level).
Support Structure; The software was developed and supported by the GKIM team in India and
Baltimore.
Printing; The ability to print form results from the laptops was added to the functionality, to
allow regional offices to keep a local paper based copy of the data. It was found many regional
offices preferred to have a hard copy of data available. It is expected as the technology is
accepted, that this practice will diminish except where paper documentation is required for
liquidation purposes.
The Digital M&E System and How it Works
Data Collection Forms
The following describes the process followed by a field worker when completing a new form;
a) The field worker switches on the laptop and opens the GLCI software that is preinstalled.
b) The software loads with the below screen and, if an internet connection exists, the user
can click the sync button to retrieve any software/form updates or transmit any
completed forms.
GLCI Data Collection Tool – Initialization After Opening
GLCI Data Collection Tool - Update Process and Form Index
c) The field worker then selects the blank form they would like to complete by double
clicking it. The form loads and can be filled in. See the example below of the Farmer
Group Registration Form. All forms are quantitative and do not allow for open ended
questions. This is to ensure that data can be processed and analyzed automatically
without needing to be deciphered by human operators. It is possible to design the forms
to collect qualitative data if necessary.
d) Once the form has been completed and submitted, it is moved to the outbox, where it
will reside until an internet connection is established or the export feature is used. The
completed form will stay in this state until it is transmitted. Once the system is connected
to the Internet and the sync button is pressed the forms are sent and then move to the
submitted folder (see the example below). If a user wants to save a form before it is
completed they may also save the form where it moves to the saved folder where it can
be opened again to be completed. Please see the diagram below to understand each
part of the interface better.
A
B
C
D
F
E
G
.
Highlight
Area (Red
Letter)
A
Section
Description
Import Form
B
Application buttons
C
Tab bar
D
Blank forms
E
Connection
indicator
F
Assistance button
Allows for the manual import from memory stick of new
data collection forms when an internet connection is not
available.
These buttons allow the user to sync the computer
which will send any pending data and retrieve any new
forms or updates when a network connection is present.
The export button allows a user to export data to a
memory stick if a connection doesn’t exist so it can be
sent from another machine. The import button allows a
user to import data to send from their machine.
The tab bar is the main organizational feature of the
application, allowing access to blank forms, the outbox,
saved forms, submitted forms, language preferences,
and a debugging section. The reports section is blank as
this is now available live on SharePoint.
For each of the nine forms you can open them from here
and see in the right column what version these forms
are.
Displays the connection status of the application. If a
network connection is available, “CONNECTED” is
displayed, otherwise “NOT CONNECTED” is displayed.
Clicking this button will open a request form where the
G
Application version
user can submit a message to be sent to the help desk if
they are experiencing technical difficulties.
Displays the currently installed version of the
application.
Farmer Group Registration Form Example
Submitted Folder Example
Web-Based Database and Reports
The following describes how to access the database and reports:
1. First a user must sign in with a password and username given to them from CRS
2. The user can then decide from a dropdown menu under “Project Results and Impact”
what type of data or report they want to see.
3. One can select to see the dashboard which gives a macro-level view of the project with
different charts. They can view cumulative charts from the beginning of the project or
filter to look at charts by season. All charts compare targets with what has been
achieved to date.See an example below.
4. In the dropdown menu under dashboard are “Forms” these are for FERA to fill for
disease surveys and are accessible only to those with permission.
5. In addition to the graphs displayed, GIS maps via Google maps and KML files can be
accessed, such as the example below. There are two sets of maps- one for data
collection status and the other showing status of seed dissemination, disease incidence
and variety distribution. Maps are colored in red, yellow and green based on the status
of the topic being represented. So in the example below yellow indicates that the
countries with this color have collected only 60-79% of their data.
6. To access records the user will have first have to select from the dropdown boxes at the
top labeled “before date” or “after date” and “active” or “inactive”. This is labeled as A in
the example below. This is for purposes of tracking clean and unclean data. You can
clean data and then select “before date” and once in the form select the date on which
you have cleaned. All data selected will then be the clean data. If you select “after date”
and the date you cleaned then all of that data will still not be cleaned. Inactive data is
data that has been ‘deleted’ for cleaning purposes but can still be accessed and active
data is live data that is still valid. After this is selected the user can select the form for
which data that they want to see. This is labeled as B in the example below. Once they
select these 3 thing then they will enter the database. The user will then select from a
filter menu (labeled as C in the example below). They can search by country, district,
village, partner, field agents name, date modified (cleaned) as mentioned above, and/or
season. The data will then be filtered and displayed based on these choices. If a user
wants to manipulate or analyze data on their own they can export the data into an excel
file by clicking on the button highlighted as D. If a user wants to delete an incorrect
record or a duplicate the can click the check box on the left column and delete that
record shown in the example labeled as E. These ‘deleted’ records can be viewed when
one selects “inactive” in the first menu.
7. Custom built reports are also available from the drop down menu for each of the different
forms. Each of the forms has a report for site, partner, country and project level. A user
can then filter by which country they want to see a report for, season and date. They can
also export the reports to excel. See the example below.
8. Final project studies will be available on the last dropdown option once they are
completed at project end.
Index for Database and Reports on SharePoint
Dashboard All Seasons (Cumulative) Example
Forms Example
Map Data Collection Example
A
B
C
D
E
Record Raw Data Example
Highlight
Area (Red
Section
Description
Letter)
A
B
C
D
E
Filter Criteria
You can select by before or after date and active or
inactive data.
Form Selection The initial page provides access to select the different
forms that are being used to collect data.
Form Filter
The dropdown bar at the top of the page, allows a user to
filter information based on criteria e.g. country, time
frame, etc
Export Button
Once a filter has been applied, the export button allows
the data to be exported as an Excel file
Form Records Results are displayed below the filter bar for all
information within the criteria selected and one can delete
records here.
Record Raw Data Description
Report Example
Lessons Learned and Recommendations
Lessons Learned
1. Data Collection not seen as a
high priority and excuses given
to not collect
A common problem in the
beginning of the roll-out was that
data was not collected/submitted
and reasons given were because of
non-existent electricity, Internet and
IT problems.
Recommendation
Though there are definitely problems
associated with lack of electricity, poor Internet
connection, and IT issues (form filling or
submitting errors and the server going down)
these were often overstated and at times used
as an excuse not to collect or submit data or as
leverage to try and get more funding or
equipment. We targeted each excuse one by
one until finally field staff realized they could
only provide valid reasons to not submit data.
When people used electricity as an excuse to
not collect data and we saw that most of them
charged their phones we suggested that we
would take back the laptops if they could not
use them and they would have to use paper
instead. (This may not always be the case, see
the section below on electricity and internet for
other recommendations when it is not the
case.) All users who said they did not have
electricity suddenly told us that they now had
ways to charge their laptops. To address the
lack of Internet we added an option on the data
collection tool to export data and they could
now send it to be loaded where Internet
existed. We also provided memory sticks for
this task. To address the issue of IT problems
we started to use TeamViewer so that we
could enter any problematic computer and
determine what was wrong with it. On many
occasions when we entered the computer no
problems were found. We also added Frontline
SMS and the help desk so that any technical
problem could be reported immediately and so
if it wasn’t reported then there was no excuse
to not submit data. We also strived to solve an
issue within 2 days when an issue was
reported with support from GKIM India and HQ
to avoid frustration with the technology and
also to avoid strengthening reasons not to
submit. Finally, we instituted a performance
based funding mechanism with data and a
data audit as an indicator of performance to
increase the seriousness and importance of
M&E and data collection.
2. M&E system initiated late
Because the M&E system was
initiated 2 years after the project
started there was a rushed rollout
to catch-up with already running
project activities; The project had to
digitize old paper versions and load
them into the system all of which
incurred much higher costs,
logistical problems, and frustration;
There was not enough time for
thorough testing on a small scale
before roll-out;
Need to start to develop the M&E/ICT system
from the beginning of the project otherwise
huge costs and logistical problems may be
incurred later to catch up. Thorough time
should be set aside for testing before complete
rollout and testers should understand that they
are testing the system so there will inevitably
be glitches. One should also make sure that
the user interface is as final as possible before
loading it onto all devices so that any updates
are only made to forms and this can be done
by connecting to the Internet without requiring
a new installation of the tool directly on the
device. This can be a very costly mistake if not
taken into account.
3. IT technical issues
There were several technical
complications due to incorrect
coding, lack of thorough testing and
also some resistance from IT
support to thoroughly understand
and address the issues
immediately. This led to loss of
some data, data quality and
affected motivation and bred
frustration in the field towards data
collection and ICT.
4. Lack of full access/control over
database
Lack of independence and ability to
manage, clean, query, load, and
update data and relying on having
this done remotely caused issues
of efficiency and data quality; also
having the remote server go down
with a time difference between
Africa and Baltimore and having to
wait for it to be fixed is problematic
and can also affect motivation in
the field.
5. Password registration process
A lengthy and complicated
registration process was required
by people who have minimal
computer skills to get field staff
access to the web based reports
and database. At the time also
permissions expired and had to be
renewed in short periods of time.
There should be more oversight and thorough
testing over the design of all data collection
tools, databases and coding. Also when a
problem is reported it requires through
investigation until a solution is found. If a
solution can’t be found immediately it should
be raised to higher levels and a task force
needs to be set up to trouble shoot it. Insisting
that no problem exists and considering the
issue closed cannot be a possibility.
Every program needs to have full access to
their database so that they can clean, load,
query and manage their data. It is extremely
inefficient, costly and prone to error to have
this done through a second party. If data is
housed centrally then there needs to be
someone on 24 hour call for maintenance or
the data should be served from a cloud where
that 24 hour maintenance exists.
An automated and simple password
registration process should be developed that
can be tailored to different project needs to
avoid any complications or difficulties for
people to quickly access reports and data.
This caused delays in people using
the system during training seminars
which affected the training quality
and also would affect overall web
based reporting use.
6. Staff turnover
In most countries there is a high
staff turnover so once people are
trained and have practice and
experience in using the M&E / ICT
system they move on to other jobs.
This creates a challenge in getting
new staff who newly come onto the
job up to speed so that they can
competently collect/submit data
using the computers.
7. Unreliable power and internet
connectivity
Access to a reliable source of
power and an internet connection is
limited or non-existent in many of
the remote areas in which GLCI
operates, posing challenges to
effective electronic data capture.
8. Low level of computer skills
Most field agents were first time
computer users who, even after
intensive initial training, require
ongoing support to effectively use
the laptops.
9. Inadequate use of field IT
support
The field IT support system at the
Develop a small training manual and within
each partner office or CP assign a person who
can give 1 day ToT or every 6 months or so to
new staff. They should team up for a week with
an experienced staff member from their office
after the training for practical experience and
mentoring.
Before developing an M&E/ICT project an
analysis of the electrical, telephone and
Internet system should be made and mapped
using GIS. Where internet, phone and
electricity are needed one should ensure that
at a minimum all partner offices have
connectivity.
Where possible, if Internet is not available but
phone or cell lines exist that can handle data at
a decent speed and cost mobile phone lines
might be used.
Field agents can also upload new data
collection forms and update old ones from a
memory stick and send data on a their stick.
This data can be sent to partner offices who
then send the data via internet. For severe and
proven electricity issues consider voucher
systems or solar chargers. Where only a few
field agents do not have electricity, might
explore using paper based forms while in the
field and then having them loaded digitally
once a month when they go to their home
office. In a more severe case for emergencies
one might set up a portable satellite antenna
and use a generator for electricity.
Train and support partner staff and as
mentioned above under staff turnover have
one or several designated trainer of trainers, a
user’s manual and mentoring.
Sensitize partners on using the help desk and
Frontline SMS system to improve
communication and trouble-shooting support.
beginning of the project was
inadequate so most IT issues had
to be resolved by the regional
office. People also didn’t report
problems in a timely manner and
field agents did not make full use of
the help desk or sms system to
report issues. Not using the sms or
helpdesk leads to the inability to
track assistance and the trouble
shooting instructions given.
10. Proliferation of viruses
GLCI found that more than 60% of
the laptops were infected, despite
virus protection, from downloads
from the internet and flash drives
sharing. McAfee antivirus software
was installed on all laptops, but
was not updated by users or run.
Each laptop was configured with
two accounts; and Administrative
Account and a User Account;
This was done to help reduce the
risk of virus and machine misuse.
Users could not install new
application, although they did have
the ability to perform application
updates for McAfee and Windows.
However most users got access to
the password for the Admin side
and downloaded programs, music,
videos, etc...from the Internet. Porn
was also found on many
computers.
11. Hard disk misuse
Misuse included storing large music
or video files that filled the 30
gigabit disk capacity, loading
incompatible programs or programs
incompatible with Windows. This
led to several computers crashing.
12. Cultural Change
The initial introduction of computers
into the field was met with
resistance. It was found that some
field officers preferred to print out
the forms and then complete them
with pen and paper. The
justification for this, was they
required a physical copy to be
stored. Resistance was also met by
Incorporate ICT work into all CP IT staff’s
TOR’s. Also have all CP IT staff able to use
TeamViewer and train them if needed to
manage the computers, re- image, install data
collection tool, and report issues using the
helpdesk– and to own the process.
Provide virus infection training and have
CP IT staff regularly check and update virus
scan and to do regular cleaning. It would be
useful also to have an incentive and
disincentive program to encourage clean
computers. Re-image severely infected
computers. If possible on any new device
selected for use block the ability of users to
download from the Internet and create
permissions to access the usb port.
CP IT staff should regularly check and delete
non-essential data and programs and penalize
user if problem arises continuously. GLCI also
advises users to buy external drives to store
large non-work files to allow the operating
system to function.
Provide additional functionality to users so that
the devices are attractive and they want to
keep them. For example the mini-laptops give
some level of prestige to the owners and they
can use Internet and listen to music. Also, take
time to demonstrate the advantages and cost
savings of using a computerized system. For
example it can help boost their skills and
improve their career path. A printing
functionality was added to the GLCI data tool,
some CRS country and regional
staff to the use of M&E /ICT. They
preferred summary reports or the
use of paper documentation.
13. Version Upgrades Needed
Revisions, additions and
improvement of forms or to the
system are required. Just like any
technology new versions are
always being introduced to improve
on the old ones.
.
to allow staff to keep hard copies within the
regional offices instead of insisting that they
had to collect only with paper for this purpose.
One should also try to hire staff with some IT
skills or at least have the interest to learn. It is
also necessary to be committed to a long term
vision. It will take time for attitudes and
practices to change, but over time with
experience, prolonged use and some level of
positive re-enforcement to use the technology
usage and the way ICT is seen does improve.
An important element to this is that consistent
messaging must be conveyed to the field from
all CRS staff about the use of ICT. We must all
be on the same page and give the same
messages to others. If not, this can diminish
the power of positive reinforcement and
eventually stall the support for and use of the
system. In an effort to build support within CRS
for ICT high level advocacy should be carried
out with clear examples of benefits and
successes over other options given.
This should be expected and built into the
program mentally, logistically and financially.
Persistence and perseverance are required in
the beginning when rolling out ICT especially
when programs don’t run perfectly. One should
not give up but continue to improve. With time
and experience systems will be of high integrity
and quality. The update process and rollout is
likely to need several iterations, ensure
resources are planned for these tasks.