1
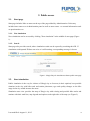
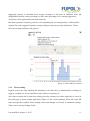
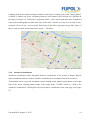
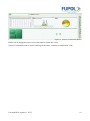
Skopje Bicycle Routes Simulator Software user manual Table of contents 1. General description .................................................................................................................... 3 1.1. Introduction ............................................................................................................................ 3 1.2. Languages .............................................................................................................................. 3 2. Public access ................................................................................................................................... 4 2.1. Start page ............................................................................................................................... 4 2.1.1. New simulation............................................................................................................. 4 2.1.2. Search ........................................................................................................................... 4 2.2. Start simulation ...................................................................................................................... 4 2.2.1. Station editing .................................................................................................................... 5 2.2.2. Track editing ...................................................................................................................... 6 2.2.3. Draw new track .................................................................................................................. 7 2.2.4. Start simulation .................................................................................................................. 8 2.3. Simulation results .................................................................................................................. 9 2.3.1. Map objects ................................................................................................................ 10 2.3.2. Data for each .............................................................................................................. 10 2.3.3. Ticket sending ............................................................................................................ 11 2.3.4. Results block .............................................................................................................. 12 2.3.5. Timeline...................................................................................................................... 13 2.3.6. Advanced visualization .............................................................................................. 14 Last modified: August 11, 2015 2 General description 1.1. Introduction Skopje Bicycle Routes Simulator Software is created to find optimal solution for bicycle station and track building location in the City of Skopje. To encourage the intermodal transport, the citizens are also integrated in the collection of ideas on how bicycle intermodality can be fostered. The citizen participation is supported including the use of a simulation tool. Administration is accessible at http://prod.fupol.lv:8080/skopjebicycle/city. Public simulation is accessible at http://prod.fupol.lv:8080/skopjebicycle. 1.2. Languages Skopje Bicycle Routes simulation software provides three language choices as software language English (default), Macedonian and Albanian. Languages can be changed by clicking on representing flag on top right corner of any page. Active language flag is highlighted. Last modified: August 11, 2015 3 2. Public access 2.1. Start page Start page includes links as menu on the top of the page added by Administration. Links may include inner routes as to Administration panel as well as outer routes - to external information such as questionnaires etc. 2.1.1. New simulation New simulation can be accessed by clicking "New simulation" in the middle of start page (Figure 1). 2.1.2. Search Start page also provides search, where simulation results can be opened by searching their ID. If simulation with inputted ID does not exist or is still running, corresponding message is shown. Figure 1: Skopje Bicycle simulation software public start page 2.2. Start simulation Public simulation is the way for citizens of Skopje city to forecast (in their opinion) best possible situation in the city with bike track and station placement, type and quality changes so the bike usage in the city would increase the most. Simulation start view provides the map of Skopje city with existing and possible bike tracks and stations with their total lists, map legends and options at the right side of the map (see Figure 2). Last modified: August 11, 2015 4 Figure 2: New simulation start page with object lists open 2.2.1. Station editing Clicking on any station on the map opens up its information window (see Figure 3) where under station name and its code the three icons are placed (Bus station, Train station, Point of interest) - if the icon is black, its corresponding element is included in the station. If icon is transparent/grey, the element is not included. Lower there is shown station position on the map is shown as well as input field to suggest the capacity, change station status (NO_POSSIBILITY, POSSIBLE, PLANNED, EXISTING) or its type (PARKING, RENTING, NO_PARKING) in corresponding dropdowns. As statuses are represented by different coloured markers on the map, status change in the dropdown also changes marker color on the map. Changes made are saved automatically. Informative window can be closed by clicking close button (X) on the right top corner. Figure 3: Station information window before simulation Last modified: August 11, 2015 5 2.2.2. Track editing Tracks can be edited in similar way as stations. Their informative windows (see Figure 4) can be opened by clicking on the track on map. User can view track start and end point names and codes, change track quality (No possibility, Very bad, Bad, Good, Excellent) and status (NO_POSSIBILITY, POSSIBLE, PLANNED, EXISTING). Its position on the map is also shown as well as the button for track route editing. Figure 4: Track information window before simulation After clicking "edit track route", the route editing view is opened with only this track shown on the map. To edit the route, drag points of the track to create new turns or to move existing ones (see Figure 5). Track start and end points have to stay at their existing positions, because these are station positions that are connected by this track. Figure 5: Track route editing before simulation Last modified: August 11, 2015 6 Click on the map to finish editing or click on "Cancel track editing" to cancel. 2.2.3. Draw new track In the Skopje city there are also a lot of stations that are not directly connected to each other or the connection is not the best possible. User can also draw new tracks to connect stations so simulation bicycle users could use better route. To start track drawing process, click on the track drawing icon on the left side of the map in with "Map legends" block opened (see Figure 6). Figure 6: Red highlighted track drawing button First step is to choose two stations to connect (by clicking on them). Throughout all the track drawing process, the informative messages and input field will be shown in the top center of the screen (see Figure 7). Last modified: August 11, 2015 7 Figure 7: Track drawing step 1 information Chosen stations will bounce. If both chosen station have track connecting them, the corresponding information will be displayed and user would be asked to choose different stations. After choosing start and end points, track route should be created the same way as editing the track (see point 2.2.2). Next step is to set basic information about the track as it's quality and status (see Figure 8). According to quality set, the new track will be placed on the map in corresponding color (i.e. if excellent then color would be green. See Figure 9). Figure 8: Drawing track data input Figure 9: Created new track. 2.2.4. Start simulation Simulation also requires basic data input before starting simulation - weather conditions (bright, sunny, cloudy, rainy, snowy, storm) and month of year when one week period will be simulated. Last modified: August 11, 2015 8 While simulation is running, it's progress and spent time is shown on screen (Figure 10). Figure 10: Running public simulation view 2.3. Simulation results All the basics of simulation results are explained in this section. There are minor differences between Master user result view and public access results. Figure 11: Public simulation results with map legends open Results include map objects (tracks and stations) with their information, result blocks, timeline and ticket sending feature (see Figure 11). Last modified: August 11, 2015 9 2.3.1. Map objects Map results has different parts and sections which each provides significant functionality for result representation. There are five different station types represented by different icons on map. Table 2.3.1. shows explanation according to icons. Icon Explanation Not possible Planned station Possible station Existing station Point of interest Table 2.3.1 - Station icon explanation Point of interest star is added to other markers if the station has it. Tracks are shown as colorful lines on roads. Each color represents different track quality. Green is excellent; Pink - good; Brown - bad, red road is in very bad condition and grey road is not possible. Days in which to show simulation object results can be chosen by clicking on its names in top left corner of result view. Under day block there is a list of tracks. Clicking on track in list opens it's data window. To switch from track list to station list, click on representative title at the top of the list block. 2.3.2. Data for each Clicking on each station and track opens it's data window (Figure 12), where it shows station's data starting with title (in corresponding language) and code. Under title there are three icons representing station - is there bus station, train station and is it point of interest. If station does not include those - representative icons are shown pale. These icons are not shown for tracks. Under introductive data there is shown territory where object is located on map. After that for both tracks and stations there is a list of main numeric and non-numeric attributes. Stations include parking station status, capacity, average utilization per hour throughout all the simulation time, suggested capacity for this station as well as station type. Last modified: August 11, 2015 10 Suggested capacity is calculated from average occupancy of all hours in simulated week and multiplied by the bike owner percentage (or bike renter percentage if it is renting suggestion). Tracks have track quality and track status in the list. Bar chart represents occupancy per hour in corresponding day (set using timeline). Chart includes capacity line (red), suggested capacity (orange) and green capacity (average utilization). Tracks have only average utilization line (green). Figure 12: Data window for station 2.3.3. Ticket sending Regular system user after finishing his simulation, can send ticket to Administration of Skopje to suggest, complain etc. about simulation tracks, stations, occupancy etc. New ticket creation can be started by clicking on ticket creation icon on the right side of screen in the result page. It opens up data input form (Figure 13) for e-mail (optional), ticket title, topic and ticket message that explains ticket sending reason and changes to be made in simulation settings. Ticket can be sent by clicking "Send". Last modified: August 11, 2015 11 If e-mail was inputted in the form, user will receive messages to that e-mail for all the changes of ticket - creation, opened by Administration, received an answered, changed status or suggested. After sending the ticket all that information will be shown also in simulation result block ticket subblock. Figure 13: Ticket form 2.3.4. Results block Results block (Figure 14) can be opened by clicking on results representative icon on the right side of results page. Result block includes multiple sub-blocks: Simulation basic information with trivial explanation, chosen parameters and finish time; Ticket block (if ticket has been sent) with sent ticket's basic information, simulation ID, conversation with Administration and buttons to reply (if ticket is still open) and approve/disapprove buttons (if ticket is answered); Simulation configuration suggestion - if Master is viewing simulation results and it has been suggested. It includes simulation settings file links used for this simulation and Approve/Reject buttons to set suggestion status (if it has not been done already); Average station occupancy table - Table with data about all the stations that are being occupied during the day. Average occupancy for each day is calculated as total visitors in all the day divided by 24 hours. Above the table there are buttons for switching between days Last modified: August 11, 2015 12 of the week to see occupancy in other days. Clicking on the table headers sort table (by station name or occupancy number either ascending or descending); Bicycle usage block. Block shows 'Bicycle usage' percentage, that represents how many bicycle owners use their bikes (at least once) during one week of chosen simulation month. 'Average bicycle riders..' shows what percentage of all citizens of the city are using their bikes during that one week period. Chart shows percentage breakdowns for each day. Figure 14: Full simulation results view 2.3.5. Timeline Simulation is run for one week period. Timeline is used to interactively show situation in the bicycle path over that time iteration by one hour. Timeline for simulation results (both Master user's and public) is placed on the top left corner of the map. Timeline includes six option buttons and two informative fields (see Figure 15). Figure 15: Simulation results timeline Top row is for days - arrow on the left switches one day back. Arrow on the right - day forward. Text in the middle represents the day that is selected. Bottom row is for hours - (from left to right) play button animates through the time hour by hour, changing situation on the map accordingly. Pause button stops animation. Arrow left and arrow right can change timeline time by one hour back and forth. Bottom middle information field shows hour chosen. Last modified: August 11, 2015 13 Changing time in the timeline changes situation on the map. If station style (in the "map legends") is chosen as 'charts' not 'icons', occupancy charts for each station will be shown at it's position on the map (see Figure 16). Tracks have occupancy nodes - circles on the map show how occupanced is the track assuming that one bike takes 2m2 of the track. If nodes are closer to red, track is more occupied. Closer to red - less occupied. Each node on the track represents twenty bike riders (if there is only one node on the track, there can be 1 - 20 riders). Figure 16: Simulation results charts and track nodes 2.3.6. Advanced visualization Advanced visualization offers integrated Semavis visualization in the results of Skopje Bicycle routes simulation software. Semavis includes visualization for occupancy data of the resources. Visualization can be viewed in simulation results clicking on the global results button on the right side of the screen opening global results. There right under “CLOSE” button is a link to the Advanced visualization. Clicking that will open Semavis visualization in the same page (see Figure 17). Last modified: August 11, 2015 14 Figure 17. Semavis first view Clicking the “Occupancy” block and then “By day” block on the left side opens up the day choice for statistic visualization (see Figure 18). Then clicking on the desired day finishes the choice for the data. Figure 18. Occupancy choice by day Clicking on data visualization blocks from the right side column allows to show them on the screen. Multiple visualization types can be added to the screen (see figure 19). Last modified: August 11, 2015 15 Figure 19. Semavis visualization blocks Blocks can be dragged around, resized and removed from the screen. Semavis visualization can be closed clicking on the same “Advanced visualization” link. Last modified: August 11, 2015 16