1
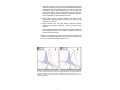
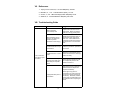
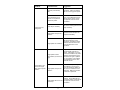
※本プロトコールは参考用の資料になり ます。商品ご購入の際は必ず商品に添付 されている資料をご参照ください。 Enabling Discovery in Life Science® Total ROS Detection Kit for fluorescence microscopy and flow cytometry Instruction Manual Cat. No. ENZ-51011 For research use only. Rev. 2.0.2 November 2010 200 fluorescence microscopy assays or 50 flow cytometry assays Notice to Purchaser The Total ROS Detection Kit is a member of the CELLestial® product line, reagents and assay kits comprising fluorescent molecular probes that have been extensively benchmarked for live cell analysis applications. CELLestial® reagents and kits are optimal for use in demanding cell analysis applications involving confocal microscopy, flow cytometry, microplate readers and HCS/HTS, where consistency and reproducibility are required. This product is manufactured and sold by ENZO LIFE SCIENCES, INC. for research use only by the end-user in the research market and is not intended for diagnostic or therapeutic use. Purchase does not include any right or license to use, develop or otherwise exploit this product commercially. Any commercial use, development or exploitation of this product or development using this product without the express prior written authorization of ENZO LIFE SCIENCES, INC. is strictly prohibited. Limited Warranty This product is offered under a limited warranty. The product is guaranteed to meet appropriate specifications described in the package insert at the time of shipment. Enzo Life Sciences’ sole obligation is to replace the product to the extent of the purchase price. All claims must be made to Enzo Life Sciences, Inc. within five (5) days of receipt of order. Trademarks and Patents Enzo and CELLestial are trademarks of Enzo Life Sciences, Inc. Several of Enzo’s products and product applications are covered by US and foreign patents and patents pending. Contents I. Introduction ............................................................... 1 II. Reagents Provided and Storage.............................. 1 III. Additional Materials Required ................................. 2 IV. Safety Warnings and Precautions........................... 2 V. Methods and Procedures ......................................... 3 A. REAGENT PREPARATIONS ..................................................... 3 B. CELL PREPARATIONS.............................................................. 4 C. FLUORESCENCE/CONFOCAL MICROSCOPY (ADHERENT CELLS) ................................................................. 4 D. FLUORESCENCE/CONFOCAL MICROSCOPY (SUSPENSION CELLS) ............................................................. 5 E. FLOW CYTOMETRY (ADHERENT CELLS) .............................. 6 F. FLOW CYTOMETRY (SUSPENSION CELLS) .......................... 6 VI. Appendices ............................................................... 7 A. FILTER SET SELECTION .......................................................... 7 B. SETTING UP OPTIMAL EXPOSURE TIME FOR DETECTION OF THE DYE ........................................................ 7 C. ANTICIPATED RESULTS (FLUORESCENCE MICROSCOPY) .......................................................................... 8 D. FLOW CYTOMETRY DATA ANLYSIS AND ANTICIPATED RESULTS .......................................................... 8 VII. References .............................................................. 10 VIII. Troubleshooting Guide ......................................... 10 I. Introduction Free radicals and other reactive species play influential roles in many human physiological and pathophysiological processes, including cell signaling, aging, cancer, atherosclerosis, macular degeneration, sepsis, various neurodegenerative diseases (Alzheimer’s and Parkinson’s disease) and diabetes. Once produced within a cell, free radicals can damage a wide variety of cellular constituents, including proteins, lipids and DNA. However, at lower concentrations these very same agents may serve as second messengers in cellular signaling. Information-rich methods are required to quantify the relative levels of various reactive species in living cells and tissues, due to the seminal role they play in physiology and pathophysiology. The Total ROS Detection Kit provides a simple and specific assay for the real-time measurement of global levels of reactive oxygen species (ROS), including peroxynitrite, in living cells. This kit is designed to directly monitor real time reactive oxygen and/or nitrogen species (ROS/RNS) production in live cells using fluorescence microscopy and/or flow cytometry. The kit includes Oxidative Stress Detection Reagent (Green) as the major component. This non-fluorescent, cellpermeable total ROS detection dye reacts directly with a wide range of reactive species, such as hydrogen peroxide, peroxynitrite and hydroxyl radicals, yielding a green fluorescent product indicative of cellular production of different ROS/RNS types. The kit is not designed to detect superoxide and reactive chlorine or bromine species, as the fluorescent probe included is relatively insensitive to these analytes. Upon staining, the fluorescent product generated can be visualized using a wide-field fluorescence microscope equipped with standard green (490/525 nm) filter set, or cytometrically using any flow cytometer equipped with a blue (488 nm) laser. II. Reagents Provided and Storage All reagents are shipped on dry ice. Upon receipt, the kit should be stored at -20°C, or -80°C for long term storage. When stored properly, these reagents are stable for at least twelve months. Avoid repeated freezing and thawing. Reagents provided in the kit are sufficient for at least 200 microscopy assays or 50 flow cytometry assays using live cells (adherent or in suspension. Reagent Quantity Oxidative Stress Detection Reagent (Green) ROS Inducer (Pyocyanin) 300 nmoles 1 µmole ROS Inhibitor (N-acetyl-L-cysteine) Wash Buffer Salts 2 x 10 mg 1 pack 1 III. Additional Materials Required CO2 incubator (37°C) Standard fluorescence microscope or flow cytometer equipped with a blue laser (488 nm) Calibrated, adjustable precision pipetters, preferably with disposable plastic tips 5 mL round bottom polystyrene tubes for holding cells during induction of ROS/RNS (for suspension cells only) and during staining and assay procedure Adjustable speed centrifuge with swinging buckets Glass microscope slides Glass cover slips Deionized water Anhydrous DMF (100%) IV. Safety Warnings and Precautions This product is for research use only and is not intended for diagnostic purposes. Reagents should be treated as possible mutagens and should be handled with care and disposed of properly. Observe good laboratory practices. Gloves, lab coat, and protective eyewear should always be worn. Never pipet by mouth. Do not eat, drink or smoke in the laboratory areas. All blood components and biological materials should be treated as potentially hazardous and handled as such. They should be disposed of in accordance with established safety procedures. To avoid photobleaching, perform all manipulations in low light environments or protected from light by other means. 2 V. Methods and Procedures NOTE: Allow all reagents to warm to room temperature before starting with the procedures. Upon thawing of solutions, gently hand-mix or vortex thereagents prior to use to ensure a homogenous solution. Briefly centrifuge the vials at the time of first use, as well as for all subsequent uses, to gather the contents at the bottom of the tube. A. REAGENT PREPARATIONS Reconstitution or dilution of any and all reagents in DMSO should be avoided, as this solvent inhibits hydroxyl radical generation in cells. 1. Detection Reagent The Oxidative Stress Detection Reagent (Green) is supplied lyophilized and should be reconstituted in 60 L anhydrous DMF to yield a 5 mM stock solution. Upon reconstitution, the stock solution should be stored at -20°C. Gently mix before use. 2. Positive Control The ROS Inducer (Pyocyanin) is supplied lyophilized and should be reconstituted in 100 µL anhydrous DMF to yield a 10 mM stock solution. For use, a final concentration of 200-500 μM is recommended. However, the optimal final concentration is celldependent and should be determined experimentally for each cell line being tested. ROS induction generally occurs within 20-30 minutes upon pyocyanin treatment and may decrease or disappear after that time. Plan accordingly. 3. Negative Control The ROS Inhibitor (N-acetyl-L-cysteine) should be reconstituted in 123 L of deionized water to yield a 0.5 M stock concentration. N-acetyl-cysteine is not readily soluble and may require vortexing. For use, a final concentration of 5 mM is recommended. However, the optimal final concentration is cell-dependent and should be determined experimentally for each cell line being tested. Endogenous fluorescence of untreated cells should be determined in advance or per assay. 4. 1X Wash Buffer Prepare 1X Wash Buffer by dissolving the contents of the pack in 1 liter of deionized water. When not in use, the 1X Wash Buffer should be stored refrigerated. Warm to room temperature before use. 3 5. ROS Detection Solution Prepare the ROS Detection Solution as follows: To every 10 mL of 1X Wash Buffer (see step 4) or culture medium, add 2 µL Oxidative Stress Detection Reagent (Green). Gently mix. To prepare smaller volumes of ROS Detection Solution, intermediate1:10 dilution of the Oxidative Stress Detection Reagent (Green) in 1X Wash Buffer or culture medium is recommended. B. CELL PREPARATIONS Cells should be maintained via standard tissue culture practices. Always make sure that cells are healthy and in the log phase of growth before using them for the experiment. C. FLUORESCENCE/CONFOCAL MICROSCOPY (ADHERENT CELLS) 1. The day before the experiment, seed the cells directly onto glass slides or polystyrene tissue culture plates to ensure ~ 50-70% confluency on the day of the experiment. IMPORTANT: Cells should be healthy and not overcrowded since results of the experiments will depend significantly on the cells’ condition. 2. Load the cells with the ROS Detection Solution (see step A-5, above) using a volume sufficient to cover the cell monolayer and incubate under normal tissue culture conditions for 1 hour. 3. Carefully remove the ROS Detection Solution from the glass slides by gently tapping them against layers of paper towel, or from tissue culture plates. Optional: Cells may be washed with the 1X Wash Buffer. 4. Treat the cells with an experimental test agent. Separate positive control samples should be treated with the ROS Inducer (Pyocyanin). Negative Control samples should be established by treatment with the ROS Inhibitor (N-acetyl-L-cysteine). NOTE: Cells should be treated with the ROS Inhibitor 30 minutes prior to induction. All treatments should be performed under normal tissue culture conditions. It is recommended to perform a pretreatment by adding the ROS Inhibitor to the aliquots of ROS Detection Solution for the last 30 minutes of the reagent loading. Treatment with an experimental test agent or ROS inducer included with the kit should be performed in the cell culture media without dye. 5. Carefully wash cells twice with 1X Wash Buffer in a volume sufficient to cover the cell monolayer. 4 6. Immediately overlay the cells with a cover slip and observe them under a fluorescence/confocal microscope using standard excitation/emission filter sets. Oxidative stress detection requires a filter set compatible with Fluorescein (Ex/Em: 490/525nm). Make sure prepared samples are protected from drying. Dried out cells may present different fluorescence patterns. D. FLUORESCENCE/CONFOCAL MICROSCOPY (SUSPENSION CELLS) 1. Cells should be cultured to a density not to exceed 1 x 10⁶ cells/ mL. Make sure that cells are in the log phase of growth before starting an experiment. IMPORTANT: Cells should be healthy and not overcrowded since results of the experiments will depend significantly on the cells’ overall condition. A sufficient volume of cells should be centrifuged at 400 x g for 5 minutes, yielding a working cell count of 1 x 10⁵ cells/sample. 2. Resuspend the cell pellet in 200 L of ROS Detection Solution (see step A-5, page 4) and incubate under normal tissue culture conditions for 1 hour with periodic shaking. 3. Centrifuge the cells at 400 x g for 5 minutes to remove the ROS Detection Solution. Optional: Resuspend the cells in 5 mL 1X Wash Buffer, centrifuge them at 400 x g for 5 minutes and remove the supernatant. 4. Treat the cells with an experimental test agent. Separate positive control samples should be treated with the ROS Inducer (Pyocyanin). Negative Control samples should be established by treatment with the ROS Inhibitor (N-acetyl-L-cysteine). NOTE: Cells should be treated with the ROS Inhibitor 30 minutes prior to induction. All treatments should be performed under normal tissue culture conditions. It is recommended to perform a pretreatment by adding the ROS Inhibitor to the aliquots of ROS Detection Solution for the last 30 minutes of the reagent loading. Treatment with an experimental test agent or ROS inducer included with the kit should be performed in the cell culture media without dye. 5. Centrifuge the cells at 400 x g for 5 minutes. 6. Resuspend the cells in 5 mL of 1X Wash Buffer, centrifuge them at 400 x g for 5 minutes and remove the supernatant. 7. Resuspend the cells in 100 L of 1X Wash Buffer and apply a 20 L aliquot of the cell suspension, sufficient for 2 x 10⁴ cells, onto a microscope slide. Immediately overlay the cells with a cover slip and analyze via fluorescence microscopy. Oxidative 5 stress detection requires a filter set compatible with Fluorescein (Ex/Em: 490/525nm). Make sure that prepared samples are protected from drying. Dried out cells may present different fluorescence patterns. E. FLOW CYTOMETRY (ADHERENT CELLS) 1. The day before the experiment, seed the cells on appropriate tissue culture plates to ensure ~ 50-70% confluency on the day of the experiment. IMPORTANT: Cells should be healthy and not overcrowded since results of the experiments will depend significantly on the cells’ condition. 2. Induce the cells with an experimental test agent. Separate positive control sample should be treated with the ROS Inducer (Pyocyanin). Negative Control samples should be established by treatment with the ROS Inhibitor (N-acetyl-L-cysteine) NOTE: Cells should be pre-treated with the ROS Inhibitor at least 30 minutes prior to induction. All treatments should be performed under normal tissue culture conditions. 3. Remove the media with the inducers/inhibitors from the cells by aspiration. Carefully wash cells twice with 1X Wash Buffer in a volume sufficient to cover the cell monolayer, aspirate the supernatant. 4. Detach cells from the tissue culture plates using any appropriate method, collect cells in 5 mL round-bottom polystyrene tubes and wash them with 1X Wash Buffer. Centrifuge the cell suspension for 5 min. at 400 x g at room temperature. Discard the supernatant. 5. Resuspend the cell pellet in 500 µL of ROS Detection Solution (see step A-5, page 4). Stain cells for 30 min. at 37°C in the dark. No washing is required prior to the analysis of the samples by flow cytometry. F. FLOW CYTOMETRY (SUSPENSION CELLS) 1. Cells should be cultured to a density not to exceed 1 x 10⁶ cells/ mL. Make sure that cells are in the log phase of growth before starting an experiment. IMPORTANT: Cells should be healthy and not overcrowded since results of the experiments will depend significantly on the cells’ overall condition. A sufficient volume of cells should be centrifuged at 400 x g for 5 minutes, yielding a working cell count of 1-5 x 10⁵ cells/ sample. 6 2. Induce the cells with an experimental test agent. A separate positive control sample should be treated with the ROS Inducer (Pyocyanin). A negative control sample should be established by treatment with the ROS Inhibitor (N-acetyl-L-cysteine). NOTE: Cells should be pre-treated with the ROS Inhibitor 30 minutes prior to induction. All treatments should be performed under normal tissue culture conditions. 3. Centrifuge the cells at 400 x g for 5 minutes. Discard supernatatant. 4. Resuspend the cells in 5 mL of 1X Wash Buffer, centrifuge them at 400 x g for 5 minutes and remove the supernatant. 5. Resuspend the cells in 500 μL of the ROS Detection Solution (see step A-5, page 4) and incubate 30 min at 37°C in the dark. No washing is required prior to the flow cytometry analysis. VI. Appendices A. FILTER SET SELECTION For fluorescence microscopy, careful consideration must be paid to the selection of filters. Dichroic filters should be selected in which the “cut-off” frequency is optimally mid-way between the two emission bands that are desired (one reflected, the other transmitted). However, it is important to realize that dichroic filters have a somewhat limited reflectance range, i.e., a 600 nm short-pass dichroic filter may actually reflect light <500 nm. When selecting filters, it is critical to discuss with the filter or microscope manufacturer exactly what wavelength specifications are required for both the transmitted and the reflected light. In addition, filters should be obtained that have the highest possible transmission efficiency (typically requiring anti-reflection coating). Each optic that an emission beam must traverse will remove some fraction of the desired light. The difference between 80% transmission and 95% transmission for each detector may result in a greater than three-fold difference in the amount of light available to the detector. B. SETTING UP OPTIMAL EXPOSURE TIME FOR DETECTION OF THE DYE Optimal exposure times should be established experimentally for each dye used in the experiment. Both negative and positive controls should be utilized. Start with the negative control (untreated stained cells) and set up the exposure time so the fluorescent background is negligible. Then switch to a positive control (pyocyanin-treated cells) and adjust the exposure time to record a bright fluorescent image. 7 Avoid saturation of the signal (very bright spots on the image). If saturation of the signal occurs, decrease the exposure time. It is recommended to acquire 5-6 single color images for each sample. C. ANTICIPATED RESULTS (FLUORESCENCE MICROSCOPY) 1. It is critical that positive (pyocyanin-induced) and control (untreated) samples be included in every experiment for every cell type. Negative (ROS Inhibitor-pretreated) sample is optional but very helpful. In preliminary experiments, it is important to establish appropriate doses of inducers and inhibitors for each cell type used. 2. Increased levels of oxidative stress give a uniform green cytoplasmic staining in the presence of the Oxidative Stress Detection Reagent (Green). 3. ROS positive control samples, induced with ROS Inducer (Pyocyanin), exhibit a bright green fluorescence in the cytoplasm. 4. Cells pretreated with the ROS Inhibitor (N-acetyl-L-cysteine) should not demonstrate any green or orange fluorescence upon induction. 5. Untreated samples should present only low autofluorescent background signal in any channel. D. FLOW CYTOMETRY DATA ANALYSIS AND ANTICIPATED RESULTS 1. It is critical that positive (pyocyanin-induced) and control (untreated) samples be included in every experiment for every cell type. Negative (ROS Inhibitor-pretreated) sample is optional but very helpful. In preliminary experiments, it is important to establish appropriate doses of inducers and inhibitors for each cell type used. 2. Cell debris should be gated out using FSC versus SSC dot plot. 3. Generate a log FL1 (X-axis) versus a log FL2 or SSC (Y-axis) dot plot and add quadrants to it. Adjust quadrants so the majority of control cells (80-90%) will fall into lower left quadrant. Keep the same quadrant gate throughout the assay. Alternatively, log FL1 histogram can be used, where the mean fluorescence of the peak for the untreated cells should fall within the first decade of a log FL1 scale. NOTE: Remember that different cell types demonstrate different redox profiles therefore the number of the cells in the lower left quadrant may vary significantly between the cell lines. 8 4. Cells with increased levels of oxidative stress demonstrate bright green fluorescence in the presence of the Oxidative Stress Detection Reagent and will be detected using FL1 channel. Such cells will appear in the two right quadrants of a log FL1 (X-axis) versus FSC or SSC dot plot. If log FL1 histogram is used, the peak generated by the ROS positive cells will have increased FL1 fluorescence compared to a control cells’ fluorescence. 5. ROS positive control samples, induced with ROS Inducer (Pyocyanin), exhibit bright green fluorescence and appear to be positive in FL1 channel. 6. Cells pretreated with the ROS Inhibitor (N-acetyl-L-cysteine) should not demonstrate significant green fluorescence upon induction. 7. Control (untreated) samples should present only low autofluorescent background signal in any channel thus falling into the first decade on a log FL2 scale. Results of the experiments can be presented as percentage of the cells with increased ROS production or as increase in the mean fluorescence of the induced samples versus control. A B Figure 1. Jurkat cells were induced with 100 μM pyocyanin (general ROS inducer, panel A), or 1 μM of t-butyl-hydroperoxide (peroxide inducer, panel B), stained with Total ROS Detection Reagent and analyzed using flow cytometry. Untreated cells were used as a control. Cell debris were ungated. The numbers in the inserts reflect the mean green fluorescence of the control and treated cells. 9 VII. References 1. Tarpey, M. and Fridovich, I. Circ Res. 89 (2001), 224-236. 2. Batandier ,C., et al. J Cell Mol Med. 6 (2002), 175-187. 3. Gomes, A., et al. J Biochem Biophys Meth. 65 (2005), 45-80. 4. Wardman, P. Free Rad Biol Med. 43 (2007), 995-1022. VIII. Troubleshooting Guide Problem Low or no fluorescent signal in positive control Potential Cause Suggestion Dead or stressed (overcrowded) cells Prepare fresh cell culture for the experiments. Make sure that the cells are in the log growth phase. Band pass filters are too narrow or not optimal for fluorescent probes (fluorescence microscopy) Multiple band pass filters sets provide less light than single band pass ones. Check Methods and Procedures section of this manual and Appendix A for recommendations. Insufficient fluorescent dye concentration Follow the procedures provided in this manual. Insufficient inducer concentration Determine an appropriate concentration of inducer for the cell line(s) used in the study. Species of interest may react with each other, thus attenuating the expected signal. Check signaling pathways and all the components present in the cellular environment. Make sure that time of detection is optimized and the samples are prepared immediately. Inappropriate time point of the detection 10 Green signal may quench if concentration of product becomes too high (due to long exposure to the inducer). Otherwise, oxidized product may eventually leak out of the cells when left for a prolonged period. Problem Potential Cause Suggestion Stressed (overcrowded) cells Prepare new cell culture for the experiment. Make sure that the cells are in the log growth phase. Band pass filters are too narrow or not optimal for fluorescent probes. High fluorescent background Wash step is necessary. Follow the procedures provided in this manual, making optional wash steps mandatory. Inappropriate time point for detection Make sure that time of detection is optimized and the samples are prepared immediately. Inappropriate cell conditions Inappropriate inhibitor concentration (too low or too high) No decrease in the fluorescent signal after using a specific inhibitor Use correct filter for each fluorophore. Check Methods and Procedures section of this manual and Appendix A for the recommendations. Inappropriate time point for detection Make sure that you have viable cells at the beginning of the experiment, and that the inducer treatment does not kill the cells during the time frame of the experiment . Very low doses of inhibitor may not affect ROS production by inducer. Alternatively, very high doses of the inhibitors may cause oxidative stress itself and generate fluorescent signal. Optimize the concentration of the inhibitor and pretreatment time for each particular cell line. When cells are kept too long with the inhibitors or at very high inducer concentrations, after a certain time, the inhibitor becomes insufficient. Make sure that time of detection is optimized. Use correct filter for excitation and emission. Check Methods and Procedures section of this manual Inappropriate filter set on the and Appendix A for the recommicroscope mendations. 11 www.enzolifesciences.com Enabling Discovery in Life Science® NORTH/SOUTH AMERICA GERMANY UK & IRELAND ENZO LIFE SCIENCES INTERNATIONAL, INC. 5120 Butler Pike Plymouth Meeting, PA 19462-1202 USA T 1-800-942-0430/(610) 941-0430 F (610) 941-9252 E [email protected] ENZO LIFE SCIENCES GMBH Marie-Curie-Strasse 8 DE-79539 Lörrach Germany T +49/0 7621 5500 526 Toll Free 0800 664 9518 F +49/0 7621 5500 527 E [email protected] www.enzolifesciences.com ENZO LIFE SCIENCES (UK) LTD. Palatine House Matford Court Exeter EX2 8NL UK T 0845 601 1488 (UK customers) T +44/0 1392 825900 (from overseas) F +44/0 1392 825910 E [email protected] www.enzolifesciences.com www.enzolifesciences.com SWITZERLAND & REST OF EUROPE BENELUX FRANCE ENZO LIFE SCIENCES AG Industriestrasse 17, Postfach CH-4415 Lausen Switzerland T +41/0 61 926 89 89 F +41/0 61 926 89 79 E [email protected] www.enzolifesciences.com ENZO LIFE SCIENCES BVBA Melkerijweg 3 BE-2240 Zandhoven Belgium T +32/0 3 466 04 20 F +32/0 3 466 04 29 E [email protected] www.enzolifesciences.com ENZO LIFE SCIENCES c/o Covalab s.a.s. 13, Avenue Albert Einstein FR -69100 Villeurbanne France T +33 472 440 655 F +33 437 484 239 E [email protected] www.enzolifesciences.com