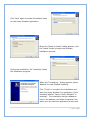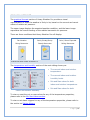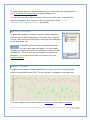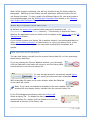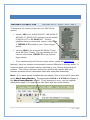
1
La Crosse Technology ® Heavy Weather Pro Software User’s Guide (for 2800 series weather stations with USB connectivity; includes C86234) Revision: 1.54, Rev 3 CONTENTS Overview ....................................................................................................................................................................6 Getting Started ........................................................................................................................................................6 Licensing ................................................................................................................................................................6 System Requirements .......................................................................................................................................7 Set up Your Weather Station Hardware .....................................................................................................8 Download the Software ....................................................................................................................................8 Installation.................................................................................................................................................................9 Install the Heavy Weather Pro Software ...................................................................................................9 Install the USB Communication Device....................................................................................................11 Synchronizing .........................................................................................................................................................11 What is synchronizing? ...................................................................................................................................11 Synchronization checklist ..............................................................................................................................12 Put the Heavy Weather Pro software in Synchronize Mode .............................................................12 Synchronize During (or immediately after) Installation ................................................................12 Synchronize Any Time (after installation of the software) ...........................................................13 Put the Weather Station in Synchronize Mode ......................................................................................14 If Synchronization is Not Successful .........................................................................................................15 Repeat the Synchronization Process .....................................................................................................15 HI SPEED SYNCHRONIZATION ....................................................................................................................16 Enable hi speed synchronization ............................................................................................................16 Operation .................................................................................................................................................................17 Main window .......................................................................................................................................................17 Menu ......................................................................................................................................................................18 File .....................................................................................................................................................................19 Page| 2 Edit.....................................................................................................................................................................19 View ...................................................................................................................................................................20 Extras ................................................................................................................................................................20 Help ...................................................................................................................................................................21 Options .................................................................................................................................................................21 Set Alarms ...........................................................................................................................................................24 Min Max Values ..................................................................................................................................................25 Graphical Forecast ............................................................................................................................................26 Temperature and Humidity ...........................................................................................................................26 Dewpoint Temperature ...................................................................................................................................27 What is the “dewpoint”? ............................................................................................................................27 Relationship between dewpoint, temperature and relative humidity.......................................27 How does the dewpoint affect me? .......................................................................................................27 Min and max dewpoint ...............................................................................................................................27 Windchill ...............................................................................................................................................................28 What is wind chill? .......................................................................................................................................28 How does wind chill affect me?...............................................................................................................28 Relative (air) Pressure ....................................................................................................................................28 What is relative pressure? ........................................................................................................................28 Air pressure and weather forecasting ..................................................................................................28 Relative Pressure Alarm.............................................................................................................................29 Rain ........................................................................................................................................................................29 Last hour .........................................................................................................................................................30 Last 24 Hours.................................................................................................................................................30 Last week ........................................................................................................................................................31 Last month ......................................................................................................................................................31 Page| 3 Total ..................................................................................................................................................................31 Wind Speed and Direction .............................................................................................................................32 Current Wind Speed ....................................................................................................................................32 Wind Direction History Indicators ..........................................................................................................32 Gust ...................................................................................................................................................................32 Max ....................................................................................................................................................................33 Alarm ................................................................................................................................................................33 Graphs and Trends ...............................................................................................................................................33 Overview ..............................................................................................................................................................33 The History file ..............................................................................................................................................33 What is a Template? ...................................................................................................................................34 What is a Graph? ..........................................................................................................................................34 Main window .......................................................................................................................................................36 The File Management window......................................................................................................................37 History tab ......................................................................................................................................................37 template tab ...................................................................................................................................................37 Graph tab ........................................................................................................................................................37 Work with History Data and Files ...............................................................................................................38 View History Data records ........................................................................................................................38 Work With Template Files..............................................................................................................................39 The Template Properties Window ..........................................................................................................39 Save a Template as a Graph ........................................................................................................................42 Work with Graphs and Templates ..............................................................................................................43 Open a Graph ................................................................................................................................................43 Identify The Graph Type............................................................................................................................43 Move the Graph (Chart) ............................................................................................................................43 Page| 4 Zoom In ...........................................................................................................................................................43 Zoom Out ........................................................................................................................................................44 Troubleshooting / FAQ ........................................................................................................................................44 Heavy Weather Pro loses connection with my weather station overnight. ................................44 How Do I Export Data From Heavy Weather? .......................................................................................44 The Wind, Outdoor Temp, Dewpoint and Windchill are Blank.........................................................45 Heavy weather pro does not reconnect to the weather station......................................................45 Why do I see big spikes in the wind or rain data?...............................................................................46 I have lost connection with my external rain and/or wind sensor(s). .........................................46 Uninstall Heavy Weather ...............................................................................................................................46 Heavy Weather Pro WS2800 Series Software Release Notes (Upgrades) ..................................................................47 Version 1.54 and 1.54b Release Date: April, 2011, Rev 2 ...................................................47 Appendix A: Verify your Display Firmware Version .................................................................................................50 Appendix B: Weather Station Restarts .......................................................................................................................50 Appendix C: Windows Power Management (for More Frequent Data) ............................................53 Reducing Power Management Settings ..................................................................................................................54 Appendix D: Third Party Alternatives ............................................................. Error! Bookmark not defined. Page| 5 OVERVIEW Welcome to Heavy Weather Pro, the display and management software application designed for use with your La Crosse® Technology 2800 series or C86234 wireless personal weather station. Heavy Weather Pro enables you to use a PC to monitor and record weather data received from your La Crosse® Technology wireless weather station, via a proprietary USB device (stick) that we provide with your weather station. You can monitor and record a variety of data collected by your weather station including both indoor and external values sampled by the various weather station sensors. You can also review weather history data, and analyze trends and tendencies over time using the software's charts and graphing features. GETTING STARTED Let’s go over the things needed to install the Heavy Weather Pro software application on your PC. LICENSING H eavy Weather Pro software is licensed to you free of charge with the qualifying purchase of a La Crosse® Technology 2800 Series or C86234 weather station (hardware). You may install the software on one PC. The same owner may install one additional copy on one notebook*. Reasonable backups of the software can be made for disaster recovery purposes. If you transfer the hardware to a new owner, any included CD must be transferred. You must uninstall the software, safely destroying, to the reasonable extent possible, related backup media. *Display synchronization is limited to one display synchronized with one USB stick. Moving the history.dat file is your responsibility (the path in Options must be correct to add more data). Page| 6 Legal Notices Copyright 2009-2015 © La Crosse Technology USA - All rights reserved. We reserve the right to delete or change any image whether or not uploaded onto the La Crosse Technology server by a user of the Heavy Weather software products. The Heavy Weather software products are protected by copyright laws and international copyright treaties and well as other intellectual property laws and treaties. The Heavy Weather software products are licensed for use with the La Crosse Technology® wireless weather station only. The Heavy Weather software products may not be separated for use on any other product not authorized by La Crosse Technology®. La Crosse Technology® may provide you with support services related to the Heavy Weather software products. All title and copyrights in and to the Heavy Weather software products (including but not limited to any images, photographs, animations, video, audio, music and text incorporated into the Heavy Weather software products), the accompanying printed materials, and any copies of the Heavy Weather software products are owned by La Crosse Technology® or its suppliers. You may not copy the printed materials accompanying the Heavy Weather software products. These statements are a summarized version of the license. If you have further questions, please contact La Crosse Technology® Customer Support at 1-888-2111923. SYSTEM REQUIREMENTS To use the Heavy Weather Pro software, the minimum requirements for your PC are as follows: Supported Operating Systems (desktop Intel®/AMD® versions only*): • Windows 10 (64/32-bit) • Windows 8.1/Update 1 (64/32-bit – general release) • Windows 7/SP1 (64/32-bit) *excludes Windows CE, Starter or other “small” editions or server versions • Internet service is required to download the software and manuals. download to USB stick to transfer to preferred PC. You may Page| 7 SET UP YOUR WEATHER STATION HARDWARE Before installing the Heavy Weather Pro software on your computer, you need to complete the setup of your La Crosse Technology® wireless weather station. If you have not already setup your weather station, please take the time to do so before continuing with the installation of the Heavy Weather Pro software application. For detailed instructions on hardware setup, please refer to the Quick Setup Manual provided with the weather station, or the weather station Operations Manual which is available online at http://www.lacrossetechnology.com/alerts/pws. If the weather station and all sensors are working properly, the weather station should display values in all of the various data fields, as shown. If your weather station is showing values like these, it is receiving data from the sensors and is ready to connect to the Heavy Weather Pro software on your PC. DOWNLOAD THE SOFTWARE If you have not already done so, or do not have the latest version of the Heavy Weather Pro software application, you may download it free. Please read the posted release notes (or consult Appendix A) to select the correct Heavy Weather Pro version for your 2800 series display. To download the Heavy Weather Pro software, go to http://www.lacrossetechnology.com/alerts/pws/software . Save the installation file to your computer (and make a note regarding where you save it – you’ll need this later). Note: If you do not have internet access where you will install the software, you will need to download the software in another location and save it to CD or flash drive, or contact Technical Support. Page| 8 INSTALLATION Let’s double check that you are ready to install the Heavy Weather Pro software. At this point, you should have: • The weather station set up and receiving data from the display and external sensors. • Verified that your computer meets the minimum system requirements. • Downloaded or acquired the latest Heavy Weather Pro software application. If you have met these requirements, you are ready to install the software. There are two parts to installing the Heavy Weather Pro software: • Install the Heavy Weather Pro software application. • Install or connect the USB communication device to the PC. INSTALL THE HEAVY WEATHER PRO SOFTWARE Locate the Heavy Weather Pro installation file (downloaded earlier). It is typically named setup_hw_wv5.exe. Double click the exe file to start the installation process. When the dialog window appears, click ‘Next’. Click “Next” again to accept the default location for installation. Note: If you are running a previous 2300 or 3600 series weather station, install this software to a different location to avoid device conflict. To change the installation directory, just change the destination folder name. Page| 9 Click ‘Next’ again to accept the default name for the Heavy Weather application. When the ‘Ready to Install’ dialog appears, click the ‘Install’ button to begin the software installation process. During the installation, the ‘Installing’ shows the installation progress. When the ‘Completing…’ dialog appears, Heavy Weather Pro has finished installing. Click “Finish” to complete the installation and start the Heavy Weather Pro application (if the checkbox labeled “Launch Heavy Weather” is selected). The installation has also added an icon to the desktop, and under Programs from which you can start the application at any time. P a g e | 10 INSTALL THE USB COMMUNICATION DEVICE To install the USB communication device, simply plug it into any available USB port on the computer where you have installed the Heavy Weather Pro software application. The USB device is self-registering; it will install the driver. Once the Heavy Weather Pro software is installed and synchronized, it will automatically connect to the USB device. For best performance, we recommend you connect the USB device to a USB port directly on your computer. An externally powered USB hub can be used. Using a non-powered USB hub or extension cable increases the chance for interruptions between the USB communication device and your computer. Where obstructions are an issue (e.g. avoid placing the desk surface between the display and the usb device), a good quality 6ft USB extension cable can be used if it is directly connected to either a powered hub or a port on the computer itself. SYNCHRONIZING WHAT IS SYNCHRONIZING? Synchronizing is the process of telling the weather station and the Heavy Weather software how to talk to each other. The weather station and the USB communication device first go through an identification process. During this process, the weather station will send out a signal identifying itself with a special identification code. The USB device also sends out a signal with an identification code. When the two devices locate each other, they store the ID code of the other device, so they can ‘lock onto’ each other. This allows the weather station and the software (through the USB device) to connect and communicate again, should they ever lose connection with each other. Once they are locked onto each other, they won’t interfere with another weather station that may be nearby (this keeps the neighbors happy). P a g e | 11 Note: Two displays, each in sync to a USB stick, can experience a cross-over data effect if placed too close to each other (e.g. same room or part of the house) because there is a secondary check for “anyone out there”. Thus, we limit support to a single PC synchronized to a single USB stick. SYNCHRONIZATION CHECKLIST Before you synchronize the Heavy Weather Pro software with your La Crosse Technology® weather station, make sure that all of the components are ready. 1. The weather station is set up and receiving data. IF YOU HAVE NOT YET INSTALLED AND CONFIGURED THE WEATHER STATION, please refer to the installation and setup documentation for your weather station before continuing with the synchronization. 2. The USB communication device is installed properly. IF YOU HAVE NOT YET INSTALLED THE USB COMMUNICATION DEVICE, please refer to the section on installing the USB communication device and do that before continuing. 3. The Heavy Weather Pro software is installed. IF YOU HAVE NOT YET INSTALLED THE HEAVY WEATHER PRO SOFTWARE, please refer to the section on installing Heavy Weather before continuing. If the things listed above are complete, you may begin the synchronization of your weather station with your computer (USB device)! To do this, you need to: 1. Put the weather station into Synchronize mode. 2. Put the software into Synchronize mode. PUT THE HEAVY WEATHER PRO SOFTWARE IN SYNCHRONIZE MODE SYNCHRONIZE DURING (OR IMMEDIATELY AFTER) INSTALLATION If you begin the synchronization process directly from the installation, you will see a dialog on your computer like the one below. P a g e | 12 If you see this dialog, skip to the section on Put the Weather Station in Synchronize Mode. SYNCHRONIZE ANY TIME (AFTER INSTALLATION OF THE SOFTWARE) If for any reason the weather station and USB communication device/software lose connection with each other (e.g. when you replace the batteries, shut down of the computer, etc), or if you are setting up the Heavy Weather Pro software for the first time and fail to synchronize, you can always resynchronize. To start the resynchronization process manually: • Locate the menu bar at the top of the Heavy Weather Pro software application. • Click the “Extras” menu choice. • Select “Resynchronize”. When you click the Resynchronize menu option, the Synchronize dialog will appear. DON’T CLICK THE SYNCHRONIZE BUTTON YET! Both the software and the weather station must be in synch mode at the same time for the synchronization to be successful. In synchronize mode, each piece looks for the other for 30 seconds. Place the weather station approximately 3 to 6 feet from the USB communications device (attached to your computer at this point). Note: The software will refer to this as the ‘USB-Stick’. P a g e | 13 Synchronization needing 2 or 3 tries is not atypical. If you do not succeed in 5 tries, reboot your PC and try again (or consult Trouble-shooting the Installation in Appendix A). With the synchronize dialog displayed on your computer, continue to the section titled Putting the Weather Station in Synchronize Mode. PUT THE WEATHER STATION IN SYNCHRONIZE MODE QUICK INSTRUCTIONS On the weather station, press and hold the button showing a down arrow until the weather station beeps (approximately 3-4 seconds). Next click the synchronize button on the software (the ‘Synchronize’ message box should still be displayed on your computer) and the weather station will attempt to synchronize to your PC. Within a minute or two, data from the weather station will display on the Current Weather tab on your computer. DETAILED INSTRUCTIONS To tell the weather station to communicate with the software, press and hold the button showing a down arrow until the weather station beeps (approximately 3-4 seconds). When you hear the beep, this indicates that the weather station is now searching for the USB communication device. While the weather station searches for a USB communication device, it will display ‘SCn-PC’ next to the time. The weather station should now be in scan mode. Now on your computer, click the Synchronize button. P a g e | 14 When the weather it will beep and the lower line (unless The software will weather data from station finds the USB device, display will show ‘PC’ in the the date is being displayed). then update with the current the display. This indicates that the weather station has successfully connected (“synchronized”) with the USB communications device (and the software). Note: If the date is being displayed, you will not see “PC”. Note: It can take up to 30 seconds for the synchronization to complete. Note: You may have to try the synchronization process more than once. We consider up to 5 tries acceptable. IF SYNCHRONIZATION IS NOT SUCCESSFUL If the synchronization process is not successful; you will see a message similar to the one to the right. At this point, you will need to retry the synchronization. REPEAT THE SYNCHRONIZATION PROCESS To repeat the synchronization process, you again need to put both the weather station and the software into synch mode. To do so press the down arrow on the display, then click the Synchronize button on the ‘Synchronize’ message box (on the software). Please refer to the preceding sections for details on the synchronization process. P a g e | 15 HI SPEED SYNCHRONIZATION ENABLE HI SPEED SYNCHRONIZATION Version 1.5x introduced a Hi Speed synchronization mode. Caution: Hi speed mode wears down batteries on your display much faster, and similarly consumes more power on the PC. We do not believe most users need to enable this setting. It was provided at the request of users who prefer ultra-frequent uploads. Note: This option maintains data updates to the currdat.lst file for upload purposes when the HeavyWeather application is in background mode; it does not update the Current Weather Screen or the Data tab on screen until you resume foreground mode of Heavy Weather (select the HeavyWeather window to resume foreground). To enable Hi Speed mode, in Heavy Weather Pro select the menu item Options. Use your mouse to select a checkmark in the “Keep weather station in hi-speed communication mode” dialog (example above). Select the OK button at the bottom of this window to transfer the new instructions to your weather station’s display. Please refer to the preceding sections for details on the synchronization process. P a g e | 16 OPERATION This section covers the operation of your Heavy Weather Pro software application. Note: In this document, we will not address the operation of your weather station, except where it pertains to the Heavy Weather Pro software application. For more information regarding the operation of your La Crosse Technology® weather station, please refer to the documentation provided for your specific model. MAIN WINDOW The main window of Heavy Weather Pro is where you can review all of the weather attributes reported from your weather station (see next page for illustration). The left side of the main window is referred to as the File Management window. We talk more about this in the section on Graphs since that is where it is mainly used. The right side of the main window is a tabbed dialog, which means it can display several windows at once, with each window distinguished by a tab at the top. When you look at Current Weather, this window will show all of the weather properties collected from the internal and external sensors. Current data is sent at approximately 13 second intervals from the thermo-hygro sensor to the usb stick. Current data is not saved in the HeavyWeather Pro software. The Data tab displays the contents of history.dat in report form. This data is sent to the usb stick and is saved to disk in accordance with the recording interval selected by the user (see the Weather Station settings section for details). The default interval is 2 hours. It is this history data which you can export. This section will talk about those properties in detail. P a g e | 17 Menus Temp and Humidity Graphical Forecast Wind Speed and Direction Dewpoint Relative Pressure Wind Chill Rain Totals File Management Window Current Weather, Chart, or Data Window MENU There are several menu options available from the Heavy Weather Pro main window. This section briefly describes the functions accessible through these menu options. P a g e | 18 FILE New Template: create a new template file. Open: Open an existing saved template or graph file. Save as Graph: Save the current data set as a Graph file. Export as text: Export the history records as a commadelimited text file (for import into a spreadsheet application – you must be on the Data tab page to export your history.dat records). Print: To print a current Graph (Note: you must be on the appropriate tab to print). Exit: Close the Heavy Weather Pro application. EDIT Delete Datasets: This allows you to delete one or more records from a dataset. To delete a record: • make sure you have the Current Weather window displayed. • Then Select the Data tab in the lower left corner of the Weather/Data window. By default the Data tab will open the current history.dat file which is actively receiving data from the weather sensors. If you wish to edit a different history file, then you need to open the History tab in the File Management window. The history records for that history file will be displayed in the Data window. Select the row(s) you wish to delete and click ‘Delete datasets…’. Warning: Double check that you are on the correct history.dat file before you begin deleting any data. We recommend that you maintain a saved copy of the history.dat file at all times (standard backup procedure). Note: You can also delete records from a history file by selecting them and hitting the Delete key on your keyboard. P a g e | 19 Properties: This option allows you to set/alter all properties of your template. For details see the Working with Template Files section. To view the properties of a template, you must select and open the template, then click Properties. Note: If a graph is displayed, you can view its properties but they cannot be changed. A graph is a permanent file saved of the data points. If the properties of a graph need to be changed, update the source template and re-save the graph. VIEW Show Current Weather: Show or hide the Current Weather window. History Files: show or hide the History tab in the file management window. Template Files: Show or hide the Template tab in the file management window. Graph Files: Show or hide Graph tab/windows in the file management window. Show Data ToolTips If you select this option, whenever the mouse pointer passes over a graph line, a small pop-up window will display information about the data points including corresponding date, time, subject and value. EXTRAS Options This is the general setting for the display of the language, unit measure and date format on ALL template(s)/graph(s). Once it is selected, it would affect all opened template(s)/graph(s). See the Options Window section for more details on available selections from this window. Resynchronize This allows you to initiate the synchronize process P a g e | 20 between the weather station and the USB communications device. Please refer to the section on Synchronizing for more details. HELP Help: Open the Help Document* http://www.heavyweather.info Visit the Heavy Weather Homepage: About Heavy Weather: Display copyright and version of the Heavy Weather Pro application. OPTIONS From the Options window, you can configure all of the various Heavy Weather Pro application settings. GENERAL SETTINGS Language: This option sets the language for all windows and dialogs within Heavy Weather Pro. If you select a new language, the application must be restarted. Show Help as ToolTips: Check this box to enable tooltip help wherever it is available. Recording History File: This is the path to the history data storage file. You can change the location and name of the history data file here. If you change the filename, a new history data file is created at the next interval (see Recording Interval). P a g e | 21 New: This button will create a new history file. The new history file will be placed in the location specified in the Recording History File textbox. Example: If a file named history.dat (the default history file) already exists, the new file is created with the name history1.dat. If history1.dat already exists, the new file is named history2.dat and so on. Creating a new history file will cause all current data to be written to this new filename. If you plan to track and store data, we recommend that you use a filename other than “history” or “weather”. Typically, file names must start with a letter and not have spaces in them to work properly with other programs. Note: You can also create a new history file by using the application menu options. Go to Extras, Options, and click the square button at the end of Recording History file. Type a new filename and click ok. WEATHER STATION SETTINGS Several of the weather station’s properties can be configured from the software. These properties are listed under the Weather Station Settings section of the Options window. When these properties are changed and the Ok button is pressed, the Heavy Weather Pro application will transfer those settings to the weather station (if the weather station and computer are synchronized and currently connected via the USB communications device). Time: Select either a 12 or 24 hour format for the time displayed on the weather station. Recording Interval: This option allows you to control how often Heavy Weather Pro will sample and store the data reported by the weather station. Note: Rain amounts are a combination of stored data and accumulation counters (see the Rain section). Wind Speed: Select the format in which the wind speed is displayed on the weather station (m/s (meters per second), knots, bft (beaufort), km/h (kilometers per hour), and mph (miles per hour)). P a g e | 22 Temperature: Select the format in which the temperature displays on the weather station [°C (Centigrade) or °F (Fahrenheit)]. Air Pressure: Select the format in which the Air Pressure displays on the weather station [hpa (hectopascal) or inhg (inches of mercury)]. Rain: Select the format in which the rain displays on the weather station (mm millimeter or inch). PC SOFTWARE UNITS Note: While this section contains the same settings, each is specific to how HeavyWeather Pro displays your data. Date: This option specifies the format of the date when viewing the history records in the Data window (see Working with History files). Time: Select either 12 or 24 hour format for the time displayed in the history.dat data file. You will see this when viewing the history data records in the Data window (see Working with History files). Temperature: Select the unit of measure used when displaying temperature in the Heavy Weather Pro application (°C or °F). Air Pressure: Select the unit of measure for displaying air pressure in the Heavy Weather Pro application (hpa or inhg). Wind speed: Select the wind speed measurement unit for display in the Heavy Weather Pro application (m/s, knots, bft, km/h, and mph). Rain: Select the format in which the rain displays in the Heavy Weather Pro application (mm or inch). P a g e | 23 DIRECTORIES History Files Directory: This is the path where the history data file will be written. The path for the history data file can also be modified through the Recording History File setting. (~\My Documents\HeavyWeather\History by default) Template Files Directory: Represents the path where template files are stored. The default is ~\My Documents\HeavyWeather\Templates. Graph Files Directory: This is the path where the graph files are stored. (~\My Documents\HeavyWeather\Graphs by default) Note: We recommend that the directories be kept on the C:\ drive. SET ALARMS Your weather station offers the ability to set alarm values for many of the monitored properties. Heavy Weather Pro allows you to configure these alarms right from your computer. These alarm settings transferred to the weather station. To set an alarm, locate the icon that looks like an alarm clock next to the value you wish to set an alarm for. Note that there is both a high and low alarm value for most of the properties, and be sure to choose the one correct one (or both) for your needs. Note: Wind Direction and Wind Gust provide a single alarm value. Double click the alarm clock icon and the alarm configure window for that property will appear. Move the slider control up to increase the alarm trigger value, and down to decrease the trigger value. Click the “Active” checkbox to enable the alarm, click the Ok button, and you’re all set! The alarm icon will appear green to indicate that it is active. P a g e | 24 When the temperature reaches the trigger value that you have set, the weather station will beep and the alarm icon will flash red (on screen) to alert you that an alarm has been activated. Note: You can silence the beep by pressing the Alarm button on the weather station, but you need to remove the Active check mark in the Alarm configuration window in HeavyWeather Pro to de-activate the alarm entirely. Reminder: Make sure to select the “Active” checkbox before clicking Save. MIN MAX VALUES The weather station can also store data regarding the minimum and maximum values for several properties. The actual min and max values are displayed in the main Heavy Weather Pro window, in the Current Weather tab. You can also view the date and time that these values were recorded, by viewing the details of a particular min or max value. To view the details about the min and max values for a property, first locate the property you wish to analyze, and then move your mouse cursor over that area. When you see your mouse cursor to change a hand pointer, double click, and the min max details window will appear. From here you can review the details regarding the min and max values for the property, and also reset the min and max if you wish. Note: In many cases, when you Reset the Min/Max values, the values go to zero briefly then quickly refill with the current data as the initial new Mon/Max values. P a g e | 25 GRAPHICAL FORECAST The graphical forecast section of Heavy Weather Pro provides a visual representation of what the weather is likely to be, based on the current and recent values of relative air pressure. The upper image displays the expected weather condition, and the lower image represents the recent trending of the relative barometric air pressure. There are three conditions that Heavy Weather Pro will display: Fair Weather Partly Cloudy/Sunny Rain / Storm Expected Rising Barometer Steady Barometer Falling Barometer TEMPERATURE AND HUMIDITY The temperature and humidity section of the main dialog shows you: • The current indoor and outdoor temperature. • The current indoor and outdoor humidity levels. • Min and Max values for both indoor and outdoor temperature. • Min and Max values for both indoor and outdoor humidity. To view or reset the min or max values for any of the temperature properties, please refer to the Min Max Values section. To view or set alarm triggers for any of the temperature properties, please refer to the section on Setting Alarms. P a g e | 26 DEWPOINT TEMPERATURE WHAT IS THE “DEWPOINT”? The dewpoint is the water-to-air saturation temperature below which moisture in the air condenses into water. We refer to the condensed water as dew, therefore the temperature at which the “dew” forms is the dewpoint. RELATIONSHIP BETWEEN DEWPOINT, TEMPERATURE AND RELATIVE HUMIDITY When the dewpoint is equal to the current temp, that is a relative humidity of 100%. The air is then completely saturated with water vapor. When the dew point remains constant and the temperature increases, relative humidity will decrease. As the air temp goes down, the dewpoint tends to follow. A low dew point can go along with a high temperature only at extremely low relative humidity. HOW DOES THE DEWPOINT AFFECT ME? We tend to be more uncomfortable as the dew point increases. Dew point is considered a more reliable indicator of discomfort than humidity. At a Dew point of 70 oF, we begin to perspire and produce sweat to cool down. High humidity (and therefore a high dewpoint), prevent the evaporation of sweat and reduces the body’s ability to cool itself, so we feel hot and uncomfortable. We can also feel uncomfortable when dealing with low dew points, as we will perceive readings below 49 oF as dry. MIN AND MAX DEWPOINT The minimum and maximum dew points are recorded and displayed in the Dewpoint section of the Heavy Weather Pro application. To view or reset the min and max dewpoint values, see the section on Min Max Values. P a g e | 27 WINDCHILL WHAT IS WIND CHILL? Wind Chill is what temperature our skin experiences when the actual air temperature is adjusted for wind speed. Note: Wind Chill measurement methods vary over time. The 2800 series weather station uses the “original” wind chill calculation rather than the 2001 “North American” formula because the original formula is international. HOW DOES WIND CHILL AFFECT ME? Our bodies lose heat more quickly at faster wind speeds; thus we feel colder. The body’s response is to try to maintain surface (skin) temperature. In certain conditions, wind combined with cold temperatures can cause the skin’s temperature to decrease, and at around 32 oF can cause frostbite (freezing skin can cause serious harm). Note: Monitoring Wind Chill is an important safety factor in colder seasons. RELATIVE (AIR) PRESSURE WHAT IS RELATIVE PRESSURE? Relative (also referred to as atmospheric) pressure is defined as the weight of air pressing on the surface of the Earth. Relative pressure is adjusted by altitude; thus each locale as a different “normal” range. Air pressure decreases with increasing elevation. Our bodies, and other natural phenomenon, may experience physical changes as the air pressure rises or falls (e.g. ears, sinuses, joints, breathing). AIR PRESSURE AND WEATHER FORECASTING Air pressure is commonly used for weather prediction: • high relative pressure indicates fair weather • low pressure tells us that rain or storms are more likely. P a g e | 28 When used in combination with wind observations, reasonably accurate short term forecasts can be made. Each geographic area has its own ‘normal’ range of air pressure values. You can obtain the current reading from your local weather reporting station (e.g. the airport). You can calibrate the weather display to the reporting station (see Operations Manual for accessing the SET menu). When calibrated, the relative increase and decrease in air pressure values will correlate reasonably with your local media reports. Remember that any hardware factory reset will require the weather display to be re-calibrated. Typically with personal weather forecasting, we focus on the change in air pressure over time. The larger the change in pressure, especially if more than 0.10 inHg (3.5 hPa), the larger the change in weather can be expected. If the pressure drop is rapid, it indicates that a low pressure system is approaching, and there is a greater chance of rain. Rapid pressure rises are associated with improving weather conditions, such as clearing skies. RELATIVE PRESSURE ALARM You can configure an alarm to sound when the relative pressure goes above or below a certain point. For more details on how to set an alarm, see the section on Setting Alarms. RAIN The entire lower portion of the main Heavy Weather Pro screen is devoted to rainfall. This section will talk about each value and what they represent. Note: A brand new display needs to run for a week before the transfer of rain volume for Last Week and Last Month settle in appropriately. Any variance will straighten out in the next cycle as these values are not kept in history.dat. Your Total is not affected. P a g e | 29 LAST HOUR The last hour rain gauge represents the amount of rainfall reported by the weather station’s external rain sensor in the last or previous 60 minutes. You cannot reset this value. You can clear the Max (or maximum) stored value for this entry by placing the mouse cursor over the Last Hour section and double clicking in the Max space. The Last Hour details dialog will appear showing the maximum amount of rain collected in an hour over time, as well as the date and time that the maximum observation hour occurred. To reset the last hour amount Max and begin again at zero, click the Reset button. LAST 24 HOURS The last hour rain gauge represents the amount of rainfall reported by the weather station’s external rain sensor in the last 24 hours. You cannot reset this value. You can clear the Max (or maximum) stored value for this, value by placing the mouse cursor over the Last 24 Hour section and double clicking. The Last Hour details dialog will appear showing the maximum amount of rain collected for 24 hours over time, as well as the date and time that the 24 hour observation period occurred. To reset the last 24 hour Max amount and begin again at zero, click the Reset button. You can also set an alarm value, to warn when the 24 hour rain total surpasses a set amount. To read more information regarding how to access and configure the Last 24 hour alarm, see the Setting Alarms section of this document. P a g e | 30 LAST WEEK The Last Week rainfall total represents the amount of rain that was collected from Monday 12:00 AM to Sunday 11:59 PM OF THE PREVIOUS WEEK. The Last Week value will update each Monday at 12:00 AM to reflect the last full week’s total. Monday is the start date for international and business planning calendars. Example: If today is Wednesday, rainfall that occurs today will not be included in the Last Week value until Monday at 12:00 AM. Note: This value will be 0.00 until the week change interval occurs. If the initial period is less than a week, data may be uneven the first week. Data will even out in the weeks following. LAST MONTH The Last Month rainfall total represents the amount of rain that was collected from 12:00 AM of the first day of the month to 11:59 PM of the last day of the OF THE PREVIOUS CALENDAR MONTH. The Last Month value will update on the first day of the month 12:00 AM to reflect the last calendar month’s total. Example: If today is the 15th of September, rainfall that occurs today will not be included in the Last Month value until 12:00 AM on the first day of October. Note: This value will be 0.00 until the month change interval occurs (1st). TOTAL The total rainfall measurement is a stored value that continues to increment until it is reset. If you reset any Max rainfall measurements, the total will not be reset. Note: If you desire to reset Total rainfall (possible only on the display), we recommend you factory reset the display and create a new history.dat file so that all HeavyWeather Pro measurement values stay in alignment. The total is calculated independently of the other rainfall amounts. Due to the rounding calculations, daily, weekly and monthly totals recorded and tracked over time may be slightly different between the PC screen and the P a g e | 31 display, or across different PC screens (e.g. Current Weather versus history Data tab). WIND SPEED AND DIRECTION Wind speed and direction will display in the upper right section of the main window. CURRENT WIND SPEED The current wind speed is displayed at the top of this section (above the Beaufort scale), with the wind direction represented by a compass in the middle. The current wind direction is represented by the arrow with the red tip. Note: the Beaufort scale (bft) is the effect of wind upon water and has a high reading of 12. This will show differently than the actual wind speed reading. WIND DIRECTION HISTORY INDICATORS The compass image also displays up to five previous wind direction(s). These are displayed with arrows that have black tips. Current Wind Direction Previous Wind Directions GUST In the lower section, the Gust value displays the highest wind speed recorded in the past 20 minutes. P a g e | 32 MAX The Max value represents the highest wind speed recorded since the max value was last reset. To reset the max wind speed value, see the section on min max. ALARM To set a high wind speed or wind direction alarm, see the section on setting alarms. GRAPHS AND TRENDS Heavy Weather Pro provides the ability to analyze the weather data collected from the weather station and its sensors using graphical charts of the data. The software collects data from the weather station and stores it in a history data file (~\My Documents\HeavyWeather\History\history.dat by default). The stored data file is then used to generate different kinds of graphical reports for analysis. OVERVIEW The three main building blocks of graphical analysis in Heavy Weather Pro are the history file that stores the data records, the templates that define the properties to generate a graph and the final graph (displays on chart tab on the software screen). THE HISTORY FILE The history.dat file stores the sets of weather data (records) generated by the Heavy Weather Pro application, according to the Recording Interval selected in Options. We use this data to generate graphs over a specific period of time for analysis. History files can be renamed, to preserve specific data such as the data collected during a big storm. P a g e | 33 To write history data to a different filename, you must enter the new filename in the PC Software Settings section of Heavy Weather Pro. You can have as many different history files as you wish, but to use them for graphing purposes, they must be in the correct history folder - (~\My Documents\HeavyWeather\History\ by default). WHAT IS A TEMPLATE? To generate a graph you need to specify certain properties such as type of data (temperature, humidity, etc), duration of time, color and axis of the graph, minimum and maximum of the axis value, etc. A template defines these properties and allows you use them again and again. You can create and save an unlimited number of templates to suit your own applications. There is only one prerequisite to creating a template - you must have at least one history file in the history directory. WHAT IS A GRAPH? A graph is the resulting image created when we plot out and connect the data points in a particular history file. In the software, it displays on the chart tab. To create a graph, you must first select a history file and create a template. P a g e | 34 Since the graph may change if you modify the template or change the history file, you should click the “Save as Graph” menu selection, or the Save icon on the toolbar if you want to keep a permanent copy of the current data. Save your graphs with meaningful names, to avoid confusion later. You can save multiple graphs and retrieve them to view or print at later time. The graphs that you saved in the default graph directory will show up in the file management window, when the Graph tab is selected. You can load one of these graphs by double clicking the graph name. P a g e | 35 MAIN WINDOW There are two parts of the main window: File Management Current Graph (Chart) or History Data On the left is the file management section, which allows you to select and show the history, template or graph files. On the right is the chart \ data window, which shows you the current graph or history data (depending on the tab selected). P a g e | 36 THE FILE MANAGEMENT WINDOW HISTORY TAB When the History tab is selected, it shows all history files located in the history folder (~\My Documents\HeavyWeather\History\ by default). You can select the current history file, or one that was previously saved to the history folder. For more details on using history files, see the Working with History files section. TEMPLATE TAB If the Template tab is selected, you will see a list of the templates that have been saved. These file are stored in the template folder, which is ~\My Documents\HeavyWeather\Templates by default. You can select an existing template by double clicking it. This will generate a graph in the Chart/Data window using the chosen template’s settings with the data in the currently selected history file. For more detailed information on creating and using templates, see the Working with Template files section. GRAPH TAB If the Graph tab is selected you will see all of the saved graphs in the (~\My Documents\HeavyWeather\Graphs by default). To view a saved graph, double click the name and the saved data plot will appear in the Chart/Data window. When a graph has been selected, the Data window will show the history data used to generate the selected graph. P a g e | 37 Note: While a graph is selected, you will only be able to see the history data for that graph. Switching to the History tab and selecting a different history file will not change the data. To view a graph of a different history file, you must create a new template/graph (see the Working with Template Files section or the Working with Graphs and Template Files section for more details. WORK WITH HISTORY DATA AND FILES By default, the history file is named history.dat and is located in the ~\My Documents\HeavyWeather\History\directory. This directory is where the Heavy Weather Pro application looks for history files to display in the History tab of the File Management window. If you choose to save your history file to another location, we recommend that you either set the History directory to that location, or copy your history file(s) to the default directory so that they can be used when working with templates and graphs. VIEW HISTORY DATA RECORDS You can view history records from the current history data file, or from previously saved history data files. If you are viewing the Current Weather window, you can simply click the Data tab in the lower left corner to see the history data records stored in the current history file. To view the data stored in a previously saved history file, you must first select and open a template file. With a template file open in the main window, select the Data tab in the lower left corner. Note: If you have not selected a template in the main window, the Data window will only display history records from the current history file. In the File Management window, select the History tab. Select a history file. To display the data records in the selected history file, double click the filename or click the checkmark at the top of the History tab. P a g e | 38 The Data window will display the data records for the selected history file. WORK WITH TEMPLATE FILES Template files define the properties needed to construct a graph from a selected history data file and it’s data records (see What is a Template? for details). A sample template is provided for you, and is named Demo Template.hwt. This template gives you an idea of what a typical graph/chart template will contain. To create a new template, click the File menu dropdown and select New Template. The template properties window will appear. From this window you can configure the various properties of your new template. THE TEMPLATE PROPERTIES WINDOW This is where we can choose what data will appear on the template, the color and style of the data lines, font and title of the chart/graph and other properties. GENERAL PROPERTIES Title: This is the name that is displayed at the top of the Chart/Data window when this template is being viewed. This does not rename the template file itself, only changes the title that appears at the top of the window. Font: Select this to change the font of the axis labels. Background Color: Select the color of the data chart background behind the data lines. P a g e | 39 Grid: Choose whether or not to show the gridlines in the chart. GRAPH PROPERTIES These properties allow us to choose what types of weather data (Temperature, Humidity, etc) will be displayed by this template. Left and Right Axis Data type: You can have two vertical axis on a chart. Use this dropdown to select the type of weather data that will display from the left or right side of the template. Customize line color for each value by selecting the color dropdown. Min and Max: Use the Min and Max checkboxes if you want to limit the data set to records within a specific range. Indoor, Outdoor, Dewpoint and Windchill: For some data types, you can choose to display more or less details. The details available will change depending on the data type selected. DATA PROPERTIES These properties allow us to choose the specific data records that will display for the weather data selected in the graph properties. Type: Use this dropdown to select the time period over which the chosen weather data will be displayed. An example - if you had selected Indoor Temperature in the Graph properties, here you could choose Current Day for the time period. Only the Indoor Temperature records from the current day will be displayed on the template. Selected Period, Start and End: These fields are provided to give you a better idea of the time period you have selected. P a g e | 40 The Selected Period shows a graphical representation of when the time period occurs. The start and end date and time display the exact range of the data record set that will be used in the template. If you choose a User Defined period type, these fields can be used to set the properties of the time period. Data Interval: The Data Interval setting allows you to define how close together the data points are represented on the chart. A shorter interval will place more data points in the chart, and will give a more detailed graph line. Break Graph Interval (BGI): This Break Graph Interval (BGI) property places a space, or break, of the selected time amount between the chosen data intervals. This can help define the data intervals, and make them easier to distinguish from each other. The BGI can be defined as this: if the gap between two consecutive data points is as big as, or bigger than the chosen BGI, then the data points will not be connected by a line. An example - if you have a recording interval of 1 minute, and have recorded data for a full 2 days, then the weather station did not record any data on day 3 (perhaps the batteries were dead, etc). Once you replace the batteries, the data is recorded for another full day on day 4. There is one day of data missing on day 3. If you generate a chart showing the data from all four days with NO BREAK GRAPH INTERVAL, there will be a straight line connecting the last data point on day 2 (when the recording stopped) to the first data point on day 4 when the data recording started again. If we enable the BGI, a space will appear on the chart to represent the missing data. Minutes: The ‘minutes’ field can only be modified if you choose a Data Interval of User Defined. In this case, you can specify how many minutes apart you wish to place the data points. The chart can only be as precise as the original recording interval. When you are using a pre-defined interval (any interval other than User Defined), the minutes field will be read only and display the chosen interval in minutes. STATUS The status section of the Properties window tells us if the data type and intervals we have chosen are valid. If we have selected to display a data type or a time period that is not available in our data records, the status line will turn red to indicate that the data cannot be displayed. If our selections are valid, the status text will be green. P a g e | 41 SAVE A TEMPLATE AS A GRAPH To display weather data in a chart of graph format, we first need to select the history data and create a template. If you have not yet done this, please refer to the sections on Working with History Files and Working with Templates. You can also choose to use the demo template to get some practice working with graphs. Once we have selected a history file and created a template, a data chart or graph is generated and displayed in the Chart/Data window. At this point however, the chart is still considered a template and the properties can be modified as needed. Save button Still a template… We may want to save a permanent copy of this chart for later use. When we save a template as a permanent copy, it is then referred to as a Graph. To create a graph, click the Save button (or the Save as Graph menu selection) while a template displayed in the chart/graph window. A new tab will appear next to the template tab displaying the graph created from the template. This is the permanent copy of the template, now referred to as a graph. New Graph Tab Graph Files P a g e | 42 The File Management window also switched to the Graph tab, and displays the new graph file. WORK WITH GRAPHS AND TEMPLATES Now that we know how to create templates and graphs, let’s go over some of the things you can do with the data that is displayed in our Chart window. OPEN A GRAPH To open a graph, select the Graph tab in the File Management window and double the filename. You can have several graphs and templates open at one time, and each will have a tab across the top of the Chart window to identify it. IDENTIFY THE GRAPH TYPE Notice that template tabs and graph tabs each have their own unique icon to identify what type of graph (chart) they represent. MOVE THE GRAPH (CHART) You can slide the template or graph around in the chart window. To do this, click and hold the right mouse button anywhere on the chart window. With the right mouse still held down, move the mouse and the chart will move with it. ZOOM IN To zoom in, move the mouse to a point on the chart that is above and to the left of the area you want to zoom in on. Press and hold the left mouse button and move the mouse down and to the right, drawing a blue box around the data you want to zoom in on. Here is our area of interest, zoomed in. P a g e | 43 When you release the mouse button, the chart will redraw the area you drew a box around at a zoom level that fills the chart window with your data. ZOOM OUT To zoom back out, press and hold the left mouse button anywhere on the chart window and with the mouse button still pressed, move the mouse up and to the left. The size of the box you draw does not matter when zooming out, you will always zoom out the original size of the template or graph. TROUBLESHOOTING / FAQ HEAVY WEATHER PRO LOSES CONNECTION WITH MY WEATHER STATION OVERNIGHT. Many computers temporarily disable or “put to sleep” some of their hardware if they sit idle for awhile. This includes USB ports, which Heavy Weather Pro (via the USB communication device) uses to talk to your weather station. If Heavy Weather Pro loses contact with the USB device, it will be necessary to re-synchronize the weather station and USB device. To re-synch, please refer to the section on synchronization. If this remains a continuing issue, try our Power Management recommendations (see Appendix C). HOW DO I EXPORT DATA FROM HEAVY WEATHER? To export history data, first select the history tab in the File Management window. Then select the file you wish to export, and click the menu option Export as text. Choose a location to export the data file, and click Ok. Heavy Weather Pro will create a comma-delimited text file at the chosen location. In Heavy Weather Pro, double-click the history file name that you wish to export, from the left hand column. (If you do not have a list in the left, click View, History Files). P a g e | 44 Go to FILE and select EXPORT AS TEXT. Create a file name in the pop up box. Please note the location of this file. Ex. C:\Program Files\HeavyWeather\January. To import into Excel (exact steps vary by Excel version): Open Excel. Select File, Open. When the open box appears, on the bottom under FILES OF TYPE select TEXT FILES. On the top where it says LOOK IN, select the file location. Ex. C:\Program Files\HeavyWeather With the Heavy Weather folder open, you should see the text file you just created (January). Select that file and a 3-step Wizard will appear. On the first screen choose DELIMITED. Then select ‘Next’. On the second screen under Delimiters select SEMICOLON. Click ‘Next’, and the last box will appear. No need to change anything unless you would like the date formatted differently. Click finish. Your data should appear in Excel. You may need to adjust the cell width. THE WIND, OUTDOOR TEMP, DEWPOINT AND WINDCHILL ARE BLANK When the Wind, Outdoor temperature, dewpoint and windchill show no data, it is likely that the weather station has lost communication with its external sensors. Check the weather station to see if these properties are displaying no data there also. If so, it may correct itself within a few minutes, because the weather station will periodically attempt to re-connect to the external sensors. If the weather station does not reconnect to the sensors within 15 to 30 minutes, please refer to the user’s guide for your weather station for instructions regarding manually reconnecting the weather station to its sensors (initiate the re-learn process on the weather station (press and hold the up ^ arrow until the weather station beeps). HEAVY WEATHER PRO DOES NOT RECONNECT TO THE WEATHER STATION If for some reason the weather station loses connection with its external sensors, it will try to automatically reconnect to them (usually within a few minutes). During the time when the weather station is not connected to the sensors, the various data sections on Heavy Weather will also blank out, or display dashes (---). P a g e | 45 If the weather station is now reconnected to the sensors, but the Heavy Weather Pro software is still not registering the data, it may be necessary to resynchronize the USB device with the weather station. Please refer to the section on Synchronizing for detailed instructions. WHY DO I SEE BIG SPIKES IN THE WIND OR RAIN DATA? This is typically due to loss of connection to the weather station or the external sensors while the Heavy Weather Pro software is running. I HAVE LOST CONNECTION WITH MY EXTERNAL RAIN AND/OR WIND SENSOR(S). RAIN SENSOR If the connection to the rain sensor has been lost, it may be due to low batteries. Please replace the batteries in your rain sensor and initiate the re-learn process on the weather station (press and hold the up ^ arrow until the weather station beeps). WIND SENSOR If the connection to the wind sensor has been lost, it may be due to a lack of direct sunlight. The wind sensor relies on sunlight to keep its solar cells charged. If the sensor has not been exposed to sunlight for more than three days, this may have caused it to lose connection with the weather station. Once the wind sensor has been exposed to sunlight, either by moving it unto direct sunlight or placing it under a bright lamp, it should reconnect to the weather station. If it does not reconnect on its own, initiate the re-learn process on the weather station (press and hold the up ^ arrow until the weather station beeps). UNINSTALL HEAVY WEATHER To uninstall the Heavy Weather Pro software application, go to Start, All Programs, Heavy Weather and click the Uninstall link. P a g e | 46 HEAVY WEATHER PRO WS2800 SERIES SOFTWARE RELEASE NOTES (UPGRADES) VERSION 1.54 AND 1.54B RELEASE DATE: APRIL, 2011, REV 2 To determine the correct version for your 2800 Series system: • Version 1.54 is for all WS-2815U-IT, WS-2814U-IT, WS-2813-IT, WS-2812-IT and some recent models of WS-2811-IT or WS-2810-2-IT. The key identifier that you require this version is the Model # TX59UN-1-IT printed on your Thermo-Hygro sensor. • Version 1.54b is for all series WS-2810U-IT and some WS-2811-IT sets. The key identifier for this version is the Model #TX59U-IT on the ThermoHygro sensor. • If you cannot access the Thermo-Hygro sensor, please see Appendix A. Basically, there is a modest communication protocol difference in the two series. It is best to match your software version download to your Thermo-Hygro sensor’s protocol. This version resolves a few known conflicts with specific anti-virus software products and an intermittent issue with some data downloads. Note: If you have already installed the new release, click on the small ? menu and select About HeavyWeather. The appropriate V1.5.4 or V.1.5.4b will display in the About HeavyWeather window. If you download in error, use the upgrade instructions (page 2) to replace your first effort with the correct version. P a g e | 47 System Requirements • • • • Windows 10 (64/32-bit) Windows 8.1/Update 1 (64/32-bit) Windows 7/SP1 (32-bit or 64-bit) Administrative rights sufficient to install software; please consult your system administrator if you do not have the appropriate rights. First-Time Installation If this is a first time installation, please download the correct software version and simply install it. All installation instructions are on the screen. Upgrade Installation Do This First: • • Close the existing application. Unplug the USB stick from the computer. Note: If you changed Options settings (e.g. location of history.dat), review your current entries in the menu item Extras|Options. You may need to reset any selections you made after upgrade. P a g e | 48 Install the Upgrade: • Go to this link for the new software: http://www.lacrossetechnology.com/alerts/pws/software. The web site will offer the choice to RUN or SAVE the download. If you choose the RUN, follow all directions on the screen. Some users must choose SAVE (e.g. downloading from a different PC). Save it to your hard or flash drive in a location you will remember. If you download, then you must double click on the saved file to initiate installation. • After installation, select the small ? and About HeavyWeather to doublecheck the version installed is appropriate to your Thermo-Hygro sensor (see top of Page 1 for details). Note: Replace any previous preferences in the Extras/Options menu as shown on page 2. This is especially important if you used a different path or file name for the History File. • Re-insert the USB Stick. It will prompt you to re-synchronize with the 2800 Series display. What you may experience: o It may take several tries to resynchronize the USB stick. If you fail after about 5 tries, then go to Trouble-Shooting step 1 which recommends a reboot of the PC to clear the system file memories. o It may also be normal to have a one-time delay before the Data tab shows your latest downloads. In most cases, this may be a modest 15-30 minutes, but it could be up to 90 minutes depending on your PC. No data is lost – so please wait patiently. Trouble-Shooting the Installation 1. If you have any difficulties, reboot your PC and try the specific task again which caused difficulty the first time (e.g. re-synchronize the USB stick). It is not uncommon to experience synchronization issues upon upgrade, especially with PCs you have owned awhile. The reboot resets the operating system so that fewer processing steps are needed for a smooth synchronization. 2. If the reboot still fails to resolve your upgrade issues, proceed as follows: • Use the Uninstall Instructions (below) P a g e | 49 • • • Reboot your PC. Perform the Install the Upgrade steps (above) again. Reboot the PC again to synchronize the USB stick. Uninstall Instructions If for any reason, you no longer need a software version installed, using the menu item select Start|Programs|HeavyWeather|Uninstall HeavyWeather Pro WS 2800 and remove the previous version. APPENDIX A: VERIFY YOUR DISPLAY FIRMWARE VERSION Warning: If performed on a running system, the result will require resychronization with the outdoor sensors (see Note). New users can easily verify the firmware version. If batteries are inserted into the display (or pulled and re-inserted), the first 3 digits that display in the lower left-hand corner are the firmware version. If the ThermoHygro is not available, then select your software version as follows: Software Version Firmware Versions 1.54 333 or 332 1.54b 288, 262, or 222 Note: To resynchronize the outdoor data, bring the display within 5-6 feet of the Thermo-Hygro sensor and press the up arrow key on the display. Wait for the outdoor data to fill on the display. If this fails, see Appendix B. APPENDIX B: WEATHER STATION RESTARTS Batteries remain the #1 warranty issue we see. We advise the use of batteries dated 6 or more years in advance of the current year. Good name brand batteries make less noise, which reduces the chance of RF interference from the battery compartment. If you have a voltmeter that reads numerically, a minimum voltage of 1.48V for each battery is necessary for proper performance. Batteries dated earlier than 6 years from now may still work, but may be unstable in performance. P a g e | 50 TRY THIS FIRST, QUICK RESTART: • Remove batteries from the thermo-hygro, wait 2 minutes, • Bring the thermo-hygro and the display to 5-6’ distance (ensuring distance can still reach the wind and rain sensors). • Put batteries into the thermo-hygro, wait 2 minutes. • Hold the up-arrow on the display until it beeps, wait 3-5 minutes. Flashing icon should go solid and temp should appear by the end of the 5 minute wait. If a particular sensor doesn’t restart, bring it near the thermo-hygro and try again: • • • • Wind: Cover the solar panel of the Wind sensor for 15 seconds so no light reaches the solar panel. Then gently press the reset button on the bottom of the Wind sensor. This should ensure the wind sensor is turned off. Next gently press the reset button on the bottom of the Wind sensor, with the solar panel exposed to light to ensure it is turned on. Rain: Remove the batteries from the Rain sensor for 2 minutes. Next: Replace the batteries in the thermo-hygro sensor, wait 2 minutes. Then: Hold the up-arrow on the display until it beeps, wait 3-5 minutes. Flashing icon should go solid and temp should appear by the end of the 5 minute wait. Reminder: the Rain and the Wind sensors need to be in line-of-sight of the Thermohygro sensor without obstructions for best operation. If the quick restart fails, use the full FACTORY RESTART: NOTE: Ensure the Wind sensor was in the full sun or under a lamp for 24-hours before setting up to be sure it is charged. It can take several tries to get the Wind and the Rain to connect. Allow the sensors to operate in line-of sight of each other for 2 minutes before powering up the display. A Factory Reset will erase the connection between the Display and the Thermohygro sensor and allow a fresh connection to be re-established. It is recommended to have the display and all sensors 5-10 feet apart with nothing in between for this restart. ENTER PROGRAM MENU: Press and hold the SET button until you enter the program menu. Press and release the SET button until you see 'rES oFF' flashing. P a g e | 51 FACTORY RESET ON: Use the ▲UP ARROW key or ▼DOWN ARROW key to turn rES on. CONFIRM & COUNTDOWN: Press the SET key to confirm and a countdown timer will begin counting down from 127. When the timer displays dOnE, you must remove the batteries from the display for 15 minutes. At the same time remove batteries from the Rain and TH sensors so all three units are without batteries for 15 minutes. REMOVE BATTERIES FROM THERMOHYGRO AND RAIN: While the batteries are out of the display, also remove the batteries from the Thermo-hygro sensor and the Rain sensor (as noted above). Wait 15 minutes. GENTLY PRESS THE RESET BUTTON ON THE WIND SENSOR: Cover the solar panel of the Wind sensor for 15 seconds and while covered, gently press the reset button on the bottom of the Wind sensor. This should assure the wind sensor is turned off. POWER UP: RESTART THE WIND SENSOR: Gently press the reset button on the bottom of the Wind sensor one time with the solar panel exposed to light in order to activate the sensor. INSTALL BATTERIES INTO THERMOHYGO AND RAIN: Insert the batteries into the Rain and Thermohygro sensor make sure to check polarity with the markings on the battery cover and inside the battery compartment. ALLOW THE SENSORS TO RUN FOR TWO MINUTES. INSTALL BATTERIES INTO DISPLAY: After the sensors have been running for 2 minutes, insert the batteries into the Display. Make sure to check polarity with the markings inside the battery compartment. Watch the lower left corner of the display on start up and record the firmware version of this display (a 3 digit number). 15 MINUTES: Wait 15 minutes for the outdoor weather data to display. If the outdoor data displays dashes, after waiting for 15 minutes, repeat the restart. Do not press buttons at this time. Note: Brief hardware restart information is provided for your convenience. Please consult your weather station Operations Manual for details. P a g e | 52 APPENDIX C: WINDOWS POWER MANAGEMENT (FOR MORE FREQUENT DATA) All recent versions of Windows (Windows 7, 8.1, or 10) restrict access to the computer when low usage is detected to preserve the hardware components and be more energy efficient overall. Windows calls this Power Management. WARNING: Smaller units such as consumer quality notebooks, netbooks, tablets etc., are not appropriate for power management reductions and those with limited battery life are not even appropriate for weather stations. The “always on” condition of reduced power management ages the computer hardware faster and can expose it to more risk of disruption from electric events. La Crosse Technology is not responsible for any damage or consequences to your PC. We provide this summary as a convenience. You are responsible to know if you have the skills to proceed and you are responsible for the outcome. Suggested Alternative: Dedicate an older desktop PC to this function. Review of Safety Equipment: Please consult a qualified PC technician if you need assistance with these preventive precautions. • • • • • • All PC equipment needs, at minimum, a good quality surge suppressor. Limit unattended update processes on battery-powered units to use when the a/c adapter is connected. USB ports that are hard to reach may benefit from bringing the USB connection device to the desktop. Weather station communication needs to be root-hub accessible, though, so use only a powered USB hub or a singleport good-quality USB extension cable. (Note: Unpowered multi-port USB hubs tend to be less reliable for a weather station’s higher data communication frequency.) Thus far, all of our USB connections are Standard-A type. USB also has length limits on USB extension reliability. The USB 2.0 specifications limit recommended total extension length to 16 feet (from the computer port). USB ports must be “matched” as to communication speed type. Since USB speeds are backwards-compatible, buying USB 2.0 components is recommended. (Note: We have seen compatibility issues with some of the recent USB 3.0/2.0 ports. We are not responsible if your hardware will not support backwards-compatibility to USB 1.1.) P a g e | 53 REDUCING POWER MANAGEMENT SETTINGS Tip: The run or command line options can quickly locate control panel’s power management by typing powercfg.cpl. Alternatively, Windows Logo+X brings up a system menu to select Power Options. Windows 10: Go to Start|Settings|System|Power & sleep. Make the same changes as for Windows 8.1. Windows 8.1/Update 1: Place your cursor in the lower left corner of the screen until you see the left side menu appear. Slide the mouse up to the Settings icon (like a gear). Under the Settings menu panel, select Control Panel. Select System and Security. Select Power Options Select “Change plan settings” on the High Performance plan. Verify the following: • • In “Put the computer to sleep”, select “Never”. In the “Change Advanced Power Settings” link under USB Settings, the value for USB Selective Suspend should read “Disabled”. Select “Save changes” (if edited entry) and “Cancel” to close. Close the Power Options window. Windows 7: Go to Start|Control Panel|System and Security|Power Options. In the “Preferred Plans” section, select High Performance. Notice the warning that this plan will increase performance at the price of energy savings. Next select “Change Plan Settings”. Verify the following: • • The value for “Put the computer to sleep” should read “Never”. In “Change Advanced Power Settings”, under USB Settings, the value for USB Selective Suspend should read “Disabled”. Select “Save changes” (if edited entry) and “Cancel” to close. Close the Power Options window. Note: If desired, you can name this Power scheme in the top box, using “Save As” to preserve it with a name you will remember. P a g e | 54 APPENDIX D: THIRD PARTY ALTERNATIVES CAUTION: La Crosse Technology neither tests, endorses, nor supports any third party alternative. Information is merely provided for the convenience of those who express intent to upload their personal data to public sites. Most solutions read the currdat.lst file from Heavy Weather Pro, which means similar Windows system requirements apply. Any charges are your expense. Weather Underground see http://home.comcast.net/~wuhu_software/ Weather Display See http://www.weather-display.com/supported.php All Windows: If you download the latest HeavyWeather Pro software version, an icon for currdat.lst is installed. Right click on the icon and select Properties. On the Shortcut tab, look in the Target item where the path for currdat.lst is. Carefully, copy and paste this information to any configuration screen needed. By default this location is the root of: C:\ProgramData, but this is a hidden folder. Note: We are not aware of any functioning alternatives on Mac. A few individuals claim success with Parallels, which runs Windows in a virtual machine. If you seek support from a vendor, the configuration issue is HID support for the USB stick enabled. P a g e | 55