1
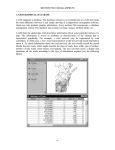
1
La Londe Les Maures 2007
Agent based Models for Spatial Systems in Social Sciences &
Economic Science with Heterogeneous Interacting Agents
Map Comparison Kit – Workshop Day 1
The purpose of this document is to guide you through the use of the Map Comparison
Kit. After following the instructions and doing the exercises, you will be introduced to
all steps required to use the software on your own data.
Getting started
If you download the Map Comparison Kit and follow the installation instructions, you
will find the Map Comparison Kit in the following directory:
c:\program files\geonamica\map comparison kit 3
Besides the program executable MCK.exe there are some dll’s which are used by the
MCK. Also there will be a pdf-file containing the User Manual.
Furthermore there is a new directory in the following directory:
My Documents/Geonamica/MCK
In this folder you will find a directory with Example files and a directory with
Palettes that can be used by the MCK.
Start the MCK either by clicking the MCK.exe icon or look up the shortcut in the
Start menu, where it is found in the Geonamica.
Selecting maps
On opening, the MCK asks for a log file to open. Select the demo.log from the
Example directory.
Open the Edit – Edit log dialog to see what information is contained in the log file.
You can also use the
icon to open this dialog.
Click the
icon in the toolbar to display both map1 and map2.
and the
Resize the maps using the zoom in
, zoom out
, zoom rectangle
and
zoom full extent
buttons on the toolbar, resize the windows to your liking. Notice
2
that it is possible to close the legend and the overview bar (and recall them using the
View- Legend bar and View - Overview bar .
in the task bar to select the first and the
Use the two envelopes
second map. In this example there are only two maps, so the choice is easily made.
Alternatively you can use the Options – Map 1 and Option – Map 2 commands from
the main menu.
In the main menu try the different possibilities for Options – Mask.
Performing a comparison
Now we will perform a comparison. Open the Comparison Algorithm dialogue, by
using the
icon in the toolbar or the Options – Comparison Algorithm command
from the menu.
Note that the comparisons are arranged in groups. The maps we are considering are of
a categorical nature and we want to compare them. Thus, we select a comparison from
the first group.
The methods that have been discussed in the presentation are:
• Per category
• Kappa
• Fuzzy Kappa
• Moving Window based Structure
We will first do a Per category comparison, so select this option from the list.
Next consider the settings for this comparison and open the Algorithm Settings
dialog; Use the
icon in the toolbar or the Options - Algorithm Settings from the
menu to call the dialog. For this comparison method we need to select which category
to consider and we can select for instance the category ‘River’.
To view the results click the result map
icon or Options –Result Map and the
result statistics Options – Result Statistics (
).
Verify that the results are as expected.
Now it is possible to change parameter settings, choose an alternative for map 1 or
map 2 or the mask settings and immediately see the effects on the results. Try and see
if the results are as expected.
Exporting results
Result maps can be exported using the File –Export command. Save a result map to
the examples directory, you can choose between Idrisi and ArcAscii format. Also it is
possible to use the Per category comparison in such a way that the result map just
3
delineates the ‘river’ locations in one map (by comparing two maps that are identical).
For later use, generate two maps delineating the river in both maps. (river_map1.rst
and river_map2.rst in the Examples/demo folder)
The MCK features clipboard support: Press <control-c> in the Result Statistics
window to copy the contents to your clipboard. Now open a text editor (e.g. Notepad)
and paste the context of the clipboard into it.
Press <control-c> in the Result Map window to copy an image of the map to the
clipboard. Now open an image program (e.g. Paint) and paste the contents into it.
Alternatively it is possible to right-click a map and select copy from the context menu
that appears. Likewise the legend can be copied to the clipboard by right-clicking on
the legend bar.
Editing the log-file
We will add a theme to the log file and put the two new river maps into the theme.
Select Edit – Log file… or
. Make a New Theme called RiverOnly and add the
two maps river_map1.rst and river_map2.rst to this theme. Select OK.
There will now be an additional theme in the theme selector in the toolbar and also in
the Options – Theme menu. Switch to the RiverOnly theme and take a look at the
maps.
Save the log file (File - Save as) and close it (File-close).
You will find that the default legend is ugly and not very informative.
Start the legend editor (
the legend) to fix this.
icon in the toolbar or Edit – Legends or double-click on
Note that the legend type is Categorical, we will leave it that way and work with
numerical legends later on. Double-click on a legend entry to edit the name and color
of that category in the Legend Item editor.
Open the newly generated RiverOnly.txt legend file (in the Examples/Demo/Legends
directory) in a text editor for a look behind the scenes.
Numerical legends
Open lov_demo.log. This log file consists of seven land use maps. LU1989, LU1993,
LU1996 and LU2000 are “ground truth” maps of land use for the four respective
years. The three other maps are model results of an older version of the Environment
Explorer (=LeefOmgevingsVerkenner/ LOV). Select the maps LU1989 and LU1993.
We will assess some structural changes that took place over the period 1989-1993.
For this, select the Moving Window based Structure comparison, using the
icon
in the toolbar or the Options – Comparison Algorithm command from the menu.
4
Open the Algorithm Settings dialogue and select Shannon Diversity activate Single
category and pick ‘Wonen, dun bevolkt’ (Urban, sparse) as category of interest. Also
set the radius of the moving window at 10 (cell distances) and the halving distance at
2 (cell distances).
Take a look at the Result map. The legend of this map is most likely not optimal.
Make sure the Result map is the active map and open the Legend editor.
Since the result of the comparison is a numerical map it is good to use a numerical
type legend. For numerical legends it is most often preferred to use one of the
predefined palettes from the Palette directory. One such palette can be chosen via the
palette combo box. For this example, the palette b127w127r.smp is well suited. This
name may seem odd but indicates that it contains colors that (in 127 steps) smoothly
blend from Blue to White and then (again in 127 steps) from White to Red. Select this
legend and use the Palette Start button to take a closer look in the Palette Editor.
Press Cancel to leave the palette editor again.
Now that the colors have been selected, we can look for proper lower and upper
bounds for the legend item classes. Click Choose automatically to find the maximum
and minimum value present on the map. Our legend will range between those values.
The MCK offers several methods for finding a scale, including finding the optimal
scale automatically. Press Find best scale to find the best scale according to Jenks’
Tabular Accuracy Index.
Regrettably the ‘best scale’ in this case does not match the neutral to the neutral color
(i.e. the value 0 is not colored white). It is thus helpful if we manually adjust the
legend classes upper and lower bound. To keep it workable, first reduce the number of
legend classes to five (use the Apply button for you’re the change to take effect).
Select Custom as the option for the legend scale. Now you can adjust the legend
items’ upper and lower bound in the menu that appears by double-clicking their
coloured boxes. Adjust the bounds to the effect that the neutral difference (value 0) is
in the middle.
Press OK to apply the results and see the Result Map according to the newly
generated legend. Now it should be clear which areas have become more and which
have become less diverse.
This is a good moment to experiment with the different aggregation options. Notice
that the Algorithm Settings dialogue has three parameters controlling the moving
window / aggregation. These are Halving distance, Radius, and Aggr.(test). This last
aggregates the maps before the comparison and can be used in combination with
Halving distance and Radius. A radius of 0 cells indicates that the neighbourhood of
a cell consists only of the cell itself.
Are the effects of aggregation as you would expect?
5
The comparison set manager
The comparison set manager allows storing settings and results for later reference.
To make use of it first find a directory to store all the results (My
Documents\Geonamica\MCK\temp\comparison results\). Select this directory using
the Tools – Comparison Set Manager – Preferences command.
Start the map comparison kit and open the demo.log file. Select the Per Category
method and the category open in the Algorithm Settings.
Now we will add this comparison to the Comparison Set Manager for later reference.
Click the
icon. Notice how an entry is added to the comparison set list that is
located on the left of the screen. If this list is not present in your screen then you need
to activate it using: View – Comparison set manager.
Click on the name to edit it to something more informative (e.g. Per Category Open).
Right click the name and select properties; here you can also choose the output files.
The icon left of the comparison set name is red, indicating that it has not been
calculated yet. Right click the method and choose Calculate and save. The results
will now be saved to the comparison results directory that was designated earlier,
under the name specified in the Properties dialogue.
Add the same comparison one more time (press the
icon once more).
Select the second entry and change the name to ‘per category city’. Now adjust the
.
parameter in Algorithm Settings to city and press the write over button
Open the Result map and select the first comparison set in the list to see how previous
results are loaded from disk again.
You can save the Comparison Set List to disk using Tools – Comparison set
manager – Save comparison sets to file for instance under the name my_csl.csl.
Working with masks
As you noticed in the earlier examples, the MCK uses mask to delineate the area to be
compared. For one log file you can have several masks. And on the basis of one mask
region map you can generate different masks by in- or excluding different regions.
Open the lov_demo.log log file. Under Options – Masks one of four different masks
may be selected (None, All regions, Northern Regions, Randstad). Select the different
masks to see what area they delineate.
In order to view the region file it is necessary to add a theme to the log file. Add a
theme Regions and import the map regions.img to this theme. Now you can see the
region map via the regular interface.
Choose Edit – Logfile to see that the log-file refers to a mask collection file:
6
My Documents\Examples\LOV Netherlands\LOV_Masks.msk.
Choose cancel to leave the log editor and then Edit – Mask File to see the Mask
Collection File editor.
Select one of the three masks and press the Edit button to see the particular mask
settings. Notice that each setting refers to a region map and that it contains a list of all
regions that are included. The option Merge regions determines whether the selected
regions will appear as a single region or as separate regions. Select/unselect merge
regions to see the effect. Notice that the effects are only visual, the comparison
statistics remain the same. On the other hand, if extra regions are included or some are
removed, result maps and statistics will change.
Use the new button to generate a mask setting consisting of Utrecht and Zuid-Limburg
only. That’s where the Map Comparison Kit originates!
Map comparison restrictions
In the first part of the workshop we added a second theme to the demo logfile. Now
that we have a log file consisting of two different themes, with different legends it is
worthwhile to consider map comparison restrictions. Not all map comparison methods
are suitable under all circumstances. The MCK queries the maps in order to find out if
they can be compared.
To select maps from different themes select All themes as the theme. Now select one
of the original and one of the new maps to compare amongst each other. Open the
Comparison Algorithm dialogue and you will notice that many of the comparisons
have an X mark in front of them. These cannot be applied because they require equal
legends. The only categorical map comparison method capable of comparing maps
with unequal legends is the Fuzzy Kappa. Select this comparison method and
subsequently open the Algorithm settings dialogue. The categorical similarity matrix
details how the categories in the two legends relate to each other. Use the Guess
button to match those categories that predominantly overlap.
Open (File – Open or the
icon) the log file UnequalLegendsAndResolution.log
from the Examples directory. Select the maps lovbk96u and out1996_2500m these
maps cover the same area and have the same legend but have different resolutions.
This also limits the number of comparison methods that is available. Open the
Comparison Algorithm dialog to get an overview. (Select Options-Mask-None to
correctly display the results of comparisons at multiple resolutions).
A map of an alternative legend is present in the Alterra theme, select All themes to
compare a LOV map and the Alterra map. Notice that again only the Fuzzy Kappa
comparison is available. Finally select the Alterra map (hgn1970) and the
out1996_2500m map to see that it is not possible to compare maps with different
legend and different resolution.
Close the log-file.
7
Getting in touch, staying up to date and giving feedback
If you download the map comparison kit from our website www.riks.nl/mck you will
be asked to leave your name and email address. This is not just to satisfy our curiosity
but also to be able to inform you about new releases and, importantly, bugfixes.
This website will indicate the version number which you can check with the version
number in the about box. Thus, you can make sure to always have the latest version.
Besides the software you can also download reports and documentation from this
location.
Finally, the website also has the facilities to report bugs and to do suggestions for
improved functionality.
Contact:
Alex Hagen-Zanker
Research Institute for Knowledge Systems
P.O.Box 463
6200 AL Maastricht
The Netherlands
[email protected]
8
Task 1. Spot the fifteen differences
The example Spot the fifteen differences contains an interesting case where the ‘maps’
are really pictures in a classical puzzle of spot the differences. The first picture is
spot15_a. The second picture has been distorted, spot15_b1 is the original and
spot15_b2 is the manipulated picture.
Using the MCK it is straightforward to find the differences in the original pictures, but
can you also separate the real differences from distortions in the manipulated picture?
Some differences are more pronounced than others, can you see why?
Task 2. Fuzzy differences per category
The Per category comparison crisply identifies the areas where the category has
increased or decreased presence. The Fuzzy Kappa method calculates (optionally) the
similarity per category. It does so by temporarily setting categories equal in the
similarity matrix.
Can you use the similarity matrix to get the fuzzy similarity for a single category?
Can you also make the distinction between omission and commission? And represent
both in a single map? (Tip: Check the comparison methods for numerical maps)
Does the ranking of categories change if you apply Fuzzy Kappa or Kappa? Why, or
why not?
A good example for this task is the ‘demo.log’ logfile
Task 3. The comparison set manager as batch
environment
Open the file my_csl.csl in a text editor. Get an idea of the structure of the file and try
to add two extra comparison sets to perform a Per category comparison but now for
the categories River and Park.
Open the comparison set library again in the MCK to see if your comparisons where
put in correctly.
This is also the right moment to experiment a bit with the Invalidate and Calculate
options of the MCK.
9
Task 4. Validating the land use model
The example LOV_example contains real and simulated maps for several years In On
the basis of all these maps can you make an assessment of which land use types are
best represented in the model and which ones worst?
Try taking into account the following:
- Overlap / near overlap
- Legend definitions
- Composition / quantity
- Structure
- Performance relative to a null model
What would be your priorities for improving the model?
This is a task without a definite answer. Let’s discuss!